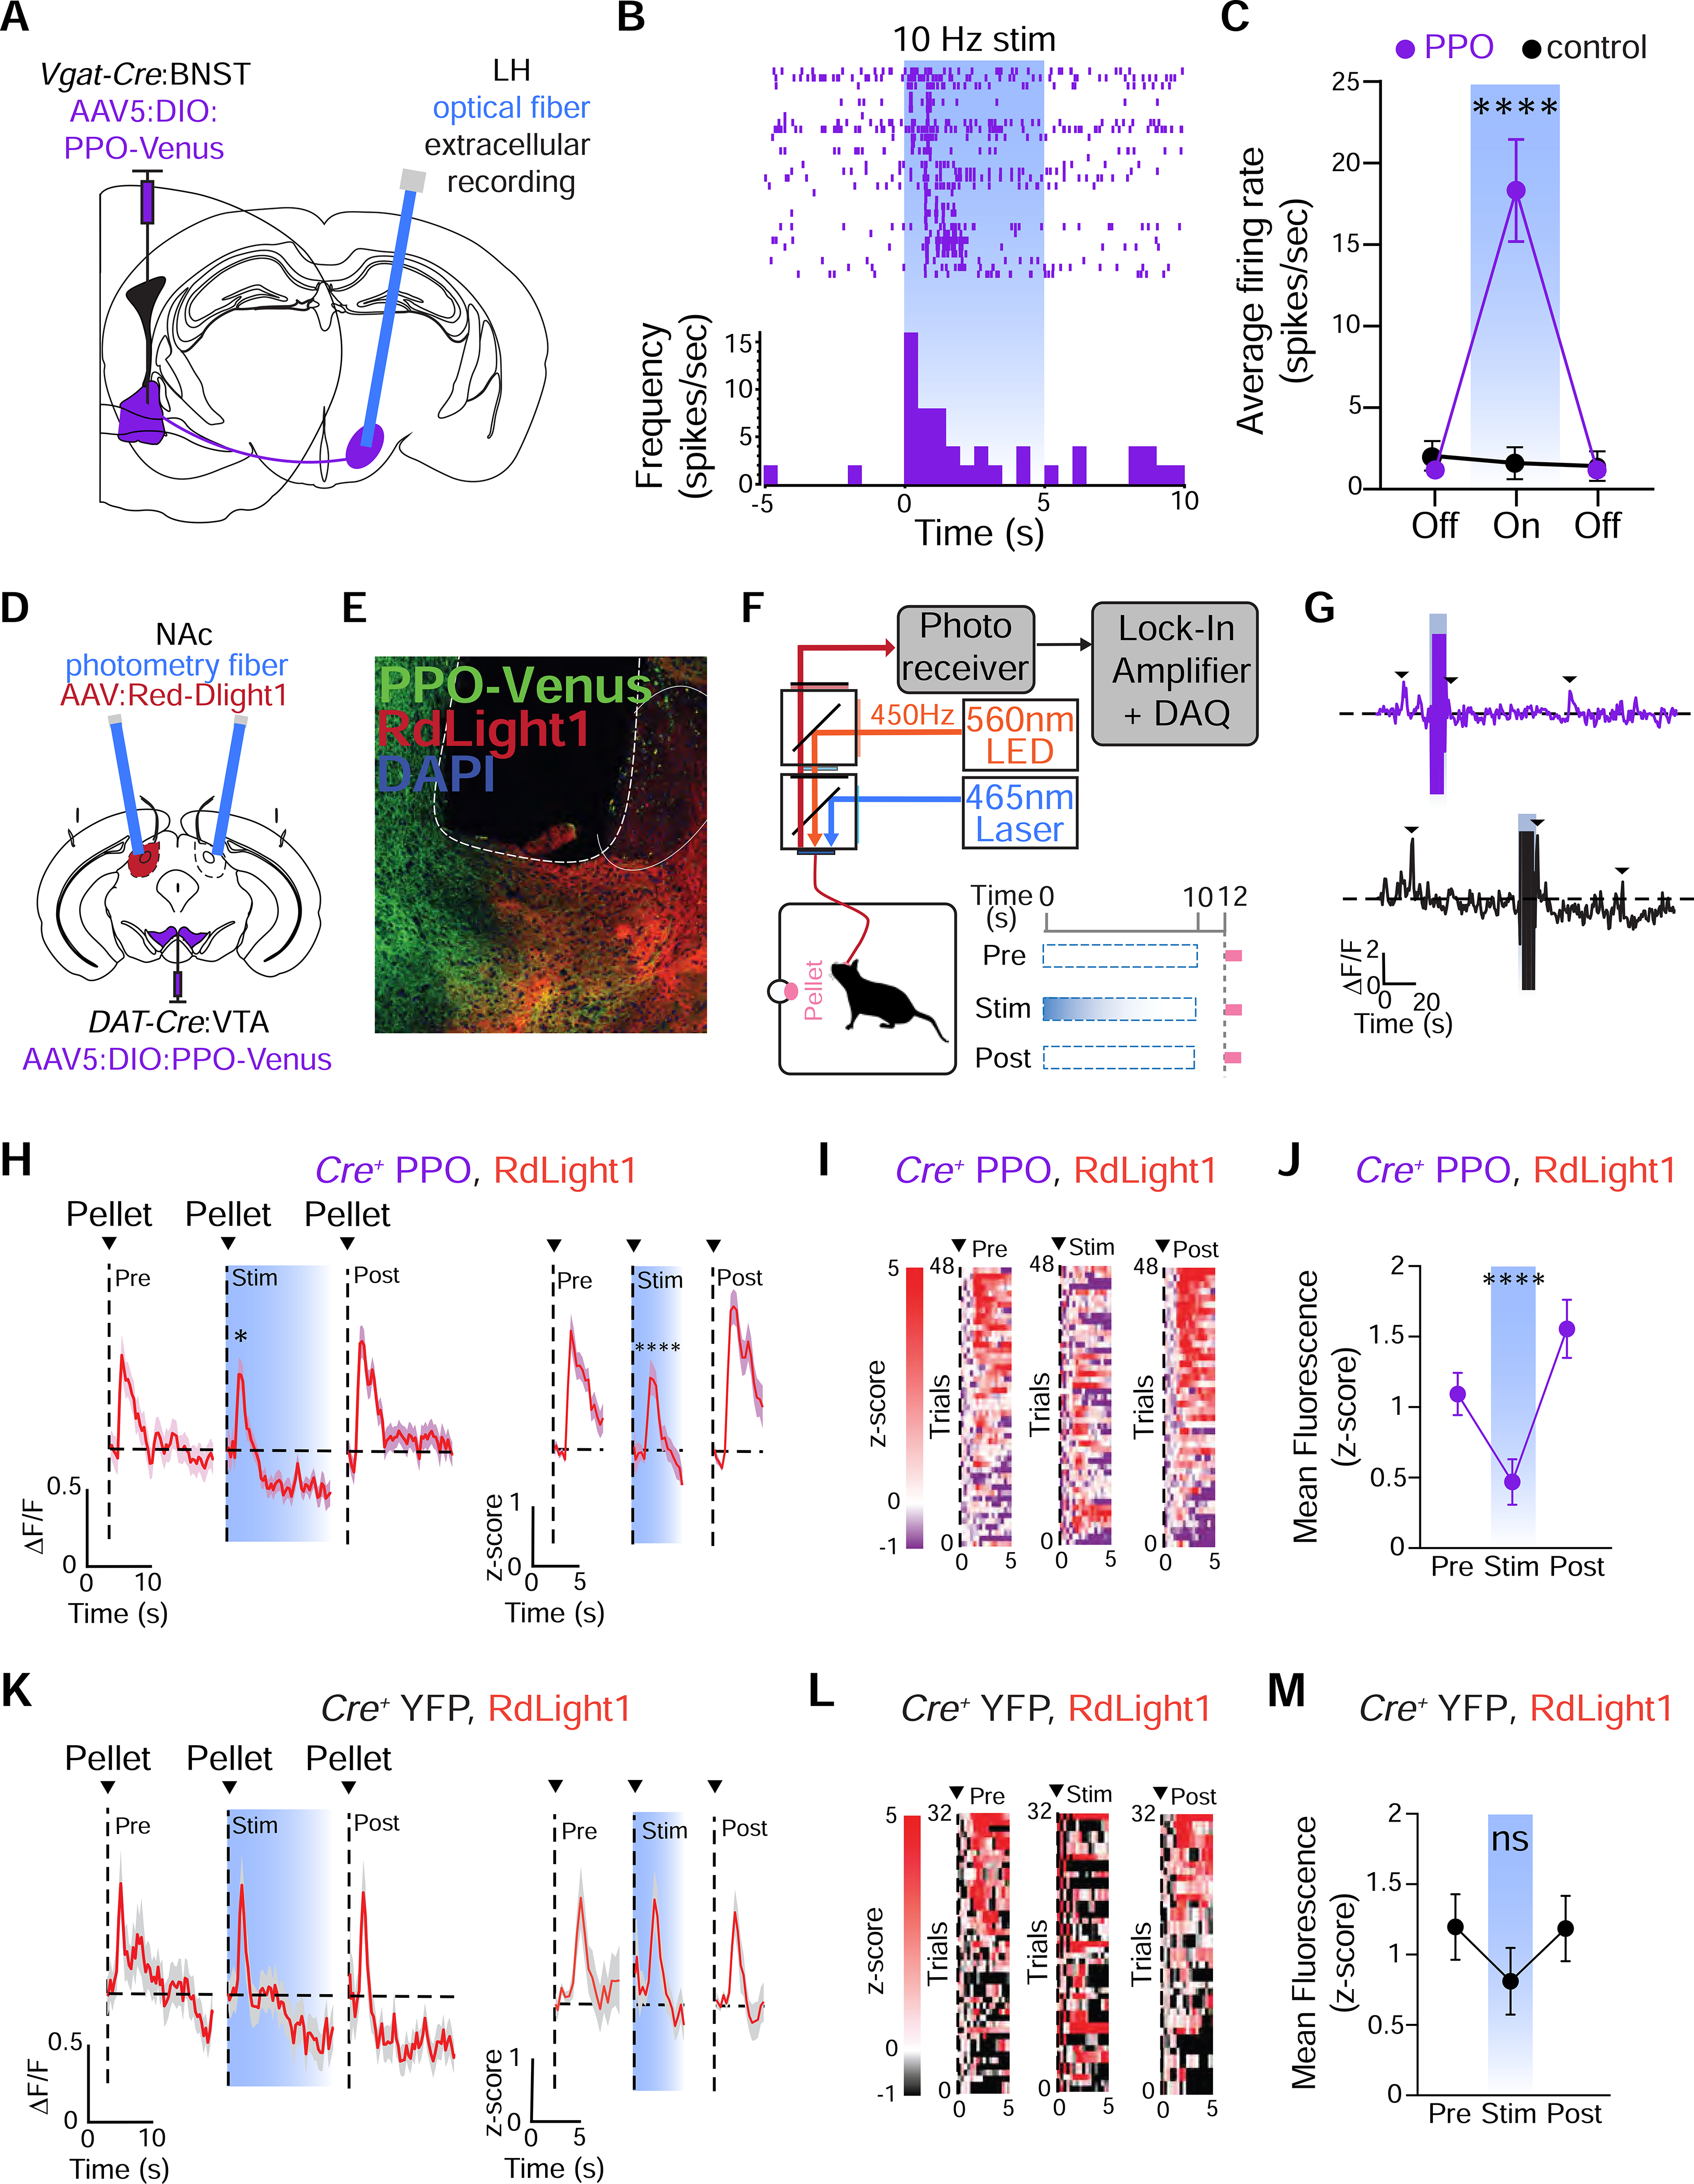
Figure 6. PPO inhibits synaptic transmission at terminals in vivo.

(A) Schematic illustrating single-unit recordings of lateral habenula (LH) neurons modulated by PPO-expressing BNST-LH terminals
(B) Raster plot from recorded LH units (top) and the peri-event histogram from a representative unit (bottom) during 5 sec of 10 Hz photoinhibition of BNST-GABA terminals expressing PPO.
(C) Average firing rate of LH units from PPO (purple) or control (black) groups; Mixed-effects 1-way ANOVA, ****p<0.0001, n=30 units from 6 mice. Firing rate in controls was unchanged; Mixed-effects 1-way ANOVA, p>0.05, n=19 units from 3 mice.
(D) Cartoon depicting injection of Cre-dependent AAV5 (Ef1α:DIO:PPO-Venus) into the VTA of DAT-Cre mice, injection of RdLight1 (AAVDJ:CAG:RdLight1) into the NAc core and fiber implants.
(E) Confocal micrograph depicting PPO-Venus (green), RdLight1 (red) and DAPI (blue) expression in the NAc core. The placement of the optical fiber is outlined. Scale=100 μm.
(F) Schematic of fiber photometry set-up and behavioral design.
(G) Representative ΔF/F traces for PPO (top) and YFP controls (bottom) showing RdLight1 activity during reward delivery (black arrows) and stimulation artifact (blue bar).
(H) RdLight1 (ΔF/F, left or z-score, right) from PPO mice during reward delivery averaged across all trials in pre (left), stim (middle) or post (right) trials. n=6 mice.
(I) Heatmap raster plot of RdLight1 fluorescence (z-score) from PPO mice during reward delivery averaged across all trials in pre (left), stim (middle) or post (right) (n=6 mice). Trials are in ascending order of activity following reward.
(J) Mean fluorescence following reward delivery (1–5s). n=6 mice; Mixed-effects one-way ANOVA, ****p<0.0001. Mult. comparisons: pre vs. stim, **p<0.01 and post vs. stim, ****p<0.0001
(K) RdLight1 (ΔF/F, left or z-score, right) from YFP mice during reward delivery averaged across all trials in pre (left), stim (middle) or post (right). n=5 mice
(L) Heatmap raster plot of RdLight1 fluorescence (z-score) from YFP controls during reward delivery averaged across all trials in pre (left), stim (middle) or post (right) (n=5 mice). Trials are in ascending order of activity following reward.
(M) Mean fluorescence following reward delivery (1–5s). n = 5 mice; Pre vs. Stim vs. Post, Mixed-effects one-way ANOVA, p>0.05, Mult. comparisons all not significant
