Abstract
Background
Early detection of SARS-CoV-2 circulation is imperative to inform local public health response. However, it has been hindered by limited access to SARS-CoV-2 diagnostic tests and testing infrastructure. In regions with limited testing capacity, routinely collected health data might be leveraged to identify geographical locales experiencing higher than expected rates of COVID-19-associated symptoms for more specific testing activities.
Methods
We developed syndromic surveillance tools to analyse aggregated health facility data on COVID-19-related indicators in seven low- and middle-income countries (LMICs), including Liberia. We used time series models to estimate the expected monthly counts and 95% prediction intervals based on 4 years of previous data. Here, we detail and provide resources for our data preparation procedures, modelling approach and data visualisation tools with application to Liberia.
Results
To demonstrate the utility of these methods, we present syndromic surveillance results for acute respiratory infections (ARI) at health facilities in Liberia during the initial months of the COVID-19 pandemic (January through August 2020). For each month, we estimated the deviation between the expected and observed number of ARI cases for 325 health facilities and 15 counties to identify potential areas of SARS-CoV-2 circulation.
Conclusions
Syndromic surveillance can be used to monitor health facility catchment areas for spikes in specific symptoms which may indicate SARS-CoV-2 circulation. The developed methods coupled with the existing infrastructure for routine health data systems can be leveraged to monitor a variety of indicators and other infectious diseases with epidemic potential.
Keywords: Syndromic surveillance, disease monitoring, COVID-19, infectious disease, time series modelling
Background
Key Messages
Routine health information systems data can be leveraged for disease monitoring and detection of emerging infectious diseases with epidemic potential.
We used time series modelling to detect health facility catchment areas experiencing higher than expected rates of COVID-19-associated symptoms, potentially indicating SARS-CoV-2 circulation.
Although syndromic surveillance cannot replace the use of SARS-CoV-2 diagnostics for direct monitoring of the disease, it can be used as a rapid, cost-effective strategy to identify local areas for more specific testing when resources are limited.
Our methods and resources were developed in open access software and can be readily applied to other regions or diseases with minimal adaptation.
Limited infrastructure and testing capacity in many low- and middle-income countries (LMICs) requires the use of novel approaches to disease monitoring.1–3 Over the past several years, many LMICs have invested in developing routine health information systems. These systems collect data on the presentation of particular symptoms, health service utilization and treatment outcomes at the patient level or aggregated at the facility level for a given time period. These data systems provide important operational support to LMIC health systems, nad recent reviews have found they have been under-used in research and intervention monitoring.4–6
Globally, the COVID-19 pandemic response has been challenged by limited information on the magnitude and spread of the virus. To that end, syndromic surveillance can be used to identify potential SARS-CoV-2 hotspots and thereby inform resource allocation, lockdown strategies and enhanced seroprevalence testing strategies. Many symptoms of COVID-19—including fever, cough, diarrhoea and difficulty breathing—are captured in existing routine health system data, making these data ideal for monitoring purposes.7 Although syndromic surveillance cannot replace direct monitoring of the disease with specific SARS-CoV-2 diagnostics, this approach can be used as a rapid, cost-effective strategy that could help identify areas for more specific testing when resources are limited. In addition, such methods can be integrated within regular monitoring activities across a variety of indicators, potentially leading to early identification of future emerging diseases.
In the early months of the COVID-19 pandemic, the Cross-Site COVID-19 Syndromic Surveillance Working Group, including researchers and representatives from sites in Liberia, Lesotho, Malawi, Haiti, Mexico, Rwanda and Sierra Leone, collaborated to develop syndromic surveillance tools appropriate for aggregated health facility data. In this paper, we detail: (i) the processes of data preparation; (ii) the statistical modelling approach, including the adaptation of the parametric bootstrap approach for constructing prediction intervals; and (iii) data visualization tools. These are supported with links to resources to support replication. We demonstrate these methods with an example of monitoring acute respiratory infections at health facilities in Liberia. Finally, we conclude with recommendations to support syndromic surveillance activities in other locations and for other outbreaks using these methods.
Methods for COVID-19 syndromic surveillance using monthly aggregate data
This research only contained data aggregated at the health facility level. Ethical approval was not required.
Health information systems with monthly aggregate data
Different types of routine health information systems are used in different countries, and each requires a different approach for syndromic surveillance. Here, we focused on monthly counts aggregated at the health facility level for a given indicator. The format of these data is typical of Health Management Information Systems (HMIS) in LMICs, such as the popular District Health Information Software 2 (DHIS2) which has been endorsed for disease surveillance by the World Health Organization.8,9 Five of the seven country sites (Liberia, Lesotho, Malawi, Rwanda and Sierra Leone) report monthly aggregated data for their syndromic surveillance indicators, and therefore were equipped to use the approach described herein.
Choice of indicators
The availability of health indicators varied by country (Table 1). The most common indicator selected for COVID-19 syndromic surveillance was acute respiratory infection (ARI). As persons with COVID-19 often present with symptoms typical of ARI, we hypothesized that COVID-19 infected individuals would possibly be classified as ARI cases in the health systems data—meaning that the presence of SARS-CoV-2 circulation in a facility catchment area could plausibly appear as an increase in cases of ARI at that health facility.10 Fever and pneumonia were also common indicators tracked across countries.
Table 1.
Syndromic surveillance indicators by country with the specific indicators grouped by bolded indicator categories and X indicating availability for that country
| Haitia | Lesotho | Liberia | Malawi | Mexicoa | Rwanda | Sierra Leone | |
|---|---|---|---|---|---|---|---|
| Any type of pneumonia | X | X | X | X | |||
| Pneumonia | X | X | X | ||||
| Severe pneumonia | X | X | X | ||||
| Aspiration pneumonia | X | ||||||
| Respiratory infection or disease | X | X | X | X | X | X | |
| ARIb, any type | X | X | X | X | X | ||
| Lower ARIb | X | ||||||
| Upper ARIb | X | ||||||
| Severe ARIb | X | ||||||
| Asthma | X | ||||||
| Other respiratory tract diseases | X | ||||||
| Flu & cold symptoms | X | X | X | X | X | X | |
| Cough | X | X | |||||
| Common cold | X | X | |||||
| Temperature | X | X | |||||
| Influenza-like illness | X | ||||||
| Fever | X | Xc | X | X | X | ||
| Headache | X | ||||||
| Fast breathing | Xc | X | |||||
| Chills | X | ||||||
| Gastrointestinal symptoms | X | X | X | X | |||
| Diarrhoea | X | X | X | ||||
| Bloody diarrhoea | X | X | |||||
| Vomiting/nausea | X | ||||||
| Abdominal pain | X |
Data from electronic health record, which has individual-level demographic information.
ARI denotes acute respiratory infection.
Only available among children under 5.
Data processing
We developed an automated data processing pipeline to systematically clean, model and visualize routinely collected data on respiratory infection indicators for each country. Annotated R code was developed for each country indicator to streamline data cleaning for future monthly extractions. Cleaned indicators typically included raw counts, such as the number of ARI cases reported to a health facility in a given month. Since March 2020, sites have submitted new indicator data on a monthly basis to be run through the data processing pipeline. Potential outliers were reported to the in-country monitoring and evaluation (M&E) officers for review. If the outlier data were suspected to be miscounted and determined by the M&E officer to be unresolvable, the value for the specific health facility was coded to missing for that month. Detailed information about the implementation of this data processing pipeline is available in the Supplementary File 1, available as Supplementary data at IJE online.
Establishing baseline models for count indicators
We considered 1 January 2016 to 31 December 2019 as the baseline period across all sites, and data from this window were used to establish an expected (predicted) baseline count. For facility-level assessments, we fit a generalized linear model with negative binomial distribution and log-link to estimate expected monthly counts:
| (1) |
where Y indicates monthly indicator count, t indicates the cumulative month number, indicates the number of harmonic functions to include (we take ). The year term captures long-term annual trend and the harmonic terms capture seasonality. This mean model was chosen to allow smoothing without imposing strong assumptions on the seasonal behaviour, and also aligns with other models used during the pandemic.11 We could have alternatively chosen to model trend as a monthly (t) or quarterly linear term, but this specification was chosen as it performed well across indicators and facilities. Further, if information is available on external covariates, such as annual rainfall, it would be possible to incorporate this information into the modelling procedure. We chose to use a negative binomial distribution (instead of Poisson) to account for overdispersion.
The baseline model provided a predicted count with corresponding 95% prediction intervals for each health facility in a given month. To calculate the prediction intervals, we used a parametric bootstrap procedure, drawing realizations for the model coefficients from a multivariate normal distribution and using this to then compute predicted counts from a negative binomial distribution. This is similar to the methodology employed by the ciTools R package but uses a negative binomial distribution instead of quasi-Poisson.
Assessing deviations from expected during the evaluation period
We defined the evaluation period as beginning on 1 January 2020, based on the first investigation of atypical pneumonia cases in Wuhan, China by the World Health Organization in early January.12 We used the baseline model, which was fit using only data from the baseline period, to predict indicator counts with 95% prediction intervals for months during the evaluation period. This prediction reflects what we would expect to observe at a specific facility in a given month in the absence of any impact from COVID-19. We defined a deviation as the difference between the predicted and observed count (or proportion) for a given month. To facilitate interpretation across months, indicators and facilities of different sizes, we standardized the deviation measure by dividing by the predicted count. A negative value indicated a count (or proportion) less than expected and a positive value indicated a count (or proportion) higher than expected based on the baseline model. In our data visualizations, we reported this scaled deviation measure and indicated if the observed count fell outside the 95% prediction interval.
Addressing missing monthly counts
Facilities with 20% or more missing observations from the baseline period (equivalent to 10 out of 48 months) were excluded from this facility-level syndromic surveillance activity. The consensus of the M&E officers at our collaborating sites is that higher levels of missing data likely indicated broader data reporting issues that may (i) compromise the baseline model and resulting prediction intervals and (ii) potentially perpetuate in the reported counts during the COVID-19 evaluation period. For the facilities included in the analysis, we assumed residual missing monthly counts were at random and conducted a complete case analysis for the baseline model. This missing-at-random assumption would be violated if counts were missing for a reason related to the count value (e.g. values more likely to be missing during high patient load months).
Accounting for changes in overall health-seeking behaviours
Importantly, health-seeking behaviour may change during the course of a disease outbreak, which can affect the expected number of cases of a particular syndrome presenting to a health facility. During the Ebola Virus Disease outbreak, health care utilization declined by 18% across Liberia, Guinea and Sierra Leone over 2013–2016.13 To account for such changes in overall health service utilization, we also modelled the proportion of indicator counts at that health facility, with a generalized linear model with negative binomial distribution and log-link using an offset term, , the total number of monthly outpatient visits:
| (2) |
Similar to the counts, we performed a parametric bootstrap procedure to calculate the prediction intervals. If there were missing values for the monthly outpatient visit count (denominator), we conducted an additional step to impute the missing outpatient visit value in the parametric bootstrap. We repeated the imputation procedure 500 times and took the median count for each month to be the predicted value and the 2.5th and 97.5th percentiles as the 95% bootstrap prediction interval. Further details on this procedure are provided in the Supplementary File 2, available as Supplementary data at IJE online.
Reporting over wider geographical areas
It may be of interest to report syndromic surveillance results on a wider geographical level, such as a district or county, that contain multiple health facility catchment areas. If there are no missing monthly counts at the facility level, one could simply sum the count indicator for each month across all facilities within a geographical region and fit the model in Equation 1. In this case, although both the regional and health-facility models may be valid, the predicted counts from each set of models would not be equivalent: see Supplementary File 2 for explanation.
However, in the presence of missing monthly data, regional models need to account for missingness at the facility level for a given month. We continued to exclude facilities that had more than 10 months (20%) or more of missing data during the baseline period. Even after this exclusion, there was still some missingness at the facility level which would impact on the summed counts at the wider geographical level. We used a parametric bootstrap to impute any missing values from the facility level models. We drew realisations of the predicted indicator counts from the facility-level model for each month and facility and then summed these values for a district- (or county) level-estimate. We repeated this procedure 500 times and took the 2.5th and 97.5th percentiles to create 95% prediction intervals.
For proportions, the numbers of outpatient visits were summed across facilities and a proportion was computed. If there were missing values in the outpatient visits, another step was included in the above parametric bootstrap procedure where missing outpatient visits were generated from equation (1) where Y indicates monthly outpatient visit count. The details on this procedure are given in the Supplementary File 2. We note that bootstrap procedures have been used to account for missing values in previous literature14 but have not yet been used to aggregate time series results in multi-level data, such as aggregative facility-level data to the county-level.
Evaluating the time series model
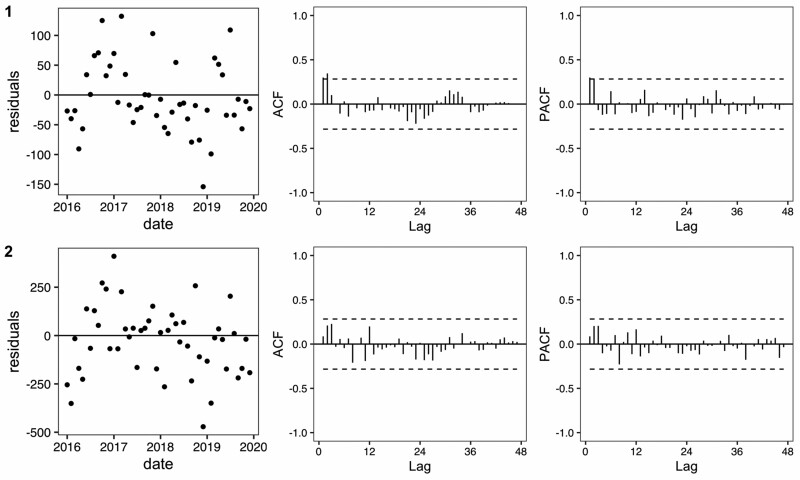
To ensure that the specified regression models do not have autocorrelation in the residuals, we performed several diagnostic procedures. For the residuals from facility- and county-level models, we generated plots of residuals by time, autocorrelation functions and partial autocorrelation functions. We also conducted the Breusch-Godfrey test for serial correlation for the facility-level models.
Data visualizations
Data visualizations were an essential tool for communicating results back to country sites. Time series plots provide information on all observed data points in the baseline and evaluation periods in addition to the predicted values and 95% prediction intervals. Although this provides granular information for individual health facilities and indicators, it is difficult to compare information across multiple health facilities or indicators. To facilitate comparison data, we report the difference in case counts between observed and predicted per 100 000 persons. In the Supplementary materials, we provide two additional visualizations: tiled heat maps (Supplementary File 3, available as Supplementary data at IJE online) and interactive geographical maps (Supplementary File 4, available as Supplementary data at IJE online). Tiled heat maps were coloured based on the deviation from expected during the evaluation period months and flagged when counts (or proportions) were outside the 95% prediction intervals. Geographical maps show the deviation from expected across geographical regions for a single time point. These maps were made interactive to allow for toggling between indicators and months using the leaflet R package. All analyses and figure generation were done in R V3.6.0. Our code with working examples is available on our public GitHub repository to facilitate adoption of this methodology in related contexts [https://github.com/isabelfulcher/global_covid19_response].
Application of ARI syndromic surveillance in Liberia
We present an application of the syndromic surveillance in Liberia for January through August 2020. Specifically, we detail the monthly counts of acute respiratory infection (ARI) cases and proportion of outpatient visits with a focus on Maryland County, the seventh largest county in Liberia. We present results at the facility level for JJ Dossen Hospital, the largest health facility in Maryland County [median of 262 monthly ARI cases with an interquartile range of (228, 299) during baseline] and at the county level for Liberia’s 15 counties. We use the time series models presented in Equations (1) and (2) with K = 3 and a baseline period of January 2016 through December 2019 for the facility- and county-level models.
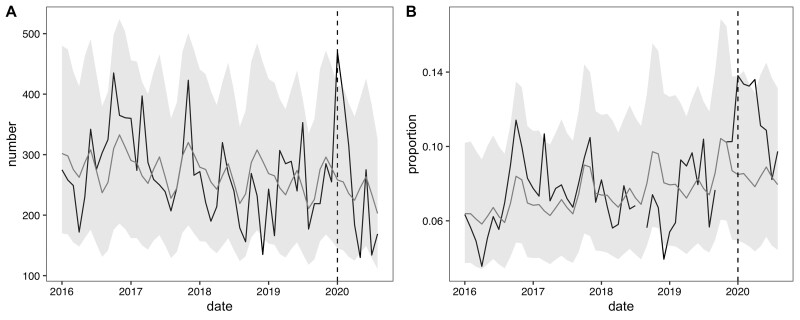
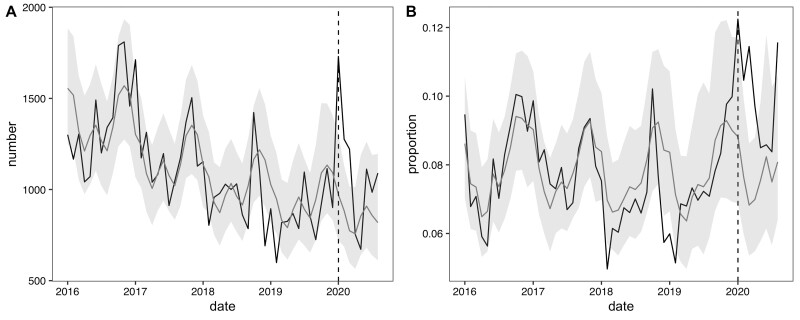
We report the facility-level models for ARI counts and proportions (Figure 1). In January 2020, JJ Dossen Hospital had a higher than expected number of ARI cases with 470 cases observed [compared with an expected 258 cases with a 95% prediction interval of (145, 414)] which promptly dropped to below expected after February 2020. However, from January through April 2020 the proportion of observed outpatient visits that were ARI cases (13–14%) was consistently higher than the proportion that was expected (7–8%). Similarly, at the Maryland county level, which includes JJ Dossen Hospital and 23 other facilities, the ARI case count and proportion remained higher than expected through March and then promptly fell within or slightly below the predicted range until July (Figure 2). Residual plots for these time series models are provided in Figure 3 and do not exhibit signs of residual autocorrelation. Breusch-Godfrey tests were performed for JJ Dossen Hospital with a p-value > 0.05 for both counts and proportions.
Figure 1.
(A) Number and (B) proportion of acute respiratory infection cases at JJ Dossen Hospital in Maryland County, Liberia. The black line represents the observed value and grey line the predicted counts with 95% prediction intervals in light grey
Figure 2.
(A) Number and (B) proportion of acute respiratory infections in the Maryland County model with the black lines representing the observed value and grey line the predicted counts with 95% prediction intervals in light grey
Figure 3.
Residual, autocorrelation function and partial autocorrelation function plots corresponding to the baseline period in Figure 1 (JJ Dossen Hospital) and Figure 2 (Maryland County)
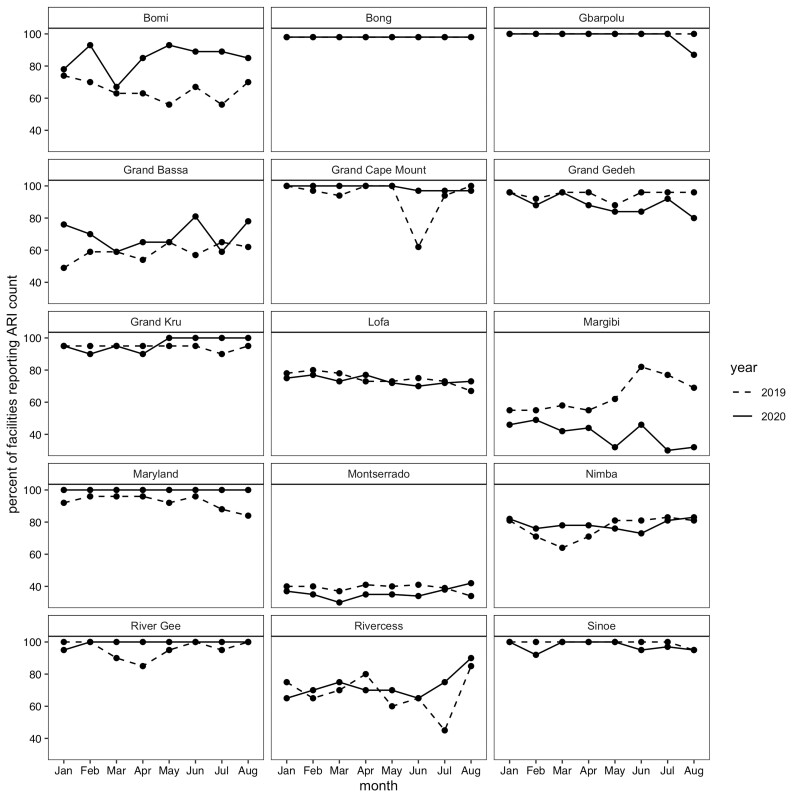
For the 15 county-level models, 325 facilities met the criteria for inclusion, with at least 80% complete acute respiratory infection data in the baseline period and no missing months in the evaluation period. Table 2 shows the breakdown of included facilities by county. Maryland, Bong, Grand Kru and River Gee have at least 90% of their facilities included, whereas Montserrado, Margibi, Grand Bassa and Rivercess have less than 40% of facilities included. The percentage of facilities missing ARI counts in 2020 was similar to 2019 with the exception of Margibi, which had more facilities with incomplete data in 2020, and Bomi, which had less facilities with incomplete data in 2020 (Figure 4).
Table 2.
Number of facilities included in analysis by county
| County | Total facilities | Complete baselinea | Complete evaluationb | Included in analysisc | Mean ARIe caseload at baselined |
|---|---|---|---|---|---|
| N | n (%) | n (%) | n (%) | Median [min, max] | |
| Maryland | 25 | 24 (96) | 25 (100) | 24 (96) | 31.0 [21.4, 266.0] |
| Bong | 46 | 43 (93) | 45 (98) | 43 (93) | 31.4 [3.0, 165.0] |
| Grand Kru | 20 | 19 (95) | 18 (90) | 18 (90) | 36.7 [16.3, 89.9] |
| River Gee | 20 | 19 (95) | 19 (95) | 18 (90) | 39.0 [11.1, 133.0] |
| Gbarpolu | 15 | 15 (100) | 13 (87) | 13 (87) | 51.9 [11.9, 183.0] |
| Grand Cape Mount | 34 | 31 (91) | 31 (91) | 28 (82) | 35.8 [13.6, 149.0] |
| Sinoe | 37 | 35 (95) | 29 (78) | 27 (73) | 21.8 [6.7, 88.4] |
| Grand Gedeh | 25 | 23 (92) | 17 (68) | 16 (64) | 24.1 [9.7, 77.1] |
| Bomi | 27 | 14 (52) | 14 (52) | 12 (44) | 41.5 [21.2, 297.0] |
| Lofa | 60 | 45 (75) | 25 (42) | 25 (42) | 68.5 [14.0, 131.0] |
| Nimba | 78 | 55 (71) | 36 (46) | 32 (41) | 60.1 [11.2, 198.0] |
| Rivercess | 20 | 14 (70) | 7 (35) | 7 (35) | 26.3 [11.8, 40.5] |
| Grand Bassa | 37 | 17 (46) | 13 (35) | 10 (27) | 63.1 [17.9, 226.0] |
| Margibi | 71 | 28 (39) | 10 (14) | 10 (14) | 52.0 [24.8, 141.0] |
| Montserrado | 397 | 82 (21) | 54 (14) | 41 (10) | 55.5 [5.4, 576.0] |
Facility has number of acute respiratory infections for at least 80% of months during January 2016-December 2019.
Facility has all months available in the evaluation period during January 2020-August 2020.
Facility has complete baseline and evaluation data.
Average number of acute respiratory infection (ARI) cases for each included facility are calculated during the baseline period. The mean, minimum (min) and maximum (max) across the county’s facilities are then reported.
ARI denotes acute respiratory infection.
Figure 4.
Proportion of facilities with complete data in 2020 compared to 2019 by county
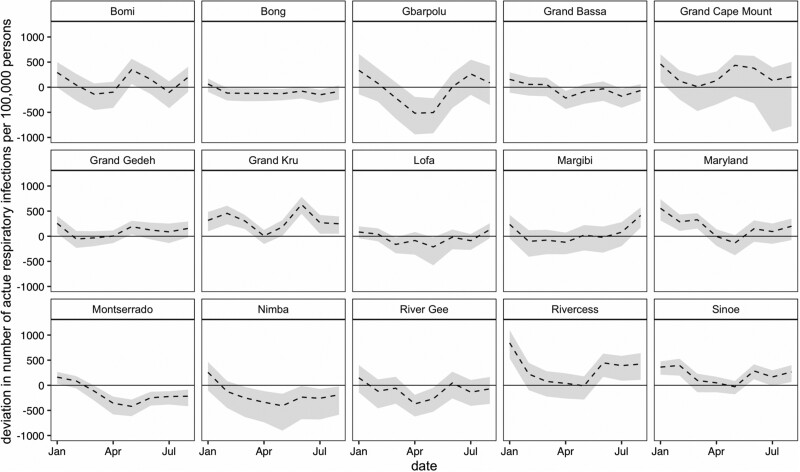
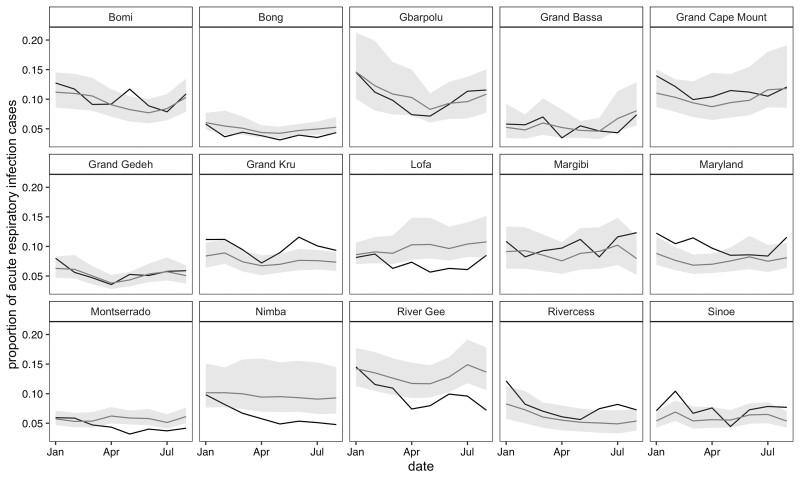
In January 2020, all 15 counties reported higher than expected ARI case counts, with seven counties’ counts outside the 95% prediction interval (Figure 5). Of the seven counties, the largest deviations were in Rivercess and Maryland with 842 and 556 higher than expected cases per 100 000 persons, respectively. For the proportion measures, only four of these counties—Maryland, Grand Kru, Rivercess and Sinoe—had deviations larger than the 95% prediction interval, which persisted in Maryland and Grand Kru through March 2020 (Figure 6). Interestingly, five counties—Bong, Montserrado, Nimba, River Gee and Lofa—had consistently lower than expected ARI proportions after April 2020.
Figure 5.
Deviation in number of acute respiratory infections standardized per 100 000 persons in each county from January to August 2020. The black dotted lines represent the difference between the observed and predicted counts (deviation), with corresponding 95% prediction intervals in light grey. County population sizes scaled to account for excluded facilities.
Figure 6.
Proportion of acute respiratory infections for each county from January to August 2020. The black lines represent the observed count and grey line the predicted counts, with 95% prediction intervals in light gray
The first confirmed COVID-19 case was on 16 March 2020 in Liberia.15 The higher than expected number of ARI cases in January 2020 across multiple counties is unlikely due to COVID-19, as global evidence indicates that there was not sustained transmission of SARS-CoV-2 outside China during this time.16 However, in the case of Maryland County, which had a large spike in ARI cases from January through March, it is possible that the containment measures taken for COVID-19 following the national health emergency contributed to a reduction in ARI cases in the months of April through August.17
The lack of significant increases detected in the number and proportion of ARI cases seems to align with the low number of confirmed COVID-19 cases in Liberia during March through August 2020. Cumulatively from 16 March to 31 August, there were only 38 confirmed cases per 100 000 persons (1305 total) in Liberia, with 24 cases per 100 000 persons (32 cases total) from Maryland County (see Supplementary File 5, available as Supplementary data at IJE online). To detect a significant deviation in ARI cases in Maryland County, there would need to have been at least 362 additional ARI cases per 100 000 persons on a monthly basis—more than 75 times the number of confirmed COVID-19 cases in the county. Although the comparison between confirmed COVID-19 cases and ARI cases helps contextualize the interpretation of these syndromic surveillance results, there are two important caveats: (i) the number of confirmed COVID-19 cases may be underestimated if testing capacity is low; and (ii) individuals with COVID-19 may not present as an ARI case at a health facility, either because they are not exhibiting ARI symptoms or they did not seek care.
Discussion
We developed methodology to automate data cleaning, time series modelling and data visualizations for identification of deviations in COVID-19-associated symptoms. Although the presented results were for an 8-month period, we continue the data processing and modelling procedure on a monthly basis when new data become available. The monthly updates are shared with the country’s health management team to investigate facilities that have higher than expected ARI cases. The results will now inform which facilities will be chosen for a seroprevalence study among health care workers in Maryland and Montserrado counties to validate these methods.
The use of data on COVID-19-associated symptoms for syndromic surveillance is subject to several limitations that should be considered before employing such methods. First and foremost, syndromic surveillance is not equivalent to directly monitoring a disease via widespread viral or antibody testing, and the choices of indicators by each country have not yet been validated for monitoring purposes. We are currently validating these methods and indicators in regions that had high levels of COVID-19 testing. Second, this exercise relies on the availability of both previous data to establish a baseline and future data to detect deviations—large amounts of missing data, variations in the quality of data over time and lack of information on important COVID-19-related symptoms will hinder this effort. Changes in indicator definitions during outbreaks may also affect the utility of these methods; for example, patients with suspected COVID-19 may no longer be included in the acute respiratory infection indicator. Importantly, this was not the case in Liberia. Third, substantial changes in health-seeking behaviour or in data entry during the pandemic will impact on the interpretation of any deviations (or lack thereof). In the case of Liberia, as patients became informed and/or educated on COVID-19 case definition, they may have under-reported ARI symptoms or chosen not to go to a facility for fear of being quarantined. Additionally, clinicians may not have formally diagnosed clinical symptoms as an ARI because of concern that would trigger COVID-19 investigation; this could potentially explain some of the much lower than expected ARI cases and proportions. Last, countries must also have the capacity to develop a streamlined process for data cleaning, analysis and visualization that can be readily updated when new data are available.
To facilitate a streamlined model fitting every month, the same parametric model specification for counts and proportions was used across all facilities (i.e. Equations 1 and 2). In principle, one could fine-tune each model for each facility and indicator by investigating autocorrelation functions and comparing various model specifications. However, this was not feasible in our setting with seven countries and a multitude of facilities and indicators within each. We instead recommend using the Breusch-Godfrey test for serial correlation as a way to flag facility-level models that need additional investigation (based on a pr-determined significance cut-off). In addition, we found it beneficial to have the granular time series plots for all facilities and indicators accessible on an online tool hosted by Shiny App. This enabled site leads to visualize the results and flag potentially ill-fitting models to the study team. Further, we note that excluding facilities with high levels of missingness may underestimate the raw indicator counts at wider geographical levels (e.g. Montserrado County in Liberia). However, because facilities with high levels of missingness are excluded from both the baseline models and the observed count, comparing deviations from expected counts can still be used for the purposes of syndromic surveillance, as long as reporting rates are independent of ARI caseloads and time period. We attempted to alleviate this concern by Figure 4 which showed similar reporting rates across most counties during the COVID-19 pandemic and the preceding year.
Finally, although these models were developed in response to the COVID-19 pandemic, this approach could be used and adapted for ongoing surveillance on a wide range of health indicators that are included in most health information systems. In general, deviations from expected should warrant further investigation by local public health officials, but do not necessarily indicate an outbreak or emerging infectious disease. When tracking symptoms related to a specific disease, such as COVID-19, deviations from expected can identify local areas for more specific testing when resources are limited, but need to be further validated before being used to inform resource allocation or lockdown strategies.
In conclusion, syndromic surveillance can be used to monitor for potential COVID-19 or other disease outbreaks in health facility catchment areas. We leveraged data from existing data collection systems and developed data science tools in open access software to routinely monitor for COVID-19 symptoms on a monthly basis. The methods and accompanying resources can be applied to other regions or diseases with minimal adaptation.
Supplementary Data
Supplementary data are available at IJE online.
Funding
This work was supported by a grant from the Canadian Institutes of Health Research, where M.L. and B.H-G. are PIs.
Data availability
The data underlying this article will be shared on reasonable request to the corresponding author. We have provided an example dataset on our GitHub repository: [https://github.com/isabelfulcher/global_covid19_response].
Supplementary Material
Acknowledgements
We thank our team of junior analysts for their contributions to this ongoing effort: Donald Fejfar, Katherine Tashman and Jessica Wang. The Cross-site COVID-19 Syndromic Surveillance Working Group is composed of the following—Partners In Health/Boston: Jean-Claude Mugunga; Partners In Health/Haiti: Peterson Abnis I Faure, Wesler Lambert, Jeune Marc Antoine; Partners In Health/Liberia: Emma Jean Boley, Prince Varney; Partners In Health/Lesotho: Meba Msuya, Melino Ndayizigiye; Partners In Health/Malawi: Moses Aron, Emilia Connolly; Partners In Health/Mexico: Zeus Aranda, Daniel Bernal; Partners In Health/Rwanda: Vincent K Cubaka, Nadine Karema, Fredrick Kateera; Partners In Health/Sierra Leone: Thierry Binde, Chiyembekezo Kachimanga; Harvard Medical School: Dale A Barnhart, Isabel R Fulcher, Bethany Hedt-Gauthier, Megan Murray; Hong Kong University: Karen A Grépin; University of British Columbia: Michael Law.
Author Contributions
I.R.F. contributed to the design of the research, data cleaning, data analysis, statistical methods development, figure creation, code creation and writing of the manuscript. E.J.B. contributed to the interpretation of results and writing of the manuscript. A.G. contributed to the data analysis, code creation and statistical methods development. P.V. contributed to data extraction, data cleaning and interpretation of the results. N.K. contributed to data cleaning and figure creation. D.A.B., J.C.M., M.M. and M.R.L. contributed to the design of the research and interpretation of results. B.H.G. conceived of the project design and was in charge of overall project direction. All authors, including the Cross-site COVID-19 Syndromic Surveillance Working Group, discussed the results and provided comments on the manuscript.
Conflict of interest
None declared.
References
- 1.Murthy S, Leligdowicz A, Adhikari NK.. Intensive care unit capacity in low-income countries: a systematic review. PloS One 2015;10:e0116949. [DOI] [PMC free article] [PubMed] [Google Scholar]
- 2.Davies J, Abimiku AL, Alobo M. et al. Sustainable clinical laboratory capacity for health in Africa. Lancet Glob Health 2017;5:e248–49. [DOI] [PubMed] [Google Scholar]
- 3.Kavanagh MM, Erondu NA, Tomori O. et al. Access to lifesaving medical resources for African countries: COVID-19 testing and response, ethics, and politics. Lancet 2020;395:1735–38. [DOI] [PMC free article] [PubMed] [Google Scholar]
- 4.Wagenaar BH, Sherr K, Fernandes Q, Wagenaar AC.. Using routine health information systems for well-designed health evaluations in low-and middle-income countries. Health Policy Plan 2016;31:129–35. [DOI] [PMC free article] [PubMed] [Google Scholar]
- 5.Hung YW, Hoxha K, Irwin BR, Law MR, Grépin KA.. Using routine health information data for research in low-and middle-income countries: a systematic review. BMC Health Serv Res 2020;20:1–5. [DOI] [PMC free article] [PubMed] [Google Scholar]
- 6.Farnham A, Utzinger J, Kulinkina AV, Winkler MS.. Using district health information to monitor sustainable development. Bull World Health Organ 2020;98:69–71. [DOI] [PMC free article] [PubMed] [Google Scholar]
- 7.Guan WJ, Ni ZY, Hu Y. et al. Clinical characteristics of coronavirus disease 2019 in China. N Engl J Med 2020;382:1708–20. [DOI] [PMC free article] [PubMed] [Google Scholar]
- 8.DHIS2. DHIS2 In Action. https://www.dhis2.org/in-action (1 December 2020, date last accessed).
- 9.World Health Organization. DHIS2-Based Surveillance Support Tools. https://www.who.int/malaria/areas/surveillance/support-tools/en/ (21 December 2020, date last accessed).
- 10.Shah SJ, Barish PN, Prasad PA. et al. Clinical features, diagnostics, and outcomes of patients presenting with acute respiratory illness: a retrospective cohort study of patients with and without COVID-19. EClinicalMedicine 2020;27:100518. [DOI] [PMC free article] [PubMed] [Google Scholar]
- 11.World Health Organization. Timeline of WHO’s Response to COVID-19 (June 2020). https://www.who.int/news/item/29-06-2020-covidtimeline (26 October 2020, date last accessed).
- 12.Weinberger DM, Chen J, Cohen T. et al. Estimation of excess deaths associated with the COVID-19 pandemic in the United States, March to May 2020. JAMA Intern Med 2020;180:1336–44. [DOI] [PMC free article] [PubMed] [Google Scholar]
- 13.Wilhelm JA, Helleringer S.. Utilization of non-Ebola health care services during Ebola outbreaks: a systematic review and meta-analysis. J Glob Health 2019;9:010406. [DOI] [PMC free article] [PubMed] [Google Scholar]
- 14.Blackwell M, Honaker J, King G.. A unified approach to measurement error and missing data: overview and applications. Sociol Methods Res 2017;46:303–41. [Google Scholar]
- 15.US Bureau of Diplomatic Security. Health Alert: Liberia, Confirmed COVID-19 Cases. https://www.osac.gov/Country/Liberia/Content/Detail/Report/29421dc1-0f11-4c02-84fd-1842fb23c1d6 (22 March 2020, date last accessed).
- 16.PekarJ, , WorobeyM, , MoshiriN, , SchefflerK, , Wertheim JO.Timing the SARS-CoV-2 index case in Hubei province. Science 2021;372:412–7. 10.1126/science.abf8003 33737402 [DOI] [PMC free article] [PubMed] [Google Scholar]
- 17.Ministry of Health and National Public Health Institute of Liberia (NPHIL). Interim Guidance on Clinical Care for Patients with COVID-19 in Liberia. 2020. https://moh.gov.lr/wp-content/uploads/Interim_Guidance_for_care_of_Pts_with_Covid_19_in_Liberia.pdf. (26 October 2020, date last accessed).
Associated Data
This section collects any data citations, data availability statements, or supplementary materials included in this article.
Supplementary Materials
Data Availability Statement
The data underlying this article will be shared on reasonable request to the corresponding author. We have provided an example dataset on our GitHub repository: [https://github.com/isabelfulcher/global_covid19_response].


