

Abstract
Tumor hypoxia occurs because of an increased demand for oxygen by the rapidly growing tumor cells, together with reduction in the oxygen supply due to malformed and nonfunctional tumor vasculature. The effects of tumor hypoxia on radiotherapy (RT) are well known; however, recent findings suggest it may also suppress immunotherapy, although the mechanisms governing this observation remain undetermined. Our laboratory and others have shown that IFN-γ conditions the tumor milieu and is important for the efficacy of RT. Thus, we hypothesized that hypoxia could inhibit IFN-γ–mediated antitumor responses, resulting in decreased RT efficacy. This inhibition could involve the production and/or the cellular response to IFN-γ. To test this, we used murine tumor cell lines B16F0 and Colon38. We observed that hypoxia inhibited upregulation of IFN-γ–dependent MHC class I expression by tumor cells along with the gene expression of IFN-γ–dependent chemokines CXCL9 and CXCL10, essential for immune cell infiltration. Furthermore, CD8+ T cells, an important source of IFN-γ, which mediate effector antitumor responses, had reduced ability to proliferate and generate IFN-γ under hypoxic conditions in vitro. Interestingly, reoxygenation restored the cytokine-producing capability of these cells. Studies performed in vivo using a mouse tumor model and the hypoxia marker EF5 demonstrated that RT could reverse the hypoxia within treated tumors. This study has identified a unique mechanism of hypoxia-induced immune suppression involving the downregulation of IFN-γ production and cellular responsiveness to this essential cytokine. These results suggest that therapies that target and reduce tumor hypoxia can potentially boost antitumor immune responses.
INTRODUCTION
Tumor hypoxia is a characteristic feature of solid tumors (1–4). It is a critical factor involved in tumor invasion and metastasis, dormancy, pH regulation, stem cell differentiation, inflammation, angiogenesis, glucose metabolism, and resistance to radiotherapy (RT) and chemotherapy (3–6). Hypoxia results from a combination of reduced oxygen supply due to chaotic tumor vasculature and an increased metabolic requirement of rapidly dividing tumor cells. Importantly, biopsies from lung, colon, brain, ovarian, head and neck, pancreas, prostate, rectum, and stomach cancers have demonstrated correlations with increased expression of hypoxia-induced protein expression and poor patient prognosis (5, 7).
RT is widely used to treat a majority of cancers, but the presence of hypoxic regions can result in resistance to RT (4, 8–10). In vitro studies have demonstrated that hypoxic cells require 3-fold more radiation than normoxic cells to cause the same amount of damage (11). Strategies such as hyperbaric chambers, angiogenesis inhibitors, and radiosensitizer molecules were developed to improve the oxygenation status of tumors and circumvent the problem of radiation resistance (12). Unfortunately, most of these strategies are ineffective because of the development of resistance to these therapies over long periods of treatment. Recently, a new wave of immunotherapies, including checkpoint inhibitors, chimeric Ag receptor T cells, dendritic cell vaccination, cytokine therapy, and TLR stimulation, are undergoing clinical trials for safe and effective treatment of tumors. These therapies, particularly in combination with current standards of treatment such as RT, have generated effective antitumor immune responses and improved patient survival in a proportion of patients. The efficacy of these combinations can be determined by many factors, including hypoxic status of the tumor microenvironment (TME). Thus, although it has been well established that hypoxia has a negative impact on the efficacy of conventional tumor therapies, the impact of hypoxia on the combination of RT and immunotherapies remains an intriguing question.
Immune cells respond to hypoxia in various ways. For example, macrophages with protumorigenic characteristics can accumulate in hypoxic tumor areas, upregulate glucose transporters-1 and −3, and generate arginase-1, IL-10, and vascular endothelial growth factor-A (VEGF-A), all of which contribute to an immunosuppressive TME (13, 14). In contrast, T cells are essential for generating antitumor immune responses during RT (15–17), but their localization within the TME and the effects of hypoxia on these crucial effector cells remain controversial. For example, Robbins et al. (18) have demonstrated in human T cells that hypoxia causes downregulation of membrane channels and reduction of calcium influx into the cells. This results in inhibition of T cell activation and proliferation, suggesting that hypoxia can inhibit the generation of tumor-specific T cells (18, 19). Similarly, other in vivo studies demonstrate preferential localization of T cells away from hypoxic tumor zones, suggesting a possible immune escape mechanism used by tumor cells (20–22). However, some studies have demonstrated that T cells are better killers when activated at lower than normal oxygen conditions (23) and that such cells can enhance tumor rejection (24–27). Additionally, another study demonstrated increased production of the lytic molecules perforin and granzyme upon constitutive activation of hypoxia inducible factor-1 (HIF-1), the predominate transcription factor for hypoxia signaling, indicating that hypoxic T cells are better killers (28, 29). Overall, these studies imply that hypoxia makes T cells better effector cells. Furthermore, studies by Sitkovsky et al. (30) showed that hypoxia-induced accumulation of cAMP and adenosine A2A receptor stimulation on T cells were the underlying mechanisms responsible for inhibiting TCR signaling, proliferation, cytokine production, and other effector functions. Thus, there are conflicting reports about the effect of hypoxia on CD8+ T cell function in the antitumor response. The goal of this study was to further investigate how hypoxia affects antitumor immunity, specifically the impact of hypoxia on IFN-γ–dependent responses.
In this study, we hypothesized that hypoxia can inhibit IFN-γ–dependent antitumor immune responses. Our studies demonstrate a possible mechanism of hypoxia-induced immune evasion by tumor cells via downregulation of IFN-γ–induced MHC class I (MHC I). Additionally, we show that hypoxia inhibits Ag-specific T cell proliferation and effector function. In a preclinical model of adenocarcinoma, we have demonstrated that hypoxia enhances pathways involving tumor angiogenesis and vessel formation and, thus, supports tumor growth. Collectively, our findings strongly indicate that hypoxia is immunosuppressive, and studying its effects on immune responses may help to optimize and improve the efficacy of radiation therapy.
MATERIALS AND METHODS
Animal model and cell lines
C57BL6/J female mice purchased from The Jackson Laboratory were used for all the animal experiments. The animals were treated in accordance with guidelines provided by the University of Rochester’s University Committee on Animal Resources. Animals were used at ∼8–12 wk of age. Murine colon adenocarcinoma Colon 38 cells were obtained from Dr. E. Brown (University of Rochester) and maintained in MAT/P medium (U.S. Patent 4.816.401) supplemented with 100 U/ml penicillin, 100 mg/ml streptomycin (Sigma-Aldrich), and 2% FCS. Line1, a BALB/c mouse lung carcinoma cell line, was obtained from Dr. J. Yuhas, whereas MCF7, a human breast adenocarcinoma, HeLa, a human cervical epithelial adenocarcinoma, and B16F0, a C57BL/6 melanoma, were purchased from the American Type Culture Collection (31). OT-1 male mice were a gift from Dr. M. Kim at the University of Rochester.
Cell culture and in vitro hypoxia treatment
Tumor cells were maintained in MAT/P medium. To make cells hypoxic in vitro, 8×10⁵ cells were seeded on glass plates overnight at 37°C. Prior to making them hypoxic, the cells were treated with either murine IFN-γ (50 ng/ml; Peprotech) or vehicle (media) control. Cells were placed in aluminum chambers and made hypoxic (0.5% O2) or normoxic (21% O2) through a series of gas exchanges, as previously described, and maintained for the required number of hours at 37°C (20).
Proliferation and activation assay
For the T cell activation and proliferation assay, spleen, cervical, brachial, and inguinal lymph nodes were harvested from OT-1 mice. Single-cell suspensions were prepared, and cells were maintained in MAT/P medium supplemented with 10% FCS, 100 U/ml penicillin, and 100 mg/ml streptomycin. Cells were treated with OVA peptide fragment (SIINFEKL; Thermo Fisher) at a concentration of 12.5 μg/ml for 24 h. Cell proliferation was measured using a Cell Trace Violet (Invitrogen) proliferation kit following the manufacturer’s protocol.
Tumor growth and treatment
A total of 105 Colon38 tumor cells resuspended in HBSS (Thermo Fisher) were injected i.m. into the left flanks of mice. Tumor growth was monitored using calipers, and mean thigh diameter was calculated using the geometric mean (square root of the product of width and height). A 3200 Curie-sealed cesium (137Cs) source that operates at 1.90 Gy/min was used to deliver radiation to mice. Mice were restrained in specially designed plexiglass jigs, and tumors were locally irradiated with 15-Gy radiation administered directly to the tumor-bearing leg (16). Tumors were harvested at the indicated time points and analyzed.
EF5 injection
EF5 is a pentafluorinated derivative [2-(2-nitro-1H-imidazol-1-yl)-N-(2,2,3,3,3-penta-fluoropropyl) acetamide] of etanidazole (11, 20). To measure intratumoral hypoxia in mice with established tumors, mice were injected with 0.2 ml of 10 mM EF5 i.v. 3 h prior to sacrifice and tumor removal. EF5 drug and anti-EF5 Ab ELK-351-Cy3 were kindly provided by Dr. C. Koch.
Flow cytometry analysis
Tumors were first weighed, minced, and treated with collagenase at 37°C for 30 min. Single-cell suspensions were prepared in PBS/1% BSA/0.1% azide (PAB). A total of 106 cells were then treated with Fc block (clone 24G2) and surface-stained at 4°C for 30 min with a mixture of directly conjugated primary Abs specific for CD8 (53–6.7), CD45 (30-F11), IFN-γ (XMG1.2), and H-2Kb (AF6–88.5) (BD Biosciences). All samples were washed in 1 ml of PAB. For measuring intracellular proteins including IFN-γ, cells were first permeabilized using BD Cytofix/Cytoperm (BD Biosciences) solution at 4°C for 15 min and then labeled with anti–IFN-γ Ab. Hypoxia staining was done as previously described (20). Following surface staining and permeabilization, cells were resuspended in blocking solution containing milk and mouse IgG overnight at 4°C. Cells were then labeled with ELK-3–51-Cy3 for 3 h at 4°C and analyzed using a 12-color LSRII (BD Biosciences) flow cytometer and FlowJo software (Tree Star). Doublet exclusion was done for all experiments based on side and forward scatter. Data are represented as a percentage of CD45+ or CD8+ events. Fluoroscence minus controls were included in each experiment.
RNA isolation and real-time PCR
RNA was purified using the RNeasy Mini Kit (QIAGEN) according to the manufacturer’s protocol. The RNA was quantified using a spectrophotometer, and cDNA was prepared using the iScript reverse transcription kit (Bio-Rad). cDNA was diluted and used for real-time quantitative PCR (Bio-Rad CFX Connect) to measure the mRNA levels of CXCL9 (MIG), CXCL10 (IP10), VEGF-A, (IDO), and prolyl hydroxylase 3 (PHD3) using respective primers (CXCL9: 5′-GATCCACTACAAATCCCTCA-3′ and 5′-GATCTAGGCAGGCAGGTTTGATCT-3′; CXCL10: 5′-CCATAGGGAAGCTTGAAATC-3′ and 5′-GATGGTCTTAGATTCCG GAT-3′; VEGF-A: 5′-GAAACCATGAACTTTCTGCT-3′ and 5′-TTGATCACTTCATGGGACTT-3′; IDO: 5′-TAGATGAA GATGTGGGCTTT-3′ and 5′-TTTCAACTTCTTCTCGAAGC-3′; PHD3: 5′-CAAATACTATGTCAAGGAGCG-3′ and 5′-AGTAGA TACAGGTGATACAGC-3′) as previously described (31). The data were normalized to GAPDH and expressed as fold increase over the untreated controls.
Tumor sectioning
Tumors were harvested, cut into smaller pieces, frozen in molds using OCT, and 100-μm thick sections were cut using a cryostat. To obtain a three-dimensional image of hypoxic areas in a tumor, thick tumor sections were cut. Thick sections were used for hypoxia staining and analyzed usingconfocal microscopy. Fifteen-micron sections were used for laser capture microdissection.
Immunohistochemistry
Sections were first fixed using 2% paraformaldehyde solution at 4°C for 30 min. The sections were then washed with PAB for 10 min and stained with an Ab mixture containin ganti-CD8 BV421 (to identify CD8+ T cells) and anti-CD31 BV 480 (to identify tumor vasculature) for 60 min at 4°C. To analyze hypoxic regions, the sections were also incubated with ELK-3–51-Cy3 Ab for 3 h and rinsed with PBS Tween 20 before they were examined by confocal microscopy.
Laser capture microdissection
The imaging core at the University of Rochester Medical Center assisted with laser capture microdissection experiments on a Zeiss microscope. Tumor sections were mounted on membrane slides, fixed, and stained with ELK-3–51-Cy3 (4 mg/ml). The sections were then dehydrated with 70, 85, and 100% ethanol prior to dissecting them. The hypoxic regions were brightly stained and detected by the Texas Red channel. The less bright regions were normoxic and dissected and collected in a separate tube. Tissue collected was dissolved in 100 μl of lysis buffer and stored at −80°C for RNA isolation.
RNA sequencing
The genomics core at the University of Rochester isolated total RNA from the hypoxic and normoxic tumor sections. Total RNA was used to generate cDNA, and random primers were used for amplification. The quality of RNA was determined using Agilent’s RNA integrity number. Data were analyzed using QIAGEN’s Ingenuity Pathway Analysis (IPA).
RESULTS
Colon38 tumors are hypoxic as demonstrated by EF5-ELK-3–51-Cy3
To study tumor hypoxia, we used a murine colon adenocarcinoma tumor model Colon38 stained with a mAb, ELK-3–51, that detects hypoxia-induced 2-nitroimidazole adducts from the drug EF5 (11, 21). EF5 is a small, soluble molecule and, hence, distributes evenly to all tissues. However, in areas of hypoxia, this drug undergoes reductive metabolism and binds cellular macromolecules, which can be detected using ELK-3–51-Cy3 (11). We have previously used this tool to identify, quantify, and image hypoxic tumor cells both in vitro and ex vivo (8). Colon38 tumors were harvested 11 d after tumor inoculation, and frozen sections were double-stained with anti-CD31 to visualize tumor blood vessels (Fig. 1A) and with the anti-EF5 Ab ELK-3–51 to identify hypoxic regions (Fig. 1B). To visualize a larger proportion of the tumor, we created large (∼4 × 6 mm) stitched montage iages of the entire tumor section. As expected, ELK-Cy3+ hypoxic regions exhibited brighter fluorescence staining than normoxic regions. The most hypoxic areas were located in areas of sparse CD31 staining. Interestingly, some areas of extensive CD31+ staining were present within large regions of hypoxia, with the nonhypoxic regions limited to the areas immediately adjacent to the blood vessels.
FIGURE 1. EF5 staining in Colon38 tumors demonstrates hypoxic regions adjacent to CD31+ vessels.
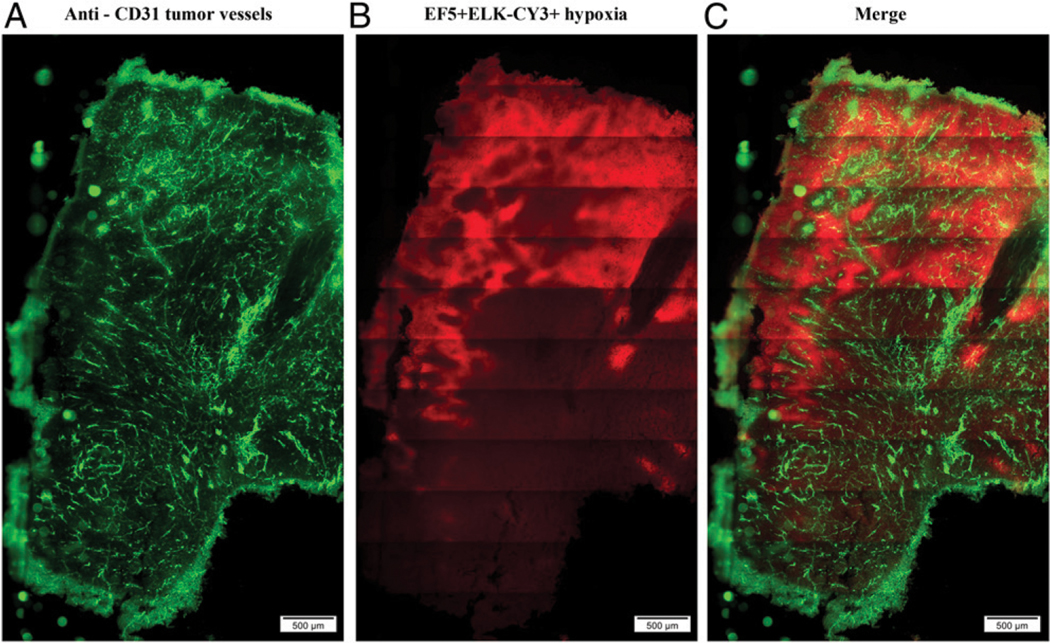
Representative fluorescent immunohistochemistry images from a Colon38 tumor. Eleven days after tumor inoculation, tumors were harvested, and 100-μm sections were prepared, fixed, and stained with (A) anti-CD31 (tumor vessels, green) and (B) anti-EF5 ELK-Cy3 (tumor hypoxia, red) Abs. (C) Merged images of vessels and hypoxia. Scale bar, 500 μm (n = 6).
To compare the gene expression profiles between hypoxic and normoxic regions of tumors in vivo, we used laser capture microdissection followed by RNA sequencing (RNA-seq). Colon38 cells were injected into wild-type mice and allowed to establish in a similar manner as described previously. EF5 and subsequent ELK-3–51 staining were used to identify hypoxic regions in tumor sections. ELK-3–51-Cy3+ hypoxic regions, along with adjacent ELK-3–51Cy3− normoxic control regions, were excised using laser capture microdissection, and low-input, random prime RNA-seq was performed. The RNA-seq revealed 31 genes that were significantly (q < 0.5) altered between the hypoxic and normoxic samples (Tables I, II). Genes required for tumor growth and invasion were upregulated in the hypoxic regions. Examples of these upregulated genes included MMP9, associated with tumor cell invasion and metastasis (32); sh3bp2, responsible for hypoxic adaptation of mesenchymal stromal cells in the TME (33, 34); and cdkn3, whose overexpression is associated with poor survival in lung adenocarcinoma patients and is involved in cell cycle regulation (35). These results confirmed that EF5 was correctly identifying hypoxic regions and that tumor cells could adapt to the hypoxic microenvironment. In addition, we also observed upregulated immunosuppressive genes, which could inhibit antitumor immune responses within the hypoxic areas. These included the chemokines ccl28 (involved with regulatory T cell migration) (36, 37) and cxc3cl1, which increases tumor cell migration and metastasis by enhancing epithelial-to-mesenchymal transition-like phenotype (38). Not surprisingly, PD-L1 expression and production of the immunosuppressive cytokine IL-10 (39, 40) were also upregulated. Arg1 was also increased, probably because of the greater numbers of macrophages found in the hypoxic regions (41).
TABLE I.
Genes upregulated in hypoxic Colon38 tumor sample
| Gene Name of Upregulated Genes | Gene Symbol | Fold Change (log2) | q Value |
|---|---|---|---|
| SH3 domain binding protein 2 | Sh3bp2 | 8.40772 | 0.0205847 |
| Potassium channel tetramerization domain containing 7 | Kctd7 | 7.86359 | 0.0022144 |
| EF-hand calcium binding domain 5 | Efcab5 | 7.64663 | 0.0010099 |
| Cyclin dependent kinase inhibitor 3 | Cdkn3 | 7.43569 | 0.021012 |
| Matrix metallopeptidase 9 | Mmp9 | 7.31971 | 0.000219 |
| Chemokine (C-C motif) ligand 28 | Ccl28 | 7.07062 | 0.0421098 |
| Basic helix loop helix family member E41 | Bhlhe41 | 7.04822 | 0.0077099 |
| Nuclear receptor subfamily 1 group H3 | Nr1h3 | 6.9363 | 0.0006515 |
| TATA-box binding protein associated factor 7 like | Taf7l | 6.72017 | 0.0361685 |
| C-X3-C motif chemokine ligand 1 | Cx3cl1 | 5.3606 | 0.0088655 |
| Early growth response 2 | Egr2 | 5.36843 | 0.0316623 |
| Zinc finger protein 10 | Zfp810 | 5.12921 | 0.0322721 |
| Ubiquitin conjugating enzyme E2 J1 | Ube2j1 | 4.21638 | 0.0458414 |
| Predicted gene 28872 | Gm28872 | 2.56688 | 0.000280 |
| Calcium voltage gated channel auxiliary subunit a 2 δ 3 | Cacna2d3 | 2.22072 | 0.0458414 |
| Arginase-1 | Arg1 | 1.68593 | 0.0405366 |
TABLE II.
Genes downregulated in hypoxic Colon38 tumor samples
| Gene Name of Downregulated Genes | Gene Symbol | Fold Change (log2) | q Value |
|---|---|---|---|
| Zinc finger protein 76 | Zfp523 | −11.3391 | 0.00021905 |
| Negative regulator of reactive oxygen species | Nrros | −8.59489 | 0.0013551 |
| Meiotic recombination protein | Rec8 | −7.96827 | 0.0005818 |
| Slit guidance ligand 3 | Slit3 | −7.6971 | 0.0018536 |
| SH3 domain binding protein 4 | Sh3bp4 | −7.60566 | 0.0239417 |
| LYR motif containing 9 | Lyrm9 | −6.94781 | 0.0066876 |
| Glucose-fructose oxidoreductase domain containing 2 | Gfod2 | −6.87275 | 0.0088655 |
| Solute carrier family 26 member 6 | Slc26a6 | −6.0431 | 0.0421098 |
| Upstream transcription family factor 3 | Gm608 | −6.24632 | 0.0421098 |
| WD repeat domain 5 | Wdr5 | −6.37395 | 0.0316623 |
| Zinc finger protein 995 | 2210404009 Rik | −5.72033 | 0.0480182 |
| Ubiquilin 4 | Ubin4 | −5.66102 | 0.0010099 |
| Predicted gene 26869 | Gm26869 | −5.07905 | 0.0493989 |
| Zinc finger DHHC-type containing 17 | Zdhhc17 | −5.07905 | 0.0493989 |
| IFN-γ–inducible lysosomal thiol reductase | lfi30 | −4.07908 | 0.0006515 |
IPA was used to cluster genes into families to better understand how these differentially expressed genes are altered by hypoxia. IPA demonstrated that three out of four top transcriptional regulators in hypoxic samples were involved in vessel formation. Genes involved in formation of neovessels and vasculogenesis were enhanced in hypoxic samples compared with normoxic samples (Supplemental Fig. 1A, 1B). Expression of genes involved in tissue homeostasis and development, cellular growth and development, and embryonic development was increased, as observed from the heat map (Supplemental Fig. 1C). In conclusion, these results further validate that hypoxic regions have been correctly identified and that the tumor cells respond by trying to increase the vasculature density.
Hypoxia downregulates MHC I expression on tumor cells in vitro
Many different types of tumors can downreguate MHC I as an immune evasion strategy, as these molecules, complexed with Ag, are essential targets for cytolytic T cells. An example is the B16 melanoma cell line, which expresses inherently very low levels of MHCI but can be induced with IFN-γ. To determine how hypoxia affects this process, B16 melanoma cells were stimulated with either IFN-γ or vehicle control and then immediately placed in the hypoxic chambers (0.5% O2) for 16, 24, 48, and 72 h as described in Materials and Methods. At 16 h, there was little difference in MHC I expression between the normoxic and hypoxic cells (Fig. 2A). However, over 48 h, the mean fluorescence intensity (MFI) of MHC I expression increased from 3,000 to 15,000 in normoxic IFN-γ–stimulated samples, suggesting an IFN-γ–dependent upregulation of MHC I genes. Interestingly, hypoxia markedly inhibited this IFN-γ–stimulated MHCI upregulation on the tumor cells. Live and dead (trypan blue–negative and –positive) tumor cells were recorded, and no difference in dead cell numbers was observed in hypoxic samples (data not shown). However, fewer cells overall were recorded in hypoxic samples compared with normoxic samples, suggesting hypoxic inhibition of tumor cell proliferation. In addition, Line 1, a BALB/c tumor cell line whose MHC I expression is also normally low but IFN-γ inducible, also exhibited similar inhibition of IFN-γ–induced MHC I expression with hypoxia (Supplemental Fig. 2). Therefore, when tumor cell lines expressed low levels of MHC I, their induction by IFN-γ is suppressed under hypoxia.
FIGURE 2. Hypoxia downregulates MHC I expression on tumor cells.

Surface expression of MHC I proteins. (A) Murine B16 melanoma tumor cells were stimulated with either IFN-γ or vehicle followed by hypoxic treatment for 16 (left panel) and 48 (right panel) h. Representative histograms from one of three similar experiments. MFI of vehicle-treated tumor cells represented by solid dark line (normoxic) and dotted line (hypoxic condition). IFN-γ–stimulated tumor cells represented by solid gray (normoxic) and long dashes (hypoxic treatment). (B) Surface expression of MHC I proteins on B16 melanoma tumor cells stimulated with IFN-γ followed by normoxic (circles) and hypoxic (squares) treatment for 16, 24, and 48 h. (C) Surface expression of basal level MHC I proteins on Colon38 tumor cells following normoxic (circles) and hypoxic (squares) treatment for 6, 12, 24, and 48 h. Hypoxic = 0.5% O2; normoxic = 21% O2. Line graphs represent an average of three experiments (n = 3). Error bars depict ±SEM. Differences between means of vehicle or IFN-γ–stimulated groups over time were evaluated using two-way ANOVA. *p < 0.05.
We tested the effect of hypoxia on MHC I expression on Colon38, which naturally expresses a high basal level of MHC I protein. Interestingly, hypoxia resulted in a statistically significant inhibition of basal MHC I expression. The mean MFI of MHC I was reduced from 1462 to 1151 at 24 h and from 1223 to 749 at 48 h with hypoxia (0.5% O2) (Fig. 2C). Therefore, when MHC I expression is low basally (B16 and Line 1) or intrinsically higher (Colon38), exposure to hypoxia results in loss of expression that is proportional to the time under hypoxia.
Hypoxia inhibits IFN-γ–stimulated genes in tumor cells
Because hypoxia suppressed IFN-γ–induced MHCI epression, we reasoned that other IFN-γ–induced genes that regulate immune responses may also be reduced. Therefore, we examined this in vitro using Colon38 tumor cells stimulated with IFN-γ and cultured for 6 h under hypoxic (0.5% O2) or normoxic (21% O2) conditions and measured the expression of IFN-γ–stimulated genes using real-time PCR. PHD3 was used as a positive control, as the expression of this gene is known to be upregulated under hypoxic conditions. As expected, we observed (Fig. 3A) a 6-fold increase in PHD3 mRNA in the hypoxic cells compared with the normoxic controls. Importantly, hypoxia resulted in a significant decrease in mRNA levels for IFN-γ–stimulated genes, including IP-10 (CXCL10), MIG (CXCL9), and IDO (Fig. 3B–D). Similar results were also observed in the human tumor cell lines HeLa (Supplemental Fig. 3A–E) and MCF7 (data not shown).
FIGURE 3. Hypoxia inhibits IFN-γ–stimulated gene expression in mouse tumor cells.

Expression of IFN-γ–stimulated genes in Colon38 tumor cells. (A–D) mRNA levels of (A) PHD-3 and IFN-γ–stimulated genes (B) CXCL10, (C) CXCL9, and (D) IDO were analyzed using quantitative RT-PCR (qRT-PCR) following stimulation of Colon38 tumor cells with IFN-γ or vehicle control and incubated under hypoxic and normoxic conditions for 6 h. All genes were normalized to GAPDH and compared with a normoxic untreated sample. Bar graphs represent an average of three experiments (n = 3). Error bars depict ±SEM. Differences between means of vehicle or IFN-γ–stimulated groups were evaluated using Kruskal–Wallis test. **p < 0.01, ***p < 0.001. (E) Colon38 tumor cells were transfected with small interfering RNA against HIF-1α (siHIF1α) or nonbinding control sequence (siCon), stimulated with IFN-γ or vehicle control, and incubated under hypoxic conditions for 3 h. The mRNA levels of the IFN-γ–stimulated gene IDO was analyzed using qRT-PCR. Values were normalized to GAPDH and compared with a normoxic untreated sample. Three replicate experiments were performed. Error bars depict ±SEM.
To test whether hypoxia altered the expression of IFN-γ–inducible genes in immune cells, we cultured human PBMCs under normoxic or hypoxic conditions after stimulation with either vehicle control or IFN-γ. Interestingly, we observed inhibition of IFN-γ–stimulated genes in PBMCs (Supplemental Fig. 3F–J), indicating that immune cells respond similarly to tumor cells under hypoxic conditions.
We next explored whether HIF-1 plays a role in this suppression. HIF-1 protein expression is stabilized during hypoxic conditions, and it regulates the cellular responses during periods of low oxygen tension through the expression of genes related to survival. Interestingly, tumor cells in which HIF-1a was reduced by small interfering RNA still demonstrated an inhibition of IFN-γ–inducible gene expression during hypoxia (Fig. 3E). Additional experiments verified that the small interfering RNA against HIF-1α effectively downregulated HIF-1α protein (Supplemental Fig.4). These data suggest that the hypoxia-induced suppression of IFN-γ is independent of HIF-1. Therefore, hypoxia could mediate immune suppression by inhibiting responsiveness to IFN-γ via a HIF-1–independent mechanism.
Hypoxia downregulates effector function and proliferative capacity of Ag-specific CD8+ T cells
Intratumoral T cell infiltration is a positive prognostic factor in many malignancies (42, 43). Our data demonstrate that hypoxia downregulates many of the IFN-γ–inducible chemokines responsible for attracting T cells into the TME. Therefore, we hypothesized that fewer CD8+ T cells would be present in hypoxic regions of Colon38 tumors. To test this, we harvested Colon38 tumors 11 d after tumor inoculation. Sections were fixed, double-stained with anti-CD8 for T cells and the hypoxia markeranti-EF5 Ab ELK-3–51-Cy3, and large montage images of the entire tumor were visualized using fluorescence microscopy. Unexpectedly, CD8+ T cell densities were similar in EF5+ (hypoxic) and EF5− (normoxic) tumor regions (Fig. 4A). Although similar numbers of CD8+ T cells were present in the hypoxic regions, we hypothesized that T cells in these regions may exhibit different functional capabilities. To test this in vitro, we used splenic and lymph node cells from OT I TCR transgenic mice, whose CD8+ T cells have the ability to recognize OVA peptide residue 257–264 in the context of H-2Kb. Following a 24-h peptide activation, cells were made hypoxic (0.5% O2) for an additional 24 h, and production of intracellular IFN-γ protein was analyzed by flow cytometry. Hypoxia inhibited the ability of OT I–specific CD8+ T cells to generate IFN-γ. Forexample, 25% of CD45+CD8+ T cells produced IFN-γ under normoxic (21% O2) conditions, whereas only 15% of hypoxic (0.5% O2) CD45+CD8+ T cells produced this cytokine (Fig. 4B). In addition to Ag-specific activation, T cells undergo extensive proliferation, which occurs initially in the lymph node but also occurs in situ within the TME (44). We tested the effect of hypoxia on T cell proliferation in vitro. Cell Trace Violet–labeled splenic and lymph node cells from OT I mice were activated in the same manner as mentioned before. Postactivation cells were made hypoxic for 41 h, and the extent of proliferation was subsequently analyzed by flow cytometry. Hypoxic cells underwent two fewer rounds of divisions compared with normoxic controls (Fig. 4C). Under normoxic conditions, all Ag-specific CD45+CD8+ T cells proliferated; however, under hypoxic conditions, 21% of the original cell population remained undivided. Importantly, we were able to rescue the effector function of Ag-specific hypoxic CD8+ T cells to generate IFN-γ upon reoxygenation (21% O2), suggesting that the rapies targeting tumor hypoxia could also improve CD8+ T cell function (Fig. 4D). Thus, hypoxia reduced both the activation and the proliferative capacity of Ag-specific CD45+CD8+ T cells compared with normoxic controls.
FIGURE 4. Hypoxic Ag-specific CD8+ T cells are less functional and less proliferative.

Effect of hypoxia on CD8+ T cells. (A) Quantification of CD8+ T cell distribution in hypoxic (ELK-Cy3+) or normoxic (ELK-Cy3−) Colon38 tumor samples. Fluorescent immunohistochemistry images from tumor-bearing mice (day 11 after tumor inoculation) were labeled with anti-CD8 and ELK-Cy3 Abs. Using these images, CD8+ T cell densities were calculated. Each dot represents one tumor section; three to eight sections were analyzed per tumor (one tumor per mouse). Circles and squares represent CD8+ T cell density in normoxic (n = 17) areas and hypoxic areas (n = 8), respectively. Error bars depict ±SEM. Differences between means were analyzed using an unpaired t test. p = 0.2793. (B) A total of 5 × 10⁶ OT-1 splenic and lymph node cells were stimulated with SIINFEKL at a concentration of 12.5 mg/ml for 24 h. Following antigenic stimulation, cells were incubated under hypoxic (0.5% O2) or normoxic (21% O2) conditions for another 24 h. Cells were surface-stained for CD45 and CD8 and fixed, and intracellular cytokine IFN-γ was analyzed using flow cytometry. Representative dot plot images (left). Bar graphs (right) represent an average of three experiments (n = 3). Error bars depict ±SEM. Differences between means were analyzed using a Mann–Whitney U test. **p < 0.01. (C) Cell Trace Violet (CTV)–labeled cells were stimulated with OVA peptide fragment (SIINFEKL) at a concentration of 12.5 μg/ml for 24 h. Following antigenic stimulation, OT-1 cells were incubated under hypoxic (0.5% O2) or normoxic (21% O2) conditions for another 24 h. Cells were surface-stained for CD45 and CD8 and fixed, and CTV fluorescence was analyzed using flow cytometry. Representative histograms from one of three similar experiments. (D) A total of 5 × 10⁶ OT-1 splenic and lymph node cells were stimulated with SIINFEKL at a concentration of 12.5 μg/ml for 24 h. Following antigenic stimulation, cells were incubated under hypoxic (0.5% O2) or normoxic (21% O2) conditions for 0, 16, 26, and 44 h. One set of hypoxic (26 h) cells was reoxygenated at 16 h, and the culture continued under normoxic (21% O2) conditions. Cells were surface-stained for CD45 and CD8 and fixed, and intracellular cytokine IFN-γ was analyzed using flow cytometry. Line graphs represent an average of three experiments (n = 3). Error bars depict ±SEM. Means were compared using ordinary two-way ANOVA. *p < 0.05, **p < 0.01.
RT reduces tumor hypoxia
It is well documented that tumor hypoxia offers resistance to RT (3). Hypoxic cells require 3-fold more radiation to cause the same amount of damage as normoxic cells (11). However, much less is known about how RT may alter the oxygenation of tumors (45). To study the effect of a single ablative dose of RT on tumor hypoxia in vivo, we treated Colon38 tumors with 15-Gy local radiation 7 d after tumor inoculation. On days 7, 9, and 11, the mice received EF5, tumors were harvested, and hypoxic (EF5+) cells were measured by flow cytometry. Mice that did not receive EF5 were used as controls (Fig. 5A). Over time, we observed a significant increase in the percentage of hypoxic cells in untreated tumors (Fig. 5B). We observed a significant increase in levels of hypoxia from 5% of all cells (immune and tumor) 7 d after tumor inoculation to 30% 11 d after tumor inoculation. Irradiated tumors 11 d after tumor inoculation demonstrated a significantly lower percentage of hypoxic cells (6–7%) compared with untreated tumors (30%). In similarly sized tumors (9 d after tumor inoculation), irradiated tumors had a lower percentage of hypoxic cells compared with untreated controls, although this was not statistically significant.
FIGURE 5. Radiotherapy reduces tumor hypoxia.

A total of 1 × 10⁵ Colon38 tumor cells were injected i.m. into the left thighs of C57BL/6 mice. Seven days after tumor inoculation, mice were either treated with 15-Gy local radiation or left untreated. Tumors were harvested 7, 9, and 11 d postinoculation. To measure intratumoral hypoxia, mice were given EF5, the tumors were removed 3 h later, and the dissociated cells were labeled with ELK-3–51-Cy3 Ab and analyzed using flow cytometry. (A) Top panels demonstrate the gating strategy. Dot plot on top left is representative of a mouse that did not receive EF5 and was used as a negative control. (B) Panel represents the ELK-3–51-Cy3+ population referred to as total (tumor and immune cell) hypoxia. Total hypoxia (y-axis) from tumors harvested at the indicated time points was plotted, with each dot representing an individual tumor (one tumor per mouse). Means at each time point were analyzed using ordinary one-way ANOVA. ***p < 0.001, ****p < 0.0001. (n = 5–10). (C) Eleven days after tumor inoculation, tumors were harvested, and 100-μm sections were prepared. Sections were fixed, labeled with ELK-3–51-Cy3, and analyzed using conventional microscopy. Red represents hypoxic areas. Scale bars, 1 mm (untreated), 500 μm (irradiated). Panels depict representative tumor images. Mean EF5/ELK-Cy3 intensity is represented as (D) a function of pixels per square millimeter and (E) a percentage of total area of the section in irradiated and untreated tumor samples. (F) Mean EF5/ELK-Cy3 intensity. Each dot represents a representative section from one tumor per mouse (untreated n = 6; irradiated n = 3). Three to eight sections were analyzed per tumor. Error bars depict ±SEM. Means were compared using Mann–Whitney U test. **p < 0.01.
To complement these data, we used microscopy to visualize and compare hypoxic EF5+ tumor regions in irradiated and untreated Colon38 tumor samples collected 11 d after tumor inoculation and stained with anti-EF5 Ab. Similar to the flow cytometry results, we saw fewer bright hypoxic areas in irradiated tumors compared with untreated tumors (Fig. 5C). We used image analysis software CellSense and Image Pro to quantify the intensity of ELK-3–51-Cy3 binding and hypoxic areas, represented in percentages and square millimeters of total tumor area. Irradiated tumors had reduced intensity of staining and hypoxic area compared with untreated controls (Fig. 5D–F). Overall, these data demonstrate that a single ablative dose of radiation was able to reduce tumor hypoxia in a mouse model.
DISCUSSION
In this study, we demonstrated a unique mechanism of hypoxia-induced immune evasion by tumor cells with possible implications for antitumor therapies. We observed that hypoxia causes inhibition of IFN-γ–dependent genes CXCL9, CXCL10, and IDO in human and murine tumor cell lines and human PBMCs, suggesting a global mechanism of hypoxia-induced immune evasion. Because these chemokines are essential for increasing trafficking of effector immune cells such as CD8+ T cells into tumors, their downregulation may impede the infiltration of immune cells into hypoxic regions. A similar mechanism of reduced responsiveness has been reported in human adipocytes, which, when cultured in hypoxic conditions, demonstrated reduced responsiveness to TNF-α, resulting in diminished NF-κb signaling and MCP-1 (MCP-1/CCL2) secretion (46). The molecular mechanism that governs immune suppression by tumor cells under hypoxic conditions remains unknown. We investigated this unique phenomenon and demonstrated that hypoxia-induced immune suppression by tumor cells is HIF-1–independent. Studies have demonstrated that hypoxia can target specific molecules of the IFN-γ signaling pathway such as STAT-1 and, hence, reduce the ability of tumor cells to respond to IFN-γ. Treatment of endothelial cells with a hypoxia mimetic resulted in inhibition of STAT-1 activation and downregulation of the IFN-γ receptor 1, suggesting a possible mechanism of hypoxia-induced immune suppression (47).
In addition to hypoxia-induced reduction in responsiveness, we demonstrated another mechanism of immune escape. Tumor cells can downregulate expression of MHC I molecules, thus markedly reducing their recognition via the TCR on cytotoxic CD8+ T cells. However, IFN-γ produced by activated T cells can increase MHC I expression, thus at least partially restoring their susceptibility to lysis. However, this upregulation is inhibited by hypoxia. Tumor cells can also express another set of molecules known as MHC I chain–related (MIC) molecules, which bind to activating NKG2D receptors on NK cells and CD8+ T cells, resulting in tumor cell killing. However, tumor cells can also shed these MIC molecules, resulting in an excess of soluble ligands that downregulate the expression of NKG2D on host immune cells and render the tumors less susceptible to lysis. Interestingly, Siemens et al. (48) have demonstrated that hypoxia induces this shedding of MIC molecules from tumor cells, which, together with the loss of MHCI molecules, can render them virtually invisible to effector immune cells.
In addition to downregulating immune responsiveness and enhancing tumor vasculogenesis, hypoxia also dampens CD8+ T cell functions. Tumor cytolysis by CD8+ T cells is a multistep process, with activation and proliferation representing the initial steps. At the tumor site, the effector functions of the CD8+ T cells are facilitated by cytokine production. The effect of hypoxia on each step of the cytolytic function of CD8+ T cells has been studied, with various results (18, 23, 26–29). In this study, we have observed that hypoxia inhibits Ag-specific CD8+ T cell proliferation and effector function. Hypoxic CD8+ T cells underwent fewer rounds of proliferation, suggesting inhibition of an ongoing immune response. In addition, they were unable to generate a similar amount of IFN-γ when compared with normoxic controls. Together, these results suggest a suppressive effect of hypoxia on CD8+ T cells. Interestingly, when hypoxic cells are reoxygenated, they can recover the ability to generate IFN-γ, suggesting that effector responses are reversible and cells are metabolically active. Therapies that target or result in reoxygenation of tumors can rescue the ability of immune cells to generate IFN-γ, therefore maintaining effective antitumor immune response. Furthermore, in this study, we observed a reduction in frequency of hypoxic (tumor and immune) cells in Colon38 tumors with a single ablative dose of 15-Gy radiation, suggesting a possible role of reoxygenation of tumors during this schedule of radiation treatment. Irradiating tumors results in tumor cell killing, thereby reducing the demand of oxygen, and thus improving tumor oxygenation status. To summarize, we propose that therapies that are designed to target tumor hypoxia can enhance antitumor immune responses by improving IFN-γ responsiveness of tumor cells, enhancing tumor recognition and targeting, normalizing tumor vasculature, and optimizing CD8+T cell effector function.
Supplementary Material
ACKNOWLEDGMENTS
The authors acknowledge Dr. John Ashton and Michelle Zanche at the University of Rochester Genomics Research Core for assistance.
This work was supported by National Cancer Institute of the National Institutes of Health Grant R01 CA028332 (to E.M.L.) and the American Association of Immunologists Fellowship Program.
Abbreviations used in this article:
- HIF-1
hypoxia inducible factor-1
- IPA
Ingenuity Pathway Analysis
- MFI
mean fluorescence intensity
- MHC I
MHC class I
- MIC
MHC I chain–related
- PAB
PBS/1% BSA/0.1% azide
- PHD3
prolyl hydroxylase 3
- RNA-seq
RNA sequencing
- RT
radiotherapy
- TME
tumor microenvironment
- VEGF-A
vascular endothelial growth factor-A
Footnotes
The online version of this article contains supplemental material.
DISCLOSURES
The authors have no financial conflicts of interest.
REFERENCES
- 1.Brown JM 2007. Tumor hypoxia in cancer therapy. Methods Enzymol. 435: 297–321. [DOI] [PubMed] [Google Scholar]
- 2.Brown JM 2002. Tumor microenvironment and the response to anticancer therapy. Cancer Biol. Ther. 1: 453–458. [DOI] [PubMed] [Google Scholar]
- 3.Thomlinson RH 1977. Hypoxia and tumours. J. Clin. Pathol. Suppl. (R Coll Pathol) 11: 105–113. [DOI] [PMC free article] [PubMed] [Google Scholar]
- 4.Thomlinson RH, and Gray LH. 1955. The histological structure of some human lung cancers and the possible implications for radiotherapy. Br. J. Cancer 9: 539–549. [DOI] [PMC free article] [PubMed] [Google Scholar]
- 5.Semenza GL 2012. Hypoxia-inducible factors: mediators of cancer progression and targets for cancer therapy. Trends Pharmacol. Sci. 33: 207–214. [DOI] [PMC free article] [PubMed] [Google Scholar]
- 6.Schito L, and Semenza GL. 2016. Hypoxia-inducible factors: master regulators of cancer progression. Trends Cancer 2: 758–770. [DOI] [PubMed] [Google Scholar]
- 7.Chouaib S, Noman MZ, Kosmatopoulos K, and Curran MA. 2017. Hypoxic stress: obstacles and opportunities for innovative immunotherapy of cancer. Oncogene 36: 439–445. [DOI] [PMC free article] [PubMed] [Google Scholar]
- 8.Lee J, Siemann DW, Koch CJ, and Lord EM. 1996. Direct relationship between radiobiological hypoxia in tumors and monoclonal antibody detection of EF5 cellular adducts. Int. J. Cancer 67: 372–378. [DOI] [PubMed] [Google Scholar]
- 9.Evans SM, Jenkins WT, Joiner B, Lord EM, and Koch CJ. 1996. 2-Nitroimidazole (EF5) binding predicts radiation resistance in individual 9L s.c. tumors. Cancer Res. 56: 405–411. [PubMed] [Google Scholar]
- 10.Lee J, Moran JP, Fenton BM, Koch CJ, Frelinger JG, Keng PC, and Lord EM. 2000. Alteration of tumour response to radiation by interleukin-2 gene transfer. Br. J. Cancer 82: 937–944. [DOI] [PMC free article] [PubMed] [Google Scholar]
- 11.Koch CJ 2002. Measurement of absolute oxygen levels in cells and tissues using oxygen sensors and 2-nitroimidazole EF5. Methods Enzymol. 352: 3–31. [DOI] [PubMed] [Google Scholar]
- 12.Carmeliet P, and Jain RK. 2000. Angiogenesis in cancer and other diseases. Nature 407: 249–257. [DOI] [PubMed] [Google Scholar]
- 13.Movahedi K, Laoui D, Gysemans C, Baeten M, Stangé G, Van den Bossche J, Mack M, Pipeleers D, In’t Veld P, De Baetselier P, and Van Ginderachter JA. 2010. Different tumor microenvironments contain functionally distinct subsets of macrophages derived from Ly6C(high) monocytes. Cancer Res. 70: 5728–5739. [DOI] [PubMed] [Google Scholar]
- 14.Van Overmeire E, Laoui D, Keirsse J, and Van Ginderachter JA. 2014. Hypoxia and tumor-associated macrophages: A deadly alliance in support of tumor progression. OncoImmunology 3: e27561. [DOI] [PMC free article] [PubMed] [Google Scholar]
- 15.Gerber SA, Lim JY, Connolly KA, Sedlacek AL, Barlow ML, Murphy SP, Egilmez NK, and Lord EM. 2014. Radio-responsive tumors exhibit greater intratumoral immune activity than non-responsive tumors. Int. J. Cancer 134: 2383–2392. [DOI] [PMC free article] [PubMed] [Google Scholar]
- 16.Gerber SA, Sedlacek AL, Cron KR, Murphy SP, Frelinger JG, and Lord EM. 2013. IFN-γ mediates the antitumor effects of radiation therapy in a murine colon tumor. Am. J. Pathol. 182: 2345–2354. [DOI] [PMC free article] [PubMed] [Google Scholar]
- 17.Lugade AA, Sorensen EW, Gerber SA, Moran JP, Frelinger JG, and Lord EM. 2008. Radiation-induced IFN-γamma production within the tumor microenvironment influences antitumor immunity. J. Immunol. 180: 3132–3139. [DOI] [PubMed] [Google Scholar]
- 18.Robbins JR, Lee SM, Filipovich AH, Szigligeti P, Neumeier L, Petrovic M, and Conforti L. 2005. Hypoxia modulates early events in T cell receptor-mediated activation in human T lymphocytes via Kv1.3 channels. J. Physiol. 564: 131–143. [DOI] [PMC free article] [PubMed] [Google Scholar]
- 19.Conforti L, Petrovic M, Mohammad D, Lee S, Ma Q, Barone S, and Filipovich AH. 2003. Hypoxia regulates expression and activity of Kv1.3 channels in T lymphocytes: a possible role in T cell proliferation. J. Immunol. 170: 695–702. [DOI] [PubMed] [Google Scholar]
- 20.Lee J, Fenton BM, Koch CJ, Frelinger JG, and Lord EM. 1998. Interleukin 2 expression by tumor cells alters both the immune response and the tumor microenvironment. Cancer Res. 58: 1478–1485. [PubMed] [Google Scholar]
- 21.Loeffler DA, Keng PC, Baggs RB, and Lord EM. 1990. Lymphocytic infiltration and cytotoxicity under hypoxic conditions in the EMT6 mouse mammary tumor. Int. J. Cancer 45: 462–467. [DOI] [PubMed] [Google Scholar]
- 22.Hatfield SM, Kjaergaard J, Lukashev D, Schreiber TH, Belikoff B, Abbott R, Sethumadhavan S, Philbrook P, Ko K, Cannici R, et al. 2015. Immunological mechanisms of the antitumor effects of supplemental oxygenation. Sci. Transl. Med. 7: 277ra30. [DOI] [PMC free article] [PubMed] [Google Scholar]
- 23.Caldwell CC, Kojima H, Lukashev D, Armstrong J, Farber M, Apasov SG, and Sitkovsky MV. 2001. Differential effects of physiologically relevant hypoxic conditions on T lymphocyte development and effector functions. J. Immunol. 167: 6140–6149. [DOI] [PubMed] [Google Scholar]
- 24.Nakagawa Y, Negishi Y, Shimizu M, Takahashi M, Ichikawa M, and Takahashi H. 2015. Effects of extracellular pH and hypoxia on the function and development of antigen-specific cytotoxic T lymphocytes. Immunol. Lett. 167: 72–86. [DOI] [PubMed] [Google Scholar]
- 25.Vuillefroy de Silly R, Dietrich PY, and Walker PR. 2016. Hypoxia and antitumor CD8+ T cells: an incompatible alliance? OncoImmunology 5: e1232236. [DOI] [PMC free article] [PubMed] [Google Scholar]
- 26.Vuillefroy de Silly R, Ducimetière L, Yacoub Maroun C, Dietrich PY, Derouazi M, and Walker PR. 2015. Phenotypic switch of CD8(+) T cells reactivated under hypoxia toward IL-10 secreting, poorly proliferative effector cells. Eur. J. Immunol. 45: 2263–2275. [DOI] [PMC free article] [PubMed] [Google Scholar]
- 27.Gropper Y, Feferman T, Shalit T, Salame TM, Porat Z, and Shakhar G. 2017. Culturing CTLs under hypoxic conditions enhances their cytolysis and improves their antitumor function. Cell Reports 20: 2547–2555. [DOI] [PubMed] [Google Scholar]
- 28.Doedens AL, Phan AT, Stradner MH, Fujimoto JK, Nguyen JV, Yang E, Johnson RS, and Goldrath AW. 2013. Hypoxia-inducible factors enhance the effector responses of CD8(+) T cells to persistent antigen. Nat. Immunol. 14: 1173–1182. [DOI] [PMC free article] [PubMed] [Google Scholar]
- 29.Finlay DK, Rosenzweig E, Sinclair LV, Feijoo-Carnero C, Hukelmann L, Rolf J, Panteleyev AA, Okkenhaug K, and Cantrell DA. 2012. PDK1 regulation of mTOR and hypoxia-inducible factor 1 integrate metabolism and migration of CD8+ T cells. J. Exp. Med. 209: 2441–2453. [DOI] [PMC free article] [PubMed] [Google Scholar]
- 30.Sitkovsky MV 2003. Use of the A(2A) adenosine receptor as a physiological immunosuppressor and to engineer inflammation in vivo. Biochem. Pharmacol. 65: 493–501. [DOI] [PubMed] [Google Scholar]
- 31.Gerber SA, Yatsula B, Maier CL, Sadler TJ, Whittaker LW, and Pober JS. 2009. Interferon-gamma induces prolyl hydroxylase (PHD)3 through a STAT1-dependent mechanism in human endothelial cells. Arterioscler. Thromb. Vasc. Biol. 29: 1363–1369. [DOI] [PMC free article] [PubMed] [Google Scholar]
- 32.Limoge M, Safina A, Beattie A, Kapus L, Truskinovsky AM, and Bakin AV. 2017. Tumor-fibroblast interactions stimulate tumor vascularization by enhancing cytokine-driven production of MMP9 by tumor cells. Oncotarget 8: 35592–35608. [DOI] [PMC free article] [PubMed] [Google Scholar]
- 33.Proulx-Bonneau S, Guezguez A, and Annabi B. 2011. A concerted HIF-1a/MT1-MMP signalling axis regulates the expression of the 3BP2 adaptor protein in hypoxic mesenchymal stromal cells. PLoS One 6: e21511. [DOI] [PMC free article] [PubMed] [Google Scholar]
- 34.Proulx-Bonneau S, and Annabi B. 2011. The primary cilium as a biomarker in the hypoxic adaptation of bone marrow-derived mesenchymal stromal cells: a role for the secreted frizzled-related proteins. Biomark. Insights 6: 107–118. [DOI] [PMC free article] [PubMed] [Google Scholar]
- 35.Fan C, Chen L, Huang Q, Shen T, Welsh EA, Teer JK, Cai J, Cress WD, and Wu J. 2015. Overexpression of major CDKN3 transcripts is associated with poor survival in lung adenocarcinoma. Br. J. Cancer 113: 1735–1743. [DOI] [PMC free article] [PubMed] [Google Scholar]
- 36.Ren L, Yu Y, Wang L, Zhu Z, Lu R, and Yao Z. 2016. Hypoxia-induced CCL28 promotes recruitment of regulatory T cells and tumor growth in liver cancer. Oncotarget 7: 75763–75773. [DOI] [PMC free article] [PubMed] [Google Scholar]
- 37.Facciabene A, Peng X, Hagemann IS, Balint K, Barchetti A, Wang LP, Gimotty PA, Gilks CB, Lal P, Zhang L, and Coukos G. 2011. Tumour hypoxia promotes tolerance and angiogenesis via CCL28 and T(reg) cells. Nature 475: 226–230. [DOI] [PubMed] [Google Scholar]
- 38.Tang J, Xiao L, Cui R, Li D, Zheng X, Zhu L, Sun H, Pan Y, Du Y,a nd X. Yu. 2016. CX3CL1 increases invasiveness and metastasis by promoting epithelial-to-mesenchymal transition through the TACE/TGF-a/EGFR pathway in hypoxic androgen-independent prostate cancer cells. Oncol. Rep. 35: 1153–1162. [DOI] [PubMed] [Google Scholar]
- 39.Safford M, Collins S, Lutz MA, Allen A, Huang CT, Kowalski J, Blackford A, Horton MR, Drake C, Schwartz RH, and Powell D. 2005. Egr-2 and Egr-3 are negative regulators of T cellactivation. [Published erratum appears in 2005 Nat. Immunol. 6: 737.] Nat. Immunol. 6: 472–480. [DOI] [PubMed] [Google Scholar]
- 40.Williams JB, Horton BL, Zheng Y, Duan Y, Powell JD, and Gajewski TF. 2017. The EGR2 targets LAG-3 and 4–1BB describe and regulate dysfunctional antigen-specific CD8+ T cells in the tumor microenvironment. J. Exp. Med. 214: 381–400. [DOI] [PMC free article] [PubMed] [Google Scholar]
- 41.Gabrilovich DI 2017. Myeloid-derived suppressor cells. Cancer Immunol. Res. 5: 3–8. [DOI] [PMC free article] [PubMed] [Google Scholar]
- 42.Galon J, Costes A, Sanchez-Cabo F, Kirilovsky A, Mlecnik B, Lagorce-Pagès C, Tosolini M, Camus M, Berger A, Wind P, et al. 2006. Type, density, and location of immune cells within human colorectal tumors predict clinical outcome. Science 313: 1960–1964. [DOI] [PubMed] [Google Scholar]
- 43.Fridman WH, Dieu-Nosjean MC, Pagès F, Cremer I, Damotte D, Sautès-Fridman C, and Galon J. 2013. The immune microenvironment of human tumors: general significance and clinical impact. Cancer Microenviron. 6: 117–122. [DOI] [PMC free article] [PubMed] [Google Scholar]
- 44.Engelhard VH, Rodriguez AB, Mauldin IS, Woods AN, Peske JD, and Slingluff CL Jr. 2018. Immune cell infiltration and tertiary lymphoid structures as determinants of antitumor immunity. J. Immunol. 200: 432–442. [DOI] [PMC free article] [PubMed] [Google Scholar]
- 45.Fenton BM, Lord EM, and Paoni SF. 2001. Effects of radiation on tumor intravascular oxygenation, vascular configuration, development of hypoxia, and clonogenic survival. Radiat. Res. 155: 360–368. [DOI] [PubMed] [Google Scholar]
- 46.Famulla S, Horrighs A, Cramer A, Sell H, and Eckel J. 2012. Hypoxia reduces the response of human adipocytes towards TNFα resulting in reduced NF- κB signaling and MCP-1 secretion. Int. J. Obes. (Lond.) 36: 986–992. [DOI] [PubMed] [Google Scholar]
- 47.Gira AK, Kowalczyk AP, Feng Y, and Swerlick RA. 2009. Iron chelators and hypoxia mimetics inhibit IFNgamma-mediated JakSTAT signaling. J. Invest. Dermatol. 129: 723–729. [DOI] [PubMed] [Google Scholar]
- 48.Siemens DR, Hu N, Sheikhi AK, Chung E, Frederiksen LJ, Pross H, and Graham CH. 2008. Hypoxia increases tumor cell shedding of MHC class I chain-related molecule: role of nitric oxide. Cancer Res. 68: 4746–4753. [DOI] [PubMed] [Google Scholar]
Associated Data
This section collects any data citations, data availability statements, or supplementary materials included in this article.