

Abstract
Chlorinated dibenzo-p-dioxins (CDDs) are a series of mono- to octa-chlorinated homologous chemicals commonly referred to as polychlorinated dioxins. One of the most potent, well-known, and persistent member of this family is 2,3,7,8-tetrachlorodibenzo-p-dioxin (TCDD).
As part of translational research to make computerized models accessible to health risk assessors, we present a Berkeley Madonna recoded version of the human physiologically based pharmacokinetic (PBPK) model used by the U.S. Environmental Protection Agency (EPA) in the recent dioxin assessment. This model incorporates CYP1A2 induction, which is an important metabolic vector that drives dioxin distribution in the human body, and it uses a variable elimination half-life that is body burden dependent. To evaluate the model accuracy, the recoded model predictions were compared with those of the original published model. The simulations performed with the recoded model matched well with those of the original model. The recoded model was then applied to available data sets of real life exposure studies. The recoded model can describe acute and chronic exposures and can be useful for interpreting human biomonitoring data as part of an overall dioxin and/or dioxin-like compounds risk assessment.
Keywords: Berkeley-Madonna, Dioxin, PBPK, Risk assessment
1. Introduction
Chlorinated dibenzo-p-dioxins (CDDs) are a series of mono- to octa-chlorinated homologous chemicals commonly referred to as polychlorinated dioxins. The most potent, well-known, and long-lasting member of this family is 2,3,7,8-tetrachlorodibenzo-p-dioxin (TCDD) (ATSDR, 1998, 2012). Dioxins can affect health in many ways including modulation of growth factors and their receptors, immunotoxicity, developmental toxicities and cancer (Devito and Birnbaum, 1994; Emond et al., 2004, 2005). Experimental studies specifically mention TCDD as affecting multiple hormone systems and causing neurotoxicity, reproductive toxicity, immunotoxicity, carcinogenicity, developmental toxicities, ovarian dysfunction, and fetal loss (Birnbaum, 1995; Birnbaum and Tuomisto, 2000; Kogevinas, 2001; WHO, 1998). In addition, dioxin and related dioxin-like (D-DL) chemicals induce several biochemical, physiological, and toxicological responses, including activation of aryl hydrocarbon (Ah) receptors, induction of CYP1A1–2 and 1B isoforms, and modulation of growth factors and their receptors (Birnbaum and Farland, 2003).
Dioxins have been found in at least 126 sites that comprise the National Priorities List that are targeted for long-term federal cleanup (ATSDR, 1998). Dioxins are included in biomonitoring studies worldwide. Numerous programs, recent and ongoing, exist to evaluate environmental exposure of humans to chemicals. Some of these programs are the Expert Team to Support Biomonitoring in Europe [ESBIO], the Consortium to Perform Human Biomonitoring on a European Scale [COPHES], the U.S. CDC National Health and Nutrition Examination Survey (NHANES) (CDC, 2012), and the Canadian Health Measures Survey [CHMS]. The U.S. CDC NHANES is a cross-sectional study of chemical exposures across the United States designed to provide a national representative sample of exposures to adults and children in the general U.S. population (CDC, 2012).
Over the last two decades a number of PBPK and PK models have been published for species such as rodents (mice and rat), trout (fish), and humans (Andersen et al., 1993; Aylward et al., 2005; Carrier et al., 1995; Emond et al., 2004, 2010; Lawrence and Gobas, 1997; Maruyama et al., 2002; Nichols et al., 1998). The distribution of dioxins such as dioxin and dioxin-like (D-DL) is body-burden dependent (Emond et al., 2005). In this process, dioxins PBPK modeling has undergone a constant evolution. The most recent version of the dioxin PBPK model incorporates CYP1A2 induction, an important vector that drives the distribution of dioxins in the human body (Emond et al., 2006). The National Center for Environmental Assessment (NCEA) at the U.S. Environmental Protection Agency (EPA) has used this model to perform a recent dioxin reassessment for human exposure (NCEA-USEPA, 2010). Recently, a new version of the PBPK model built on the same three compartments, but including pregnancy and lactation description was published based on the same basic structure (Emond et al., 2016).
The thrust of our current research work is translational in nature with a goal to make the models easily accessible in a simple simulation language for risk assessors working in field situations. At the outset, we conducted literature review to identify available human PBPK models for the chemicals of interest. Following literature searches of human health-related databases such as Medline, Toxline, and PubMed, we identified several PBPK models. These models varied in their complexity based on the scientific understanding of the chemistry, biological behavior, and insights gained into the mechanism(s) or mode of action of a given chemical’s toxicity. Thus, the models contained different numbers of compartments (e.g., liver, kidney, and other organs). Often the compartments were designed for parent chemicals, but some included metabolite(s). The criteria we used for model selection included critical scientific issues such as the number of datasets used to calibrate and evaluate the model, the model’s maturity (number of predecessor models from which the model was derived), and the author’s experience
The PBPK model described here is based on our previous work of rat TCDD PBPK model for gestational and naïve physiologic conditions extrapolated to the humans (Emond et al., 2003, 2004, 2005). During development of the model, its performance was evaluated using several human datasets (i.e., U.S. Air Force veteran cohort, Viennese women poisoning case, and more recently the Seveso women cohort). It was further modified and improved during the U.S. EPA TCDD reassessment to include gestational exposures (NCEA-USEPA, 2010). Recently, an advanced version of the PBPK model built including pregnancy and lactation has been published based on the same basic structure (Emond et al., 2016). This model has been used by the scientific community and federal agencies such as NIEHS and US EPA and now is being used by European Food Safety Authority.
The aim of this study was to add a dioxin PBPK model to the PBPK tool kit for environmental pollutants, being developed at s the Agency for Toxic Substances and Disease Registry (ATSDR). The following 4-step process was used to achieve this goal: 1) recode the above mentioned dioxin PBPK model into the Berkeley Madonna (BM) platform, 2) assess the performance of the recoded dioxin PBPK model under diverse exposure conditions, 3) compare the accuracy of the recoded model with the original model (Emond et al., 2006), and 4) show the recoded dioxin model’s applicability using actual exposure data from case studies.
2. Method
2.1. Model structure and physiological parameters
We reviewed previously published human PBPK dioxin models, and selected the Emond et al. (2006) model for recoding in BM software (version 8.01 for Microsoft Windows, Kagi Shareware, and Berkeley, CA). This model is an extrapolation of the rat model published by Emond et al. (2004). It contains three compartments (i.e., adipose tissue, liver, and the rest of the body) connected by the systemic circulation (Emond et al., 2004, 2005, 2006). (Supplemental material Fig. S1). The compartments corresponding to the organs or tissues in this PBPK model include those that have majors’ roles in the pharmacokinetics and developmental toxicity of TCDD. Liver and fat were included in the model because they are involved in the metabolism and storage of TCDD respectively, and account for almost 80% of the body burden of TCDD (Carrier, 1991). A blood compartment was kept to describe the systemic circulation and because this tissue is readily sampled in humans. The rest of the body compartment was included in order to achieve mass balance (Emond et al., 2004).
The three compartments are described as diffusion limited. Each compartment contains two sub-compartments, namely cellular matrix and tissue blood, and each uses a permeability constant to maintain a slow tissue distribution of the chemical, reflecting experimental observations. Human physiological and chemical-specific parameters describing the absorption, distribution, and blood and tissue partitioning of TCDD were taken from the literature (Supplemental material Table 1S).
The role of CYP1A2 is very important in the regulation of TCDD distribution and elimination from the body. The induction of CYP1A2 was demonstrated as a direct confirmation of the hypothesis that CYP1A2 is the hepatic binding protein responsible for the sequestration of TCDD and related compounds in the liver (Diliberto et al., 1997). Also, Santostefano et al., 1996 showed that the induction of CYP1A2 was proportional to the TCDD exposure dose which is related to the body burden. More recently, it has been demonstrated that the induction of CYP1A2 is proportional to the elimination of TCDD which mean the increase of the induction will decrease the half-life or increase the elimination (Emond et al., 2006). Induction of CYP1A2 in the liver starts with the interaction of TCDD and the AhR, which will influence (DEFINE THIS Parameter) the variable parameter (KBILE_LI) changing the rate of elimination.
The recoded model mathematically describes the plausible mode of action of TCDD and dioxin-like compounds: that they bind with the aryl hydrocarbon receptor (AhR) in the liver and form a complex that then activates induction of the CYP1A2 enzyme. In addition, the elimination constant of TCDD varies with the body burden of TCDD. Researchers observed a difference in animals and humans exposed to low or high amounts of TCDD that previously was attributed to the adipose tissue fraction (Michalek et al., 2002; Michalek and Tripathi, 1999). It was observed that higher the body burden of TCDD faster, the TCDD elimination rate. Diliberto et al. (1997) demonstrated that the high body burden of TCDD linked to the CYP1A2 enzyme was concentrated in the liver, and proposed that the proximity of elimination route promoted the disposition of TCDD (Diliberto et al., 1997). They established that the half-life can range from 6 months to >20 years, depending on the body burden of TCDD. Based on this observation, the induction process of the CYP1A2 enzyme was incorporated into the model to account for the elimination of TCDD (Emond et al., 2006).
The recoded model describes the oral exposure route, including diet, soil, and/or drinking water, which are the major exposure sources for dioxins. The model provides an intravenous exposure pathway as an alternate way to study the toxicity of TCDD and to optimize the bioavailability. (Appendix A includes codes for this model in the BM format.)
This PBPK model was designed to predict the absorption, the distribution, and the elimination of TCDD or the dioxin-like compounds expressed as WHO-TEQ. We assume that all the dioxin-like compounds are in fact an equivalent concentration of TCDD. Thus the PBPK model acts as a surrogate of the different dioxin-like exposure scenarios. In some examples we use in this paper exposures measured contained not only the TCDD but also the dioxin-like congeners expressed as a toxic equivalency of TCDD.
2.2. Model evaluation
Development of PBPK is data dependent and the model is as good as the data in-put. Hence, only a high quality data must be used to develop, calibrate and validate PBPK models. So special precaution should be taken while considering such data to ensure best analytical methods and practices currently available have been used including those for sample collection, preparation, and storage. This goal is achieved through establishing standard quality assurance and control procedures and using them. Application of certified standards methods will provide an acceptable evaluation of the quality of data in terms of precision, accuracy, representativeness, comparability, completeness and sensitivity in relation to the intended use of the data. Strategic use of harmonized analytical methods will limit inherent errors, biases and uncertainties associated with sampling and analysis procedures across the globe and allow the evolution of reliable data that can be used with confidence.
2.2.1. Simulations for physiological parameters.
Physiological parameters (e.g., body weight, liver, adipose tissue, or the rest of the body compartment) change as a function of the person’s age and body weight. The body weight change is described by using an algorithm (NCEA-USEPA, 2010) (see Eqs. (1)–(3)).
| (1) |
| (2) |
| (3) |
Where;
| WT0FEMALE | = | Body weight of women (kg) |
| WT0MALE | = | Body weight of male (kg) |
| FEMALE | = | Female (Yes = 1; No = 0) |
| MALE | = | Male (Yes = 1; No = 0) |
| GYR | = | Age in term of year used here for the body weight calculation |
| WT0 | = | Body weight (kg) variable use for the simulation |
The parameters of blood flow and weight of each organ or compartment are also related. After recoding the original model in BM, we compared the predictions of the original and the BM recoded model. For this evaluation, we first checked the model for its performance by comparing parameters that change as a function of a person’s age (birth–20 years). When a simulation is performed (using known group or individual information), the parameters of the actual scenario must be described to correctly apply the simulation scenario. We had assessed the original model for predictions and determined that it was accurate at low and high doses. We then wanted to ensure that the recoded BM model expressed similar predictions.
2.2.2. Simulations for dietary exposure of women and men.
To assess how the model behaves for different scenarios, we ran various simulations. First, we performed simulations for women, ages 0–20 years, exposed to an oral intake of 1 × 10⁻⁷ ng TCDD per kilogram of body weight, once per day, corresponding to a hypothetical background exposure, for 20 years. Similar dietary exposure value have been used by Cheng et al. (2006) and NCEA-USEPA (2010), to perform carcinogenic risk assessment. In general, it is accepted that the exposure dose intake for TCDD vary from 0.5 to 1 pg of TCDD/kg of bw/day (or 5.0 × 10⁻⁴ to 1 × 10⁻³ ng of TCDD/kg of bw/d) (Aylward and Hays, 2002).
No other exposure was assumed. We stopped the simulation at age 20 years. We compared the results of the original and the recoded models to verify the accuracy of estimates for organ tissue and blood concentrations. Second, we performed a similar simulation for men (i.e., oral exposure of 1 × 10⁻⁷ ng TCDD per kilogram of body weight, once per day for 20 years). We compared the original and the recoded models for estimates of organ tissue and blood concentrations.
2.2.3. Simulations of dioxin exposure of two Austrian women.
Data were available for two Austrian women who had clinical signs of TCDD intoxication (Geusau et al., 2002). Researchers measured the blood concentrations in samples collected 20 times from one Austrian and 25 from the second one. These women had some of the highest TCDD blood concentrations ever measured in adults (first blood concentrations measured were 26,000 and 144,000 ppt lipid adjusted). The recoded model was used to predict the TCDD blood concentrations.
2.3. Applicability of the recoded PBPK dioxin model to real exposure scenarios
2.3.1. Louisiana population case study.
We applied the recoded dioxin PBPK model to simulate serum concentrations of people living in two Louisiana parishes; the Calcasieu, a potentially exposed (test), and the Lafayette, considered unexposed (control) population (Wong et al., 2008). We compared results for these groups with those for the general US population using data from NHANES (2000–2001), actually reproducing the potential profile of each scenario.
In 2000, Calcasieu Parish industries reported that a significant amount of chemicals had been released in the environment, including 6.92 lb of dioxin and dioxin-like chemicals. In 2002, as part of a response to community concerns about the health impacts of this release, ATSDR conducted a study to determine whether the serum dioxins in this case, TCDD levels in Calcasieu Parish residents aged ≥15 years were elevated. The results were compared with those of the population in Lafayette Parish, which had similar demographics, but significantly less industry (and therefore less potential for exposure to environmental contamination from local industries).
Calcasieu Parish was divided into three sub-areas, with increasing distance from industrial activities/complexes. ATSDR recruited 273 people from Calcasieu Parish and 113 people from Lafayette Parish, and then stratified them by four age groups (15–29 years, 30–44 years, 45–59 years, and ≥60 years). The youngest age group (15–29 years) served as an indicator of the recent potential high dioxins exposure (Wong et al., 2008). Table 1 shows the dioxin and dioxin-like concentrations expressed in World Health Organization Toxic Equivalency per gram (WHO-TEQ ppt lipid adjusted) of the aggregated Calcasieu Parish areas.
Table 1.
Dioxin and dioxin-like serum concentrations (ppt TEQ lipid adjusted) from the stratified population from Calcasieu Parish (exposed) versus Lafayette Parish (not exposed) in Louisiana (Wong et al., 2008).
| Age groups (in years) (mean) | Calcasieu Parish (273) (geometric mean ± SEM) | Lafayette Parish (113) (geometric mean ± SEM) |
|---|---|---|
| 15–29 (22) | 9.4 ± 0.6 | 8.5 ± 0.7 |
| 30–44 (37) | 15.9 ± 1.9 | 17.8 ± 0.8 |
| 45–59 (52) | 23.3 ± 2.5 | 23.8 ± 1.3 |
| ≥60 (65) | 39.2 ± 3.6 | 45.1 ± 5.7 |
Note: SEM = standard error of the mean.
2.3.2. Operation Ranch Hand cohort data case study.
Veterans of Operation Ranch Hand, a defoliation effort in Vietnam, were exposed to TCDD, a contaminant of the herbicide used from 1962 to 1971 (Michalek et al., 1996, 1997). In follow-up studies, blood concentrations were determined at four or five intervals for each veteran, starting in 1982. Body weight and height of each person were used to estimate the body mass index and approximate size of the adipose tissue compartment. We applied the recoded model to estimate the peak TCDD blood concentrations for each person reported in a previous publication, then compared the results with predictions of the original model (Emond et al., 2005).
2.3.3. Seveso women cohort case study.
A chemical explosion on 10 July 1976 near Seveso, Italy contaminated the area with TCDD (Warner et al., 2014). A population of women, the “Seveso cohort”, were residing in the area. A follow-up study was performed, in which the women were divided into six age groups that ranged from 0 to 5 years, 6–10 years, 11–13 years, 20–25 years, 26–30 years, and 31–33 years. Serum samples were collected after the explosion in 1976, and then again in 1996, to quantify TCDD levels. In 1976, median serum TCDD levels were 7.3 ppt expressed in lipid-adjusted TCDD, and the total toxic equivalent factor (TEQ) was 26.2 ppt (Warner et al., 2014). We used these reported values as the starting point for our recoded dioxin PBPK model simulation to predict the levels expected in 1996.
2.3.4. Spanish hazardous waste incinerator (HWI) population case study.
A population living near a hazardous waste incinerator (HWI), in Tarragona County, Catalonia, Spain were concerned about environmental pollutants exposure, especially to dioxins. This population was not occupationally exposed. Schuhmacher et al. (2014) reported adipose tissue samples of 15 autopsied people, who lived in Tarragona County for at least 10 years before they died in 2012 and 2013. The study also reported the historic mean and the median level of polychlorinated dioxins (PCDD) (including polychlorinated dibenzofuran (PCDF) congeners) in picogram per gram of fat (pg/g) and the total picogram (pg)expressed in WHO-TEQ/g of fat measured from different biological media fraction in 1998 (breast milk), 2002 (adipose tissue), 2007 (plasma), and 2013 (adipose tissue). We compared measurements from the 2002 historic exposure dataset of PCDD/PCDF levels found in adipose tissue and the 2012/2013 dataset of PCDD/PCDF levels found in adipose tissue from 15 autopsied individuals to estimate potential past exposure.
3. Results
3.1. Model evaluation
We evaluated the recoded dioxin model’s performance by comparing the original and recoded model simulations using human data sets for different exposure scenarios.
3.2. Simulations for physiological parameters
The first test of the recoded model involved comparing parameters that change as a function of age (e.g., tissue blood flow, weight). Fig. S2a–d illustrates the comparison of the results from the two models (See Supplemental material). The results confirm that the parameters of tissue volume and tissue blood flow for the liver, adipose tissue, and rest of the body compartments change as a function of age and body weight (Emond et al., 2004, 2005, 2006). (Supplemental material Fig. S2). The tissue blood volume of each compartment also showed good reproducibility.
3.2.1. Simulations for dietary dioxins exposure of women and men.
Fig. S3a–b shows the simulation results for women ages 0–20 years with exposure to an oral intake of 1 × 10⁻⁷ ng of TCDD per kilogram of body weight, once per day for 20 years (Emond et al., 2004, 2005, 2006). (See Supplemental material). These figures show the profiles of TCDD concentrations as a function of age in various compartments of the PBPK model, such as blood, adipose tissue, liver, and the rest of the body. In general, the levels increased as a function of age. Adipose tissue had the highest concentration of TCDD, followed by the liver and the rest of the body. We compared the results for organ tissue and blood concentrations using the original and the recoded models (Fig. S3a–b) and there was good agreement between model predictions (Emond et al., 2004, 2005, 2006). (Supplemental material). Fig. S4 shows simulation results for men ages 0–20 years with exposure to an oral intake of 1 × 10⁻⁷ ng of TCDD per kilogram of body weight, once per day for 20 years (Emond et al., 2004, 2005, 2006). (See Supplemental material Fig. S4). Trends similar to those in women were observed in men.
3.2.2. Simulations of dioxins exposure in two Austrian women.
We used the recoded dioxin PBPK model to simulate the time course of TCDD in the blood of highly exposed Austrian women (Fig. S5a–b). The model prediction showed a good correlation with a determination coefficient of R2 = 1 (Fig. S5c) with the monitoring profile and the measured blood concentrations. The recoded model predicted a decrease in the blood concentrations during the distribution phase of the first few months of exposure, followed by an elimination phase. The blood concentration predictions of the recoded dioxin PBPK model were accurate and comparable with the original model (Fig. S5a–b). We also did a comparison between the recoded PBPK model prediction and the biomonitoring data, to assess the performance of this association (Fig. S5d).
3.3. Applicability of the recoded PBPK dioxin model to actual exposure scenarios
3.3.1. Louisiana exposure population case study.
Fig. 1 shows the results of the simulations using the recoded PBPK model to predict exposure to TCDD in two populations in Louisiana (Calcasieu Parish and Lafayette Parish) as a function of age. The population was stratified into four age groups: 15–29 years, 30–44 years, 45–59 years, and ≥60 years. The first observation showed no linear linkage between the age groups and the serum concentrations (Fig. 1). All four age groups (Table 1) followed an exponential function relationship. The blood samples were collected 2 years after persons in Calcasieu Parish were potentially exposed to environmental contamination from local industries. We extrapolated this curve to the birth and found that by the time the children from that area were aged 5 years, their concentrations were approximately 5 ppt. Therefore, in 1980, the expected dioxin concentrations in the serum from newborns of this population should have been approximately 4.2 ppt. Wong et al. (2008) reported another observation, that dioxin concentrations in Calcasieu Parish age groups and age groups in the NHANES study were equivalent, but the geometric mean concentration was slightly higher in the Calcasieu Parish population (Wong et al., 2008).
Fig. 1.
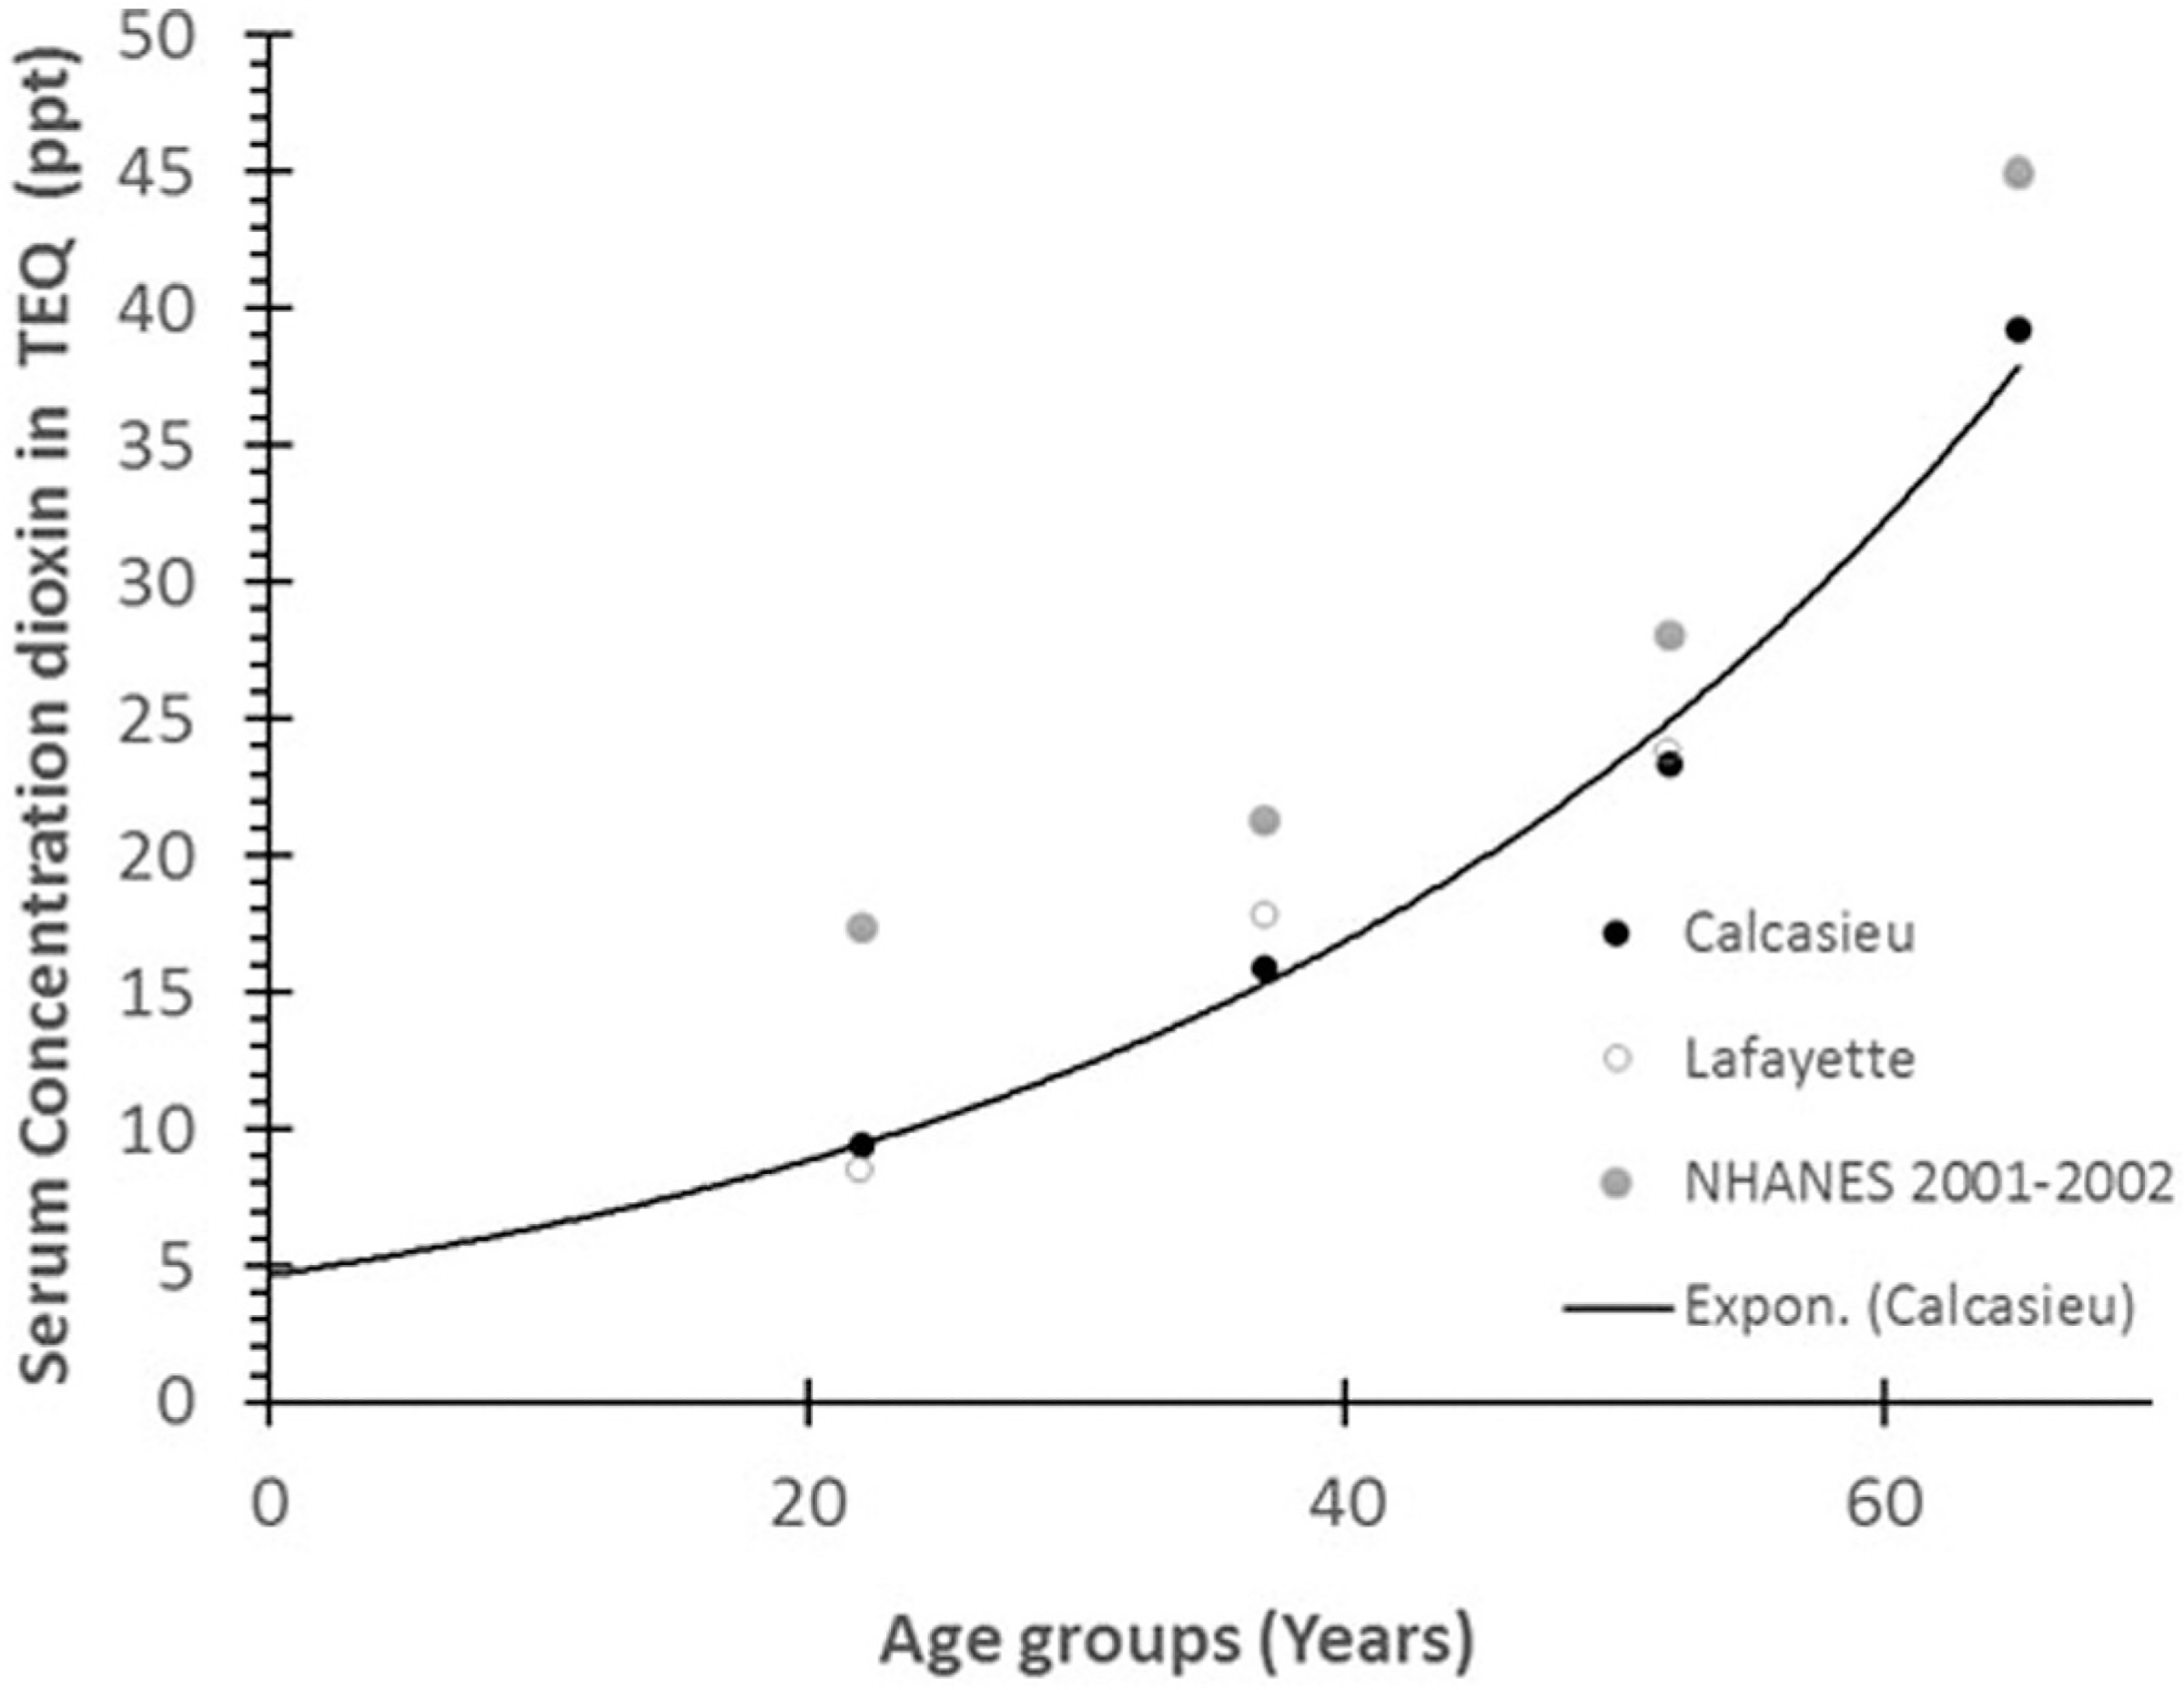
A profile of dioxins and dioxins-like measurements collected in 2002 at Calcasieu Parish in Louisiana (Wong et al., 2008). This profile followed an exponential linkage between the mean ages of each group to the serum concentration in TEQ expressed in ppt for two areas and has a coefficient determinant (R2) of 0.9918. The figure also shows the concentrations for the same age groups in the general population of the NHANES study (2001–2002).
Wong et al. (2008) also observed that the exposure incident in Calcasieu Parish did not significantly increase the body burden of each age group. This information provided an opportunity to determine the mean concentration of each age group without the fluctuation caused by overexposure during 2 years. We used the recoded dioxin PBPK model to simulate the chronic lifetime exposure of dioxins with age, and then compared the results to the serum dioxin concentrations (Fig. 2). We observed a linear association (R2 = 0.9252), suggesting that age is a determining factor in this linkage. Another determining factor was the fluctuation of exposure doses from 1925 through 1980. We used an exponential function relationship curve with R2 = 0.9547 and found slightly better linkage between background exposure and the age groups (Fig. 2). According to Lorber (2002), the concentration was approximately 0.5 pg/kg/day in 1925, 6.6 pg/kg/day in the mid-1960s, and gradually reduced from 1.0 to 0.65 pg/kg/day in 1985 (Lorber, 2002). However, when performing the current simulation, we used a constant monthly exposure scenario, representing a mean exposure, and considered age and ideal body weight.
Fig. 2.

Plots of the linkage between the background exposure doses varied from 1.1 × 10⁻⁸ to 3.6 × 10⁻⁸ ng/kg bw/month for each age group (i.e., 15–29 years, 30–44 years, 45–59 years, and ≥60 years) and the dioxins (including dioxins-like) serum concentrations (in ppt) from the Calcasieu area population in Louisiana.
To determine the impact of potential overexposure in the Calcasieu parish population we performed population simulations for the first two years following the incident using the mean age of each group (Fig. 3). We expected that the higher exposure would reduce the impact of the background exposure. We estimated that the additional exposure levels were between 1.0 × 10⁻⁷ and 1.0 × 10⁻⁶ ng/kg per month (Fig. 3). We observed a plateauing at the higher concentrations, suggesting that a background concentration is not a significant factor when comparing an overexposed population independently of age groups and previous exposures.
Fig. 3.

Comparison between Dioxin serum concentrations and age. The Calcasieu Parish, LA, population was exposed to background dioxin at 1.0 × 10⁻⁸ to 3.6 × 10⁻⁸ ng/kg per month. Additional exposure levels were measured, which resulted in more curvature of the plots, due of the extra exposure doses from 1.0 × 10⁻⁷ to 1.5 × 10⁻⁶ ng/kg per month.
3.3.2. Operation Ranch Hand cohort data case study.
Veterans of Operation Ranch Hand were exposed to TCDD from 1962 to 1971 (Michalek et al., 1996). We simulated blood concentrations at four or five intervals for each veteran, starting in 1982, and used body weight and height for each person to estimate the body mass index and the size of the adipose tissue compartment. We used the recoded PBPK model to estimate the peak TCDD blood concentration for each person. We then compared the results to the predictions from the original model. The recoded model accurately reproduced the profile that was generated by the original PBPK model (Fig. 4A–D).
Fig. 4.

Model predictions of TCDD blood concentration (Cblood) as a function of time in 4 veterans (A–D) from the Operation Ranch Hand cohort. The simulation corresponds to the original (acslX) model (red line) and to the recoded BM model (blue line). The dataset came from (Emond et al., 2005).
3.3.3. Seveso women cohort case study.
Fig. 5 shows the results of the simulations using the recoded PBPK dioxin model of TCDD concentrations ppt (lipid adjusted), 20 years after the explosion. The predictions varied from 0.9 to 5 fold in the Seveso women, per age group (Warner et al., 2014). It can be surmised that the model accurately predicted the serum concentration of TCDD 20 years post-exposure (Fig. 5) considering that no specific information was provided regarding the 20 years between the two sampling efforts (Warner et al., 2014) and the ratio of the concentration simulated and the concentration measured is considered to be in the range indicative of an accurate prediction.
Fig. 5.

Simulation profile of Seveso women for 20 years after the explosion. Each colored line represents a simulation of an age group and the median serum TCDD measurement (colored point) reported in 1976 and 1996 for each group (dataset came from (Warner et al., 2014)).
3.3.4. Spanish HWI data case study.
Table 2 shows the dioxin and dioxin-like historic exposure levels reported on different media datasets from 1998, 2002, 2007, and 2013 in the Terragona County, Catalonia Spain. Because the historic exposure samples of 1998 and 2007 came from breast milk and plasma, respectively, these 2 data sets were not used for comparison analysis. Instead, we used the adipose tissue samples from the 2002 historic exposure data and the autopsy data (15 people who died in 2012 or 2013 reported by Schuhmacher et al., 2014; Table 1) to understand the relationship between age and dioxins levels for which determination coefficients (R2) were calculated for each data set. We noted a large variation in each data set (Fig. 6A), which did not show a good association between the dioxin levels and age. The 2002 historic exposure data showed a R2 = 0.3816 and the autopsy data showed a R2 = 0.4394. These observations might suggest some non-homogeneity in the data sets based on the age reported at death. As shown in Fig. 6(b), the recoded model was used to represent the kinetic profile of each individual who died between 2012 and 2013. Thus, the simulations profile for individual # 15 was compared to the median and standard deviation of the 2002 historic data and autopsy data set, to establish the profile of elimination and to understand the non-homogeneity within the two groups. As shown in Fig. 6(b), it can be suggested that at least one person in the autopsy data set and four in the 2002 historic data were outside of the standard deviation. We can assume that these people were overexposed compared with the other people in the data sets. However, the information reported at Schuhmacher et al. (2014) is limited and thus unable to explain more specifically the homogeneity in the autopsy data set. For the 2002 historic dataset, it does not seem that proximity to an industrial area itself explains the non-homogeneity of this data set (Schuhmacher et al., 2004). The overall observation suggests that these data sets show a decrease of the dioxins concentrations with time, which suggests that if the exposure source was the hazardous waste incinerator, then it seems that the contribution of this exposure is less now than it was previously.
Table 2.
Mean level dioxin and dioxin-like concentrations in different biological media from 1998 to 2013 in Terragona County, Catalonia, Spain. These datasets were considered unexposed (Schuhmacher et al., 2014).
| PCDD/F congeners (pg/g fat) | Dataset | |||
|---|---|---|---|---|
| 1998 | 2002 | 2007 | 2013 | |
| Total WHO-TEQ (mean ± sd) | 32.1 ± 15.3 | 9.9 ± 9.3 | 14.6 ± 14.2 | 11.5 ± 11.1 |
| Total WHO-TEQ (median) | 26.7 | 6.8 | 7.5 | 7.4 |
Fig. 6.

Adipose tissues concentration of PCDD and PCDF are expressed in pg WHO-TEQ/g of fat (data adapted from Schuhmacher et al. (2014)). (A) Representation of the dataset, 2002, and the concentration of the 15 people who died in this area in 2012–2013. (B) Representation of the kinetic profile simulated of the 15 people who died 2012–2013. A simulation of each person was optimized based on the individual adipose tissue concentrations of PCDD/F congeners measured during the autopsies. These simulations were compared to the median and the standard deviation of the 2002 and 2012–13 datasets.
4. Discussion
ATSDR has been working to develop a PBPK toolkit in which the best available PBPK models have been translated into a single simulation language. This PBPK toolkit currently consists of a series of PBPK models for volatile organic chemicals, metals, and other pollutants (Mumtaz et al., 2012a, 2012b; Ruiz et al., 2010, 2011, 2014). The present effort adds a PBPK dioxin model to this collection. The recoded model provides accurate predictions that better suit ATSDR’s use for interpreting human biomonitoring data. This recoded PBPK dioxin model spans a person’s life, from newborn to elderly, and considers dioxin exposures in three major compartments: liver, fat, and rest of the body.
When translating a model from one simulation language to another, the recoded model must be able to replicate all of the characteristics of the original model, even though different coding platforms and related codes are used by each of the models. We confirmed the reproducibility of results by producing profiles of behavior for each of the parameters used in the recoded model and compared the accuracy with the original parameters profile including the verifications of the mass balance to insure the integrity of the model. Fig. S1a–d show simulation results of the original and the recoded PBPK dioxins models for several physiological parameters (i.e., tissue volume and blood flow) as a function of age (See Supplemental material). A reproducible simulation was observed for tissue volume and blood flow and for every variable for people aged 0 to 20 years. This comparison confirms that the recoded model can reproduce the lifetime exposure of a person having a normal physiology, as found in the median population parametric database.
We used a background exposure scenario to compare the recoded PBPK dioxin model with the original PBPK dioxin model. The scenario involved women ages 0–20 years who were orally exposed to 1.0 × 10⁻⁷ ng/kg per day of TCDD per kilogram of body weight. The recoded model reproduced with high accuracy the profile of the published model for the blood, adipose, liver, and rest of the body compartments (Fig. S3a–b). The second exposure scenario, involving a man who was chronically exposed to TCDD daily from birth to age 20 years, compared biomonitoring data to the simulations obtained with the recoded and original platforms (Fig. S4). All curves are similar in Fig. S3a–b and S4, suggesting good prediction with very low discrepancy between models, using the same exposure doses. The accuracy between both models increases the confidence that the recoded model is a suitable option. Similar accuracy was seen in simulations representing highly exposed Austrian women poisoned by TCDD (Fig. S5a–b). We also compared the association between both PBPK models (Fig. S5c) and assessed the association between the biomonitoring and the recoded PBPK model (Fig. S5d and Table S2). Model simulations do not predict well the Biomonitoring TCDD due to dispersion of the dot graph of the biomonitoring with a R2 = 0.3788 (Fig. S5d). This discrepancy can be expected due to the variability of the biomonitoring point’s dispersion. We evaluated performance by calculating values for percent MAPE%, median performance error (MPE %), and RMSPE% based on this association Table S2). The model could simulate and accurately predict the biomonitoring data for available blood concentration and obtained a reasonable fit, as shown in Table S1.
In the risk assessment process, PBPK models are used for a variety of extrapolations such as interspecies, route-to-route, varying exposure conditions, high to low dose, etc. In this manuscript we conducted an exercise to estimate internal levels from exposure media under various exposure scenarios. First we assessed the performance of our Berkeley Madonna recoded model by comparing the simulations of our model with those of the original model. After assuring that it did reproduce the data accurately in various tissues such as blood, adipose tissue, and liver we wanted to illustrate its use. So, in the second step, we performed literature searches to identify additional human/epidemiological studies with well-established cohorts. Through this best identified data we have demonstrated the utility and applicability of our model to address community concern.
This type of work will help meet the challenge of not just developing PBPK models but to make them available for risk assessors and end users to characterize risk in human populations and maximally benefit from availability models. These case studies also address an important issue of broad applicability of PBPK models as tools to relate dioxin tissue levels/concentrations as biomarkers of population exposure and health risk. The results presented in our manuscript demonstrate the feasible of such an application.
We applied the recoded PBPK model to analyze different human exposure data from published literature to provide some case studies. The first case study example was that of the Calcasieu Parish population that was assumed to be potentially overexposed to dioxins (Wong et al., 2008). We used the exposure scenario of this population to determine the internal blood concentration, applying the recoded model, and compared the simulation results with results for the “non-exposed” or control population in Lafayette Parish (Fig. 1). The simulation did not show any significant difference between the potentially exposed and non-exposed populations; however, the blood concentrations increased as a function of age in both the populations. The figure also shows data from a national representation of the general US population, NHANES (2001–2002). Interestingly, the NHANES data showed a higher blood concentration, when compared with the Louisiana populations, but the levels were not significantly different. These findings suggest that the Calcasieu population near the industrial area was not overexposed to environmental contaminants from local industry, as was reported by Wong et al. (2008).
The association between dioxin (including dioxin-like compounds) concentrations in the serum from the Calcasieu Parish resident in Louisiana was characterized by an exponential linkage with each of the age groups (15–29 years, 30–44 years, 45–59 years, and ≥60 years) and the simulation curve following the background exposures for each group of age as seen in Fig. 2. It seems that the non-linearity of the plot was caused exclusively by variations of the background exposure throughout time, starting from birth. It is reasonable to assume that the people in the oldest age group (≥60 years) were more exposed than those in the youngest group (15–29 years) because of accumulation with age but also due to their higher exposure based on the historic estimated exposure (Lorber, 2002). People who were born between 1960 and 1980 were, in general, much more exposed than people born after 1980. The youngest group (15–29 years) represents the population that was potentially most exposed to high levels from the incident that occurred in 2000, and potentially during a vulnerable time of development independently of the physiology or biochemistries variabilities (Wong et al., 2008). Our analysis considered all the dioxin concentration (including dioxins-like compounds) concentrations. Even though the pharmacokinetics are different for each dioxin-like compound, the toxic potencies are proportional to the toxicity equivalence factors of each chemical (Van den et al., 1998). Also, a large proportion of a dioxin mixture typically occupies fewer than five congeners or dioxin-like compounds.
We assumed that an exposure significantly higher than a background exposure would probably yield a linear exposure curve between the age groups. In fact, an exposure of 1.0 × 10⁻⁶ ng/kg per month (equivalent to 3.29 × 10⁻⁸ ng/kg per day) would be enough to reduce the contribution of the background exposure, deriving a plateau corresponding to an equivalent log-based serum concentration for each age group (Fig. 3).
In the second case study, we used our recoded model to estimate TCDD blood concentrations in the veterans of Operation Ranch Hand (Fig. 4). The model accurately predicted the blood concentrations in four veterans when compared to the results of the original model (Fig. 4 a–d). The recoded model estimates of peak blood TCDD concentrations (at the time of discharge) ranged from 138 ppt to approximately 40,000 ppt, which was similar to the original model (Emond et al., 2005). This confirmed that the model performance was good for real life exposures, and the recoded model can be used under various scenarios.
In the third case study, using the Seveso data, the recoded model predicted the serum TCDD concentration accurately considering that no specific information was provided regarding the 20 years between the two sampling efforts (Warner et al., 2014). In fact, the ratio of the concentration simulated and the concentration measured was between 0.9 and 5 fold, which is considered to be an accurate prediction (Fig. 5).
The fourth case study involved a population from Catalonia, Spain that was potentially exposed to TCDD because it lived near a HWI. The analysis of the historic data set (1998, 2002, 2007, and 2013) showed that the media concentrations used by the authors came from different sample media (breast milk, adipose tissues, and plasma). Therefore, for comparison analysis purposes, just the 2002 historic adipose tissue data and the 2012–2013 autopsy adipose tissue data were used. The R2 between the adipose tissue concentrations and age were low for both datasets. A reason for this discrepancy might be the non-homogeneity of the residents in the respective sampling populations. However, not enough information is available to support our hypothesis that the dioxins concentration is related to age. As mentioned by Schuhmacher et al. (2014), the 15 autopsied people lived in this region for at least 10 years before they died. In fact, this latter data set showed a better association of adipose tissue concentration with age than the data set on the 2002 historic data (Fig. 6a). Out of the 15 profile simulations conducted on the autopsied individuals’ data set (Fig. 6b), at least 14 of them were within the standard deviation of the historic population. Because the historic population was not an occupationally exposed population, it was considered to be a non-exposed population. With the exception of one of the 15 autopsy a woman of 72 year old with a dioxin concentration level of 46.3 pg WHO-TEQ/g of fat in adipose tissue, all other individuals in this 15 autopsies group were considered non-overexposed from potential exposure to contaminants from the HWI nearby. This result may also suggest that the 72-year-old man was probably highly exposed in another area before coming to Tarragona County (Catalonia, Spain).
5. Conclusions
We present a human PBPK model for TCDD that was translated from acslX to BM. We confirmed the accuracy of the model by comparing simulations with that of the original model to predict serum concentrations under various exposure scenarios. We also applied the recoded model to predict serum concentrations in potentially exposed populations and compared the results with non-exposed populations. The results were comparable with those of the original model, thus authenticating the recoded model’s performance. We also substantiated the model’s performance for short-term and chronic exposures for various age groups. Through a comparative study of serum concentration levels in potentially exposed and non-exposed Louisiana populations, we showed that neither population was significantly overexposed. Lastly, through simulation studies of Operation Ranch Hand veterans, we again demonstrated the recoded model’s accuracy. The data regarding the Seveso women in Italy and the population in Catalonia, Spain, also demonstrated the accuracy of the model. In conclusion, the recoded PBPK dioxins model is able to simulate reasonably well under a variety of exposure scenarios. This model has all of the characteristics of a relevant tool; therefore, this will be a useful addition to ATSDR’s PBPK toolkit and can be used to support risk assessor or risk managers in making important public health decisions.
Supplementary Material
Footnotes
The findings and conclusions in this report are those of the author(s) and do not necessarily represent the official position of the Centers for Disease Control and Prevention/Agency for Toxic Substances and Disease Registry. Mention of trade names is not an endorsement of any commercial product.
Conflict of interest
All the authors declare that they have no conflict of interest.
Transparency document
The Transparency document associated with this article can be found, in online version.
Appendix A. Supplementary material
Supplementary data to this article can be found online at http://dx.doi.org/10.1016/j.taap.2016.12.007.
References
- Andersen ME, Mills JJ, Gargas ML, Kedderis L, Birnbaum LS, Neubert D, Greenlee WF, 1993. Modeling receptor-mediated processes with dioxin: implications for pharmacokinetics and risk assessment. Risk Anal. 13 (1), 25–36. [DOI] [PubMed] [Google Scholar]
- ATSDR, 1998. Toxicological Profile for Chlorinated Dibenzo-p-dioxins. TP104 (Report). [PubMed] [Google Scholar]
- ATSDR, 2012. Toxicological Profile for Chlorinated Dibenzo-p-Dioxins Addenda. Agency for Toxic Substances and Disease Registry, pp. 1–184 (Atlanta, U.S. Department of Health and Human Services, Public Health Service, Atlanta, Ga, USA, 2012. Report). [Google Scholar]
- Aylward LL, Hays SM, 2002. Temporal trends in human TCDD body burden: decreases over three decades and implications for exposure levels. J. Expo. Anal. Environ. Epidemiol. 12 (5), 319–328. [DOI] [PubMed] [Google Scholar]
- Aylward LL, Brunet RC, Carrier G, Hays SM, Cushing CA, Needham LL, Patterson DG Jr., Gerthoux PM, Brambilla P, Mocarelli P, 2005. Concentration-dependent TCDD elimination kinetics in humans: toxicokinetic modeling for moderately to highly exposed adults from Seveso, Italy, and Vienna, Austria, and impact on dose estimates for the NIOSH cohort. J. Expo. Anal. Environ. Epidemiol. 15 (1), 51–65. [DOI] [PubMed] [Google Scholar]
- Birnbaum LS, 1995. Development Effects of Dioxins. Environ. Health Perspect. 103 (Suppl. 7), 89–94. [DOI] [PMC free article] [PubMed] [Google Scholar]
- Birnbaum LS, Farland WH, 2003. Health risk characterization of dioxin and related compounds. In: Schecter A, Gasiewicz TA (Eds.), Dioxin and health, second ed. Wiley Interscience, New Jersey, pp. 159–190. [Google Scholar]
- Birnbaum LS, Tuomisto J, 2000. Non-carcinogenic effects of TCDD in animals. Food Addit. Contam 17 (4), 275–288. [DOI] [PubMed] [Google Scholar]
- Carrier G, 1991. Analyse des impact des emisions de polluant produit par incinerateur Des Carrieres dans l air Ambiant sur la sante de la population. Departement de sante communautaire (Report). [Google Scholar]
- Carrier G, Brunet RC, Brodeur J, 1995. Modeling of the toxicokinetics of polychlorinated dibenzo-p-dioxins and dibenzofuranes in mammalians, including humans : II kinetics of absorption and disposition of PCDDs/PCDFs. Toxicol. Appl. Pharmacol. 131 (267), 276. [DOI] [PubMed] [Google Scholar]
- Centers for Disease Control and Prevention (CDC), 2012. National Biomonitoring Program: http://www.cdc.gov/biomonitoring/environmental_chemicals.html (last updated Friday October 19 2012).
- Cheng H, Aylward L, Beall C, Starr TB, Brunet RC, Carrier G, Delzell E, 2006. TCDD exposure-response analysis and risk assessment. Risk Anal. 26 (4), 1059–1071. [DOI] [PubMed] [Google Scholar]
- Devito MJ, Birnbaum LS, 1994. Toxicology of dioxins and related chemicals. In: Schecter A (Ed.), Dioxin and health. Plenum Press, New York, pp. 139–162. [Google Scholar]
- Diliberto JJ, Burgin D, Birnbaum LS, 1997. Role of CYP1A2 in hepatic sequestration of dioxin: studies using CYP1A2 knock-out mice. Biochem. Biophys. Res. Commun. 236 (2), 431–433. [DOI] [PubMed] [Google Scholar]
- Emond C, Birnbaum LS, DeVito M, 2004. Physiologically based pharmacokinetic model for developmental exposures to TCDD in the rat. Toxicol. Sci. 80 (1), 115–133. [DOI] [PubMed] [Google Scholar]
- Emond C, Birnbaum LS, Devito MJ, 2006. Use of a physiologically based pharmacokinetic model for rats to study the influence of body fat mass and induction of CYP1A2 on the pharmacokinetics of TCDD. Environ. Health Perspect. 114 (9), 1394–1400. [DOI] [PMC free article] [PubMed] [Google Scholar]
- Emond C, DeVito M, Birnbaum LS, 2003. Utilization of the PBPK model to predict the distribution of 2,3,7,8-tetrachlorodibenzo-p-dioxin (TCDD) in human during critical windows of development. 42th annual meeting. Society of toxicology (SOT), Salt Lake City, Utah, USA (Conference Proceeding). [Google Scholar]
- Emond C, DeVito MJ, Warner M, Patterson D, Needham L, Mocarelli P, Eskenazi B, Birnbaum LS, 2010. Physiologically Based Pharmacokinetic Modeling (PBPK) as a tool for predicting TCDD blood concentration in women Living near Seveso. Dioxin meeting. International Sympossium on Halogenated Persistant Organic Pollutants (2010. (Conference Proceeding)). [Google Scholar]
- Emond C, DeVito M, Warner M, Eskenazi B, Mocarelli P, Birnbaum LS, 2016. An assessment of dioxin exposure across gestation and lactation using a PBPK model and new data from Seveso. Environ. Int. 92–93. [DOI] [PMC free article] [PubMed] [Google Scholar]
- Emond C, Michalek JE, Birnbaum LS, Devito MJ, 2005. Comparison of the use of a physiologically based pharmacokinetic model and a classical pharmacokinetic model for dioxin exposure assessments. Environ. Health Perspect. 113 (12), 1666–1668. [DOI] [PMC free article] [PubMed] [Google Scholar]
- Geusau A, Schmaldienst S, Derfler K, Papke O, Abraham K, 2002. Severe 2,3,7,8-tetrachlorodibenzo- p-dioxin (TCDD) intoxication: kinetics and trials to enhance elimination in two patients. Arch. Toxicol. 76 (5–6), 316–325. [DOI] [PubMed] [Google Scholar]
- Kogevinas M, 2001. Human health effects of dioxins: cancer, reproductive and endocrine system effects. Hum. Reprod. Update 7 (3), 331–339. [DOI] [PubMed] [Google Scholar]
- Lawrence GS, Gobas FA, 1997. A pharmacokinetic analysis of interspecies extrapolation in dioxin risk assessment. Chemosphere 35 (3), 427–452. [DOI] [PubMed] [Google Scholar]
- Lorber M, 2002. A pharmacokinetic model for estimating exposure of Americans to dioxin- like compounds in the past, present, and future. Sci. Total Environ. 288 (1–2), 81–95. [DOI] [PubMed] [Google Scholar]
- Maruyama W, Yoshida K, Tanaka T, Nakanishi J, 2002. Possible range of dioxin concentration in human tissues: simulation with a physiologically based model. J. Toxicol. Environ. Health A 65 (24), 2053–2073. [DOI] [PubMed] [Google Scholar]
- Michalek JE, Tripathi RC, 1999. Pharmacokinetics of TCDD in veterans of Operation Ranch Hand: 15-Year follow-up. J. Toxicol. Environ. Health A 57 (6), 369–378. [DOI] [PubMed] [Google Scholar]
- Michalek JE, Caudill SP, Tripathi RC, 1997. Pharmacokinetics of TCDD in veterans of Operation Ranch Hand: 10-Year follow-up (ERRATUM). J. Toxicol. Environ. Health 52 (6), 557–558. [DOI] [PubMed] [Google Scholar]
- Michalek JE, Pirkle JL, Caudill SP, Tripathi RC, Patterson DG Jr., Needham LL, 1996. Pharmacokinetics of TCDD in veterans of Operation Ranch Hand: 10-Year follow-up. J. Toxicol. Environ. Health 47 (3), 209–220. [DOI] [PubMed] [Google Scholar]
- Michalek JE, Pirkle JL, Needham LL, Patterson DG, Caudill SP, Tripathi RC, Mocarelli P, 2002. Pharmacokinetics of 2,3,7,8-tetrachlorodibenzo-p-dioxin in Seveso adults and veterans of operation Ranch Hand. J. Expo. Anal. Environ. Epidemiol. 12 (1), 44–53. [DOI] [PubMed] [Google Scholar]
- Mumtaz M, Fisher J, Blount B, Ruiz P, 2012a. Application of physiologically based pharmacokinetic models in chemical risk assessment. J. Toxicol. 2012, 904603. [DOI] [PMC free article] [PubMed] [Google Scholar]
- Mumtaz MM, Ray M, Crowell SR, Keys D, Fisher J, Ruiz P, 2012b. Translational Research to Develop a Human PBPK Models Tool Kit-Volatile Organic Compounds (VOCs). J. Toxicol. Environ. Health A 75 (1), 6–24. [DOI] [PMC free article] [PubMed] [Google Scholar]
- NCEA-USEPA, 2010. EPA’s reanalysis of key issues related to dioxin toxicity and response to NAS comments. EPA/600/R-10/038A, pp. 1–1849 (Report). [Google Scholar]
- Nichols JW, Jensen KM, Tietge JE, Johnson RD, 1998. Physiologically based toxicokinetic model for maternal transfer of 2,3,7,8-tetrachlorodibenzo-p-dioxin in brook trout (Salvelinus fontinalis). Environ. Toxicol. Chem. 17 (12), 2422–2434. [Google Scholar]
- Ruiz P, Aylward LL, Mumtaz M, 2014. Application of pharmacokinetic modelling for 2,3,7,8-tetrachlorodibenzo-p-dioxin exposure assessment. SAR QSAR. Environ. Res. 25 (11), 873–890. [DOI] [PMC free article] [PubMed] [Google Scholar]
- Ruiz P, Fowler BA, Osterloh JD, Fisher J, Mumtaz M, 2010. Physiologically based pharmacokinetic (PBPK) tool kit for environmental pollutants–metals. SAR QSAR Environ. Res. 21 (7–8), 603–618. [DOI] [PubMed] [Google Scholar]
- Ruiz P, Ray M, Fisher J, Mumtaz M, 2011. Development of a human Physiologically Based Pharmacokinetic (PBPK) toolkit for environmental pollutants. Int. J. Mol. Sci. 12 (11), 7469–7480. [DOI] [PMC free article] [PubMed] [Google Scholar]
- Santostefano MJ, Johnson KL, Whisnant NA, Richardson VM, Devito MJ, Diliberto JJ, Birnbaum LS, 1996. Subcellular localization of TCDD differs between the liver, lungs, and kidneys after acute and subchronic exposure: species/dose comparisons and possible mechanism. Fundam. Appl. Toxicol. 34, 265–275. [DOI] [PubMed] [Google Scholar]
- Schuhmacher M, Domingo JL, Hagberg J, Lindstrom G, 2004. PCDD/F and non-ortho PCB concentrations in adipose tissue of individuals living in the vicinity of a hazardous waste incinerator. Chemosphere 57 (5), 357–364. [DOI] [PubMed] [Google Scholar]
- Schuhmacher M, Fabrega F, Kumar V, Garcia F, Nadal M, Domingo JL, 2014. A PBPK model to estimate PCDD/F levels in adipose tissue: comparison with experimental values of residents near a hazardous waste incinerator. Environ. Int. 73C, 150–157. [DOI] [PubMed] [Google Scholar]
- Van den BM, Birnbaum L, Bosveld AT, Brunstrom B, Cook P, Feeley M, Giesy JP, Hanberg A, Hasegawa R, Kennedy SW, Kubiak T, Larsen JC, van Leeuwen FX, Liem AK, Nolt C, Peterson RE, Poellinger L, Safe S, Schrenk D, Tillitt D, Tysklind M, Younes M, Waern F, Zacharewski T, 1998. Toxic equivalency factors (TEFs) for PCBs, PCDDs, PCDFs for humans and wildlife. Environ. Health Perspect. 106 (12), 775–792. [DOI] [PMC free article] [PubMed] [Google Scholar]
- Warner M, Mocarelli P, Brambilla P, Wesselink A, Patterson DG Jr., Turner WE, Eskenazi B, 2014. Serum TCDD and TEQ concentrations among Seveso women, 20 years after the explosion. J. Expo. Sci. Environ. Epidemiol. 24 (6), 588–594. [DOI] [PMC free article] [PubMed] [Google Scholar]
- WHO, 1998. Assessment of the health risk of dioxin: re-evaluation of the tolerate daily intake (TDI). executive summary. pp. 1–28 (Report). [Google Scholar]
- Wong L-Y, Millette MD, Uddin MS, Needham LL, Patterson DG, Turner W, Henderson A, 2008. Serum dioxin levels in residents of Calcasieu and Lafayette parishes, Louisiana with comparison to the US population. J. Expo. Sci. Environ. Epidemiol. 18 (3), 252–261. [DOI] [PubMed] [Google Scholar]
Associated Data
This section collects any data citations, data availability statements, or supplementary materials included in this article.