

Abstract
Stable isotope-resolved metabolomics (SIRM) methods are used increasingly by cancer researchers to probe metabolic pathways and identify vulnerabilities in cancer cells. Analytical and computational advances are being made constantly, but tissue culture and sample extraction procedures are often variable and not elaborated in the literature. This chapter discusses basic aspects of tissue culture practices as they relate to the use of stable isotope tracers and provides a detailed metabolic labeling and metabolite extraction procedure designed to maximize the amount of information that can be obtained from a single tracer experiment.
Keywords: Tissue culture, Stable isotopes, Metabolomics, Metabolite extraction, Glutamine, Glucose
1. Introduction
At present, numerous publications and protocols exist in the literature detailing the theoretical and practical aspects of conducting stable isotope tracer experiments in mammalian cells, 3D organoid cultures, tumor tissue slices, animal models, and even in human patients [1–5]. Recent work has demonstrated that in vivo tumor metabolism can differ significantly from that observed in tumor cell monoculture [5–9]. Nevertheless, two-dimensional cell monoculture stable isotope tracer experiments are still heavily relied upon to draw conclusions about the nature of metabolic pathways in mammalian cells and tissues [10–14]. The continued reliance of researchers on 2D monoculture cell culture systems for stable isotope tracer experiments is due to a variety of factors, including the experimental power conferred by the ready control of the extracellular environment, the feasibility of extensive genetic manipulations, the lower cost and simple infrastructure needed for performing tissue culture experiments relative to animal and/or human patient work, and the ability to rapidly test a large variety of experimental conditions [1].
On a practical basis, access to analytical platforms, data analysis, and biological interpretation typically comprise the bottleneck in metabolomics workflows. Given the enormous amount of time that must be invested for data analysis and interpretation, careful and thorough consideration should be applied to the practical aspects of design and execution of stable isotope tracer experiments. Otherwise, subsequent in-depth analyses and interpretation efforts will be compromised by avoidable flaws in experimental design and execution. The purpose of this chapter is to provide a simple and practical laboratory protocol for stable isotope labeling of cultured mammalian cells in 2D culture in the typical cancer research laboratory setting. The growing number of cancer researchers wishing to conduct targeted stable isotope tracer experiments with their cells often do not possess the analytical instrumentation and expertise to perform mass spectrometry and NMR analyses of metabolites in their own labs. Thus, it is becoming increasingly common for researchers to perform the tracer labeling experiments in their own lab and send the resulting samples or quenched metabolite extracts to a core facility or company to perform the subsequent analyses. Data acquisition and targeted analysis in stable isotope experiments will not be discussed here, but these topics are well covered by other comprehensive literature, e.g., [3, 15–17].
The protocol detailed in Subheading 3.1 covers the practical aspects of the stable isotope labeling procedure for adherent mammalian cells. The subsequent metabolite quenching and extraction procedures tend to vary significantly between different laboratories, academic core facilities, and commercial metabolomics companies. For reference, a robust metabolite extraction protocol is detailed in Subheading 3.2; this procedure was developed and refined by Teresa W.-M. Fan, Andrew N. Lane, and Richard Higashi and represents a careful and comprehensive approach to the quantitative recovery of polar and nonpolar metabolites as well as total cellular protein from mammalian cells. This extraction procedure has several attractive features, including:
Initial rapid and complete inactivation of intracellular enzymes using cold 100% acetonitrile.
Quantitative and reproducible recovery of a broad complement of polar and nonpolar intracellular metabolites from a single sample using a sequential combination of acetonitrile, water, chloroform, and methanol.
Safeguards for minimizing degradation of labile polar and nonpolar metabolites during the extraction and sample reduction steps,
Versatile use of the resulting polar and nonpolar metabolite extracts and protein residues, e.g., analysis by both NMR and multiple modalities of mass spectrometry, as well as Western blotting and other proteomic analyses.
Although this metabolite extraction procedure is more laborious than most metabolite extraction protocols, the above features maximize the amount of information that can be obtained from a single stable isotope tracer experiment. Finally, Subheading 3.3 outlines two simple extraction procedures for deproteinization and recovery of culture medium extracts for subsequent metabolomics analysis.
1.1. Experimental Design
Excellent summaries of the theoretical and analytical considerations involved in the design and interpretation of SIRM experiments can be found in the following references [2, 3, 18]. A discussion of preclinical cancer models that extend beyond 2D monoculture of tumor cell lines has also been published recently [1]. Briefly, experimental design considerations include consideration of which metabolites are of greatest interest for measurement, selection of a tracer molecule that is best suited to answer the questions at hand [18], selection of a sample preparation and extraction method best suited to observe the desired metabolites [19], and choice of duration of the labeling period [2, 20].
Many researchers aim to obtain a broad complement of information about the metabolic transformations of a common fuel molecule such as d-glucose or L-glutamine in their cancer cells, which can be achieved by using fully 13C-labeled glucose or glutamine tracers. Doubly labeled 13C5-,15N2-glutamine can also be utilized to gain even more information about the transformed products of glutamine; however, use of doubly labeled tracers necessitates the use of advanced analytical methods that can distinguish the two isotope labels, such as NMR and ultrahigh-resolution mass spectrometry, e.g., [21, 22]. Other tracers are particularly useful for evaluating specific pathways such as the pentose phosphate pathway (13C2–1,2-glucose; [18, 23]), fatty acid biosynthesis (13C3-glycerol, 13C8-octanoic acid; [12]), and reductive carboxylation of glutamine (13C1–1-glutamine; [24]). In a sophisticated study on the compartmentalization of NAD(P)H-dependent pathways in different cellular compartments, several deuterated (2H) forms of glucose, serine, and glycine were employed to explore the directionality of the pyridine nucleotide redox cycles [25]. A more comprehensive listing of various isotope tracers and their utility in tracer experiments has recently been published [17].
In addition to evaluating cells in the basal metabolic setting, experiments can be designed to assess perturbations in metabolic pathways caused by addition of a drug, a genetic manipulation, nutrient availability, or altered physiological parameters such as hypoxia and acidosis. In most cases, such questions can be addressed by aiming for pseudo-steady-state isotopic labeling of the metabolites of interest [2, 17, 20]. If subsequent steady-state metabolic flux modeling analysis is desired, a general rule of thumb of the tracer studies is to allow for cells to be grown in the presence of the tracer molecule for sufficient time for at least one population doubling to occur. This allows for many of the central metabolic pathways of interest to approach pseudo-steady-state isotope enrichment [2, 26]. For example, uridine-diphosphate N-acetyl glucosamine (UDP-GlcNAc), an activated form of N-acetyl glucosamine used for N- and O-linked protein glycosylation, derives carbon from glycolysis, the pentose phosphate pathway, hexosamine and pyrimidine biosynthetic pathways, and the Krebs cycle [26]. In a study utilizing a prostate cancer cell line with a doubling time of ~40 h, it was determined that 13C incorporation in UDP-GlcNAc did not approach steady state until 30 h of growth in the presence of 13C6-glucose [26]. However, macromolecules such as proteins and cellular lipids require many population doublings to approach steady-state labeling patterns [20], and this must be taken into account if these macromolecules are evaluated for stable isotope incorporation. In contrast, intermediates of central metabolism such as glycolysis, the pentose phosphate, and most components of the Krebs cycle reach isotopic steady state much more quickly, and for dynamic studies, rather short exposure times can be used [17].
The choice of number of treatment groups and number of experimental replicates per group must be balanced between statistical considerations and practical workflow considerations. In general, a minimum of three replicate samples should be included per treatment group. More biological replicates may be needed to detect more subtle differences in metabolite labeling patterns. Before drawing scientific conclusions, it is always important to repeat the experiment to ensure that the results are independent of cell passage numbers, density, or other subtle differences in growth conditions. It can also be very helpful to include an unlabeled sample for each treatment group, which is grown in the presence of the natural abundance form of the tracer molecule. Analysis of this additional sample allows for qualitative comparisons of the fate of the 13C tracer carbons, e.g., in overlays of 1H-{13C} HSQC NMR spectra [14], and as a technical control to discern incorrectly assigned isotope-labeled peaks during curation of mass spectra. This additional unlabeled sample can also be included as a replicate in measurement of total abundance of metabolites in the treatment group. However, the unlabeled sample should not be used to manually correct for the presence of natural abundance isotopologues of the metabolites of interest in mass spectrometry data [2], as formal algorithms must be applied for such corrections [2, 27].
A reasonable number of 10 cm dishes with cells to process in 1 day using the extraction method detailed here range from 12 to 18, and the procedure runs much more efficiently with two people working together. More dishes can be processed if desired; however, staggering of the tracer additions may be needed so that the tracer labeling period is consistent across all dishes. Example experimental setups are provided in Fig. 1, which include several configurations for different kinds of experiments, including blank “t = 0” plates with no cells but containing tracer-labeled or unlabeled medium (see Fig. 1).
Fig. 1. Examples of experimental setups for stable isotope tracer experiments.
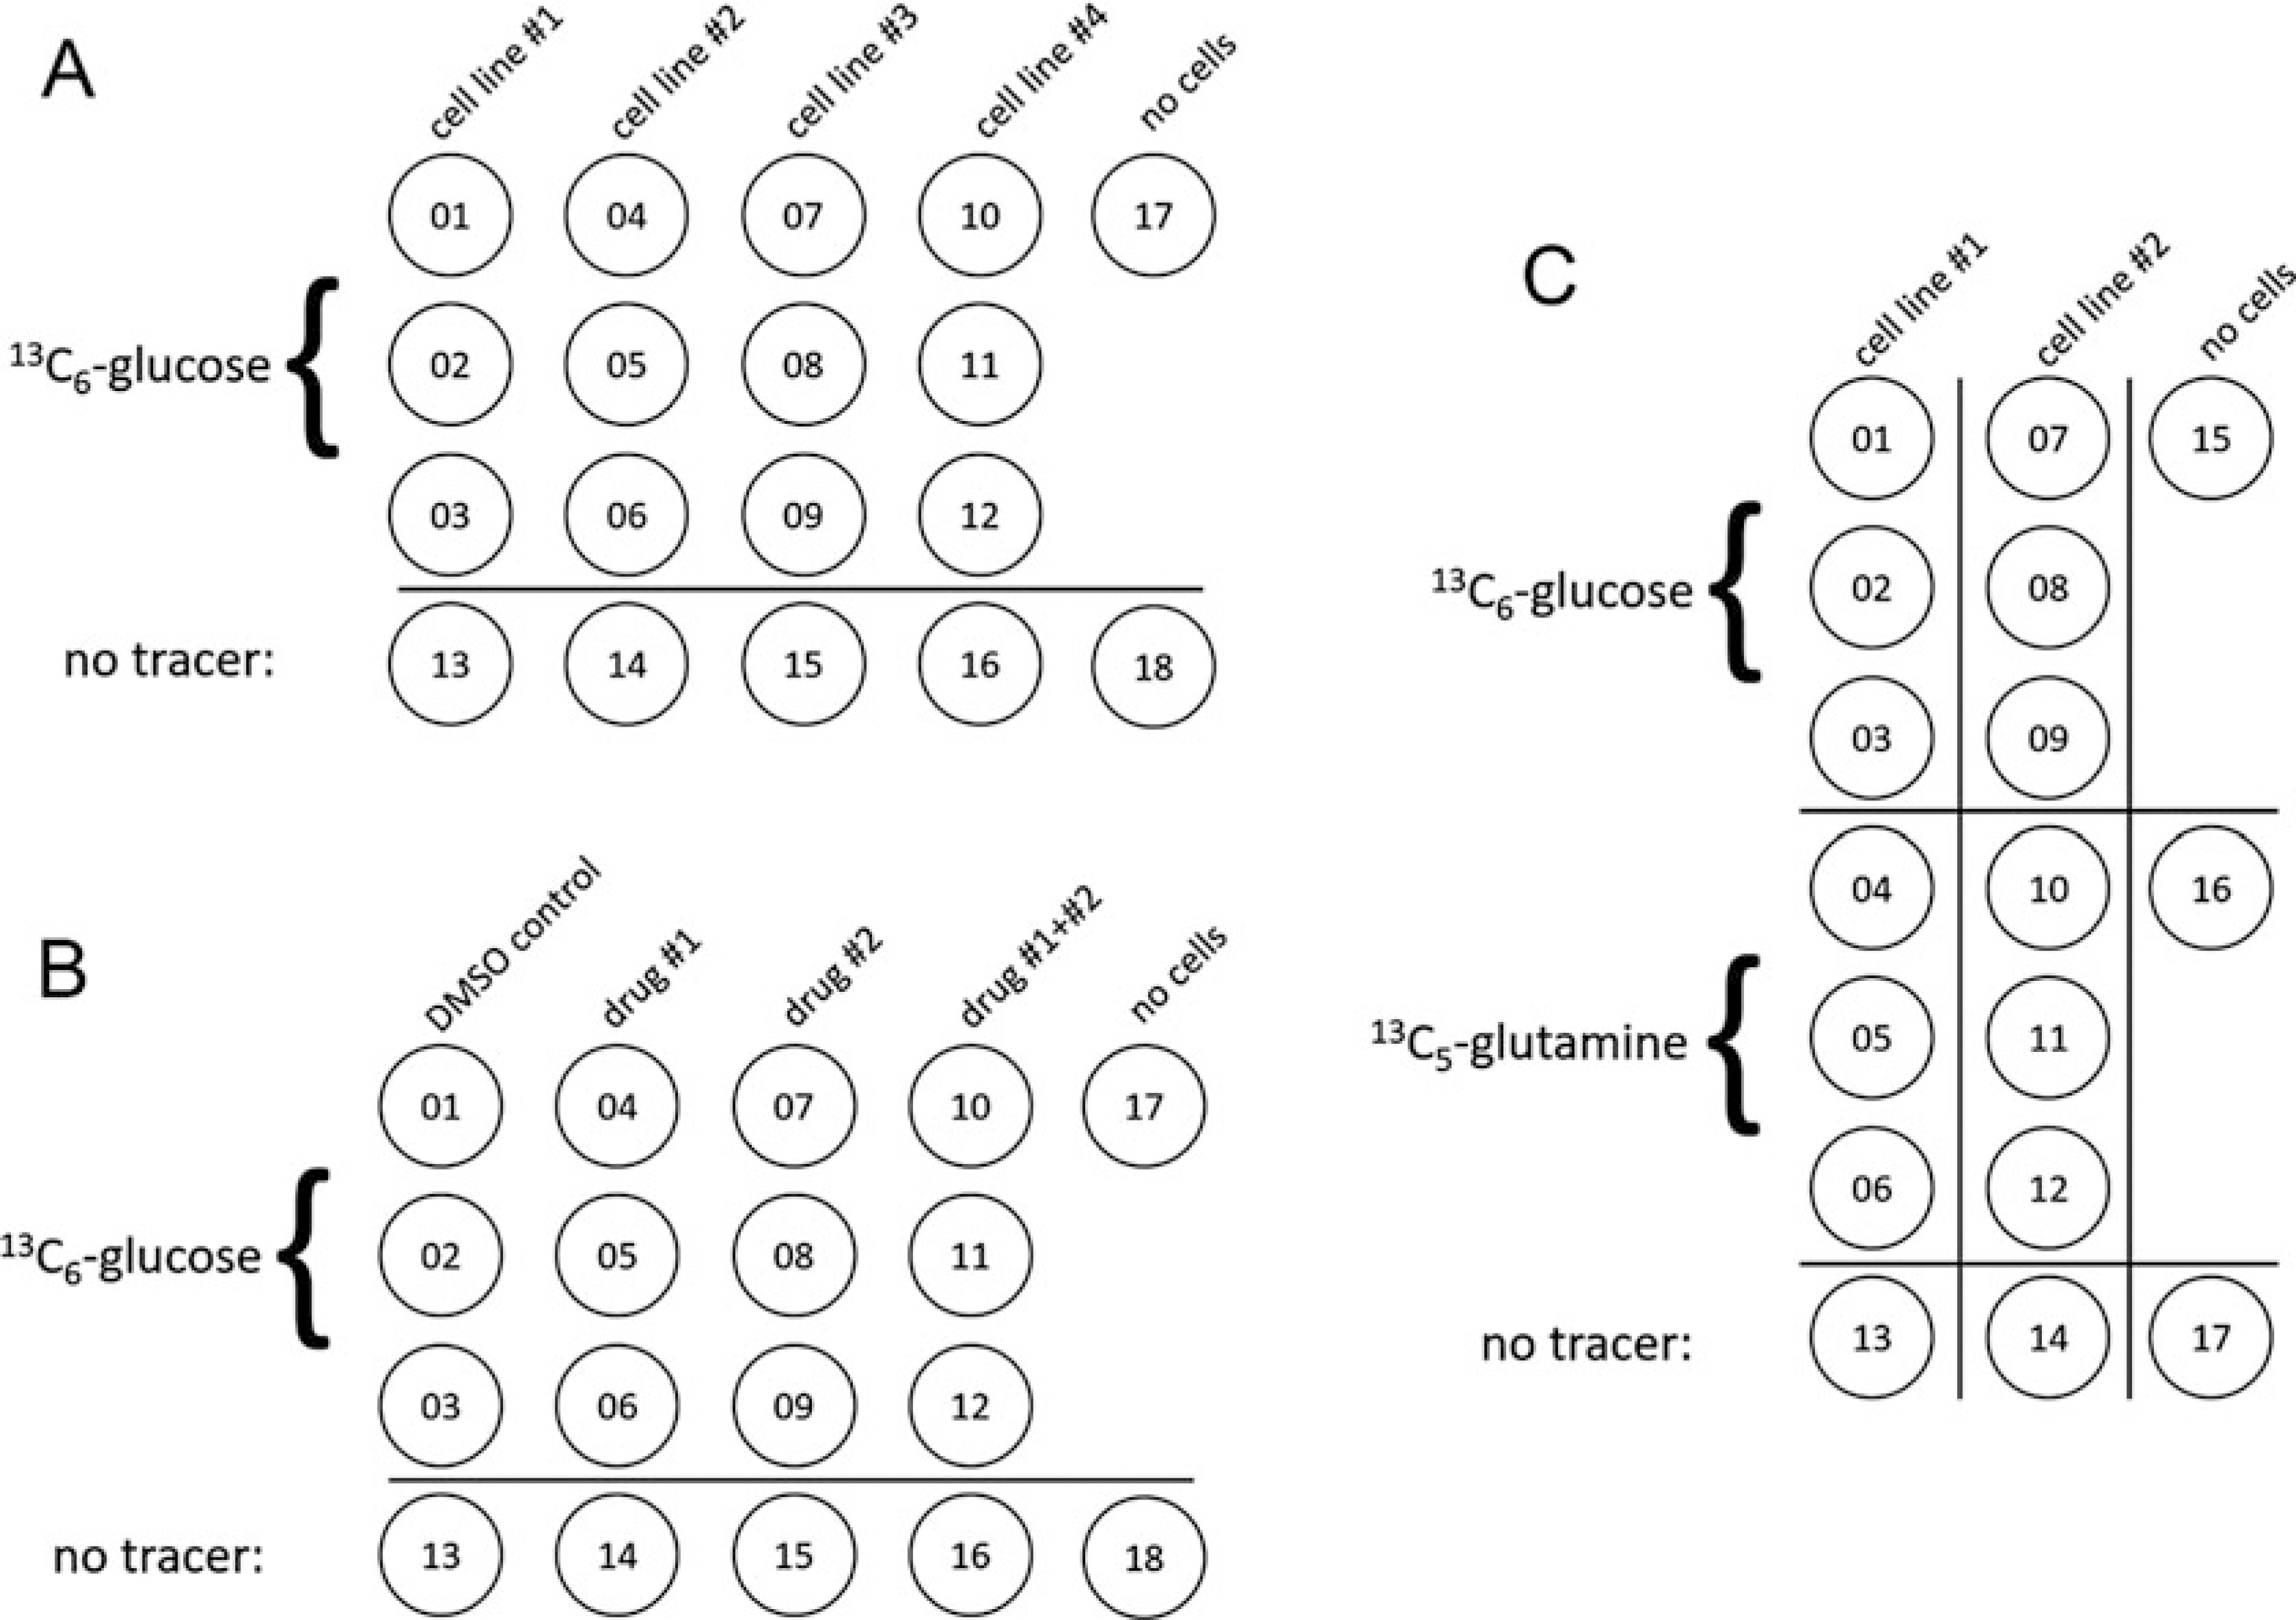
(a) Sample dish configuration for simultaneous 13C6-glucose labeling of four cell lines, including unlabeled replicate plates (#13–16) incubated with 12C-glucose, as well as a blank replicate plate incubated with media but no cells. (b) Sample dish configuration for evaluation of metabolic perturbations induced by two drugs separately or in combination. Note that pilot experiments should be performed to determine the IC50 of each drug as well as the combination of both drugs, which may act antagonistically or synergistically. (c) Sample dish configuration for the comparative labeling of two cell lines with two different tracers, including unlabeled control replicates and the blank plate incubated with media but no cells
1.2. Nutrient Requirement, Growth Kinetics, and Tracer Medium Choice
Cultured tumor cells exhibit different nutritional requirements depending on cell type, genotype, tissue of origin, and numerous other factors. For assessing pseudo-steady-state labeling patterns of intracellular metabolites, it is important to design the experiment such that nutrient supplies remain adequate throughout the course of the experiment. For example, if the culture medium is depleted of 13C6-glucose by the cells before the end of the tracing period, the resulting intracellular 13C metabolite labeling patterns will likely reflect a state of altered growth and/or metabolic adaptation to alternative energy sources rather than glucose-driven labeling patterns observed during pseudo-steady-state growth. Similarly, premature depletion of glutamine tracer by cells during a glutamine tracer experiment might result in the diversion of glucose-derived carbon into pathways normally fueled by glutamine in the cultured cells. Significant unintended changes in nutrient levels and the resulting compensatory changes in cellular metabolism will make biological interpretation of metabolite labeling patterns exceedingly difficult.
Population doubling times and metabolic rates can vary greatly between different cell lines even of the same nominal origin (e.g., MDAMB231 cells double in 18 h, whereas ZR75–1 double in 80 h in rich media) [12]. Mouse cells typically double faster than analogous human cells, and the rate of metabolism reflects this difference [28]. In order to minimize the confounding effects of changing nutrient availability during the tracer experiment, preliminary experiments should be conducted in order to assess the growth rate (doubling time) and bulk utilization of the major fuels of cultured cancer cells, i.e., glucose and glutamine. These measurements can be performed using cell counting and relatively inexpensive enzymatic methods, ready-made kits, mass spectrometry, or NMR. We routinely measure the concentrations of glucose, lactate, and glutamine in both freshly prepared culture medium and in spent culture medium supernatants from experiments using immobilized enzyme electrode amperometry (YSI 2950 Bioanalyzer), which allows direct measurement of metabolites in culture medium without the need for extraction/deproteinization. The results of these simple analyses help to determine optimal cell seeding densities for stable isotope tracer experiments and can also aid in the determination of whether initial cell extracts from a stable isotope tracer experiment should be further processed and submitted for NMR and mass spectrometry analyses or discarded due to loss of adequate nutrient supplies. It is important to keep in mind that true steady-state maintenance of the extracellular environment can never be achieved in a standard culture dish [29]. Quantitative metabolite flux experiments require complex control of medium components to maintain steady-state conditions using a chemostat, sampling of multiple time points, and in-depth computational modeling of metabolic network kinetics [2, 30–32].
Another factor to take into consideration is whether a genetic manipulation or drug treatment might result in reduced cell growth rate. For instance, treatment with a cytostatic drug will result in reduced cell numbers at the end of the experiment. If this is the case, cell dishes in the “treated” group may need to be seeded at a higher density than the control group in order to obtain sufficient cell biomass for metabolite extraction at the end of the experiment. Careful consideration of the effects of decreased cellular proliferation on isotope labeling patterns will need to be included during subsequent data analysis [2].
Although the majority of routine mammalian tumor cell culture work is performed using either DMEM or RPMI 1640 culture medium with the desired tracer nutrient replaced by the corresponding stable isotope-enriched counterpart at the identical concentration, recent studies have underscored the influence of the nonphysiological nutrient concentrations and lack of certain metabolites in these culture media on cellular metabolism in culture [33]. In addition to containing nonphysiological concentrations of vitamins and amino acids [28], culture media including DMEM and RPMI 1640 also lack metabolites that are found in human plasma [34], which have been shown to influence cell metabolism and drug susceptibility [33]. These findings led to the development of a new medium formulation, human plasma-like medium (HPLM), which better recapitulates the in vivo human setting [33]. However, preparation of customized media is both tedious and costly, and to date HPLM is not commercially available. In most cases, cancer researchers aim to incorporate the data obtained from SIRM experiments into a larger dataset encompassing other biological outcomes such as gene and protein expression, drug susceptibility studies, analysis of invasion potential, protein subcellular localization studies, gene knockdown or overexpression, functional analysis of gene mutations, hypoxic response, respiration studies, etc. Thus, if all possible, the stable isotope tracer experiment should be performed under identical culture conditions as those employed for other biological experiments.
1.3. Dialyzed FBS vs Non-dialyzed FBS
Dialyzed FBS is a preferred additive for stable isotope tracer experiments with mammalian cells because it retains most of the growth factors and lipids present in FBS but lacks the small molecule metabolites present in non-dialyzed serum. Depending on the stable isotope tracer and associated pathways being evaluated, the natural abundance metabolites present in non-dialyzed FBS could confound the interpretation of both extracellular and intracellular metabolite labeling patterns. Table 1 lists natural abundance concentrations of some commonly evaluated metabolites found in two separate lots of FBS obtained from two different commercial sources, measured amperometrically using a YSI 2950 Bioanalyzer. When used at the standard supplementation rate of 10%, these non-dialyzed FBS reagents would contribute ~0.4–0.8 mM natural abundance glucose and ~0.8–1.8 mM natural abundance lactate to the tracer medium. The presence of these unlabeled substrates and products of glycolysis would need to be considered in the interpretation of pseudo-steady-state labeling patterns of both intracellular and extracellular metabolites. This issue would be avoided with dialyzed FBS, as the concentrations of natural abundance glucose and lactate in two separate lots were 50–100-fold lower than the non-dialyzed FBS (Table 1). Also notable is the persistence of small amounts of carbohydrate and lactate in the municipal water supply, underscoring the need to utilize double-deionized water for experiments and to avoid the contamination of dishes and sample tubes by stray pieces of ice from the ice tray.
Table 1.
Total metabolite concentrations measured amperometrically (YSI 2950 Bioanalyzer) in non-dialyzed and dialyzed FBS samples as well as laboratory water sources
| Standard heat-inactivated FBS |
Dialyzed FBS |
Water sources |
||||||
|---|---|---|---|---|---|---|---|---|
| Mfg #1, batch #1 | Mfg #1, batch #2 | Mfg #2, batch #1 | Mfg #2, batch #2 | Mfg #1, batch #1 | Mfg #1, batch #2 | Tap H2O, Bethesda, MD, USA | ddH2O | |
| d-glucose, mM | 7.95 | 4.74 | 3.82 | 2.75 | 0.05 | 0.08 | 0.04 | 0.00 |
| l-lactate, mM | 18.2 | 8.25 | 14.44 | 17.9 | 0.17 | 0.18 | 0.03 | 0.00 |
| l-glutamine, mM | 0.38 | 0.1 | 0.65 | 0.47 | 0.01 | 0.01 | 0.00 | 0.00 |
| l-glutamate, mM | 0.87 | 0.57 | 0.67 | 0.75 | 0.00 | 0.00 | 0.02 | 0.03 |
| K+, mM | 10.7 | n/a | n/a | 10.5 | n/a | n/a | 0.2 | 0.0 |
| NH4+, mM | 2.9 | n/a | n/a | 2.2 | n/a | n/a | 0.01 | 0.0 |
In our own experience with tumor cell lines that are deficient in Krebs cycle enzymes and/or respiratory chain components, we have found that some cell lines exhibit attenuated growth in dialyzed FBS, an effect that is likely due to auxotrophy for one or more small molecule metabolites present in FBS such as uridine, uric acid, etc. Many cell lines require an adaptation period of several days in the presence of dialyzed FBS, presumably to allow for transcriptional changes and metabolic adaptation, before the growth rate is restored to suitable levels. For these reasons, it is important to perform pilot experiments to test the growth characteristics of the cell line of interest in dialyzed FBS. It may also be important to test whether gene expression in the pathway(s) of interest is modulated by growth of the cells in dialyzed FBS, as metabolic compensation might occur in the absence of small molecule nutrients supplied in non-dialyzed FBS. As a rule of thumb, the same batch of dialyzed and non-dialyzed FBS should be utilized for all experiments in a project to maintain consistency of experimental results [28]. Finally, in tracer studies where extracellular vesicles such as exosomes are to be isolated or their influence on cell metabolism studied, exosome-free FBS (either non-dialyzed or dialyzed) should be adopted. Exosome-free FBS can be prepared using ultra-centrifugation or purchased commercially.
1.4. Other Considerations of Tissue Culture Experiments
Other practical factors are also important to consider in minimizing variations in tissue culture conditions. Adequate humidity in the incubator should be maintained by ensuring that ample water is present in the incubator water tray or by acquiring an incubator that has an active humidification system. If possible, the stable isotope tracer experiment should be conducted in a dedicated incubator that is free of vibrations and will not be opened and closed excessively during the experiment. Excessive opening and closing of the incubator door leads to transient decreases in CO2 concentration, resulting in fluctuations in culture medium pH due to changes in bicarbonate concentration and drying of the internal environment due to injection of dry CO2 gas to restore CO2 levels. Fluctuation in humidity is especially pertinent in tri-gas incubators operating at O2 concentrations that are far below the ambient (~21% O2), as large quantities of dry nitrogen gas are injected into the incubator to decrease the O2 concentration. Table 2 shows the results of an experiment in which triplicate 10 cm dishes without cells were filled with 15 mL of DMEM/10% non-dialyzed FBS medium and allowed to incubate at 37 °C unperturbed in a 95% room air/5% CO2 atmosphere, in either a well-humidified incubator or in an incubator in which the water tray was allowed to become dry. Plates incubated in the non-humidified incubator for 40 h showed an approx. 5% decrease in total mass, indicative of significant culture medium evaporation. In contrast, the dishes incubated in the humidified incubator lost only 1.3% of their mass over the same incubation period. The evaporative losses in the inadequately humidified incubator showed significant effects on the observed concentrations of glucose, lactate, and glutamine in the spent culture medium samples. Namely, glucose and lactate concentrations increased by 16–17%, while glutamine concentrations decreased by 1.3% in samples incubated in the non-humidified incubator. In contrast, glutamine concentration decreased significantly by 9% in the well-humidified incubator, likely reflecting the conversion of glutamine to NH4+ and pyroglutamate [35], an effect that was masked in the non-humidified incubator due to evaporative loss of water in the dish. Differences in medium metabolite fluxes in non-humidified versus humidified growth conditions can also be attributed to altered cell physiology (e.g., reduced growth rate; Fan, unpublished data) and are likely to involve increases in culture medium osmolality. Thus, a poorly controlled incubator environment can considerably influence the interpretation of apparent metabolite uptake and secretion rates (Table 2).
Table 2.
Evaporation and changes in metabolite concentrations in culture dishes incubated in humidified versus non-humidified incubators
| t = 0 | Humidified | Non-humidified | |
|---|---|---|---|
| Plate mass, % ctl | 100% | 98.7% | 95.1% |
| [glucose], mM | 11.5 | 12.1 | 13.4 |
| [glucose], % t = 0 | 100% | 104.9% | 115.8% |
| [lactate], mM | 1.76 | 1.86 | 2.06 |
| [lactate], % t = 0 | 100% | 106.0% | 117.0% |
| [glutamine], mM | 2.94 | 2.67 | 2.90 |
| [glutamine], % t = 0 | 100% | 91.0% | 98.7% |
Finally, other general good practices in tissue culture are of the utmost importance in metabolomics experiments, in order to justify the significant cost, time, and effort involved in acquisition, analysis, and interpretation of metabolomics data. Cell lines should be regularly tested for mycoplasma, as this cryptic and antibiotic-resistant contaminant microbe can go unnoticed indefinitely in tissue cultures [28], and by nature of its physical attachment to cells in tissue culture, mycoplasma is very likely to significantly alter cellular metabolism [36]. Unless specifically desired for differentiation or other physiological strategies, cells should be seeded evenly across the dishes and should not be allowed to become 100% confluent before quenching and extraction, as some cell lines undergo contact inhibition and thus will not be in log-phase growth at the time of harvest. In some cases, cells may also show dramatic differences in intracellular metabolite levels depending on their state of confluence [37]. Cell size can vary greatly across different cell lines; thus, initial cell seeding numbers and the number of cells present at 100% confluence can be very different. In general, it is a good practice to perform initial experiments to determine the number of cells required for seeding of culture dishes such that the cells are at 70–90% confluence at the time of harvest.
1.5. Sample Preparation for Stable Isotope-Resolved Metabolomics
Numerous protocols exist for metabolite quenching/extraction from mammalian cells [3, 19, 25, 38, 39]. There is no single sample preparation technique that can quantitatively recover all intracellular metabolites, as some metabolites are inherently labile and prone to degradation, and some others are less extractable using a universal solvent system. Notable examples of metabolites that can be degraded during extraction procedures include NADPH and to a lesser extent NADH, both of which show decreased stability in acidic conditions [40]. Glutamine is inherently unstable in culture medium [35], and metabolite extraction procedures can cause marked conversion of glutamine to pyroglutamate [41]. Issues with glutamine degradation can also arise as a direct result of ionization in the mass spectrometer [42]. Direct, in-cell derivatization of labile metabolites has been shown to be useful for detection of unstable carbonyl- and aldehyde-containing metabolites including oxaloacetate, dihydroxyacetone phosphate, glyceraldehyde 3-phosphate, and acetoacetate [21, 43]. Derivatization has also been shown to be useful for resolving multiple labeled amino acids by direct infusion and ultrahigh-resolution mass spectrometry [22].
Careful studies in E. coli have demonstrated that significant metabolite decomposition can occur as an artifact of the extraction procedure [44] and that acetonitrile is a superior solvent for metabolite extraction in E. coli, especially in the case of the preservation of nucleoside triphosphates [45]. Such improvements in extraction techniques were employed in the quantitative evaluation of total metabolite concentrations and metabolite enzyme occupancy in E. coli [46]. In mammalian cells, acetonitrile-water was also found to be a superior polar metabolite extraction solvent [19]. When acetonitrile-water extraction is combined with a second chloroform-methanol extraction, this single procedure can yield extracts suitable for analysis of polar metabolites, total cellular lipids, and cellular proteins all from one sample, e.g., [7, 14]. This metabolite extraction procedure, termed the Fan extraction method by the first author, is outlined below in Subheading 3.2.
2. Materials
Laminar flow biosafety cabinet for tissue culture work.
Dual-gas (CO2) or tri-gas (CO2, N2) humidified, temperature-regulated incubator.
37 °C heated water bath
10 cm tissue culture treated culture dishes (see Note 1)
Electric pipettor and serological pipettes (5, 10, 25 mL).
Vacuum aspirator fitted with tubing and disposable 2 mL plastic aspirator pipettes.
15 mL polypropylene conical vials (Sarstedt)
50 mL polypropylene conical vials (Sarstedt)
1.5 mL polypropylene Eppendorf tubes
2.0 mL polypropylene screw-top vials
0.5 mL polypropylene screw-top vials
2.0 mL screw-top glass vials
Basal DMEM: DMEM without glucose, glutamine, pyruvate, and phenol red (see Note 2).
Dialyzed FBS (see Note 3) [or exosome-depleted FBS (e.g., Gibco# A2720801) if you are studying exosomes].
0.5% phenol red solution (see Note 4)
Stable isotope tracer (e.g., 13C6-d-glucose, 13C5-l-glutamine, 13C5, 15N2-l-glutamine, etc.) (see Notes 5 and 6).
HPLC-grade acetonitrile (see Note 9).
HPLC-grade methanol (see Note 9).
HPLC-grade chloroform (see Note 9).
2:1 chloroform/methanol-BHT solution (see Note 9)
Disposable plastic cell lifters (corning costar #3008) (see Note 10).
Ice buckets.
Rectangular anodized metal plate of at least 14 × 28 cm (e.g., Biocision, Inc. #BCS-123).
Phosphate-buffered saline (PBS), pH 7.4: 1.06 mM KH2PO4, 2.97 mM Na2HPO4, 155 mM NaCl.
Fine-tipped transfer pipettes (e.g., Samco scientific #235).
Freezer lyophilizer equipped for handling organic solvents (see Note 11).
Vacuum centrifuge (Eppendorf Vacufuge plus, fitted with rotors for both 1.5 mL tubes and for 2.0 mL glass vials) (see Note 12).
3. Methods
3.1. Metabolic Labeling of Adherent-Cultured Mammalian Cells
Perform preliminary experiments using tracer medium prepared with the desired natural abundance 12C tracer counterpart to ensure that the tracer medium composition is suitable to support cell growth and that nutrient levels remain adequate throughout the duration of the experiment. Considerations include (1) assessment of adequate cell growth rate in tracer medium, (2) determination of the target cell seeding density such that cells will reach 70–90% confluence at the time of quenching/harvest, (3) selection of a tracer incubation time that equals or exceeds the cell population doubling time in order to approach pseudo-steady-state labeling of many intracellular metabolites, and (4) determination of bulk metabolite uptake and secretion at the end of the labeling period to ensure that the major nutrients (e.g., glucose and glutamine) are not depleted at the end of the labeling period.
Seed cells in 10 cm dishes in 10–25 mL tracer medium (see Note 13) containing natural abundance tracer compound (i.e., 12C-glucose and 12C-L-glutamine) 1 or 2 days prior to the labeling experiment, and allow them to attach and proliferate (see Notes 14 and 15) (see Note 19 for alternative protocol for non-adherent cells).
Prepare tracer media freshly and equilibrate to 37 °C several hours prior to addition to the culture dishes. Also, prewarm a sufficient quantity of basal DMEM (without FBS or any other added compounds) to allow for washing each plate once with 10 mL basal DMEM (see Note 16).
Remove the culture dishes from the incubator, and aspirate the 12C tracer medium using vacuum aspiration. Gently add 10 mL of warm DMEM basal medium, rock the plate by the hand several times, and then aspirate. Finally, add 10–25 mL of prewarmed 13C tracer medium to each plate, remove 0.2 mL of medium (T = 0), and weigh plate on a three-place balance before returning plates to the incubator. For each type of tracer medium used, include one blank plate in which no cells are seeded but tracer medium is added. This plate is incubated alongside the plates with cells and serves as the blank plate (see Fig. 1, Subheading 1.2, and Notes 17 and 18).
On the next day, set up the lab bench for medium harvest and cell quenching by obtaining several trays of ice and pre-labeling all of the tubes that will be needed. In one ice tray, place a slab of rectangular metal of at least 14 × 28 cm (e.g., Biocision, Inc. #BCS-123) horizontally, tilted toward the front of the bench by approximately 35. Precool a bottle of HPLC-grade acetonitrile to −20 °C.
At the end of the incubation period, weigh plates using the same balance, and remove the plates from the incubator in groups of three at a time. Place the dishes on the metal slab, with the pen mark on the side of the dish facing you. Transfer 1 mL of medium from each plate to a snap-cap microcentrifuge tube, and set the tube aside on ice for subsequent processing and extraction. Aspirate the remainder of the tracer medium using a fine-tipped transfer pipette into a 15 mL conical centrifuge tube if the medium is to be harvested or using the vacuum aspirator fitted with a disposable 2 mL plastic aspirator pipette if the medium is to be discarded (for non-adherent cells, see Note 19).
Wash the dishes three times with 10 mL ice-cold PBS by gently adding the PBS to the side of the dish where the mark is and aspirating from the dish wall slightly above the same spot each time to minimize cell loss. Make sure that the entire circumference of the dish wall and the entire surface of the plate are rinsed by each of the three washes by gentle rocking of the dish during each wash. After the third wash, allow the dish to remain tilted toward you at ~35° on the metal block with the pen mark facing toward you. Carefully observe the walls of each dish, and aspirate any residual liquid that might remain on the walls of the circumference of the plate while residual liquid on the plate is collecting near the pen mark. Finally, aspirate again any additional residual fluid from the bottom of the plate (see Notes 20 and 21).
Immediately add 1 mL cold (−20 °C) acetonitrile to quench cell metabolism. Ensure that the solvent covers the entire surface of the dish by gently but rapidly shaking the plate horizontally. Place the culture dishes on a shelf in a −20 °C freezer, and incubate for 5–20 min.
Remove the dishes from the freezer, and return to the ice-cold metal block. Add 0.75 mL ice-cold ddH2O, and gently rock the dish to ensure mixing of the water and acetonitrile (see Note 22).
With the plate angled at ~35° toward you resting on the ice-cold metal, scrape the cells and solution toward the bottom of the dish using a cell lifter with firm circular motions until all material has been scraped to the lower end of the dish. Next, rotate the dish by 90° and scrape the remaining cells and fluid to the bottom of the dish (see Note 23).
Transfer the quenched cells and solvent to a 15 mL conical centrifuge tube, and then repeat steps 8 and 9 but omit the −20 °C incubation step. The resulting volume in the 15 mL conical vial is typically ≥ 3.2 mL. The final solvent composition is 2:1.5 (acetonitrile-water). This solution can be kept on ice for several hours before proceeding to chloroform extraction or stored at −80 °C for up to 1 week pending chloroform extraction.
After all dishes of cells have been quenched and scraped, centrifuge the 1 mL culture medium samples at 3000 × g for 10 min at 4 °C in a microcentrifuge to remove any floating cells and large debris.
Transfer 900 μL of the resulting culture medium supernatant to a new pre-labeled tube for storage at −80 °C until metabolite extraction. A 100 μL of this culture medium sample can be stored separately for direct acetone extraction. Culture medium metabolite extraction procedures are outlined in Subheading 3.3.
3.2. Cell Metabolite Extraction Using the Fan Extraction Method
- Pre-label all tubes to be used during the phase separation and extraction:
- Aqueous/polar fraction: 5 mL snap-cap Eppendorf tube, pre-weighed to 0.1 mg precision. Label simply and clearly with sample number; it will be discarded after aliquoting of the polar phase.
- Nonpolar/lipid fraction: 2 mL screw-cap glass vial with Teflon-faced liner, wrap with clear scotch tape around the side of the vial to protect labeling.
- Protein fraction: 1.5 mL snap-cap Eppendorf tube (pre-weighed to 0.01 mg precision if protein dry mass is desired), taped around the side to protect labeling (see Note 24).
Add 1 mL ice-cold chloroform to the acetonitrile-water cell extracts in their 15 mL conical tubes, using a pre-wetted 1 mL polypropylene micropipette tip. Seal the tubes tightly, and shake the extracts vigorously up and down at least 60 times manually or on a vortexer (see Note 25).
Centrifuge the extracts in a refrigerated swinging-bucket centrifuge at maximum speed (typically 3000–4650 × g, depending on the model of the centrifuge), 4 °C, 30 min. The extracts will separate into three phases: An upper aqueous phase containing polar metabolites, a lower nonpolar chloroform phase containing lipids, and a middle phase containing denatured proteins and other macromolecules. Gently transfer the tubes to an ice bucket, taking care not to disrupt the phase separation (see Note 26).
Transfer ~90% of the aqueous phase to pre-tared (±0.1 mg) 5 mL Eppendorf tube using a fine-tipped transfer pipette, taking care not to disrupt or transfer any of the denatured protein layer along with the aqueous phase. The remaining aqueous phase will be recovered during the second extraction. Save the transfer pipette for the second extraction.
Transfer ~90% of the lower chloroform phase to a 2 mL glass vial until the vial is filled to the neck, using a gel-loading 200 μL pipette tip; save the tip for a second transfer (see Note 27).
Place the 2 mL glass vial in a vacuum centrifuge, and reduce the volume of the chloroform fraction by vacuum centrifugation for 30 min without heating.
Centrifuge the 15 mL conical vial containing the remaining polar and nonpolar fractions as well as the protein fraction for 5 min at maximum speed at 4 °C. if more than ~400 μL of nonpolar fraction remains in the 15 mL vial, transfer more nonpolar fraction to the respective 2 mL glass vial after the volume has been reduced sufficiently by vacuum centrifugation, until <100 μL of nonpolar fraction remains.
Using a 1 mL pipettor set to 500 μL, mix the protein fraction along with the polar and nonpolar fractions until the protein fraction is sufficiently dispersed to allow for the transfer of the remaining contents of the 15 mL tube to the 1.5 mL protein fraction tube. Set aside this pipettor with the tip still attached. Using a separate 1 mL micropipette, add 350–500 μL ice-cold chloroform-methanol/1 mM BHT to the 15 mL vial. Then use the first pipettor and tip to pipette the solution up and down, washing the residual protein residue from both the walls of the tube and the inner surfaces of the pipette tip. Transfer the protein and chloroform-methanol/BHT wash to the protein fraction tube (see Note 28).
Vigorously shake and vortex the protein fraction tube for >1 min and then centrifuge the tube at maximum speed in a refrigerated microcentrifuge for 20 min at 4 °C, with the hinges of the tubes facing away from the center of the rotor.
Transfer as much of the upper aqueous layer in the protein fraction tube as possible to the 5 mL polar phase Eppendorf tube using the transfer pipette from step 4 while avoiding disruption or transfer of the middle protein layer. Weigh the resulting polar fraction, and subtract the initial tube weight to determine the total weight of the polar metabolite fraction (see Note 29).
Transfer all but ~10–20 μL of the lower nonpolar lipid fraction to the 2 mL glass lipids vial, and return the lipid vials to the vacuum centrifuge, and evaporate to dryness. As soon as the lipid fractions are dry, add 300 μL of chloroform-methanol/BHT solution to them, cap the glass tube tightly, vortex gently, and store at −80 °C until analysis (see Note 30).
Add 500 μL of cold methanol to the protein fraction, vortex briefly, and then centrifuge the tube at maximum speed in a refrigerated microcentrifuge for 10 min at 4 °C with the hinges of the tubes facing away from the center of the rotor. Carefully aspirate the supernatant using a gel-loading tip via vacuum suction or a 1 mL pipette, taking care not to disrupt the protein pellet (see Note 31).
Evaporate the protein residues to dryness by vacuum centrifugation (~25–30 min). Subsequently, on the same day, measure and record the mass of the protein fraction tube with the dried protein residue to 0.01 mg and subtract the tare weight of the same tube to obtain the mass of the dry protein residue, if desired. The expected residue mass is 0.5–2 mg (see Note 32).
The polar fraction can be sub-aliquoted into many fractions and stored in polypropylene screw cap or Eppendorf tubes for different analyses. Half or more of the polar fraction in the 5 mL tube is suitable for analysis by high-field NMR spectroscopy [14, 15]. One eighth of the polar fraction in a 2 mL glass vial is suitable for MTBSTFA derivatization for analysis by GC-MS [14, 16] or ion chromatography (IC)-FTMS analysis [7, 14, 47]. One 16th of the polar fraction in a 2 mL screw-cap tube is suitable for multiple direct infusion FT-MS analyses [16, 22, 48] (see Note 33).
Cap all aliquot tubes with screw caps or snap caps containing 3–6 small perforations on top, and freeze all tubes upright in flexible 9 × 9 cardboard racks by placing them in ~1 cm of liquid nitrogen in a Styrofoam or other cold-resistant tray. After all aliquots reach liquid nitrogen temperature, rapidly transfer the racks to a suitably sized lyophilization can and apply vacuum as quickly as possible. Lyophilize to dryness for 18–24 h; the polar aliquots should remain frozen under the vacuum for the duration of the lyophilization period (see Note 11). After lyophilization, replace the perforated caps with tightly sealed pre-labeled caps and store at −80 °C until analysis.
3.3. Acetone Extraction of Culture Medium
Proteins in culture medium are chemically precipitated using cold 80% acetone and removed by centrifugation, and the supernatant is collected for downstream analyses.
Add 400 μL of ice-cold acetone to a 100 μL aliquot of culture medium in a microcentrifuge tube.
Vortex vigorously and then incubate the samples in a −80 °C freezer for >30 min.
Remove the precipitated samples from the freezer, and centrifuge them at maximum speed (15–20 K × g) for 10 min at 4 °C.
Transfer the clarified supernatant to a new tube(s), and remove the solvent using either a vacuum microcentrifuge, or freeze-dry using a lyophilizer fitted with a liquid nitrogen pre-trap (see Notes 34 and 35).
3.4. Culture Medium Protein Removal Using Ultrafiltration
Proteins are removed by centrifugal ultrafiltration using 10,000 molecular-weight-cutoff dialysis membranes, and the flowthrough is collected for downstream analyses.
300–400 μL of culture medium is added to the top of an ultrafiltration spin column (e.g., Millipore Ultracel YM-10) after extensive wash with ddH2O.
Centrifuge the spin column at 5000 × g for 30 min at 4 °C in a microcentrifuge.
Collect 100 μL of the filtrate flowthrough, and remove the solvent using either a vacuum microcentrifuge, or freeze-dry using a lyophilizer fitted with a liquid nitrogen cold trap (see Notes 35 and 36).
Acknowledgments
This work was supported by the Intramural Research Program of the National Cancer Institute, NIH, NIH 1U24DK097215-01A1, 1P01CA163223-01A1, and 3R01ES022191-04S1.
Footnotes
Poly-d-lysine or collagen-coated plates can be used for cells that are poorly adherent.
Some cell lines, including mtDNA-deficient rho-0 cells and patient-derived fumarate hydratase-deficient (FH−/−) tumor cell lines, grow poorly or not at all in culture medium made with dialyzed FBS without supplementation of 1 mM pyruvate. The necessity for the presence of pyruvate in the culture medium should be evaluated prior to the tracer experiment; we typically do not supplement with exogenous pyruvate unless it is necessary for cell proliferation.
The part number given here is for pre-dialyzed FBS; however, dialyzed FBS can be prepared in-house with substantial savings in cost.
While not required for tissue culture, phenol red is an invaluable tool that allows the researcher to continuously monitor the pH of the culture medium. An excessively pink color indicates greater alkalinity, usually due to loss of bicarbonate buffering by prolonged exposure of the medium bottle to room air atmosphere. Yellowing of the culture medium is frequent in highly glycolytic tumor cell cultures and is indicative of substantial acidification due to lactate secretion and possible depletion of glucose in the culture medium. Yellowing of the culture medium can also be an early indicator of bacterial contamination. Finally, changes in the color of phenol red sometimes occur after additions of drugs or other chemicals, immediately indicating the need for pH adjustment of the agent before addition to the culture medium. Caution must be taken with cells that are estrogen-sensitive, as phenol red has been reported to be a weak estrogen mimetic [49], though this may be due to lipophilic impurities in certain phenol red preparations rather than the pH indicator itself [50].
The choice of the tracer to be used depends on the goals of the project. Some strategies for tracer selection in mammalian cell tracer experiments are presented in the following references [3, 12, 18, 22, 25].
- Prepare 46.5% (w/v) 13C6-glucose (2.498 M) volumetrically using a volumetric flask. For example, for a 10 mL solution, weigh 4.65 g of 13C6-glucose powder into the flask, and bring up to 10 mL volume line with ddH2O. 45% (w/v) 12C-glucose solution (2.498 M) is prepared in the same way using 4.5 g of natural abundance D-glucose. The solutions should be sterile filtered using a 0.22 μm syringe filter and stored in a Parafilm-wrapped vial at 4 °C for several months or in aliquots in tightly sealed vials at −80 °C for years.
- Prepare 200 mM l-glutamine solutions using the appropriate molecular weight of the tracer compound in ddH2O (e.g., 12C-l-glutamine MW = 146.14 g/Mol, 13C5-l-glutamine MW = 151.11 g/Mol). The solution should be sterile filtered using a 0.22 μm syringe filter and immediately aliquoted in vials and stored at −80 °C for at least 1 year. Repeated freeze and thawing of the stock solution should be avoided.
- Dialyzed FBS can be stored in aliquots of 10–45 mL in sealed polypropylene conical vials at −20 °C or −80 °C.
For a typical tracer experiment such as the schemes shown in Fig. 1, prepare 300 mL basal tracer medium by combining 30 mL dialyzed (or exosome-depleted) FBS with 270 mL basal DMEM and optional 300 μL of 0.5% phenol red solution. Sterile filter using a disposable 500 mL 0.2 μm filter unit. Dialyzed FBS tends to show flocculence following freezethaw cycles; sterile filtration of the final solution ensures that any particulate matter is removed from the tracer medium. Prepare tracer media as required by the experimental design. We typically supplement basal DMEM media with 11 mM d-glucose (0.2%) and 2 mM l-glutamine (e.g., 11 mM 13C6-d-glucose plus 2 mM 12C-l-glutamine or 11 mM 12C-d-glucose plus 2 mM 13C5-l-glutamine).
Unless it is explicitly part of your downstream analysis strategy (e.g., [22]), never include more than one tracer molecule in a given tracer medium preparation. Also, doubly labeled tracers such as 13C5- and 15N2-l-glutamine should not be utilized unless downstream analyses will include platforms that are able to distinguish the two heavy isotopes (e.g., 1H/13C/15N NMR or ultrahigh-resolution Orbitrap or ion cyclotron Fourier-transform mass spectrometry). Be sure to prepare ~3–5 mL excess of each type of tracer medium for sufficient distribution into each plate, and remember to include enough medium for the blank plates with no cells.
- Decant 100 mL of HPLC-grade acetonitrile into an amber bottle and store at −20 °C.
- Decant 100 mL of HPLC-grade methanol into an amber bottle and store at −20 °C.
- Decant 100 mL of HPLC-grade chloroform into an amber bottle and store at −20 °C.
- Prepare 100 mL of chloroform/methanol-BHT solution, prepare a 100 mM butylated hydroxytoluene (BHT) stock solution in HPLC-grade methanol, and then prepare 100 mL of 2:1 chloroform/methanol-1 mM BHT in an amber bottle by combining 66 mL chloroform with 32 mL methanol and 1 mL of 100 mM BHT stock solution in an amber bottle. Seal tightly, and store at −20 °C.
The cell lifter is superior to hinged cell scrapers because more force can be applied at a 45° angle to scrape the solvent and quenched cells.
This metabolite extraction procedure calls for freeze-drying/lyophilization of the resulting polar fraction aliquots. Freeze-drying allows for the removal of solvents and water from the polar fraction while maintaining the sample at below freezing temperature and minimizing exposure of the sample to oxygen during the drying process by the maintenance of high vacuum [51] and is far superior to vacuum centrifugation for the quantitative preservation of the maximum number of metabolites. However, depending on the stability of the metabolite(s) of interest, other evaporative techniques could be utilized for sample concentration, including vacuum centrifugation or drying under a flow of nitrogen gas.
The liquid nitrogen pre-trap is important for lyophilizers fitted with oil-containing pumps, as the solvents with very low melting points (e.g., methanol, acetone) derived from the sample will degrade the pump oil over time and lead to premature failure of the pump.
An alternative currently being evaluated by D.R.C. is to utilize a − 86 °C lyophilizer with a Teflon-coated condenser chamber and coils, attached to an oil-free Edwards scroll pump with silencer kit, with the open ballast venting into a chemical fume hood.
A vacuum centrifuge fitted with an oil-free diaphragm pump (e.g., Eppendorf Vacufuge plus™) is desirable for the evaporation of solvents such as methanol and chloroform, as oil-containing vacuum pumps are subject to the same solvent issues as discussed above.
The standard quantity of 10 mL of tracer medium per 10 cm dish is used for routine experiments. However, for very rapidly growing cells such as HEK293 or cells exhibiting extraordinarily high levels of aerobic glycolysis (e.g., mtDNA-depleted cells or Krebs cycle enzyme-deficient tumor cells), greater amounts of medium may be needed to sustain adequate nutrient levels during routine culture and during the tracer labeling period.
The metabolite extraction procedure outlined in this protocol allows for obtaining a protein residue for subsequent quantification and normalization of metabolite levels. If you choose a different metabolite extraction protocol that does not allow for recovery of cellular protein, then additional dishes can be included to allow for cell counting and/or cellular protein determination for inferred normalization of metabolite concentrations [3]. However, this practice is imprecise, as each plate will be seeded somewhat differently and should not formally be used for normalization of a separate plate.
Many cell lines require 24 h or more to adhere, stabilize, and enter into log-phase growth. Do not seed the cells, and initiate the tracer labeling period simultaneously.
If the medium is excessively pink (alkaline) due to loss of bicarbonate to the air as CO2, the media can be left in the 5% CO2 incubator for several hours to overnight with the lid loosened to allow for re-equilibration of the bicarbonate buffering system.
At the beginning of the experiment, use a permanent marker to mark the lower outer wall of the culture dish indicating where aspiration and additions will occur throughout the subsequent steps of culture and quenching. This, together with aspiration slightly above the mark, will help to minimize cell loss and keep the loss more consistent across the dishes and treatment groups during the course of experiment.
If an inverted phase-contrast microscope with a camera is available, then take a picture of one or more regions of the dish from at least one replicate of each treatment group before and after the tracer incubation period. This will reveal any morphological or cell number changes in the tracer experiment.
- Collect cells and medium from each dish in a conical tube, and centrifuge at 350 × g, 5 min, 4 °C. Weakly adherent cells can be collected by gentle trituration of the tracer medium over the plate until cells are detached.
- Collect 1 mL of culture medium supernatant, and set aside for subsequent processing and extraction.
- Vacuum aspirate the remainder of the tracer medium with a fine pipette tip, add 10 m L of ice-cold PBS, and gently triturate the cell pellet. Centrifuge at 350 × g, 5 min, 4 °C, and then vacuum aspirate the supernatant.
- Repeat step 3 once, taking care to vacuum aspirate as much PBS as possible during the second aspiration.
- Immediately add 1 mL cold (−20 °C) acetonitrile, and vortex the mixture in pulses to resuspend the cells. If clumps of cells are still visible, then triturate up and down with the 1 mL pipette tip to break up the clumps.
- Add 0.75 mL ice-cold ddH2O and vortex, then add an additional 1 mL of acetonitrile and 0.75 mL ddH2O, and proceed to step 11 in Subheading 3.1.
Work quickly, and minimize the time between which the culture dishes leave the incubator and the cells are quenched with solvent, thus minimizing the time that elapses between removal of the dish from the relative equilibrium of the incubator to the time when cellular enzymatic activities are eliminated by the 100% acetonitrile quench.
Prior to metabolite quenching and extraction, it is important to minimize the salt contribution to the final extracts, which can interfere with metabolomics analysis, particularly by mass spectrometry. Residual sodium, chloride, and phosphate ions can interfere with MS analyses via ion suppression and decreased signal-noise ratios in NMR analyses [52]. Be sure to aspirate as much liquid as possible after the last wash.
Greatly reduced salt interference can be achieved by a brief rinse of the dish with Nanopure water (30 s to 1 min) right after removing the medium components with PBS. We have found that this water rinse significantly improved Fourier-transform mass spectrometry performance without loss of cellular metabolites. The water rinse is aspirated rapidly, and the quenching solvent is added immediately.
An internal standard can be included in the ddH20 at this step. 53.3 μM tris, pH 8.0 can be included in the first 0.75 mL ddH20 addition, as a convenient internal standard in 1H NMR analyses.
Think of the cell lifter as a squeegee being used to move all liquid and cell material to the bottom of the plate, reminiscent of squeegeeing a window or windshield after washing it.
High-quality gloss-finish scotch tape is used to protect the writing on the tube from being smeared by solvents during pipetting, centrifugal evaporation, and lyophilization.
This is the commitment step in the metabolite extraction procedure. Once chloroform is added, the fractionation procedure must be completed in the same day, as the chloroform will slowly degrade the polypropylene tubes. Never use polystyrene tubes for metabolite extractions.
If the protein interphase looks excessively thick, fuzzy, or uneven, then centrifuge for an additional 20 min.
If the protein interphase layer is sufficiently abundant and forms a solid white layer, a 1 mL pipette set to 900 μL with a non-filtered polypropylene tip can be carefully teased along the side of the tube, past the protein layer, and down into the chloroform phase. If the protein layer is less abundant or more fluffy, a 200 μL micropipette fitted with a gel-loading tip must be used, with the tip carefully inserted through the protein layer along the side of the tube. In either case, take care not to pipette the aqueous layer by first depressing the pipette plunger down to its first resistance point before inserting it into the tube, then slowly insert the tip past the aqueous and protein phases into the chloroform phase, and then depress the plunger slightly further to expel any aqueous phase until a small air bubble is passed. Then begin to draw the chloroform phase into the tip. Take care to minimize the amount of protein that sticks to the outer wall of the pipette tip.
Loss of some of the protein fraction due to adherence to the walls of the 15 mL conical vial as well as adherence of the protein to the inner and outer walls of the pipette tip is inevitable. The chloroform/methanol-BHT helps to reduce this loss; however, protein recovery is never 100%. Work hard to minimize this fractional loss of protein residue, but most importantly, try to keep the degree of loss consistent across all of the samples.
The net mass yield of the polar fraction can be used to assess consistency between samples and to determine split ratios for polar metabolite fraction aliquots. After weighing, the entire polar metabolite fraction can be stored at −80 °C for several days before thawing, sub-aliquoting, and lyophilization.
Avoid excessive drying time and exposure of the lipid fraction to heat/air. BHT is a preservative used in the food industry to stabilize fats; it is added here to slow the peroxidation of unsaturated lipids and fatty acids.
Make sure that the hinges of the microfuge tubes face outward from the center of the microcentrifuge rotor, so that the resulting protein residue pellet is located at the same position at the bottom of every tube.
Loss of protein residue during vacuum centrifugation can be minimized by attaching a separate cap cut from additional Eppendorf tubes with 4–8 perforations made using an 18-gauge needle or other perforation tool. Proteins can subsequently be redissolved in lysis buffer and their concentration measured by BCA or Bradford assay.
Record the mass of each polar aliquot as it is pipetted in order to determine the exact fraction represented by the aliquot, by dividing the fraction mass by the total mass of the polar fraction. Aliquoting into the polar fraction tubes can be performed directly on an analytical balance and the polar fraction masses recorded as they are being aliquoted.
Approximately 50–75% of the dried culture medium extract is sufficient for analysis by 1H NMR, and 1/8–1/16 quantity of the extract is suitable for mass spectrometry applications.
The choice of solvent removal method for culture medium samples depends on the lability of the metabolite(s) of interest. For example, while lactate and glucose are relatively stable to temperature and pH, other metabolites of potential interest such as glutamine and pyruvate will degrade during vacuum centrifugation.
Approximately 50–75% of the dried extract is sufficient for analysis by 1H NMR.
Centrifugal ultrafiltration membranes contain significant amounts of glycerol that will end up in the sample. If this is an issue, then prerinse and spin the membranes with ddH2O prior to addition of your medium samples to the membranes.
References
- 1.Lane AN, Higashi RM, Fan TW (2016) Preclinical models for interrogating drug action in human cancers using stable isotope resolved metabolomics (SIRM). Metabolomics 12(7). 10.1007/s11306-016-1065-y [DOI] [PMC free article] [PubMed] [Google Scholar]
- 2.Buescher JM, Antoniewicz MR, Boros LG, Burgess SC, Brunengraber H, Clish CB, DeBerardinis RJ, Feron O, Frezza C, Ghesquiere B, Gottlieb E, Hiller K, Jones RG, Kamphorst JJ, Kibbey RG, Kimmelman AC, Locasale JW, Lunt SY, Maddocks OD, Malloy C, Metallo CM, Meuillet EJ, Munger J, Noh K, Rabinowitz JD, Ralser M, Sauer U, Stephanopoulos G, St-Pierre J, Tennant DA, Wittmann C, Vander Heiden MG, Vazquez A, Vousden K, Young JD, Zamboni N, Fendt SM (2015) A roadmap for interpreting (13)C metabolite labeling patterns from cells. Curr Opin Biotechnol 34:189–201. 10.1016/j.copbio.2015.02.003 [DOI] [PMC free article] [PubMed] [Google Scholar]
- 3.Mackay GM, Zheng L, van den Broek NJ, Gottlieb E (2015) Analysis of cell metabolism using LC-MS and isotope tracers. Methods Enzymol 561:171–196. 10.1016/bs.mie.2015.05.016 [DOI] [PubMed] [Google Scholar]
- 4.Sellers K, Fox MP, Bousamra M 2nd, Slone SP, Higashi RM, Miller DM, Wang Y, Yan J, Yuneva MO, Deshpande R, Lane AN, Fan TW (2015) Pyruvate carboxylase is critical for non-small-cell lung cancer proliferation. J Clin Invest 125(2):687–698. 10.1172/JCI72873 [DOI] [PMC free article] [PubMed] [Google Scholar]
- 5.Hensley CT, Faubert B, Yuan Q, Lev-Cohain N, Jin E, Kim J, Jiang L, Ko B, Skelton R, Loudat L, Wodzak M, Klimko C, McMillan E, Butt Y, Ni M, Oliver D, Torrealba J, Malloy CR, Kernstine K, Lenkinski RE, DeBerardinis RJ (2016) Metabolic heterogeneity in human lung tumors. Cell 164 (4):681–694. 10.1016/j.cell.2015.12.034 [DOI] [PMC free article] [PubMed] [Google Scholar]
- 6.Hui S, Ghergurovich JM, Morscher RJ, Jang C, Teng X, Lu W, Esparza LA, Reya T, Le Z, Yanxiang Guo J, White E, Rabinowitz JD (2017) Glucose feeds the TCA cycle via circulating lactate. Nature 551(7678):115–118. 10.1038/nature24057 [DOI] [PMC free article] [PubMed] [Google Scholar]
- 7.Sun RC, Fan TW, Deng P, Higashi RM, Lane AN, Le AT, Scott TL, Sun Q, Warmoes MO, Yang Y (2017) Noninvasive liquid diet delivery of stable isotopes into mouse models for deep metabolic network tracing. Nat Commun 8 (1):1646. 10.1038/s41467-017-01518-z [DOI] [PMC free article] [PubMed] [Google Scholar]
- 8.Faubert B, Li KY, Cai L, Hensley CT, Kim J, Zacharias LG, Yang C, Do QN, Doucette S, Burguete D, Li H, Huet G, Yuan Q, Wigal T, Butt Y, Ni M, Torrealba J, Oliver D, Lenkinski RE, Malloy CR, Wachsmann JW, Young JD, Kernstine K, DeBerardinis RJ (2017) Lactate metabolism in human lung tumors. Cell 171 (2):358–371 e359. 10.1016/j.cell.2017.09.019 [DOI] [PMC free article] [PubMed] [Google Scholar]
- 9.Davidson SM, Papagiannakopoulos T, Olenchock BA, Heyman JE, Keibler MA, Luengo A, Bauer MR, Jha AK, O’Brien JP, Pierce KA, Gui DY, Sullivan LB, Wasylenko TM, Subbaraj L, Chin CR, Stephanopolous G, Mott BT, Jacks T, Clish CB, Vander Heiden MG (2016) Environment impacts the metabolic dependencies of Ras-driven non-small cell lung Cancer. Cell Metab 23(3):517–528. 10.1016/j.cmet.2016.01.007 [DOI] [PMC free article] [PubMed] [Google Scholar]
- 10.Keibler MA, Wasylenko TM, Kelleher JK, Iliopoulos O, Vander Heiden MG, Stephanopoulos G (2016) Metabolic requirements for cancer cell proliferation. Cancer Metab 4:16. 10.1186/s40170-016-0156-6 [DOI] [PMC free article] [PubMed] [Google Scholar]
- 11.Kim J, Hu Z, Cai L, Li K, Choi E, Faubert B, Bezwada D, Rodriguez-Canales J, Villalobos P, Lin YF, Ni M, Huffman KE, Girard L, Byers LA, Unsal-Kacmaz K, Pena CG, Heymach JV, Wauters E, Vansteenkiste J, Castrillon DH, Chen BPC, Wistuba I, Lambrechts D, Xu J, Minna JD, DeBerardinis RJ (2017) CPS1 maintains pyrimidine pools and DNA synthesis in KRAS/LKB1-mutant lung cancer cells. Nature 546(7656):168–172. 10.1038/nature22359 [DOI] [PMC free article] [PubMed] [Google Scholar]
- 12.Lane AN, Tan J, Wang Y, Yan J, Higashi RM, Fan TW (2017) Probing the metabolic phenotype of breast cancer cells by multiple tracer stable isotope resolved metabolomics. Metab Eng 43(Pt B):125–136. 10.1016/j.ymben.2017.01.010 [DOI] [PMC free article] [PubMed] [Google Scholar]
- 13.Liu L, Shah S, Fan J, Park JO, Wellen KE, Rabinowitz JD (2016) Malic enzyme tracers reveal hypoxia-induced switch in adipocyte NADPH pathway usage. Nat Chem Biol 12 (5):345–352. 10.1038/nchembio.2047 [DOI] [PMC free article] [PubMed] [Google Scholar]
- 14.Crooks DR, Maio N, Lane AN, Jarnik M, Higashi RM, Haller RG, Yang Y, Fan TWM, Linehan M, Rouault TA (2018) Acute loss of iron-sulfur clusters results in metabolic reprogramming and generation of lipid droplets in mammalian cells. J Biol Chem 293:8297. 10.1074/jbc.RA118.001885 [DOI] [PMC free article] [PubMed] [Google Scholar]
- 15.Fan TW, Lane AN (2011) NMR-based stable isotope resolved metabolomics in systems biochemistry. J Biomol NMR 49(3–4):267–280. 10.1007/s10858-011-9484-6 [DOI] [PMC free article] [PubMed] [Google Scholar]
- 16.Higashi RM, Fan TW, Lorkiewicz PK, Moseley HN, Lane AN (2014) Stable isotope-labeled tracers for metabolic pathway elucidation by GC-MS and FT-MS. Methods Mol Biol 1198:147–167. 10.1007/978-1-4939-1258-2_11 [DOI] [PMC free article] [PubMed] [Google Scholar]
- 17.Jang C, Chen L, Rabinowitz JD (2018) Metabolomics and isotope tracing. Cell 173 (4):822–837. 10.1016/j.cell.2018.03.055 [DOI] [PMC free article] [PubMed] [Google Scholar]
- 18.Bruntz RC, Lane AN, Higashi RM, Fan TW (2017) Exploring cancer metabolism using stable isotope-resolved metabolomics (SIRM). J Biol Chem 292(28):11601–11609. 10.1074/jbc.R117.776054 [DOI] [PMC free article] [PubMed] [Google Scholar]
- 19.Fan TW-M (2012) The handbook of metabolomics. Springer, New York [Google Scholar]
- 20.Lane AN, Fan TW, Xie Z, Moseley HN, Higashi RM (2009) Isotopomer analysis of lipid biosynthesis by high resolution mass spectrometry and NMR. Anal Chim Acta 651 (2):201–208. 10.1016/j.aca.2009.08.032 [DOI] [PMC free article] [PubMed] [Google Scholar]
- 21.Lane AN, Arumugam S, Lorkiewicz PK, Higashi RM, Laulhe S, Nantz MH, Moseley HN, Fan TW (2015) Chemoselective detection and discrimination of carbonyl-containing compounds in metabolite mixtures by 1H-detected 15N nuclear magnetic resonance. Magn Reson Chem 53(5):337–343. 10.1002/mrc.4199 [DOI] [PMC free article] [PubMed] [Google Scholar]
- 22.Yang Y, Fan TW, Lane AN, Higashi RM (2017) Chloroformate derivatization for tracing the fate of amino acids in cells and tissues by multiple stable isotope resolved metabolomics (mSIRM). Anal Chim Acta 976:63–73. 10.1016/j.aca.2017.04.014 [DOI] [PMC free article] [PubMed] [Google Scholar]
- 23.Lee WN, Boros LG, Puigjaner J, Bassilian S, Lim S, Cascante M (1998) Mass isotopomer study of the nonoxidative pathways of the pentose cycle with [1,2–13C2]glucose. Am J Phys 274(5 Pt 1):E843–E851 [DOI] [PubMed] [Google Scholar]
- 24.Saxena N, Maio N, Crooks DR, Ricketts CJ, Yang Y, Wei MH, Fan TW, Lane AN, Sourbier C, Singh A, Killian JK, Meltzer PS, Vocke CD, Rouault TA, Linehan WM (2016) SDHB-deficient cancers: the role of mutations that impair Iron sulfur cluster delivery. J Natl Cancer Inst 108(1):djv287. 10.1093/jnci/djv287 [DOI] [PMC free article] [PubMed] [Google Scholar]
- 25.Lewis CA, Parker SJ, Fiske BP, McCloskey D, Gui DY, Green CR, Vokes NI, Feist AM, Vander Heiden MG, Metallo CM (2014) Tracing compartmentalized NADPH metabolism in the cytosol and mitochondria of mammalian cells. Mol Cell 55(2):253–263. 10.1016/j.molcel.2014.05.008 [DOI] [PMC free article] [PubMed] [Google Scholar]
- 26.Moseley HN, Lane AN, Belshoff AC, Higashi RM, Fan TW (2011) A novel deconvolution method for modeling UDP-N-acetyl-D-glucosamine biosynthetic pathways based on (13) C mass isotopologue profiles under nonsteady-state conditions. BMC Biol 9:37. 10.1186/1741-7007-9-37 [DOI] [PMC free article] [PubMed] [Google Scholar]
- 27.Moseley HN (2010) Correcting for the effects of natural abundance in stable isotope resolved metabolomics experiments involving ultrahigh resolution mass spectrometry. BMC Bioinformatics 11:139. 10.1186/1471-2105-11-139 [DOI] [PMC free article] [PubMed] [Google Scholar]
- 28.Freshney RI (2005) Culture of animal cells: a manual of basic techniques, 5th edn. John Wiley & Sons, Inc., Hoboken, NJ [Google Scholar]
- 29.Lane AN, Fan TW, Bousamra M 2nd, Higashi RM, Yan J, Miller DM (2011) Stable isotope-resolved metabolomics (SIRM) in cancer research with clinical application to nonsmall cell lung cancer. OMICS 15(3):173–182. 10.1089/omi.2010.0088 [DOI] [PMC free article] [PubMed] [Google Scholar]
- 30.Theobald U, Mailinger W, Baltes M, Rizzi M, Reuss M (1997) In vivo analysis of metabolic dynamics in Saccharomyces cerevisiae: I. experimental observations. Biotechnol Bioeng 55(2):305–316. [DOI] [PubMed] [Google Scholar]
- 31.Zhang GF, Sadhukhan S, Tochtrop GP, Brunengraber H (2011) Metabolomics, pathway regulation, and pathway discovery. J Biol Chem 286(27):23631–23635. 10.1074/jbc.R110.171405 [DOI] [PMC free article] [PubMed] [Google Scholar]
- 32.Vasilakou E, Machado D, Theorell A, Rocha I, Noh K, Oldiges M, Wahl SA (2016) Current state and challenges for dynamic metabolic modeling. Curr Opin Microbiol 33:97–104. 10.1016/j.mib.2016.07.008 [DOI] [PubMed] [Google Scholar]
- 33.Cantor JR, Abu-Remaileh M, Kanarek N, Freinkman E, Gao X, Louissaint A Jr, Lewis CA, Sabatini DM (2017) Physiologic medium rewires cellular metabolism and reveals uric acid as an endogenous inhibitor of UMP synthase. Cell 169(2):258–272 e217. 10.1016/j.cell.2017.03.023 [DOI] [PMC free article] [PubMed] [Google Scholar]
- 34.Psychogios N, Hau DD, Peng J, Guo AC, Mandal R, Bouatra S, Sinelnikov I, Krishnamurthy R, Eisner R, Gautam B, Young N, Xia J, Knox C, Dong E, Huang P, Hollander Z, Pedersen TL, Smith SR, Bamforth F, Greiner R, McManus B, Newman JW, Goodfriend T, Wishart DS (2011) The human serum metabolome. PLoS One 6(2): e16957. 10.1371/journal.pone.0016957 [DOI] [PMC free article] [PubMed] [Google Scholar]
- 35.Heeneman S, Deutz NE, Buurman WA (1993) The concentrations of glutamine and ammonia in commercially available cell culture media. J Immunol Methods 166(1):85–91 [DOI] [PubMed] [Google Scholar]
- 36.Nikfarjam L, Farzaneh P (2012) Prevention and detection of mycoplasma contamination in cell culture. Cell J 13(4):203–212 [PMC free article] [PubMed] [Google Scholar]
- 37.Sanchez JF, Crooks DR, Lee CT, Schoen CJ, Amable R, Zeng X, Florival-Victor T, Morales N, Truckenmiller ME, Smith DR, Freed WJ (2006) GABAergic lineage differentiation of AF5 neural progenitor cells in vitro. Cell Tissue Res 324(1):1–8 [DOI] [PMC free article] [PubMed] [Google Scholar]
- 38.Liu X, Ser Z, Locasale JW (2014) Development and quantitative evaluation of a high-resolution metabolomics technology. Anal Chem 86(4):2175–2184. 10.1021/ac403845u [DOI] [PMC free article] [PubMed] [Google Scholar]
- 39.Sheikh KD, Khanna S, Byers SW, Fornace A Jr, Cheema AK (2011) Small molecule metabolite extraction strategy for improving LC/MS detection of cancer cell metabolome. J Biomol Tech 22(1):1–4 [PMC free article] [PubMed] [Google Scholar]
- 40.Wu JT, Wu LH, Knight JA (1986) Stability of NADPH: effect of various factors on the kinetics of degradation. Clin Chem 32(2):314–319 [PubMed] [Google Scholar]
- 41.Nagana Gowda GA, Gowda YN, Raftery D (2015) Massive glutamine cyclization to pyroglutamic acid in human serum discovered using NMR spectroscopy. Anal Chem 87 (7):3800–3805. 10.1021/ac504435b [DOI] [PMC free article] [PubMed] [Google Scholar]
- 42.Purwaha P, Silva LP, Hawke DH, Weinstein JN, Lorenzi PL (2014) An artifact in LC-MS/MS measurement of glutamine and glutamic acid: in-source cyclization to pyroglutamic acid. Anal Chem 86(12):5633–5637. 10.1021/ac501451v [DOI] [PMC free article] [PubMed] [Google Scholar]
- 43.Deng P, Higashi RM, Lane AN, Bruntz RC, Sun RC, Ramakrishnam Raju MV, Nantz MH, Qi Z, Fan TW (2017) Quantitative profiling of carbonyl metabolites directly in crude biological extracts using chemoselective tagging and nanoESI-FTMS. Analyst 143 (1):311–322. 10.1039/c7an01256j [DOI] [PMC free article] [PubMed] [Google Scholar]
- 44.Kimball E, Rabinowitz JD (2006) Identifying decomposition products in extracts of cellular metabolites. Anal Biochem 358(2):273–280. 10.1016/j.ab.2006.07.038 [DOI] [PMC free article] [PubMed] [Google Scholar]
- 45.Rabinowitz JD, Kimball E (2007) Acidic acetonitrile for cellular metabolome extraction from Escherichia coli. Anal Chem 79 (16):6167–6173. 10.1021/ac070470c [DOI] [PubMed] [Google Scholar]
- 46.Bennett BD, Kimball EH, Gao M, Osterhout R, Van Dien SJ, Rabinowitz JD (2009) Absolute metabolite concentrations and implied enzyme active site occupancy in Escherichia coli. Nat Chem Biol 5 (8):593–599. 10.1038/nchembio.186 [DOI] [PMC free article] [PubMed] [Google Scholar]
- 47.Fan TW, Warmoes MO, Sun Q, Song H, Turchan-Cholewo J, Martin JT, Mahan A, Higashi RM, Lane AN (2016) Distinctly perturbed metabolic networks underlie differential tumor tissue damages induced by immune modulator beta-glucan in a two-case ex vivo non-small-cell lung cancer study. Cold Spring Harb Mol Case Stud 2(4):a000893. 10.1101/mcs.a000893 [DOI] [PMC free article] [PubMed] [Google Scholar]
- 48.Lorkiewicz P, Higashi RM, Lane AN, Fan TW (2012) High information throughput analysis of nucleotides and their isotopically enriched isotopologues by direct-infusion FTICR-MS. Metabolomics 8(5):930–939. 10.1007/s11306-011-0388-y [DOI] [PMC free article] [PubMed] [Google Scholar]
- 49.Welshons WV, Wolf MF, Murphy CS, Jordan VC (1988) Estrogenic activity of phenol red. Mol Cell Endocrinol 57(3):169–178 [DOI] [PubMed] [Google Scholar]
- 50.Bindal RD, Carlson KE, Katzenellenbogen BS, Katzenellenbogen JA (1988) Lipophilic impurities, not phenolsulfonphthalein, account for the estrogenic activity in commercial preparations of phenol red. J Steroid Biochem 31 (3):287–293 [DOI] [PubMed] [Google Scholar]
- 51.Villas-Boˆas SG (2007) Metabolome analysis: an introduction. Wiley-Interscience series in mass spectrometry. Wiley-Interscience, Hoboken, NJ [Google Scholar]
- 52.Kelly AE, Ou HD, Withers R, Dotsch V (2002) Low-conductivity buffers for high-sensitivity NMR measurements. J Am Chem Soc 124 (40):12013–12019 [DOI] [PubMed] [Google Scholar]