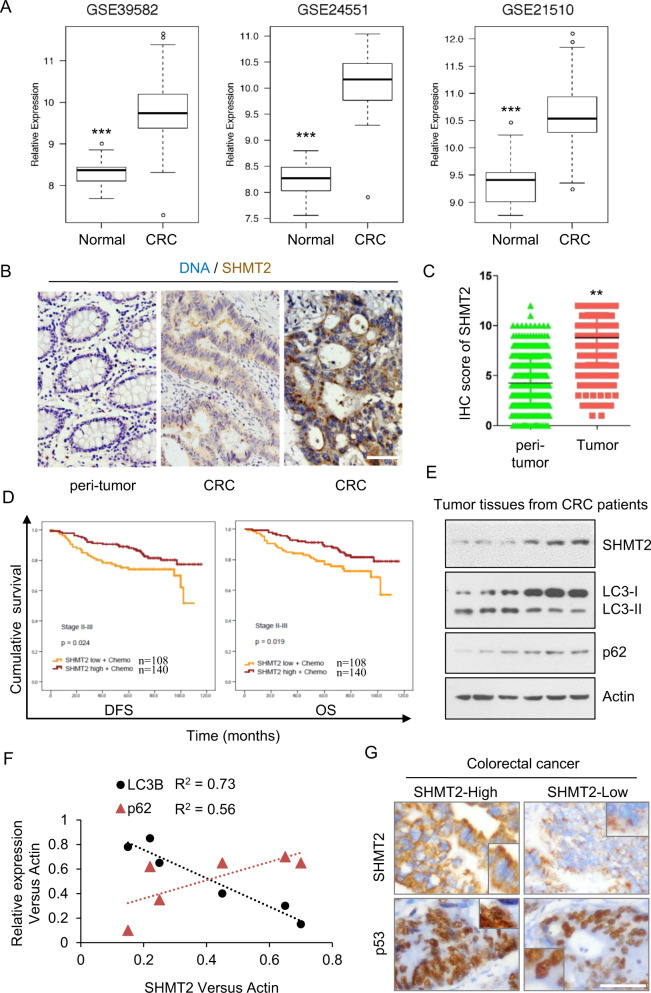
Fig. 5. 5-FU resistance is related to low SHMT2 expression and autophagy in CRC.
A Expression of SHMT2 in three GEO datasets (GSE39582, GSE24551, and GSE21510). ***P < 0.001. B Representative images of immunohistochemical staining for SHMT2 in peritumor and CRC tissues. Scale bar, 50 μm. C 378 stage II–III paired CRC tissues assessed by immunohistochemistry are shown. **P < 0.01. D Survival of patients stratified by the SHMT2 expression level. DFS and OS of patients with stage II–III disease treated with 5-FU-based chemotherapy stratified by the SHMT2 expression level. E, F The protein levels of endogenous SHMT2, p62, LC3, and β-actin (as the internal standard) were examined by western blotting in CRC tissues. F The Spearman rank correlation test was used to evaluate correlations between the SHMT2, p62, and LC3 expression status in CRC tissues as determined by western blotting. G Representative images of immunohistochemical staining. Scale bar, 50 μm.

