Background:
Real-time monitoring of fine particulate matter (PM2.5) concentrations and assessing the health impact are limited in Ethiopia. The objective of this study is to describe current levels of PM2.5 air pollution in Addis Ababa and examine temporal patterns and to consider the health impact of current PM2.5 exposure levels.
Methods:
PM2.5 concentrations were measured using a centrally-located Beta Attenuator Monitor (BAM-1022) for 3 years (1 April 2017 to 31 March 2020), with data downloaded biweekly. Deaths attributable to current PM2.5 concentration levels were estimated using the AirQ+ tool. The daily average was estimated using hourly data.
Results:
The daily mean (SD) PM2.5 concentration was 42.4 µg/m3 (15.98). Two daily extremes were observed: morning (high) and afternoon (low). Sundays had the lowest PM2.5 concentration, while Mondays to Thursdays saw a continuous increase; Fridays showed the highest concentration. Seasons showed marked variation, with the highest values during the wet season. Concentration spikes reflected periods of intensive fuel combustion. A total of 502 deaths (4.44%) were attributable to current air pollution levels referenced to the 35 µg/m3 WHO interim target annual level and 2,043 (17.7%) at the WHO 10 µg/m3 annual guideline.
Conclusion:
PM2.5 daily levels were 1.7 times higher than the WHO-recommended 24-hour guideline. The current annual mean PM2.5 concentration results in a substantial burden of attributable deaths compared to an annual mean of 10 µg/m3. The high PM2.5 level and its variability across days and seasons calls for citywide interventions to promote clean air.
Keywords: Fine particulate matter, Ambient air pollution, Beta Attenuation Mass Monitor, Impact of air pollution
What this study adds
Our study contributes novel primary data on levels and trends of ambient air pollution (focusing on fine particulate matter, PM2.5) in a time series design in a Sub-Saharan African country where exposure to air pollution is not routinely monitored but has become a serious health threat. The study is ground-breaking in using high quality and continuous measurement and has the potential to inform policy makers so that they can make evidence-based decisions toward the mitigation of excess exposure. Our findings showed that levels of PM2.5 exceeded the daily WHO guideline value almost two-fold, also exceeding four times the annual value. Our data showed significant proportion of premature death that is attributable to the current level of PM2.5 air pollution. The novel findings from this study about high daily PM2.5 concentrations and their temporal patterns, as well as the health impact assessment findings, have great potential to inform policy, hopefully leading to interventions to achieve clean air for the urban population.
Introduction
Air pollution is one of the single largest determinants of environmental health risks, causing substantial premature mortality and morbidity. Worldwide, about one in every nine deaths annually are attributable to air pollution.1 Household and ambient air pollution were responsible for about 7 million deaths in 2016, which is about 16% of all global deaths. Air pollution is a known risk factor for noncommunicable diseases.2 About 94% of the attributable deaths occurred in low-and middle-income countries where the impact of air pollution has received insufficient attention. In urban areas of low-income countries, particulate matter and the gaseous pollutants result from the use of biomass and fossil fuels by households, vehicles, power generation, manufacturing plants, boilers, and local microenterprises.3
Ambient air pollution affects the poor and vulnerable population groups such as children and older people to a larger extent,4 particularly those living in big cities of low- and middle-income countries. Worldwide, most cities in these poorer countries did not meet the World Health Organization (WHO) air quality guideline for the annual mean concentration of PM2.5 (atmospheric particulate matter with diameter of 2.5 μm or smaller) in 2018, compared with at least half of cities in high-income countries.5 However, there has been limited monitoring for PM2.5 in the cities of Africa, particularly in Sub-Saharan Africa. The 2018 WHO air pollution database for Africa includes only 10 countries with 41 monitoring sites.6 This database includes reports on annual mean PM2.5 concentrations only for Kenya, Uganda, and Tanzania among countries in Eastern Africa; for these countries, there was only 1 fixed monitoring station in each capital city. The expected trend of rapid growth in urban populations and urbanization in general is likely to lead to substantial increases in pollution levels, as urbanization inherently demands growing service sectors in energy use, increased transportation, additional industries, and energy production, all leading to worsening air pollution.3 WHO has raised concern about increasing air pollution in cities of developing countries.7 It has developed the AirQ+ tool to estimate the likely impact of air pollution on disease burden due to the existing level of air pollution.8 The tool has been used in cities of Europe.9
Here, we report PM2.5 concentrations measured over 3 years in Addis Ababa, the capital of Ethiopia, where air quality measurements have been limited. Due to rapid urban growth, increase in vehicles, and physical factors such as high altitude and hills/valleys causing temperature inversions, air quality management in Addis Ababa is challenging and real-time monitoring is needed. As part of the activities of the Eastern Africa GEOHealth Hub, a monitor for airborne particulate matter was placed centrally in Addis Ababa to describe air quality in the city and to support a program of epidemiological research. We will also report findings from a related health impact assessment based on the AirQ+ tool described earlier.
Methods
Study site
Addis Ababa is the largest city in Ethiopia regarding size and population. An estimated 4.6 million people lived there in 2019,10 in an area of around 527 km2 and at an estimated population density of 5,165 per square kilometer.10 It has two distinct seasons characterized by high and low rainfalls. The wet season usually starts in June and ends in September, while the dry season extends between October and May. Wet months in 2020 had an average of 340.5 mm precipitation, while the dry season had 64 mm.11 Addis Ababa is located at a latitude of 9° 0’ 19’’ N, and a longitude of 38° 45’ 48’’ E at an average altitude of 8,000 feet above sea level.12
The PM2.5 sampling site is located on the premises of Tikur Anbessa Specialized Referral Hospital (TASH) in an urban zone of the city located at a latitude of 9° 1’ 13’’ N, and a longitude of 38° 44’ 58’’ E.
Study design and PM2.5 measurement
The study data came from continuous real-time measurement of PM2.5 concentration. The ambient air pollution data were generated by a Beta Attenuation Monitor (BAM-1022) installed in March 2017 at a central site in the City. The instrument is manufactured by MetOne Instruments, Inc. (Grant Pass, OR), and is designated as an automated equivalent PM2.5 mass monitor by the United States Environmental Protection Agency.13,14 The site selection for the BAM-1022 followed recommended site specification criteria.14,15 In addition, availability of sustained power, height from the ground, instrument safety, and lack of any physical barrier that may restrict the free flow of air were considered (Figure 1). Data were logged at 1-hour intervals, yielding 24 data points daily. This interval was set after exploring the variability of PM2.5 concentration over 1-hour intervals. The BAM-1022 has an internal working environment that maintains a steady flow rate (at 15.8 < FR < 17.5 liters per minute) and a range of meteorological conditions: relative humidity (10 % < RH < 80%), temperature (1 < T < 40 °C), and barometric pressure (525 < BP < 640 mm Hg). For quality control, the instrument provides error messages so that problems could be addressed when needed. The study used data for the period 1 April 2017 to 31 March 2020.
Figure 1.
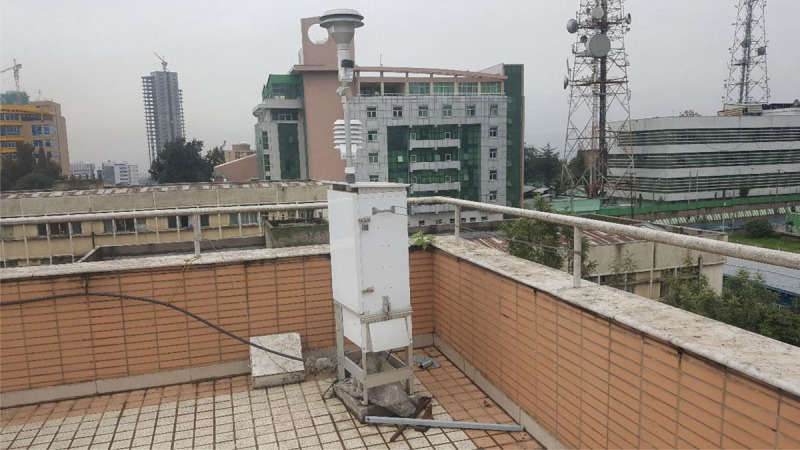
BAM 1022, Tikur Anbessa Hospital site, GEOHealth Hub, Addis Ababa, Ethiopia.
Two BAM-1020 PM2.5 monitors are managed by the US Embassy as part of the US State Department’s monitoring program, one at the site of the embassy and the other at the site of an international school. We used the concentration data from these monitors to compare with our results. The BAM-1020 on the premises of the US Embassy in Addis Ababa is located at a relatively “clean” site, whereas the second BAM-1020, at the US Embassy-International Community School, is located in downtown Addis Ababa, presenting a more polluted site regarding air pollution. The locations of the three BAMs are shown in Figure 2. The daily PM2.5 concentrations measured by the two US BAMs were accessed freely at the website https://aqicn.org/city/ethiopia/addis-ababa/us-embassy/.
Figure 2.
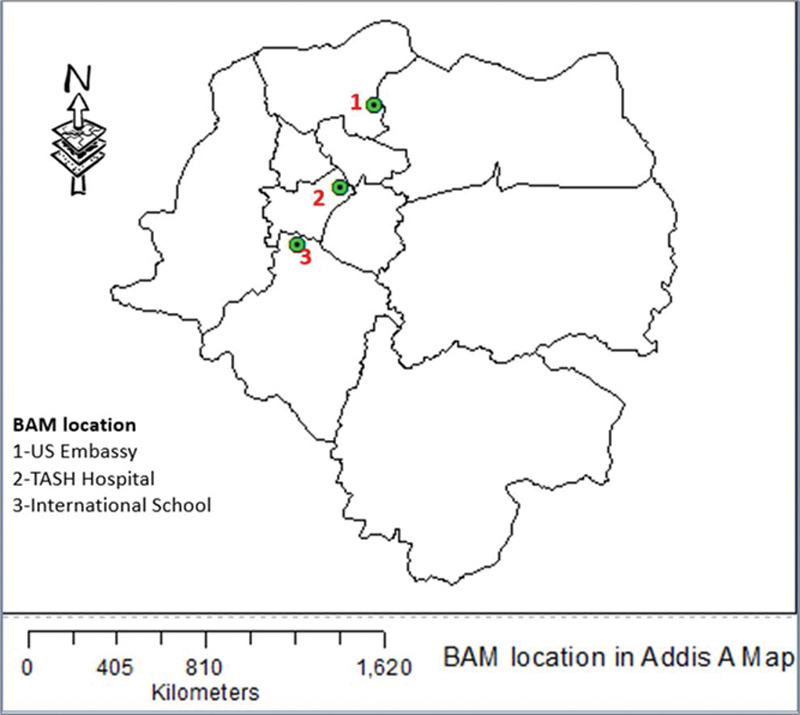
Locations of BAM in Addis Ababa.
Data management
Data were downloaded biweekly from the BAM-1022 and evaluated according to a standard operating procedure. For analysis, we used data for days with at least 18 of 24 hours available, for example, 75% of the 24 hours. The missing data primarily came from power outages and periods of routine maintenance. Missing data were detected in the system software records by a signal for a sampling error resulting from data outside of the acceptable ranges for the following selected parameters: flow rate, concentration, temperature, barometric pressure, relative humidity, and sampling time interruption.
Among the techniques proposed in the literature for replacing missing values, we selected substitution of the mean, an imputation technique often used for air pollution data.16 We adapted the “before-after-mean” method, which replaces all missing values with the mean of one datum before the missing value and one datum after the missing value. If at least one of the before-and-after data points were not available, we moved to a 2-day window to complete the data. We recovered 77 days (11%) of the expected data, while we had 7.4% of days missed in the 3 years of analyzed data. Log-transformed data were used to compare the PM2.5 concentration by days (normality Kolmogorov Smirnov test, P = 0.234). With regard to the US Embassy data, a few negative concentrations were removed from the dataset.
Data quality assurance
Data quality was evaluated on an ongoing basis using an established protocol. The data manager validated the downloaded PM2.5 data by manually checking the set parameters of flow rate, temperature, barometric pressure, and relative humidity, and the PM2.5 concentration itself. A comprehensive quality check of the raw data was conducted to reduce the impact of uncertain data points, including duplicated data records, missing measurements, and implausible values. In particular, extremely high PM2.5 concentrations (>700 μg/m3) were considered as implausible, and, therefore, such data points were removed from the analysis. This was based on the routine reviews.17 In addition, any data points with accompanying error messages were set aside. The final data set included the variables date (year, date, hour/minute/second), hourly average PM2.5 concentration (µg/m3), relative humidity (%), ambient temperature (°C), and barometric pressure (mm Hg).
Data analysis
The averaged continuous ambient PM2.5 measurements were used for statistical analysis. The R statistical software (R 3.6.2; https://www.r-project.org/) was used to conduct descriptive analyses, including time series plots and box-plots. The 1-hour BAM-1022 data were aggregated to create the daily averaged data sets for PM2.5. Time series line graphs were used to explore the daily pattern and seasonality.
Assessing the impact/effect of the current level of PM2.5 concentration
We used the WHO AirQ+ tool8,18 to calculate the attributable deaths to the exposure levels of the three BAMs separately. We employed averaged concentrations over a 3-year period from our BAM-1022 and the US-Embassy BAM-1020 on embassy premises, while an average for 2 years was available for the BAM-1020 at the international school site. The total population of Addis Ababa in 2020 was taken from UN population data sources (4.8 mln).10 We considered that 34% of the total population was adult of 30 years old and above (Addis Ababa Health Bureau, personal communication, February 2, 2021). The annual mortality for the year 2020 was taken from Addis Ababa Mortality Surveillance Program.19 A 7% of the incidence of injury was taken from published articles addressing the mortality surveillance program.20,21 We used the three WHO annual interim target options and the WHO annual mean air quality guideline as cut-off reference values to estimate the excess deaths because of PM2.5 pollution as measured by the three BAMs separately.3
Ethical considerations
This study had an ethical clearance from the Institutional Review Board of the College of Health Science at Addis Ababa University. The clearance followed a yearly renewal.
Results
Data description
Over the 3 years of the study, data were available for 1,012 days (Table 1).
Table 1.
The number of observed/available daily PM2.5 concentrations per month monitored by BAM-1022, Addis Ababa, Ethiopia, 2017–2020.
| Site | Year | Month | Total | |||||||||||
|---|---|---|---|---|---|---|---|---|---|---|---|---|---|---|
| Jan | Feb | Mar | Apr | May | Jun | Jul | Aug | Sep | Oct | Nov | Dec | |||
| TASH | 2017 | 30 | 31 | 30 | 31 | 31 | 30 | 31 | 24 | 29 | 267 | |||
| 2018 | 28 | 28 | 31 | 30 | 31 | 25 | 31 | 31 | 26 | 24 | 30 | 31 | 346 | |
| 2019 | 29 | 28 | 6 | 1 | 31 | 30 | 31 | 31 | 30 | 31 | 30 | 31 | 309 | |
| 2020 | 31 | 28 | 31 | 90 | ||||||||||
| Total | 88 | 84 | 68 | 61 | 93 | 85 | 93 | 93 | 86 | 86 | 84 | 91 | 1012 | |
| US Embassy | 2017 | 30 | 31 | 30 | 31 | 26 | 29 | 31 | 30 | 29 | 267 | |||
| 2018 | 28 | 24 | 22 | 30 | 27 | 30 | 31 | 31 | 28 | 31 | 30 | 31 | 343 | |
| 2019 | 31 | 28 | 31 | 28 | 31 | 23 | 23 | 23 | 31 | 30 | 13 | 292 | ||
| 2020 | 30 | 28 | 30 | 88 | ||||||||||
| Total | 89 | 80 | 83 | 88 | 89 | 83 | 62 | 80 | 80 | 93 | 90 | 73 | 990 | |
| School | 2017 | 30 | 31 | 12 | 1 | 19 | 30 | 22 | 27 | 172 | ||||
| 2018 | 16 | 9 | 5 | 28 | 31 | 11 | 29 | 5 | 12 | 24 | 4 | 174 | ||
| Total | 16 | 9 | 5 | 58 | 62 | 23 | 30 | 5 | 31 | 54 | 26 | 27 | 346 | |
TASH: “Tikur Anbessa Hospital” with BAM 1022; Central-location BAM-1020 in the premises of US Embassy; School-International School hosting BAM-1020.
Hourly and daily variability of PM2.5 concentration
The hourly PM2.5 concentrations in Addis Ababa exhibited distinct diurnal, day-of-week, and seasonal patterns of variation. The overall diurnal PM2.5 concentration patterns (with bootstrap 95% confidence intervals) showed morning and afternoon peaks (Figure 3). The wider confidence intervals in the afternoon reflect a substantial variation of PM2.5 levels. On Sundays, the diurnal variation was less prominent compared with the other 6 days of the week (Figure 4).
Figure 3.
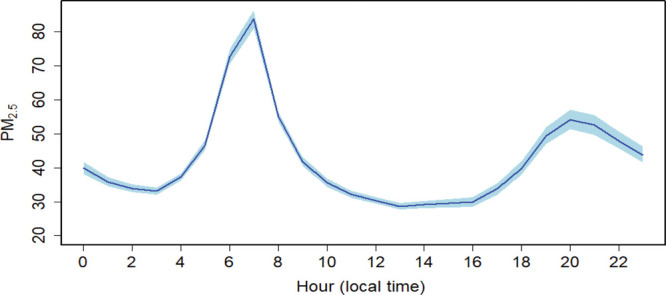
Overall diurnal pattern of PM2.5 concentrations monitored by BAM, Addis Ababa, Ethiopia, 2017–2020.
Figure 4.
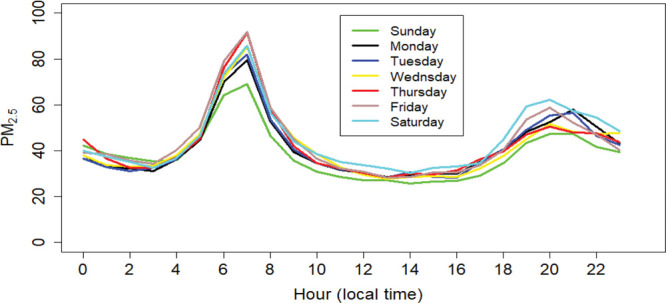
Diurnal pattern of PM2.5 concentration by day of the week, Addis Ababa, Ethiopia, 2017–2020.
Table 2 provides summary statistics for PM2.5 concentrations across the day, highlighting the far higher morning hourly values and increased variability. The substantial variability of levels is described by the standard deviation.
Table 2.
Summary statistics of PM2.5 concentration monitored by BAM-1022 across the hours of the day, Addis Ababa, Ethiopia, 2017–2020.
| Time | Time descriptiona | Minimum | Median | Mean | Maximum | SD | |
|---|---|---|---|---|---|---|---|
| TASH | Before 5h00 | Midnight | 1 | 35 | 37.8 | 366 | 23.4 |
| 6h00 to 9h00 | Early morning | 3 | 54 | 63.4 | 295 | 37.6 | |
| 10h00 to 15h00 | Day time | 0 | 26 | 30.9 | 260 | 18.5 | |
| 16h00 to 19h00 | Late afternoon | 0 | 26 | 38.2 | 234 | 33.5 | |
| After 20h00 | Night | 1 | 34 | 49.6 | 452 | 31.4 | |
| US Embassy | Before 5h00 | Midnight | 0 | 15 | 17.5 | 246 | 11.1 |
| 6h00 to 9h00 | Early morning | 0 | 23 | 27.3 | 354 | 18.2 | |
| 10h00 to 15h00 | Day time | 0 | 20 | 24.6 | 248 | 15.9 | |
| 16h00 to 19h00 | Late afternoon | 0 | 19 | 24.3 | 375 | 18.5 | |
| After 20h00 | Night | 1 | 24 | 29.7 | 402 | 16.5 | |
| School | Before 5h00 | Midnight | 0 | 32 | 35.9 | 332 | 22.5 |
| 6h00 to 9h00 | Early morning | 4 | 48 | 52.6 | 309 | 27.6 | |
| 10h00 to 15h00 | Day time | 0 | 18 | 21.5 | 98 | 12.3 | |
| 16h00 to 19h00 | Late afternoon | 1 | 21 | 26.0 | 203 | 19.0 | |
| After 20h00 | Night | 5 | 30 | 44.1 | 347 | 24.0 |
aThis is to customize the daily profile PM2.5 concentration in reference to Figure 3 in order to show the likely of exposure given human mobility according the context of local time. The increased PM concentration was indicative during early morning (6:00-9:00 am) and relatively low peaks during late afternoon, around 20:00 pm.
Daily time series: BAM-1022
A daily time series of PM2.5 values is plotted in Figure 5. Line interruptions indicated days with missing PM2.5 values. The daily PM2.5 levels varied between 11.8 and 131.1 µg/m3 with an arithmetic mean (SD) of 42.4 ± 15.9 µg/m3 represented by the horizontal broken blue line in the plot. Most values (90% of days) are above the WHO PM2.5 daily guideline of 25 µg/m3.3 About 27.3% of the observed days were above 50 µg/ m3—twice the WHO daily guideline. As shown in Figure 5, the maximum 24-hour average PM2.5 value of 131.1 µg/m3 was observed on 10 September 2017, aligned with the eve of Ethiopian New year. A second spike was evident on 7 April 2018, with a peak value of 118.1 µg/m3, while smaller peaks were observed on other days without a clear pattern. The rainy months, including July, August, and September, had relatively high levels of PM2.5, while the lowest levels were in April and May.
Figure 5.
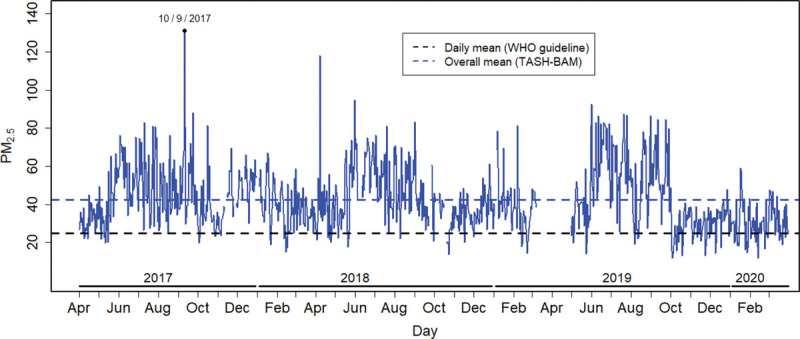
Daily pattern of 24-hour average PM2.5 concentrations in Addis Ababa, Ethiopia, 2017–2020.
The 3-year average PM2.5 values for working (weekdays) and nonworking (weekend) days, showing the distribution of PM2.5 values across the days, are displayed in box plots in Figure 6. The average PM2.5 is represented by the blue dot. In general, the ambient PM2.5 concentration during working days was higher than during nonworking days. The lowest values were often observed on Sundays and Mondays. Relatively increased PM2.5 values were observed on Fridays and Saturdays, but the increases were not statistically significant (data not shown). The Sunday low level was followed by an increase on Monday and a further increase across the week to a Friday maximum, followed by a weekend decline.
Figure 6.
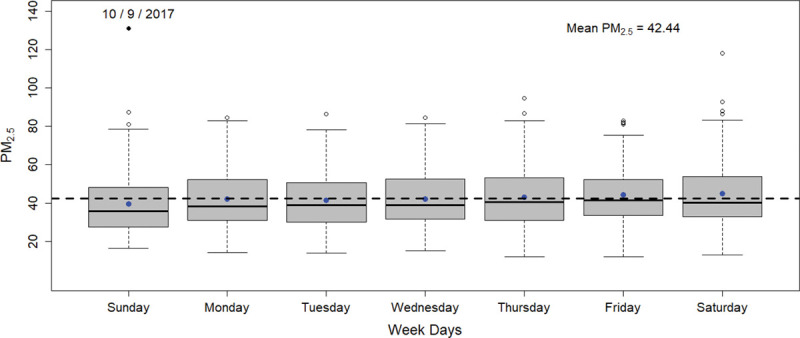
Distribution of PM2.5 concentrations across weekdays in Addis Ababa, Ethiopia, 2017–2020.
Comparison of PM2.5 levels across monitors in Addis Ababa
We compared the findings of the GEOHealth Hub BAM-1022 with the data from the two monitors maintained by the US Embassy, located 4.5 and 3.6 km (aerial distance) from our BAM-1022, respectively. The temporal patterns of variation in the PM2.5 concentrations across the three PM2.5 monitors were consistent. The concentrations were lower at the Embassy sites compared to those at the GEOHealth Hub BAM-1022, and were consistently the lowest for the US Embassy BAM-1020 located within the “clean” US Embassy premises. With regard to peaks, the findings at the three BAMs were consistent, capturing peak values of PM2.5 on 10 September 10, 7 April 2018, and other, smaller peaks.
Daily time series plots for PM2.5 are shown for all three monitoring sites in Addis Ababa in Figure 7.
Figure 7.
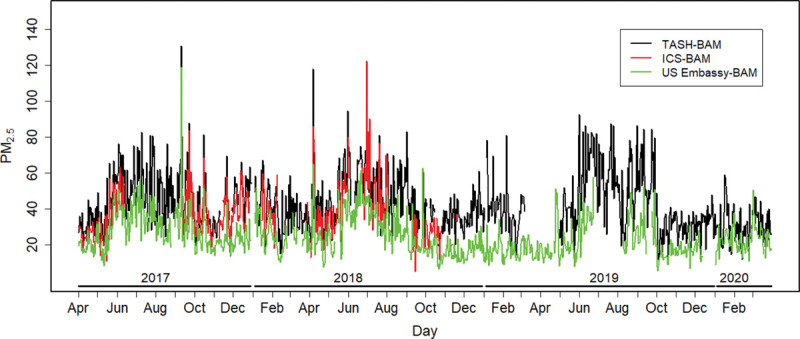
Time series patterns of PM2.5 based on BAMs at TASH, the US Embassy-ICS and the US Embassy-Center Addis Ababa, Ethiopia, 2017–2020. ICS indicates International Community School.
The health impact of long-term exposure to PM2.5 pollution
The calculated attributable death to air pollution is presented in Table 3. A substantial number of deaths can be prevented by achieving the WHO annual PM2.5 guideline (10 µg/m3), given the high level of current level of pollution (42.4 µg/m3).
Table 3.
Estimated annual attributable deaths from long-term exposure to PM2.5 air pollution in 2020.
| BAM location | Annual mean PM2.5 concentration, µg/m3 (2017–2020) | Annual attributable deaths with 95% CI N (%) | |||||||
|---|---|---|---|---|---|---|---|---|---|
| WHO annualInterim 1 (35 µg/m3) | WHO annual Interim 2 (25 µg/m3) | WHO annual Interim 3 (15 µg/m3) | WHO annual Mean (10 µg/m3) | ||||||
| N (95% CI) | % | N (95% CI) | % | N (95% CI) | % | N (95% CI) | % | ||
| “TASH” | 42.4 | 502 (330, 661) | 4.4 | 1147 (761, 1495) | 9.9 | 1753 (1176, 2265) | 15.2 | 2043 (1377, 2627) | 17.7 |
| School | 34.7 | 0 | 0 | 654 (431, 859) | 5.7 | 1290 (858, 16770) | 11.2 | 1598 (1065, 2063) | 13.8 |
| US Embassy | 24.2 | 0 | 0 | 0 | 0 | 613 (403, 805) | 5.3 | 936 (620, 1225) | 8.1 |
“0” shows that the current level is below the WHO cut off with zero risk.
CI indicates confidence interval.
Discussion
In this study, we have documented high levels of PM2.5 in Addis Ababa and characterized the diurnal, weekly, and longer-term variation in PM2.5 concentration. The observed daily mean of PM2.5, 42.4 µg/m3, exceeds the 2005 daily WHO Air Quality Guideline of 25 µg/m3 and is between the interim target 2 and 3 levels of 50 and 37.5 µg/m3, respectively.3 Over the 3-year period, there was no clear upward trend. The findings from the health impact assessment that have been conducted in this study demonstrate that effective policy-driven interventions to reduce PM2.5 concentrations in Addis Ababa have the potential to lead to appreciable reduction in premature deaths.
Fine particulate pollution concentrations in African cities with ground monitoring stations exceeding the WHO guidelines have been documented previously.22 Visibility, a proxy index of particulate matter air pollution, continually decreased, indicating worsening air pollution since the 1970s in Addis Ababa, as well as in Kampala and Nairobi.23 The trend of worsening air pollution can likely be attributed to increasing sources of air pollution such as daily traffic density and other sources. The scarcity of data on air pollution in African cities is an inherent challenge, but available data indicate that many cities in Africa exceed the WHO annual guideline value, as in other large cities in low- and middle-income countries. The 3 years of data provided in our study exceeded this guideline as well.
The relatively high PM2.5 concentrations on weekdays are likely to reflect the number of vehicles on the road during these days. The number of newly registered vehicles in Addis Ababa increased by 185% on average during 2010–2015,24 which reflects the trend in most capital cities in Sub-Saharan Africa. The number of vehicles in Addis Ababa increased at the rate of 10% per year from 2012 to 201625 and about 13% per annum from 2014 to 2019.26 This increase undoubtedly impacts PM2.5 concentration and has implications for the trend of air pollution in the city. Diesel vehicles are a particular concern. Based on tailpipe emissions, it is estimated that 55% and 33% of the total vehicular PM2.5 emissions come from heavy-duty vehicles (diesel users) and passenger cars (petrol fuel users), respectively, in use on the roads of Addis Ababa.24
The daily profile of PM2.5 concentration was characterized by two peaks, observed during morning and afternoon with the morning peak about 50% greater than the afternoon peak. The morning peak reflects the contribution of household pollution and vehicular emissions from the preceding day. Pollution from these sources stays close to the ground because of the morning temperature inversion.27,28 At the city’s high altitude, the ground surface after midnight consistently cools faster than the upper atmospheric layer, thereby creating a layer of relatively warmer and stable air mass sitting over a layer of colder air. This process slows and, sometimes in severe cases, prevents the vertical mixing of air. The temperature inversion may also increase the relative humidity at the surface, which may accelerate particulate matter suspension and formation. The temperature inversion keeps the inversion layer close to the ground, thereby reducing the mixing volume available to pollutants and reducing dilution. This phenomenon is well described elsewhere.29,30 This context creates sufficient time for increased exposure to high level of PM2.5 pollution, including other air pollutants in the morning times.
The increasing trend of PM2.5 usually starts at about 1 am, reaching its highest point at 7 am and declining after 10 am. The PM2.5 concentration usually decreases after 9 am once the morning sunlight radiation breaks the inversion layer by heating that allows the vertical mix of air in the atmosphere. The temperature change allows an upward movement of air pollution, hence improving vertical air ventilation. Although not as high as the morning peak, the peak in the afternoon is likely explained by the increased level of traffic, with the period after 3 pm marked by the return of schoolchildren and workers to their homes. A study in Addis Ababa in 2005, which used portable PM10 dust monitors, showed a similar pattern for PM10.31 We noted that the diurnal behavior of particulate matter pollution in Addis Ababa is consistent with that in Nairobi, Kenya,32 Ethiopia’s neighbor to the south.
In addition, we cannot exclude the possible effect of the study monitor’s location (i.e., TASH) being along the path of air mass movement so that the PM2.5 mass is trapped at our sampling site. The local wind moves often from East to West and North East to West.33
The seasonal variability is likely to be explained by the presence of moisture in the air mass and hence attributed to meteorological differences, more evident due to rains during the wet season in Ethiopia. The natural cloud cover during most of the day, accompanied by rain that leaves suspended droplets in the air, increases the relative humidity, which is likely to hamper the vertical aeration of suspended fine PM2.5. This stagnation increases the relative concentration of PM2.5 because of the continuous influx of air pollutants from household and vehicular emissions. Studies in India,34 Mongolia,35 and California/United States36 showed similar variability in PM2.5 by season. In these countries, PM2.5 concentration during the wet months exceeded concentrations during months when rainfall and/or relative humidity were high.
Our data showed lower levels of PM2.5 concentrations in the months of April and May when the daily temperature was high relative to other months. The presence of improved air mixing relative to wet months could be a factor in the background of continued emissions from vehicles and households. Variation in the PM2.5 profiles comparing dry and wet seasons was similar to data from the US Embassy BAM monitors. However, we found two local studies reporting that the PM2.5 concentration was higher during dry months compared with wet months.31,37 Two factors might explain this difference related to the number of vehicles in Addis Ababa and the methods of measuring particulate pollution. First, the number of vehicles in 2019 was 4.6 times that of 2005, and twice that of 2010 (2019, n = 596,084).26 Assuming the proportion of diesel engine vehicles is at least 50% of the available fleet and that about 50% of the vehicles are at least 20 years old, the amount of PM2.5 emission in the air is substantial: it can be easily trapped and suspended for a period of time in the presence of temperature inversion which plays a synergistic role. Second, local studies had limited duration of sampling time, while our study used a reference equivalent instrument with real-time measurements over 3 years. The real-time measurement over 24 hours in a day provides an opportunity to document the profile of the concentration by time and weighted averages.
The occurrence of different levels of peaks on particular days can be linked to high levels of use of household fuels. Biomass fuel is used extensively as an energy source in 70% of households in urban communities in Ethiopia.38 The peak during 10 September 2018, for instance, corresponds to the Ethiopian New Year’s Eve when cooking is intensive throughout the city, and neighborhoods hold campfire ceremonies. These traditions involve almost every household in the Ethiopian community. Smaller peaks may be explained by local changes in traffic density in the proximity of our monitoring stations.
Continued growth of Addis Ababa has resulted in a demand for energy use that also increases air pollution. For example, fuel consumption in Addis Ababa in 2016 doubled that of 2012.25 The development of road network Addis Ababa is getting improved from time to time.39 We believe that the quality of the roads, many unpaved, and widespread construction activity have increased the level of inert dust in the urban atmosphere.
Our health impact assessment demonstrated variations in the number and proportion of premature deaths in reference to the different targets of WHO guideline, the highest being at the 10 µg/m3 cut-off. The percentage of annual attributable deaths due to present PM2.5 pollution levels varied between an excess of 8% and 18%. The calculations from the study monitoring site at TASH are most likely to represent the PM2.5 concentration to which the city’s residents are exposed, implying that there are substantial excess annual attributable deaths. Ambient air pollution could be a factor as a contributor to the changes from communicable to noncommunicable diseases in Addis Ababa.20 The impact of air pollution will continue as long as the quality of vehicles and roads do not improve. Health matters need to be addressed in conjunction with development efforts, including new and/or improved roads and policies that affect vehicle importation and handling. The Ethiopian government has taken important steps to allow new vehicles to be imported into the country at reduced taxes, as well as promoting the assembly of new cars.40
This study has several strengths. Using US EPA–approved PM2.5 monitors, the real-time temporal measurements and rigorous quality control have contributed to the collection of 3 years of valid data. The validity of our data is supported by comparability with data from the US Embassy’s BAM 1020. Our monitor’s location downwind relative to the wind’s easterly direction resulted in higher measurements than the Embassy BAM, but with a similar temporal profile.
Unfortunately, we lack data on traffic flow and do not have an up-to-date emissions inventory. This limits our ability to place our findings in the context of the present distribution of sources. We also acknowledge that there are substantial uncertainties in the estimates of disease burden. We have acknowledged the limited use of traffic flow in evaluating the trend of PM2.5 concentration.
Overall, the findings show that particulate matter air pollution in Addis Ababa is well above the WHO Air Quality Guideline values and at concentrations known to be associated with increased risk for adverse health effects. We have also shown the feasibility of implementing high quality monitoring in Sub-Saharan Africa. While further monitoring is needed, there is a clear imperative for air quality control as cities grow and have ever-increasing vehicle fleets.
Acknowledgments
The authors are grateful to the School of Public Health of Addis and College of Health Sciences of Ababa University for allowing this study to occur by giving permission for placing the BAM-1022 monitor on university premises. Dr. Scott Fruin, previously with the University of Southern California, is acknowledged for his expert guidance during the site selection process for the BAM-1022 monitors. We also value the permission of using mortality data for health impact assessment that is obtained from Addis Ababa Mortality Surveillance Program, College of Health Sciences at Addis Ababa University.
Conflicts of interest statement
The authors declare that they have no conflicts of interest with regard to the content of this report.
Footnotes
Published online 7 June 2021
Sponsorships or competing interests that may be relevant to content are disclosed at the end of the article.
Supported by NIH Fogarty International Center, NIEHS, CDC/NIOSH, Canada’s IDRC, GACC Grant # 5R24 TW009552; 5R24 TW009548; 1U01TW010094; U2RTW010125.
K.B., J.S., and A.K. were involved in the design of the research protocol. A.K., W.T., S.T., A.W., Z.T., D.S., M.M., and G.B. were involved in the data collection, data management, and data analysis. A.K., A.W., J.P., Z.T., K.Z., J.S., and K.B. were involved in writing the manuscript. In addition, K.B., J.S., J.P., and S.T. were involved the training in research methods and air pollution sampling.
References
- 1.World Health Organization. Ambient air pollution: a global assessment of exposure and burden of disease. 2016. Available at: http://www.who.int/phe/publications/air-pollution-global-assessment/en/. Accessed October 2018.
- 2.World Health Organization. Burden of Disease from the Joint Effects of Household and Ambient Air Pollution for 2016. 2016. Available at: http://www.who.int/airpollution/data/AP_joint_effect_BoD_results_. Accessed 27 November 2018.
- 3.World Health Organization. WHO Air quality guidelines for particulate matter, ozone, nitrogen dioxide and sulfur dioxide: global update 2005 - summary of risk assessment. 2005. Available at: https://www.who.int/airpollution/publications/aqg2005/en/. Accessed March 2019. [PubMed]
- 4.Landrigan PJ, Fuller R, Acosta NJR, et al. The Lancet Commission on pollution and health. Lancet. 2018; 391:462–512. [DOI] [PubMed] [Google Scholar]
- 5.World Health organization. WHO Global Ambient Air Quality Database (update 2018). Available at: https://www.who.int/airpollution/data/AAP_database_methods_2018_final.pdf. Accessed November 2019.
- 6.World Health Organization. WHO ambient (outdoor) air quality database: summary results, update 2018. 2018.Available at: https://www.who.int/airpollution/data/AAP_database_summary_results_2018_final2.pdf. Accessed November 2019.
- 7.World Health Organization. Ambient air pollution: a global assessment of exposure and burden of disease. 2016. Available at: https://apps.who.int/iris/bitstream/handle/10665/250141/9789241511353-eng.pdf?sequence=1. Accessed October 2018.
- 8.World Health Organization. AirQ+: software tool for health risk assessment of air pollution. Available at: https://www.euro.who.int/en/health-topics/environment-and-health/air-quality/activities/airq-software-tool-for-health-risk-assessment-of-air-pollution. Accessed January 2021.
- 9.World Health Organization (Europe). Health impact of ambient air pollution in Serbia - a call to action. 2019. Available at: https://serbia.un.org/sites/default/files/2019-10/Health-impact-pollution-Serbia_0.pdf. Accessed January, 2021.
- 10.United Nations. Addis Ababa, Ethiopia Population 1950-2020. 2020. Available at: https://www.macrotrends.net/cities/20921/addis-ababa/population. Accessed March 2020.
- 11.Climate-data.org. Addis Ababa climate (Ethiopia). Avaiable at: https://en.climate-data.org/africa/ethiopia/addis-ababa/addis-abeba-532/. Accessed January 2021.
- 12.Latlong.net. Addis Ababa, Ethiopia Lat Long Coordinates Info. 2021. Available at: https://www.latlong.net/place/addis-ababa-ethiopia-1084.html. Accessed January 2021.
- 13.US Federal Register. Met One Instruments, Inc. BAM-1022 Real Time Beta Attenuation Mass Monitor-Outdoor PM2.5 FEM Configuration. Automated Equivalent Method: EQPM-1013-209. Federal Register: Vol. 80, page 51802, 8/26/2015. Latest modification: 04/2017; 10/2018;12/2018”. 2018. [Google Scholar]
- 14.United States Environmental Protection Agency. 40 CFR Part 58, Appendices E (7–1–12 Edition). 1998. Available at: https://www.govinfo.gov/content/pkg/CFR-2012-title40-vol6/pdf/CFR-2012-title40-vol6-part58-appE.pdf. Accessed September 2016.
- 15.Department of Ecology; State of Washington. PM2.5 and PM10 Beta Attenuation Monitor Operating Procedure, revised 2019. 2005. Available at: https://fortress.wa.gov/ecy/publications/documents/1702005.pdf. Accessed February 2021.
- 16.Mohamed NN, Yahaya AS, Ramli NA, Abdullah MMA. Estimation of missing values in air pollution data using single imputation techniques. Sci Asia. 2008; 34:341–345. [Google Scholar]
- 17.Tefera W, Asfaw A, Gilliland F, et al. Indoor and outdoor air pollution- related health problem in Ethiopia: review of related literature. Ethiop J Health Dev. 2016; 30:5–16. [PMC free article] [PubMed] [Google Scholar]
- 18.World Health Organization. Health impact assessment of air pollution: introductory manual to AirQ+. 2020. Available at: https://apps.who.int/iris/bitstream/handle/10665/337681/WHO-EURO-2020-1557-41308-56210-eng.pdf?sequence=1&isAllowed=y. Accessed March 2021.
- 19.College of Health Sciences at Addis Ababa University. Ethiopia-Addis ababa mortality surveillance program. Addis Ababa, Ethiopia.
- 20.Misganaw A, Mariam DH, Araya T. The double mortality burden among adults in Addis Ababa, Ethiopia, 2006-2009. Prev Chronic Dis. 2012; 9:E84. [DOI] [PMC free article] [PubMed] [Google Scholar]
- 21.Anteneh A, Endris BS. Injury related adult deaths in Addis Ababa, Ethiopia: analysis of data from verbal autopsy. BMC Public Health. 2020; 20:926. [DOI] [PMC free article] [PubMed] [Google Scholar]
- 22.Elisaveta PP, Darby WJ, Nicole HV-C, Patrick LK. Particulate matter pollution in African cities. Air Qual Atmos Health. 2013; 6:603–614. [Google Scholar]
- 23.Ajit S, William RA, Francis DP. Visibility as a proxy for air quality in East Africa. Environ Res Lett. 2020; 15:084002. [Google Scholar]
- 24.Wondifraw BA, Lemma DG, Aschalew E. Estimation of Exhaust Emission from Road Transport using COPERT Software: The case of Addis Ababa, Ethiopia. 2018. Avaiable at: file:///C:/Users/user/Downloads/EstimationofExhaustEmissionfromRoadusingCOPERTSoftware.pdf. Accessed January 2021.
- 25.Maschal MT, Yohannes TG. Trends of ambient air pollution and the corresponding respiratory diseases in Addis Ababa. Clin Pharmacol Toxicol J. 2018; 2:1–14. [Google Scholar]
- 26.New Business Ethiopia. Ethiopia imports 135, 457 vehicles in a year. The Top Ethiopian News Portal Since 2009. 2019. Available at: https://newbusinessethiopia.com/trade/ethiopia-imports-135-457-vehicles-in-a-year/. Accessed March 2020.
- 27.Angela MR, Juan FS, Carlos AP, Volkmar W. Temperature inversion breakup with impacts on air quality in urban valleys influenced by topographic shading. J Appl Meteor Climatol. 2015; 54:302–321. [Google Scholar]
- 28.Feng X, Wei S, Wang S. Temperature inversions in the atmospheric boundary layer and lower troposphere over the Sichuan Basin, China: climatology and impacts on air pollution. Sci Total Environ. 2020; 726:138579. [DOI] [PubMed] [Google Scholar]
- 29.Sabah A, Abdul W. Analysis of thermal inversions in the Khareef Salalah region in the Sultanate of Oman. J Geophys Res. 2003; 108:D1–D8. [Google Scholar]
- 30.Baumbach G, Vogt U. Influence of inversion layers on the distribution of air pollutants in urban area. Water Air Soil Pollution. 2003; 3:65–76. [Google Scholar]
- 31.Etyemeziana V, Tesfayeb M, Yimerc A, et al. Results from a pilot-scale air quality study in Addis Ababa, Ethiopia. Atmos Environ. 2005; 39:7849–7860. [Google Scholar]
- 32.Pope FD, Gatari M, Ng’ang’a D, Poynter A, Blake R. Airborne particulate matter monitoring in Kenya using calibrated low-cost sensors. Atmos Chem Phys. 2018; 18:15403–15418. [Google Scholar]
- 33.Weather Online. 2020. Available at: https://www.weatheronline.co.uk/weather/maps/city?FMM=1&FYY=2018&LMM=12&LYY=2018&WMO=63450&CONT=afri®ION=0009&LAND=ET&ART=WDR&R=0&NOREGION=0&LEVEL=162&LANG=en&MOD=tab. Accessed March 2021.
- 34.Kumar MK, Sreekanth V, Salmon M, Tonne C, Marshall JD. Use of spatiotemporal characteristics of ambient PM2.5 in rural South India to infer local versus regional contributions. Environ Pollut. 2018; 239:803–811. [DOI] [PMC free article] [PubMed] [Google Scholar]
- 35.Wang M, Kai K, Jin Y, Sugimoto N, Batdorj D. Air particulate pollution in Ulaanbaatar, Mongolia: variation in atmospheric conditions from autumn to winter. Sci Online Lett Atmos. 2017; 13:90–95. [Google Scholar]
- 36.Ricardo C, Don S, Haiganoush P, Deborah H, Glenn S, Andrzej B. Spatial and seasonal patterns of particulate matter less than 2.5 microns in the Sierra Nevada Mountains, California. Atmos Pollution Res. 2014; 5:581–590. [Google Scholar]
- 37.Gebre G, Feleke F, Sahle ED. Mass concentrations and elemental composition of urban atmospheric aerosols in Addis Ababa, Ethiopia. Bull Chem Soc Ethiop. 2010; 24:361–373. [Google Scholar]
- 38.Central Statistical Agency Addis Ababa Ethiopia, ICF International Calverton Maryland USA. Ethiopia Demographic and Health Survey 2016. 2016.Available at: file:///C:/Users/user/Downloads/EDHS2016.pdf. Accessed January 2021.
- 39.Angaw Y, Kumie A, Tefera Y, et al. Temporary hearing loss and associated factors among Ayka Addis textile factory workers in Oromia Region, Ethiopia: a cross-sectional study. Risk Manag Healthc Policy. 2021; 14:719–728. [DOI] [PMC free article] [PubMed] [Google Scholar]
- 40.Central Statistics Agency of Ethiopia. The 2007 Population and Housing Census of Ethiopia: Statistical report for Addis Ababa City Administration. 2008. Available at: https://www.statsethiopia.gov.et/census-2007-2/. Accessed December 2020.


