Abstract
Ab initio MP2/aug’-cc-pVTZ calculations have been carried out to identify and characterize equilibrium structures and transition structures on the 1-oxo-3-hydroxy-2-propene: Lewis acid potential energy surfaces, with the acids LiH, LiF, BeH2, and BeF2. Two equilibrium structures, one with the acid interacting with the C=O group and the other with the interaction occurring at the O–H group, exist on all surfaces. These structures are separated by transition structures that present the barriers to the interconversion of the two equilibrium structures. The structures with the acid interacting at the C=O group have the greater binding energies. Since the barriers to convert the structures with interaction occurring at the O–H group are small, only the isomers with interaction occurring at the C=O group could be experimentally observed, even at low temperatures. Charge-transfer energies were computed for equilibrium structures, and EOM-CCSD spin–spin coupling constants 2hJ(O–O), 1hJ(H–O), and 1J(O–H) were computed for equilibrium and transition structures. These coupling constants exhibit a second-order dependence on the corresponding distances, with very high correlation coefficients.
Keywords: intramolecular hydrogen bonds, structures and binding energies, charge-transfer interactions, spin–spin coupling constants
1. Introduction
1-oxo-3-hydroxy-2-propene, the enol of malonaldehyde in the conformation that presents an intramolecular hydrogen bond [1], has played an important role in the fields of hydrogen bonding, proton transfer [2,3,4,5,6,7,8], resonance assisted hydrogen bonds [6,9,10,11,12], quasi-aromaticity [13], and, in general, in non-covalent interactions. The importance of this molecule is due to the fact that it is the simplest of all 1,3-dicarbonyl compounds that were the first systems in which intramolecular hydrogen bonds had been studied [14,15,16,17,18,19].
Various aspects of 1-oxo-3-hydroxy-2-propene have been investigated, including substituent effects [20,21], solvent effects in which water molecules interact with this molecule [22], excited state properties [23], and the important problem of proton tunneling [23,24,25,26,27]. Both vibrational [28] and rotational [29,30,31] spectroscopic studies have been carried out on this molecule. In addition, interactions of 1-oxo-3-hydroxy-2-propene with Lewis acids such as methanol [32] and Li+, Na+ and FH [33], and BeX2 [34] have been reported.
A useful property for obtaining structural information about complexes linked by non-covalent interactions and, in particular by hydrogen bonds, is spin–spin coupling constants (SSCC). SSCC are related to the electronic structure of molecules and complexes through geometry, bond order, polarization, and electron densities. As Cremer and Gräfenstein wrote [35], “The analysis of NMR spin–spin coupling leads to a unique insight into the electronic structure of closed-shell molecules”. This was known for molecules from the beginning of the use of NMR spectroscopy [36,37,38] but was extended to complexes by Limbach [39,40] and Del Bene [41,42]. Through relationships between SSCC and geometry, the problem of the localization of the hydrogen-bonded proton could be solved [43].
In the present paper, we report the results of an investigation of 1-oxo-3-hydroxy-2-propene in a series of binary complexes with the acids LiH, LiF, BeH2, and BeF2. These complexes contain intramolecular O–H···O hydrogen bonds and lithium (alkali) and beryllium (alkaline earth) intermolecular bonds [44]. Specifically, we have determined the structures and binding energies of these complexes; the proton transfer barriers; the complex stabilization by charge-transfer interactions; and the spin–spin coupling constants 2hJ(O–O), 1hJ(H–O), and 1J(O–H) across the O–H…O hydrogen bond. It is the purpose of this paper to present and discuss the results of this study.
2. Results and Discussion
In order to simplify the discussion of the equilibrium and the transition structures on the 1-oxo-3-hydroxy-2-propene:acid potential energy surfaces, we refer to the hydrogen-bonded molecule 1-oxo-3-hydroxy-2-propene as 1 and name the complexes 1:LiH(OH), 1:LiH(ts), and 1:LiH(CO), where 1:LiH(OH) indicates that the acid LiH interacts with the hydroxyl oxygen, 1:LiH(CO) indicates that the interaction with the acid occurs at the carbonyl oxygen, and 1:LiH(ts) identifies the transition structure. These complexes are illustrated in Scheme 1.
Scheme 1.
Some representative complexes.
2.1. Ground State Structures and Binding Energies
Table S1 of the Supporting Information provides the structures, total energies, and molecular graphs of the complexes of 1-oxo-3-hydroxy-2-propene with the Lewis acids LiH, LiF, BeH2, and BeF2. The binding energies, selected distances, and the H–O–O angles in these complexes are reported in Table 1. For the equilibrium complexes, the binding energies range from 65 kJ·mol−1 for the complex 1:LiH(OH) to 100 kJ·mol−1 for 1:BeF2(CO). For each acid, the binding energies decrease in the following order:
Table 1.
Binding energies (−ΔE, kJ·mol−1), distances R (Å), and H–O–O angles (<, o) for complexes of C3H4O2 with acids.
| Complex | −ΔE | R(O···O) | R(O–H) | R(O···H) | <H–O…O |
|---|---|---|---|---|---|
| Isolated monomer C3H4O2 | 0.0 | 2.558 | 1.001 | 1.648 | 19.5 |
| ts isolated a | −11.6 a | 2.365 | 1.205 | 1.205 | 11.1 |
| C3H4O2:LiH at C=O | 75.6 | 2.572 | 0.995 | 1.677 | 20.6 |
| at O–H | 64.6 | 2.492 | 1.017 | 1.551 | 17.3 |
| ts | 59.6 | 2.360 | 1.171 | 1.235 | 11.5 |
| C3H4O2:LiF at C=O | 81.9 | 2.564 | 0.997 | 1.664 | 20.2 |
| at O–H | 72.7 | 2.496 | 1.015 | 1.557 | 17.4 |
| ts | 67.1 | 2.359 | 1.176 | 1.229 | 11.4 |
| C3H4O2:BeH2 at C=O | 82.4 | 2.566 | 0.992 | 1.704 | 23.0 |
| at O–H | 67.2 | 2.473 | 0.994 | 1.691 | 22.5 |
| ts | 64.0 | 2.356 | 1.156 | 1.256 | 12.9 |
| C3H4O2:BeF2 at C=O | 99.8 | 2.573 | 0.992 | 1.704 | 23.0 |
| at O–H | 80.9 | 2.457 | 1.029 | 1.514 | 18.2 |
| ts | 78.9 | 2.358 | 1.140 | 1.275 | 13.3 |
a The transition structure is 11.6 kJ·mol−1 less stable than the equilibrium C3H4O2 structure.
1:acid(CO) > 1:acid (OH) > 1:acid(ts).
When the interaction with the acid occurs at the carbonyl oxygen, the order of decreasing binding energy with respect to the acid is:
BeF2 > BeH2 ≈ LiF > LiH
However, when the interaction occurs at the hydroxyl oxygen, the order is:
BeF2 > LiF > BeH2 > LiH.
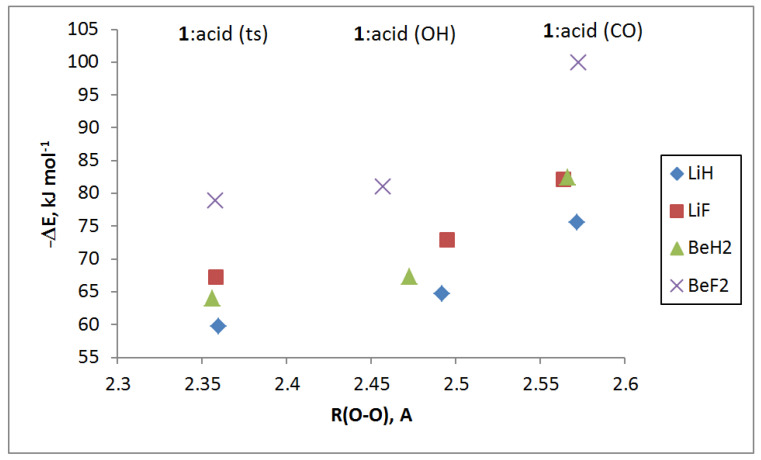
The differences among the binding energies of the equilibrium complexes with the acid at C=O versus O–H range from 9 kJ·mol−1 for the complexes with LiF as the acid to 19 kJ·mol−1 when BeF2 is the acid. Figure 1 provides a representation of the binding energies versus the O–O distance for these complexes and transition structures as a function of the acid. It is interesting to note that the binding energies of the transition structures are very similar to those of the complexes with the acid at the O–H group. Moreover, the binding energies of 1:LiF(CO) and 1:BeH2(CO) differ by only 0.5 kJ·mol−1.
Figure 1.
Binding energies versus the O–O distance for 1:acid (OH), 1:acid (ts), and 1:acid (CO) complexes as a function of the acid.
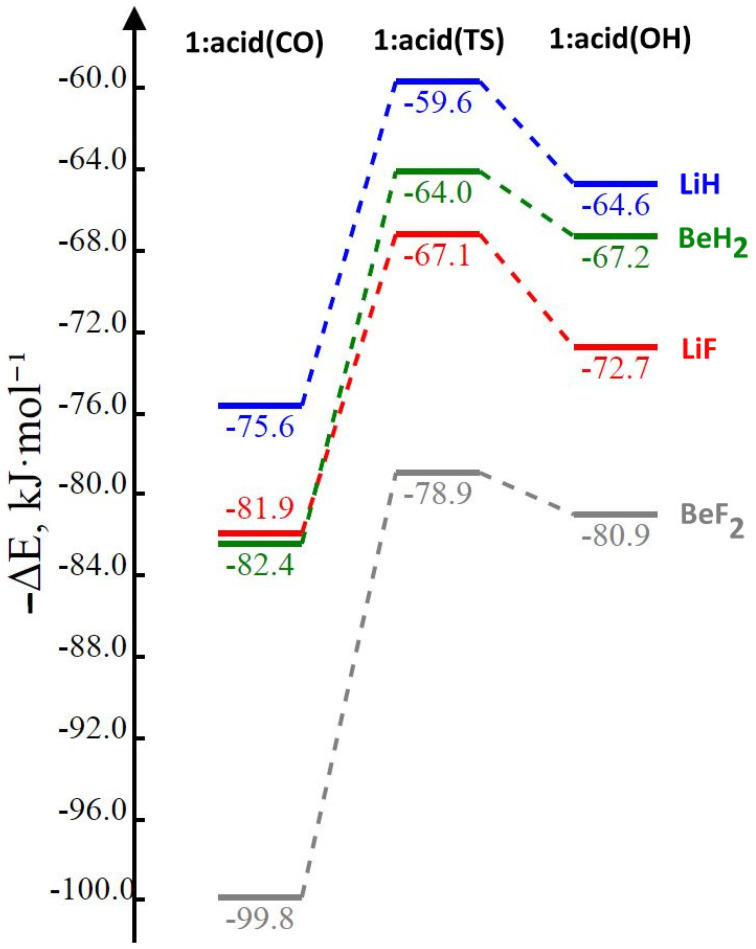
There are many approaches to representing the binding energies of a series of complexes. One of the most interesting and informative can be found in Figure 2, which provides a diagram illustrating the binding energies and the relative binding energies of complexes and transition structures 1:acid(CO), 1:acid(ts), and 1:acid(OH). The transition structures present the barriers that separate the equilibrium structures with the acid at C=O from the structures with the acid at O–H. This barrier is 12 kJ·mol−1 for the isolated parent molecule 1. Interaction of the acid with the C=O group increases the barrier to between 15 and 21 kJ·mol−1, while interaction at the O–H group decreases the barrier to between 2 and 6 kJ·mol−1. These latter barriers and the energy differences indicate that the population of the isomer with the acid at the carbonyl group would be the greater than 98% at room temperature.
Figure 2.
Binding energies of equilibrium and transition structures as a function of the nature of the complex. From these data, the barriers to interconverting the two equilibrium complexes can be readily obtained.
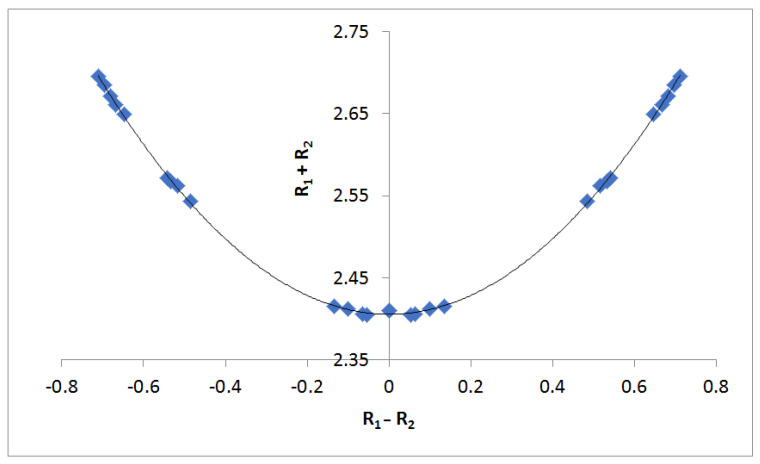
The O–O distances across the hydrogen bond in the complexes 1:acid with hydrogen bond formation at the C=O group increase slightly relative to isolated 1, which has an O–O distance of 2.56 Å. However, when hydrogen bond formation occurs at the O–H group, the O–O distance decreases to between 2.46 to 2.50 Å. As expected, the shortest O–O distances are found in the transition structures for proton transfer, where they decrease to 2.36 Å. An excellent second-order relationship can be obtained when the sum of the O–H distances (R1 + R2) in each system is compared to the difference (R1 − R2) using the Steiner–Limbach relationship [45,46]. The points with the largest (R1 + R2) values in Figure 3 correspond to the 1:acid(OH) complexes, the intermediate ones to the 1:acid(CO) complexes, and the shortest to the 1:acid(TS) complexes. This figure illustrates that the hydrogen-bonded H atom tends to be centered between the two oxygen atoms as they approach each other. The correlation coefficient of the second-order trending in Figure 3 is 0.9996.
Figure 3.
(R1 + R2) vs. (R1 − R2) from the Steiner–Limbach relationship.
The hydrogen bonds in all complexes are nonlinear. The deviation from linearity is 20° in isolated 1 and ranges from 17° to 22° in the complexes. The hydrogen bond approaches closer to linearity in the transition structures, where the deviation decreases to between 11° and 13°.
2.2. Orbital Description of the O–H…O Hydrogen Bond
There are two canonical lone pair (lp) orbitals associated with the carbonyl oxygen, both in the isolated base (1) and in the 1:acid complexes, and these are illustrated in Figure 4. The orbital lp1 isolated is a lone-pair orbital on O, which has local σ-type symmetry relative to the C=O bond, extending from the carbonyl oxygen in a direction corresponding to a continuation of the O–H bond. Interaction of the O–H group with this orbital leads to a side-wise overlap of a p-type orbital on the O–H group with the C=O lp1 orbital. The orbital lp2 is a local π-type orbital on 1, which is perpendicular to the C=O bond and directed toward the O–H group of 1 with which it interacts. This orbital extends on both sides of the C=O group, where it may also interact with an acid through the lobe of the p-type orbital which extends in this direction. This observation is consistent with the greater binding energies of complexes with the base interacting with 1 at the C=O group compared to those with the base interacting at the O–H group.
Figure 4.
Representations of the lone pair (lp) orbitals of 1 isolated and interacting with the O–H group based on the NBO analysis.
2.3. Charge-Transfer Energies
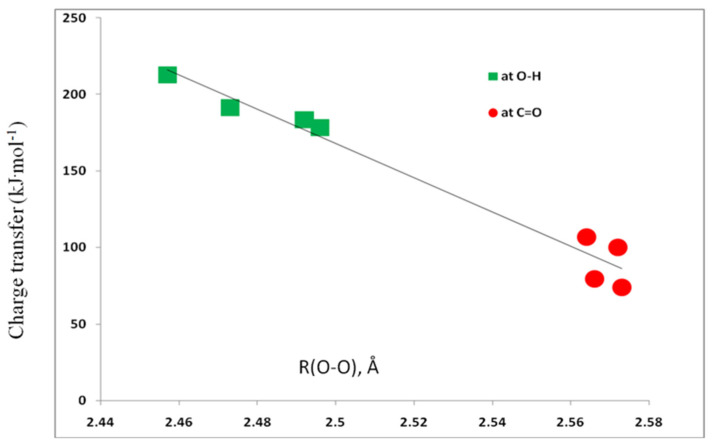
The complexes 1:acid are stabilized by charge-transfer interactions. The nature of charge transfer and the associated charge-transfer energies are reported in Table 2. Given the nature of the lone-pair orbitals illustrated in Figure 4, it is not surprising that charge transfer from lp2 is the dominant charge-transfer interaction, with energies ranging from 158 kJ·mol−1 in 1:LiF(OH) to 189 kJ·mol−1 1:BeF2(OH). The charge-transfer energies involving lp1 are much less, with values between 15 and 31 kJ·mol−1. The total charge-transfer energies vary from 100 to 213 kJ·mol−1. It is interesting to note that the strongest complexes occur in 1:acid(CO) (Table 1 and Figure 2), while the strongest intramolecular hydrogen bond can be seen in 1:acid(OH). Figure 5 illustrates a linear dependence of these energies on the O–O distance, with a correlation coefficient of 0.965.
Table 2.
Intramolecular charge-transfer stabilization energies (kJ·mol−1) for complexes of C3H4O2 with acids.
| Complex | Olp1→σ*O–H | Olp2→σ*O–H | Total |
|---|---|---|---|
| Isolated monomer C3H4O2 | 16.9 | 105.5 | 122.5 |
| C3H4O2:LiH at C=O | 15.2 | 84.9 | 100.1 |
| at O–H | 21.0 | 162.5 | 183.6 |
| C3H4O2:LiF at C=O | 15.1 | 91.7 | 106.8 |
| at O–H | 20.7 | 157.7 | 178.4 |
| C3H4O2:BeH2 at C=O | 26.1 | 53.6 | 79.7 |
| at O–H | 22.9 | 168.6 | 191.5 |
| C3H4O2:BeF2 at C=O | 30.5 | 43.6 | 74.1 |
| at O–H | 24.1 | 188.7 | 212.8 |
Figure 5.
Charge-transfer energies versus the O–O distance.
2.4. Electron Density Analyses
The electron densities of the equilibrium and transition structures were analyzed using the quantum theory of atoms in molecules (QTAIM) methodology. All complexes have two bond critical points. In the equilibrium structures, the first bond critical point is associated with the covalent O–H bond with ρBCP values of 0.30 au, while the second refers to the hydrogen bond with ρBCP values around 0.05 au. The transition structures have intermediate values of ρBCP between 0.15 to 0.20 au. The ▽2ρBCP values are negative for the covalent O–H bonds in the equilibrium and transition structures but positive for the hydrogen bonds. The total energy densities, HBCP, are negative in all structures. Thus, all O–H contacts have some covalent character. The covalency is of medium strength in the equilibrium complexes that have a positive ▽2ρBCP and a negative value of HBCP, while the transition structures have much stronger covalent interactions with a negative value of both ▽2ρBCP and HBCP [47,48]. Excellent exponential correlations are obtained between ρBCP and HBCP versus the interatomic distance, as illustrated in Figure S1, in agreement with other reports of these parameters as descriptors of intermolecular interactions [49,50,51].
2.5. Spin–Spin Coupling Constants
The total spin–spin coupling constants 2hJ(O–O), 1hJ(H–O), and 1J(O–H) are given in Table 3, and the paramagnetic spin–orbit (PSO), diamagnetic spin–orbit (DSO), Fermi contact (FC), and spin–dipole (SD) components are reported in Table S2 of the Supporting Information. For the equilibrium ground states of the complexes, the PSO, FC, and SD components of 2hJ(O–O) are positive. Both the PSO and SD components of 2hJ(O–O) are non-negligible, with the PSO component having values comparable to those of the FC term when interaction with the acid occurs at the carbonyl group. Even though the FC terms for the transition structures have values that are greater and closer to total J, the FC terms are poor approximations to the total coupling constant 2hJ(O–O).
Table 3.
Spin–spin coupling constants 2hJ(O–O), 1hJ(H–O), and 1J(O–H) (Hz) for the O–H…O hydrogen bond in complexes C3H4O2:Acid.
| Complex | 2hJ(O–O) | 1hJ(H–O) | 1J(O–H) |
|---|---|---|---|
| Isolated monomer C3H4O2 | 11.5 | 7.9 | −77.7 |
| Isolated ts | 24.7 | −19.7 | −19.7 |
| C3H4O2:LiH at C=O | 10.2 | 7.9 | −79.2 |
| at O–H | 13.7 | 7.4 | −81.3 |
| ts | 24.0 | −14.5 | −31.2 |
| C3H4O2:LiF at C=O | 10.5 | 8.1 | −78.6 |
| at O–H | 13.5 | 7.4 | −82.2 |
| ts | 24.1 | −15.5 | −30.0 |
| C3H4O2:BeH2 at C=O | 10.0 | 7.8 | −81.4 |
| at O–H | 14.3 | 6.4 | −89.7 |
| ts | 23.8 | −12.8 | −41.4 |
| C3H4O2:BeF2 at C=O | 9.6 | 7.7 | −82.1 |
| at O–H | 15.4 | 5.8 | −88.7 |
| ts | 23.6 | −10.3 | −47.1 |
Coupling constants 1hJ(H–O) are also small and positive for the equilibrium structures and are dominated by the FC terms. The PSO terms are smaller and positive for the equilibrium structures, but these are partially canceled by the negative DSO and SD terms. The net result is that the FC terms differ from 1hJ(H–O) by about 1 Hz. The coupling constant 1J(O–H) is negative and has a significantly greater absolute value than 2hJ(O–O) and 1hJ(H–O) since it refers to a covalent O–H bond. Values of this coupling constant are dominated by the negative FC terms, while the PSO terms make smaller, non-negligible negative contributions to 1J(O–H) in the equilibrium structures but positive contributions in the transition structures. Thus, all terms should be included in determining 1J(O–H).
2.5.1. 2hJ(O–O)
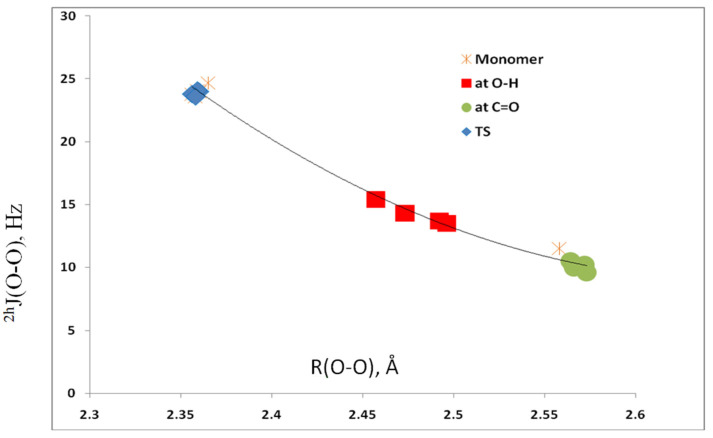
Spin–spin coupling constants 2hJ(O–O) across the O–H…O hydrogen bond are reported in Table 3. This coupling constant has a value of 12 Hz in the isolated monomer 1 and then decreases to about 10 Hz in the complexes when the acid interacts with 1 at the C=O bond. When interaction occurs at the O–H bond, 2hJ(O–O) increases to between 13 and 15 Hz. The value of 2hJ(O–O) obviously depends on the O–O distance, so it is not surprising that 2hJ(O–O) increases to about 24 Hz in the transition structures that have the shortest O–O distances. These relationships are seen most easily in Figure 6, which is a plot of 2hJ(O–O) versus the O–O distance. The second-order trendline has a correlation coefficient of 0.992.
Figure 6.
2hJ(O–O) versus the O–O distance for complexes 1:acid.
2.5.2. 1hJ(H–O)
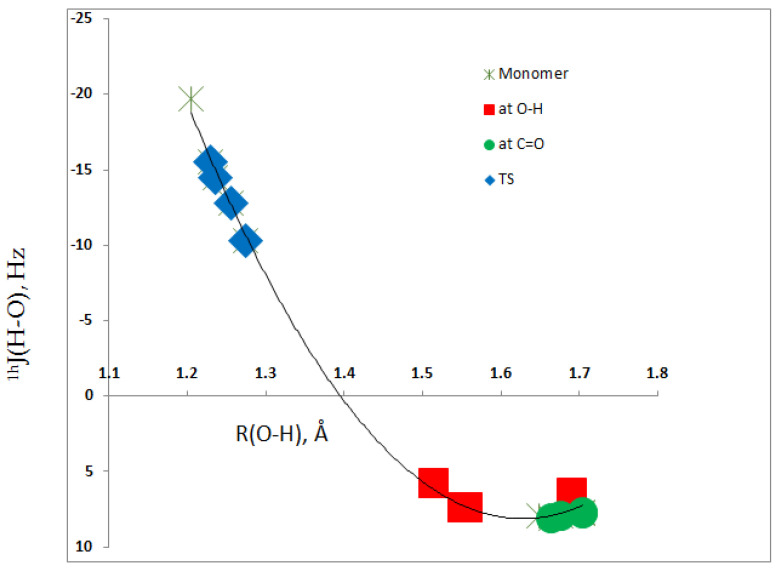
The values of the second coupling constant 1hJ(H–O) across the hydrogen bond are also reported in Table 3. Its value of 7.9 Hz in 1 changes minimally upon complex formation, ranging from 7.7 to 8.1 Hz when complexation occurs at the O–H group. It decreases to between 5.8 and 7.4 Hz when the acid interacts at the C=O group. Much larger changes are observed in the transition structures as the H–O distance across the hydrogen bond contracts, and 1hJ(H–O) has a value of −19.7 Hz in 1. This coupling constant varies from −10.3 Hz in the complex with BeF2 as the acid to −15.5 Hz with LiF as the acid. The dependence of 1hJ(H–O) on the H–O distance is illustrated in Figure 7, which has a second-order trendline with a correlation coefficient of 0.997. The vertical 1hJ(H–O) axis was reversed to account for the negative magnetogyric ratio of 17O. This plot also illustrates the changing nature of the hydrogen bond, from a traditional hydrogen bond in the equilibrium complexes with bond formation at the O–H or C=O groups to a proton-shared hydrogen bond in the transition structures.
Figure 7.
1hJ(O–H) versus the O–H distance for complexes 1:Acid.
2.5.3. 1J(O–H)
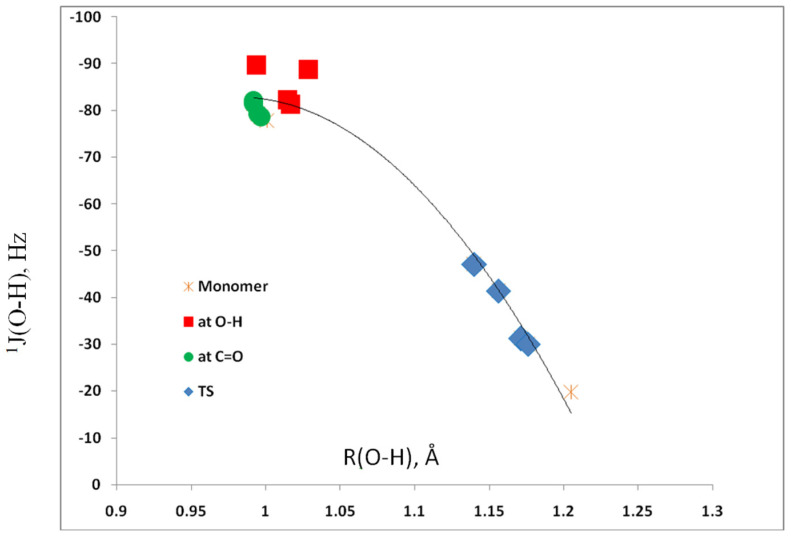
The third coupling constant associated with the O–H…O hydrogen bond is 1J(O–H) for the proton donor O–H group. Its value in 1 of −78 Hz minimally changes in complexes in which the acid interacts with the C=O group, varying between −79 and −82 Hz. However, interaction with the O–H group leads to a significant increase in the absolute value of 1J(O–H) to between −81 and −90 Hz. As the O–H distance increases dramatically in the transition structures, 1J(O–H) decreases significantly in absolute value to −20 Hz in 1 and from −30 to −47 Hz in the complexes with the acids. Once again, the variation in this coupling constant can be readily seen in the plot of 1J(O–H) versus the O–H distance, shown in Figure 8. The correlation coefficient of the second-order trendline is 0.973.
Figure 8.
1J(O–H) versus the O–H distance for complexes 1:acid.
3. Methods
The structures of the isolated monomer 1-oxo-3-hydroxy-2-propene; the acids LiH, LiF, BeH2, and BeF2; and the complexes of 1-oxo-3-hydroxy-2-propene with the acids were optimized at second-order Møller–Plesset perturbation theory (MP2) [52,53,54,55] with the aug’-cc-pVTZ basis set [56]. This basis set was derived from the Dunning aug-cc-pVTZ basis set [57,58] by removing diffuse functions from H atoms. Searches were made of the 1-oxo-3-hydroxy-2-propene:acid potential surfaces for equilibrium structures and transition structures. Frequencies were computed to confirm that the optimized structures are indeed equilibrium structures with no imaginary frequencies and that the transition structures have one imaginary frequency along the path that connects two equilibrium structures. Optimization and frequency calculations were performed using the Gaussian 16 program [59]. The binding energies of the equilibrium complexes were computed as −ΔE for the reaction that forms these complexes from the isolated monomers.
The natural bond orbital (NBO) method [60] was used to obtain the stabilizing charge-transfer interactions using the NBO-6 program [61]. Since MP2 orbitals are nonexistent, the charge-transfer interactions were computed using the B3LYP functional with the aug’-cc-pVTZ basis set at the MP2/aug’-cc-pVTZ geometries so that at least some electron correlation effects could be included. The atoms in molecules (AIM) methodology [62,63,64,65] was used to produce the molecular graphs of the complexes, employing the AIMAll program [66]. The molecular graph identifies the location of electron density features of interest, including the electron density (ρ) maxima associated with the various nuclei and saddle points that correspond to bond critical points (BCPs). The zero gradient line that connects a BCP with two nuclei is the bond path.
Spin–spin coupling constants were evaluated using the equation-of-motion coupled cluster singles and doubles (EOM-CCSD) method in the CI (configuration interaction)-like approximation [67,68] with all electrons correlated. For these calculations, the Ahlrichs [69] qzp basis set was placed on 13C, 17O, and 19F atoms, the hybrid basis set developed previously on 7Li and 9Be [70], and the qz2p basis set on the hydrogen-bonded 1H atom. The Dunning cc-pVDZ basis was placed on the remaining 1H atoms. All terms that contribute to the total coupling constant, namely, the paramagnetic spin–orbit (PSO), diamagnetic spin–orbit (DSO), Fermi contact (FC), and spin–dipole (SD) were evaluated. The EOM-CCSD calculations were performed using ACES II [71] on the HPC cluster Owens at the Ohio Supercomputer Center.
4. Conclusions
Ab initio MP2/aug’-cc-pVTZ calculations were carried out to identify and characterize hydrogen-bonded equilibrium structures and transition structures on the 1-oxo-3-hydroxy-2-propene:acid (1:acid) potential energy surfaces, with the acids LiH, LiF, BeH2, and BeF2. The results of these calculations support the following statements:
Two equilibrium structures, one with the acid interacting with the C=O group and the other with the interaction occurring at the O–H group, exist on all surfaces. These structures are separated by transition structures that present the barriers to the interconversion of the two equilibrium structures.
The binding energies of these complexes vary between 65 and 100 kJ·mol−1, with binding at the C=O group preferred by 10 to 20 kJ·mol−1.
The barrier to interconverting the equilibrium structures with the acid at the C=O group to the structure with the acid at the O–H group is 12 kJ·mol−1 in isolated 1 and increases to between 15 and 21 kJ·mol−1 in the complexes. The reverse barriers range from 2 to 6 kJ·mol−1. Thus, only structures with the acid interacting at the C=O group would be experimentally observed, even at low temperatures.
Charge-transfer stabilizes the 1:acid complexes. The greater charge-transfer interactions involve electron donation from an oxygen lone pair orbital on the C=O group to an antibonding pi-type orbital on the O–H group.
EOM-CCSD spin–spin coupling constants 2hJ(O–O), 1hJ(H–O), and 1J(O–H) were computed for all equilibrium and transition structures. Plots of 2hJ(O–O) versus the O–O distance, 1hJ(H–O) versus the H–O distance across the hydrogen bond, and 1J(O–H) versus the covalent O–H bond distance of 1 exhibit a second-order dependence of the coupling constant on the corresponding distance, with very high correlation coefficients.
Supplementary Materials
The following are available online, Table S1: Structures (Å), total energies (au), and molecular graphs of 1-oxo-3-hydroxy-2-propene:acid complexes; Figure S1: Relationship between electron densities at the O–H hydrogen bonds and interatomic distances; Table S2: Components of spin–spin coupling constants 2hJ(O–O), 1hJ(H–O), and 1J(O–H) (Hz).
Author Contributions
I.A. and J.E.D.B. carried out the calculations. J.E.D.B., J.E., and I.A. contributed equally to the writing of this paper. All authors have read and agreed to the published version of the manuscript.
Funding
This work was carried out with financial support from the Ministerio de Ciencia, Innovación y Universidades of Spain (Project No. PGC2018–094644-B-C22) and Comunidad Autónoma de Madrid (P2018/EMT–4329 AIRTEC-CM).
Institutional Review Board Statement
Not applicable.
Informed Consent Statement
Not applicable.
Data Availability Statement
The data presented in this study are available in the article and in the Supplementary Material.
Conflicts of Interest
The authors declare no conflict of interest.
Sample Availability
Not applicable.
Footnotes
Publisher’s Note: MDPI stays neutral with regard to jurisdictional claims in published maps and institutional affiliations.
References
- 1.Grabowski S. An estimation of strength of intramolecular hydrogen bonds—Ab initio and AIM studies. J. Mol. Struct. 2001;562:137–143. doi: 10.1016/S0022-2860(00)00863-2. [DOI] [Google Scholar]
- 2.Carrington T., Miller W.H. Reaction Surface Hamiltonian for the Dynamics of Reactions in Polyatomic Systems. J. Chem. Phys. 1984;81:3942–3950. doi: 10.1063/1.448187. [DOI] [Google Scholar]
- 3.Tew D.P., Handy N.C., Carter S. A reaction surface Hamiltonian study of malonaldehyde. J. Chem. Phys. 2006;125:084313. doi: 10.1063/1.2338891. [DOI] [PubMed] [Google Scholar]
- 4.Fillaux F., Nicolaï B. Proton Transfer in Malonaldehyde: From Reaction Path to Schrödinger’s Cat. Chem. Phys. Lett. 2005;415:357–361. doi: 10.1016/j.cplett.2005.08.147. [DOI] [Google Scholar]
- 5.Wong K.F., Sonnenberg J.L., Paesani F., Yamamoto T., Vaníček J., Zhang W., Schlegel H.B., Case D.A., Cheatham T.E., Miller W.H., et al. Proton Transfer Studied Using a Combined Ab Initio Reactive Potential Energy Surface with Quantum Path Integral Methodology. J. Chem. Theory Comput. 2010;6:2566–2580. doi: 10.1021/ct900579k. [DOI] [PMC free article] [PubMed] [Google Scholar]
- 6.Karandashev K., Xu Z.-H., Meuwly M., Vaníček J., Richardson J.O. Kinetic isotope effects and how to describe them. Struct. Dyn. 2017;4:061501. doi: 10.1063/1.4996339. [DOI] [PMC free article] [PubMed] [Google Scholar]
- 7.Grosch A.A., Van der Lubbe S.C.C., Guerra C.F. Nature of Intramolecular Resonance Assisted Hydrogen Bonding in Malonaldehyde and Its Saturated Analogue. J. Phys. Chem. A. 2018;122:1813–1820. doi: 10.1021/acs.jpca.7b12635. [DOI] [PMC free article] [PubMed] [Google Scholar]
- 8.Grabowski S.J. Intramolecular Hydrogen Bond Energy and Its Decomposition—O–H⋅⋅⋅O Inyteractions. Crystals. 2021;11:5. doi: 10.3390/cryst11010005. [DOI] [Google Scholar]
- 9.Gilli G., Bellucci F., Ferretti V., Bertolasi V. Evidence for Resonance-Assisted Hydrogen Bonding from Crystal-Structure Correlations on the Enol Form of the β-Diketone Fragment. J. Am. Chem. Soc. 1989;111:1023–1028. doi: 10.1021/ja00185a035. [DOI] [Google Scholar]
- 10.Bertolasi V., Nanni L., Gilli P., Ferretti V., Gilli G., Issa Y.M., Sherif O.E. Intramolecular N–H⋅⋅⋅O=C Hydrogen-Bonding Assisted by Resonance-Intercorrelation between Structural and Spectroscopic Data for Six β-Diketo-Arylhydrazones Derived from Benzoylacetone or Acetylacetone. New J. Chem. 1994;18:251–261. [Google Scholar]
- 11.Trujillo C., Sánchez-Sanz G., Alkorta I., Elguero J., Mó O., Yáñez M. Resonance assisted hydrogen bonds in open-chain and cyclic structures of malonaldehyde enol: A theoretical study. J. Mol. Struct. 2013;1048:138–151. doi: 10.1016/j.molstruc.2013.04.069. [DOI] [Google Scholar]
- 12.Sanz P., Montero-Campillo M.M., Mó O., Yáñez M., Alkorta I., Elguero J. Intramolecular magnesium bonds in malonaldehyde-like systems: A critical view of the resonance-assisted phenomena. Theor. Chem. Acc. 2018;137:97. doi: 10.1007/s00214-018-2274-4. [DOI] [Google Scholar]
- 13.Palusiak M., Simon S., Solà M. The proton transfer reaction in malonaldehyde derivatives: Substituent effects and quasi-aromaticity of the proton bridge. Chem. Phys. 2007;342:43–54. doi: 10.1016/j.chemphys.2007.09.016. [DOI] [Google Scholar]
- 14.Meyer K. Über die Tautomerie des Acetessigesters. Über Keto-Enol-Tautomerie III. Berichte der Deutschen Chemischen Gesellschaft. 1911;44:2718–2724. doi: 10.1002/cber.191104403105. [DOI] [Google Scholar]
- 15.Meyer K. Über den Zusammenhang zwischen Konstitution und Gleichgewicht bei keto-enol-desmotropen Verbindungen. Über Keto-Enol-Tautomerie VI. Berichte der Deutschen Chemischen Gesellschaft. 1912;45:2843–2864. doi: 10.1002/cber.19120450303. [DOI] [Google Scholar]
- 16.Bothner-By A.A., Harris R.K. Conformational Preferences in Malonaldehyde and Acetylacetal-dehyde Enols Investigated by Nuclear Magnetic Resonance. J. Org. Chem. 1965;30:254–257. doi: 10.1021/jo01012a059. [DOI] [Google Scholar]
- 17.Emsley J. Complex Chemistry. Structure and Bonding. Vol. 57. Springer; Berlin/Heidelberg, Germany: 1984. The composition, structure and hydrogen bonding of the β-diketones; pp. 147–191. [Google Scholar]
- 18.Claramunt R.M., López C., Lott S., María M.D.S., Alkorta I., Elguero J. Solid-State NMR Study of the Tautomerism of Acetylacetone Included in a Host Matrix. Helv. Chim. Acta. 2005;88:1931–1942. doi: 10.1002/hlca.200590148. [DOI] [Google Scholar]
- 19.Jabłoński M. A Critical Overview of Current Theoretical Methods of Estimating the Energy of Intramolecular Interactions. Molecules. 2020;25:5512. doi: 10.3390/molecules25235512. [DOI] [PMC free article] [PubMed] [Google Scholar]
- 20.Montero M.D.A., Martínez F.A., Aucar G.A. Magnetic descriptors of hydrogen bonds in malonaldehyde and its derivatives. Phys. Chem. Chem. Phys. 2019;21:19742–19754. doi: 10.1039/C9CP02995H. [DOI] [PubMed] [Google Scholar]
- 21.Pichierri F. Effect of fluorine substitution on the proton transfer barrier in malonaldehyde. A density functional theory study. Chem. Phys. Lett. 2003;376:781–787. doi: 10.1016/S0009-2614(03)01117-5. [DOI] [Google Scholar]
- 22.Scivetti I., Sen K., Elena A.M., Todorov I.T. Reactive Molecular Dynamics at Constant Pressure via Nonreactive Force Fields: Extending the Empirical Valence Bond Method to the Isothermal-Isobaric Ensemble. J. Phys. Chem. A. 2020;124:7585–7597. doi: 10.1021/acs.jpca.0c05461. [DOI] [PubMed] [Google Scholar]
- 23.List N.H., Dempwolff A.L., Dreuw A., Norman P., Martínez T.J. Probing competing relaxation pathways in malonaldehyde with transient X-ray absorption spectroscopy. Chem. Sci. 2020;11:4180–4193. doi: 10.1039/D0SC00840K. [DOI] [PMC free article] [PubMed] [Google Scholar]
- 24.Yagi K., Taketsugu T., Hirao K. Generation of full-dimensional potential energy surface of intramolecular hydrogen atom transfer in malonaldehyde and tunneling dynamics. J. Chem. Phys. 2001;115:10647–10655. doi: 10.1063/1.1418436. [DOI] [Google Scholar]
- 25.Tautermann C.S., Voegele A.F., Loerting T., Liedl K.R. The Optimum Tunneling Path for the Proton Transfer in Malonaldehyde. J. Chem. Phys. 2002;117:1962–1966. doi: 10.1063/1.1488924. [DOI] [Google Scholar]
- 26.Mil’Nikov G.V., Yagi K., Taketsugu T., Nakamura H., Hirao K. Simple and accurate method to evaluate tunneling splitting in polyatomic molecules. J. Chem. Phys. 2004;120:5036–5045. doi: 10.1063/1.1647052. [DOI] [PubMed] [Google Scholar]
- 27.Gulaczyk I., Kręglewski M. Multi-dimensional proton tunneling in 2-methylmalonaldehyde. J. Mol. Struct. 2020;1220:128733. doi: 10.1016/j.molstruc.2020.128733. [DOI] [Google Scholar]
- 28.Alparone A., Millefiori S. Anharmonic vibrational spectroscopic investigation of malonaldehyde. Chem. Phys. 2003;290:15–25. doi: 10.1016/S0301-0104(03)00090-9. [DOI] [Google Scholar]
- 29.Baughcum S.L., Duerst R.W., Rowe W.F., Smith Z., Wilson E.B. Microwave spectroscopic study of malonaldehyde (3-hydroxy-2-propenal). 2. Structure, dipole moment, and tunneling. J. Am. Chem. Soc. 1981;103:6296–6303. doi: 10.1021/ja00411a005. [DOI] [Google Scholar]
- 30.Baughcum S.L., Smith Z., Wilson E.B., Duerst R.W. Microwave spectroscopic study of malonaldehyde. 3. Vibration-rotation interaction and one-dimensional model for proton tunneling. J. Am. Chem. Soc. 1984;106:2260–2265. doi: 10.1021/ja00320a007. [DOI] [Google Scholar]
- 31.Turner P., Baughcum S.L., Coy S.L., Smith Z. Microwave spectroscopic study of malonaldehyde. 4. Vibration-rotation interaction in parent species. J. Am. Chem. Soc. 1984;106:2265–2267. doi: 10.1021/ja00320a008. [DOI] [Google Scholar]
- 32.Delchev V.B. Hydrogen Bonded Complexes of Acetylacetone and Methanol: HF and DFT level Study. Monatsh. Chem. 2004;135:249–260. doi: 10.1007/s00706-003-0096-z. [DOI] [Google Scholar]
- 33.Grabowski S.J. Intramolecular O–H O Hydrogen Bonds—The Influence of External Agents on Their Properties. Pol. J. Chem. 2007;81:799–811. [Google Scholar]
- 34.Mó O., Yáñez M., Alkorta I., Elguero J. Modulating the Strength of Hydrogen Bonds through Beryllium Bonds. J. Chem. Theory Comput. 2012;8:2293–2300. doi: 10.1021/ct300243b. [DOI] [PubMed] [Google Scholar]
- 35.Cremer D., Gräfenstein J. Calculation and analysis of NMR spin–spin coupling constants. Phys. Chem. Chem. Phys. 2007;9:2791–2816. doi: 10.1039/B700737J. [DOI] [PubMed] [Google Scholar]
- 36.Pople J.A., Schneider W.G., Bernstein H.J. High Resolution Nuclear Magnetic Resonance. McGraw-Hill; New York, NY, USA: 1959. [Google Scholar]
- 37.Roberts J.D. Nuclear Magnetic Resonance. McGraw-Hill; New York, NY, USA: 1959. [Google Scholar]
- 38.Ernst R.R., Bodenhausen G., Wokaun A. Principles of Nuclear Magnetic Resonance in One and Two Dimensions. Clarendon Press; New York, NY, USA: 1987. [Google Scholar]
- 39.Shenderovich I.G., Smirnov S.N., Denisov G.S., Gindin V.A., Golubev N.S., Dunger A., Reibke R., Kirpekar S., Malkina O.L., Limbach H.-H. Nuclear magnetic resonance of hydrogen bonded clusters between F− and (HF)n: Experiment and theory. Berichte der Deutschen Chemischen Gesellschaft. 1998;102:422–428. doi: 10.1002/bbpc.19981020322. [DOI] [Google Scholar]
- 40.Del Amo J.M.L., Langer U., Torres V., Buntkowsky G., Vieth H.-M., Pérez-Torralba M., Sanz D., Claramunt R.M., Elguero J., Limbach H.-H. NMR Studies of Ultrafast Intramolecular Proton Tautomerism in Crystalline and Amorphous N,N′-Diphenyl-6-aminofulvene-1-aldimine: Solid-State, Kinetic Isotope, and Tunneling Effects. J. Am. Chem. Soc. 2008;130:8620–8632. doi: 10.1021/ja801506n. [DOI] [PubMed] [Google Scholar]
- 41.Del Bene J.E., Perera S.A., Bartlett R.J. Predicted NMR Coupling Constants Across Hydrogen Bonds: A Fingerprint for Specifying Hydrogen Bond Type? J. Am. Chem. Soc. 2000;122:3560–3561. doi: 10.1021/ja994312h. [DOI] [Google Scholar]
- 42.Del Bene J.E., Perera S.A., Bartlett R.J., Alkorta I., Elguero J. 4hJ(31P–31P) Coupling Constants through N–H+–N Hydrogen Bonds: A Comparison of Computed ab Initio and Experimental Data. J. Phys. Chem. A. 2000;104:7165–7166. doi: 10.1021/jp001681n. [DOI] [Google Scholar]
- 43.Hoelger C.-G., Limbach H.-H. Localization of Hydrons in Hydrogen Bonds Using Dipolar Solid State NMR Spectroscopy. J. Phys. Chem. 1994;98:11803–11810. doi: 10.1021/j100096a028. [DOI] [Google Scholar]
- 44.Alkorta I., Elguero J., Frontera A. Not Only Hydrogen Bonds: Other Noncovalent Interactions. Crystals. 2020;10:180. doi: 10.3390/cryst10030180. [DOI] [Google Scholar]
- 45.Steiner T. Lengthening of the N–H bond in N–H⋯N hydrogen bonds. Preliminary structural data and implications of the bond valence concept. J. Chem. Soc. Chem. Commun. 1995:1331–1332. doi: 10.1039/C39950001331. [DOI] [Google Scholar]
- 46.Ramos M., Alkorta I., Elguero J., Golubev N.S., Denisov G.S., Benedict H., Limbach H.-H. Theoretical Study of the Influence of Electric Fields on Hydrogen-Bonded Acid−Base Complexes. J. Phys. Chem. A. 1997;101:9791–9800. doi: 10.1021/jp972586q. [DOI] [Google Scholar]
- 47.Cremer D., Kraka E. A Description of the Chemical Bond in Terms of Local Properties of Electron Density and Energy, Croat. Chem. Acta. 1984;57:1259–1281. [Google Scholar]
- 48.Rozas I., Alkorta I., Elguero J. Behavior of Ylides Containing N, O, and C Atoms as Hydrogen Bond Acceptors. J. Am. Chem. Soc. 2000;122:11154–11161. doi: 10.1021/ja0017864. [DOI] [Google Scholar]
- 49.Mata I., Alkorta I., Molins E., Espinosa E. Universal Features of the Electron Density Distribution in Hydrogen-Bonding Regions: A Comprehensive Study Involving H ⋅⋅⋅ X (X=H, C, N, O, F, S, Cl, π) Interactions. Chem. Eur. J. 2010;16:2442–2452. doi: 10.1002/chem.200901628. [DOI] [PubMed] [Google Scholar]
- 50.Alkorta I., Solimannejad M., Provasi P.F., Elguero J. Theoretical Study of Complexes and Fluoride Cation Transfer between N2F+and Electron Donors. J. Phys. Chem. A. 2007;111:7154–7161. doi: 10.1021/jp073112m. [DOI] [PubMed] [Google Scholar]
- 51.Sánchez-Sanz G., Alkorta I., Elguero J. Theoretical study of the HXYH dimers (X, Y = O, S, Se). Hydrogen bonding and chalcogen–chalcogen interactions. Mol. Phys. 2011;109:2453–2552. doi: 10.1080/00268976.2011.621458. [DOI] [Google Scholar]
- 52.Pople J.A., Binkley J.S., Seeger R. Theoretical models incorporating electron correlation. Int. J. Quantum Chem. 2009;10:1–19. doi: 10.1002/qua.560100802. [DOI] [Google Scholar]
- 53.Krishnan R., Pople J.A. Approximate fourth-order perturbation theory of the electron correlation energy. Int. J. Quantum Chem. 1978;14:91–100. doi: 10.1002/qua.560140109. [DOI] [Google Scholar]
- 54.Bartlett R.J., Silver D.M. Many-body perturbation theory applied to electron pair correlation energies. I. Closed-shell first-row diatomic hydrides. J. Chem. Phys. 1975;62:3258–3268. doi: 10.1063/1.430878. [DOI] [Google Scholar]
- 55.Bartlett R.J., Purvis G.D. Many-body perturbation theory, coupled-pair many-electron theory, and the importance of quadruple excitations for the correlation problem. Int. J. Quantum Chem. 1978;14:561–581. doi: 10.1002/qua.560140504. [DOI] [Google Scholar]
- 56.Del Bene J.E. Proton affinities of ammonia, water, and hydrogen fluoride and their anions: A quest for the basis-set limit using the Dunning augmented correlation-consistent basis sets. J. Phys. Chem. 1993;97:107–110. doi: 10.1021/j100103a020. [DOI] [Google Scholar]
- 57.Dunning T.H. Gaussian Basis Sets for Use in Correlated Molecular Calculations. I. The Atoms Boron through Neon and Hydrogen. J. Chem. Phys. 1989;90:1007–1023. doi: 10.1063/1.456153. [DOI] [Google Scholar]
- 58.Woon D.E., Dunning T.H. Gaussian basis sets for use in correlated molecular calculations. V. Core-valence basis sets for boron through neon. J. Chem. Phys. 1995;103:4572–4585. doi: 10.1063/1.470645. [DOI] [Google Scholar]
- 59.Frisch M.J.G.W., Trucks G.W., Schlegel H.B., Scuseria G.E., Robb M.A., Cheeseman J.R., Scalmani G., Barone V., Petersson G.A., Nakatsuji H., et al. Gaussian 16, Revision A. 03. Gaussian, Inc.; Wallingford, CT, USA: 2016. [Google Scholar]
- 60.Reed A.E., Curtiss L.A., Weinhold F. Intermolecular interactions from a natural bond orbital, donor-acceptor viewpoint. Chem. Rev. 1988;88:899–926. doi: 10.1021/cr00088a005. [DOI] [Google Scholar]
- 61.Glendening E.D., Badenhoop J.K., Reed A.E., Carpenter J.E., Bohmann J.A., Morales C.M., Landis C.R., Weinhold F. NBO 6.0. University of Wisconsin; Madison, WI, USA: 2013. [Google Scholar]
- 62.Bader R.F.W. A quantum theory of molecular structure and its applications. Chem. Rev. 1991;91:893–928. doi: 10.1021/cr00005a013. [DOI] [Google Scholar]
- 63.Bader R.F.W. Atoms in Molecules, a Quantum Theory. Oxford University Press; Oxford, UK: 1990. [Google Scholar]
- 64.Popelier P.L.A. Atoms in Molecules. An Introduction. Prentice Hall; Harlow, UK: 2000. [Google Scholar]
- 65.Matta C.F., Boyd R.J. The Quantum Theory of Atoms in Molecules: From Solid State to DNA and Drug Design. Wiley-VCH; Weinheim, Germany: 2007. [Google Scholar]
- 66.Keith T.A. AIMAll (Version 19.10.12) TK Gristmill Software; Overland Park, KS, USA: 2019. [Google Scholar]
- 67.Perera S.A., Nooijen M., Bartlett R.J. Electron correlation effects on the theoretical calculation of nuclear magnetic resonance spin–spin coupling constants. J. Chem. Phys. 1996;104:3290–3305. doi: 10.1063/1.471092. [DOI] [Google Scholar]
- 68.Perera S.A., Sekino H., Bartlett R.J. Coupled-cluster calculations of indirect nuclear coupling constants: The importance of non-Fermi contact contributions. J. Chem. Phys. 1994;101:2186–2191. doi: 10.1063/1.467725. [DOI] [Google Scholar]
- 69.Schäfer A., Horn H., Ahlrichs R. Fully optimized contracted Gaussian basis sets for atoms Li to Kr. J. Chem. Phys. 1992;97:2571–2577. doi: 10.1063/1.463096. [DOI] [Google Scholar]
- 70.Del Bene J.E., Elguero J., Alkorta I., Yáñez A.M., Mó O. An ab Initio Study of 15N−11B Spin−Spin Coupling Constants for Borazine and Selected Derivatives. J. Phys. Chem. A. 2006;110:9959–9966. doi: 10.1021/jp0628737. [DOI] [PubMed] [Google Scholar]
- 71.Stanton J.F., Gauss J., Watts J.D., Nooijen J.M., Oliphant N., Perera S.A., Szalay P.S., Lauderdale W.J., Gwaltney S.R., Beck S., et al. ACES II. University of Florida; Gainesville, FL, USA: 1991. [Google Scholar]
Associated Data
This section collects any data citations, data availability statements, or supplementary materials included in this article.
Supplementary Materials
Data Availability Statement
The data presented in this study are available in the article and in the Supplementary Material.


