

Abstract
Background and Objectives:
Light-sheet microscopy (LSM) is a novel imaging technology that has been used for imaging fluorescence contrast in basic life science research. In this paper, we have developed a scattering-based LSM (sLSM) for rapidly imaging the cellular morphology of fresh tissues without any exogenous fluorescent dyes.
Study Design/Materials and Methods:
In the sLSM device, a thin light sheet with the central wavelength of 834 nm was incident on the tissue obliquely, 45° relative to the tissue surface. The detection optics was configured to map the light sheet-illuminated area onto a two-dimensional imaging sensor. The illumination numerical aperture (NA) was set as 0.0625, and the detection NA 0.3.
Results:
The sLSM device achieved a light sheet thickness of less than 6.7 μm over 284 μm along the illumination optical axis. The detection optics of the sLSM device had a resolution of 1.8 μm. The sLSM images of the swine kidney ex vivo visualized tubules with similar sizes and shapes to those observed in histopathologic images. The swine duodenum sLSM images revealed cell nuclei and villi architecture in superficial lesions and glands in deeper regions.
Conclusions:
The preliminary results suggest that sLSM may have the potential for rapidly examining the freshly-excised tissue ex vivo or intact tissue in vivo at microscopic resolution. Further optimization and performance evaluation of the sLSM technology will be needed in the future.
Keywords: light sheet microscopy, intact tissue imaging, scattering-based microscopy
INTRODUCTION
Optical microscopy technologies have the potential to improve disease diagnosis and treatment in various clinical applications. In vivo microscopy of the human tissue can visualize cellular morphologic changes associated with the disease without having to excise the tissue for the standard histopathologic analysis. Ex vivo microscopy of the surgical tissue can be used to assess the margin status with no or minimal tissue preparation, which could facilitate complete removal of the malignant tissue within a short procedural time.
Reflectance confocal microscopy (RCM) and optical coherence microscopy (OCT) are two optical microscopy methods widely tested for imaging intact tissues in vivo and ex vivo. RCM uses a pinhole gating method to reject the out-of-focus signal to provide a clear microscopy image from a thin section of the tissue [1]. The typical lateral resolution and axial resolution by commercial RCM devices are 1 and 5 μm, respectively and imaging depth is typically around 100–200 μm. However, the image size is generally small, approximately 500–750 μm. Each image is obtained en face from a particular depth. The tissue structure changes as a function of the depth, and acquisition of multiple RCM images while axially scanning the imaging plane is often required. OCT provides cross-sectional images of the tissue with a larger field of view (FOV), approximately 2–3 mm, and deeper penetration depth, approximately a few millimeters [2,3]. OCT, however, has a moderate lateral resolution of 10–20 μm, which is sufficient for visualizing the architectural details of the tissue but might be limited in examining cellular morphologies. Recently, high-resolution OCT devices have been reported, providing a lateral and axial resolution of 1–2 μm [4,5]. Although these high-resolution OCT technologies could provide cellular images with high resolution in a cross-sectional manner, the high axial resolution requires the use of a broadband coherent light source, typically a super-continuum laser, which increases the cost and complexity of the imaging system.
Light-sheet microscopy (LSM) is an optical microscopy technique that has been widely used in basic life science research [6,7]. In LSM, the illumination is confined to a thin light sheet that is conjugate to the imaging sensor [8]. Similar to confocal microscopy, the confined illumination and conjugate detection provide optical sectioning capability and clear microscopy images can be obtained from the thin illumination light sheet. The illumination light sheet can be configured oblique, 45° to the tissue surface, to image the tangential plane of the superficial region of a thick tissue [9,10]. Although most LSM devices used fluorescence contrast with exogenous fluorescence agents, LSM can also be used to detect the intrinsic fluorescence signal from the unstained tissue [11–13]. Scattering is another contrast mechanism that can visualize cellular morphologic details that are not readily observable with the intrinsic fluorescence. In previous studies, scattering-based microscopy devices were shown to visualize characteristic cellular morphologic changes associated with various diseases [14–17]. Scattering-based LSM was previously demonstrated to image plant roots in transparent soil and gel [18]. Although shown promising in examining overall interaction between the root and soil, the scattering-based LSM has not been yet demonstrated for visualizing microscopic morphologies of human or animal tissues. In this paper, we report the development of the scattering-based LSM (sLSM) device and its preliminary use for cellular imaging of fresh tissues. Images of excised animal tissues obtained with the sLSM device are presented. Quantitative analysis of the image contrast as a function of the imaging depth is presented. Potentials and challenges of the sLSM approach are discussed.
MATERIALS AND METHODS
A schematic of the sLSM device is shown in Figure 1. The illumination and detection optics were configured at 45° relative to the tissue plane and 90° between each other (Fig. 1a). Light from a superluminescent LED (sLED; IPSDD0808–3113; Inphenix (Livermore, CA); central wavelength = 834 nm; bandwidth = 44 nm) was coupled to the illumination optics using a single-mode fiber and collimated by a collimation lens (f = 18.45 mm). The sLED with a relatively large bandwidth was used instead of a laser diode with a narrow bandwidth to reduce the speckle noise. The collimated beam passed through a rectangular aperture and was focused by a cylindrical lens (f = 13.7 mm) and objective lens (N10XW-PF; Nikon (Japan); f = 20 mm; NA = 0.3; water immersion) onto the tissue. The aperture width along the x-axis, 1.7 mm, in conjunction with the cylindrical and objective lens generated an illumination width on the tissue over 2.5 mm (top view in Fig. 1b). The collimated beam before the aperture had a Gaussian diameter of 4.1 mm. Use of the 1.7 mm aperture width generated the intensity variation of 52% over the 2.5 mm illumination. The aperture width along the z-axis was set as 2.5 mm, which resulted in an effective illumination NA of 0.0625 (side view in Fig. 1b) to provide the theoretical light sheet thickness of 6.8 μm (lateral full width half maximum [FWHM] of the focused beam) and depth of focus (DOF) of 284 μm.
Fig. 1.
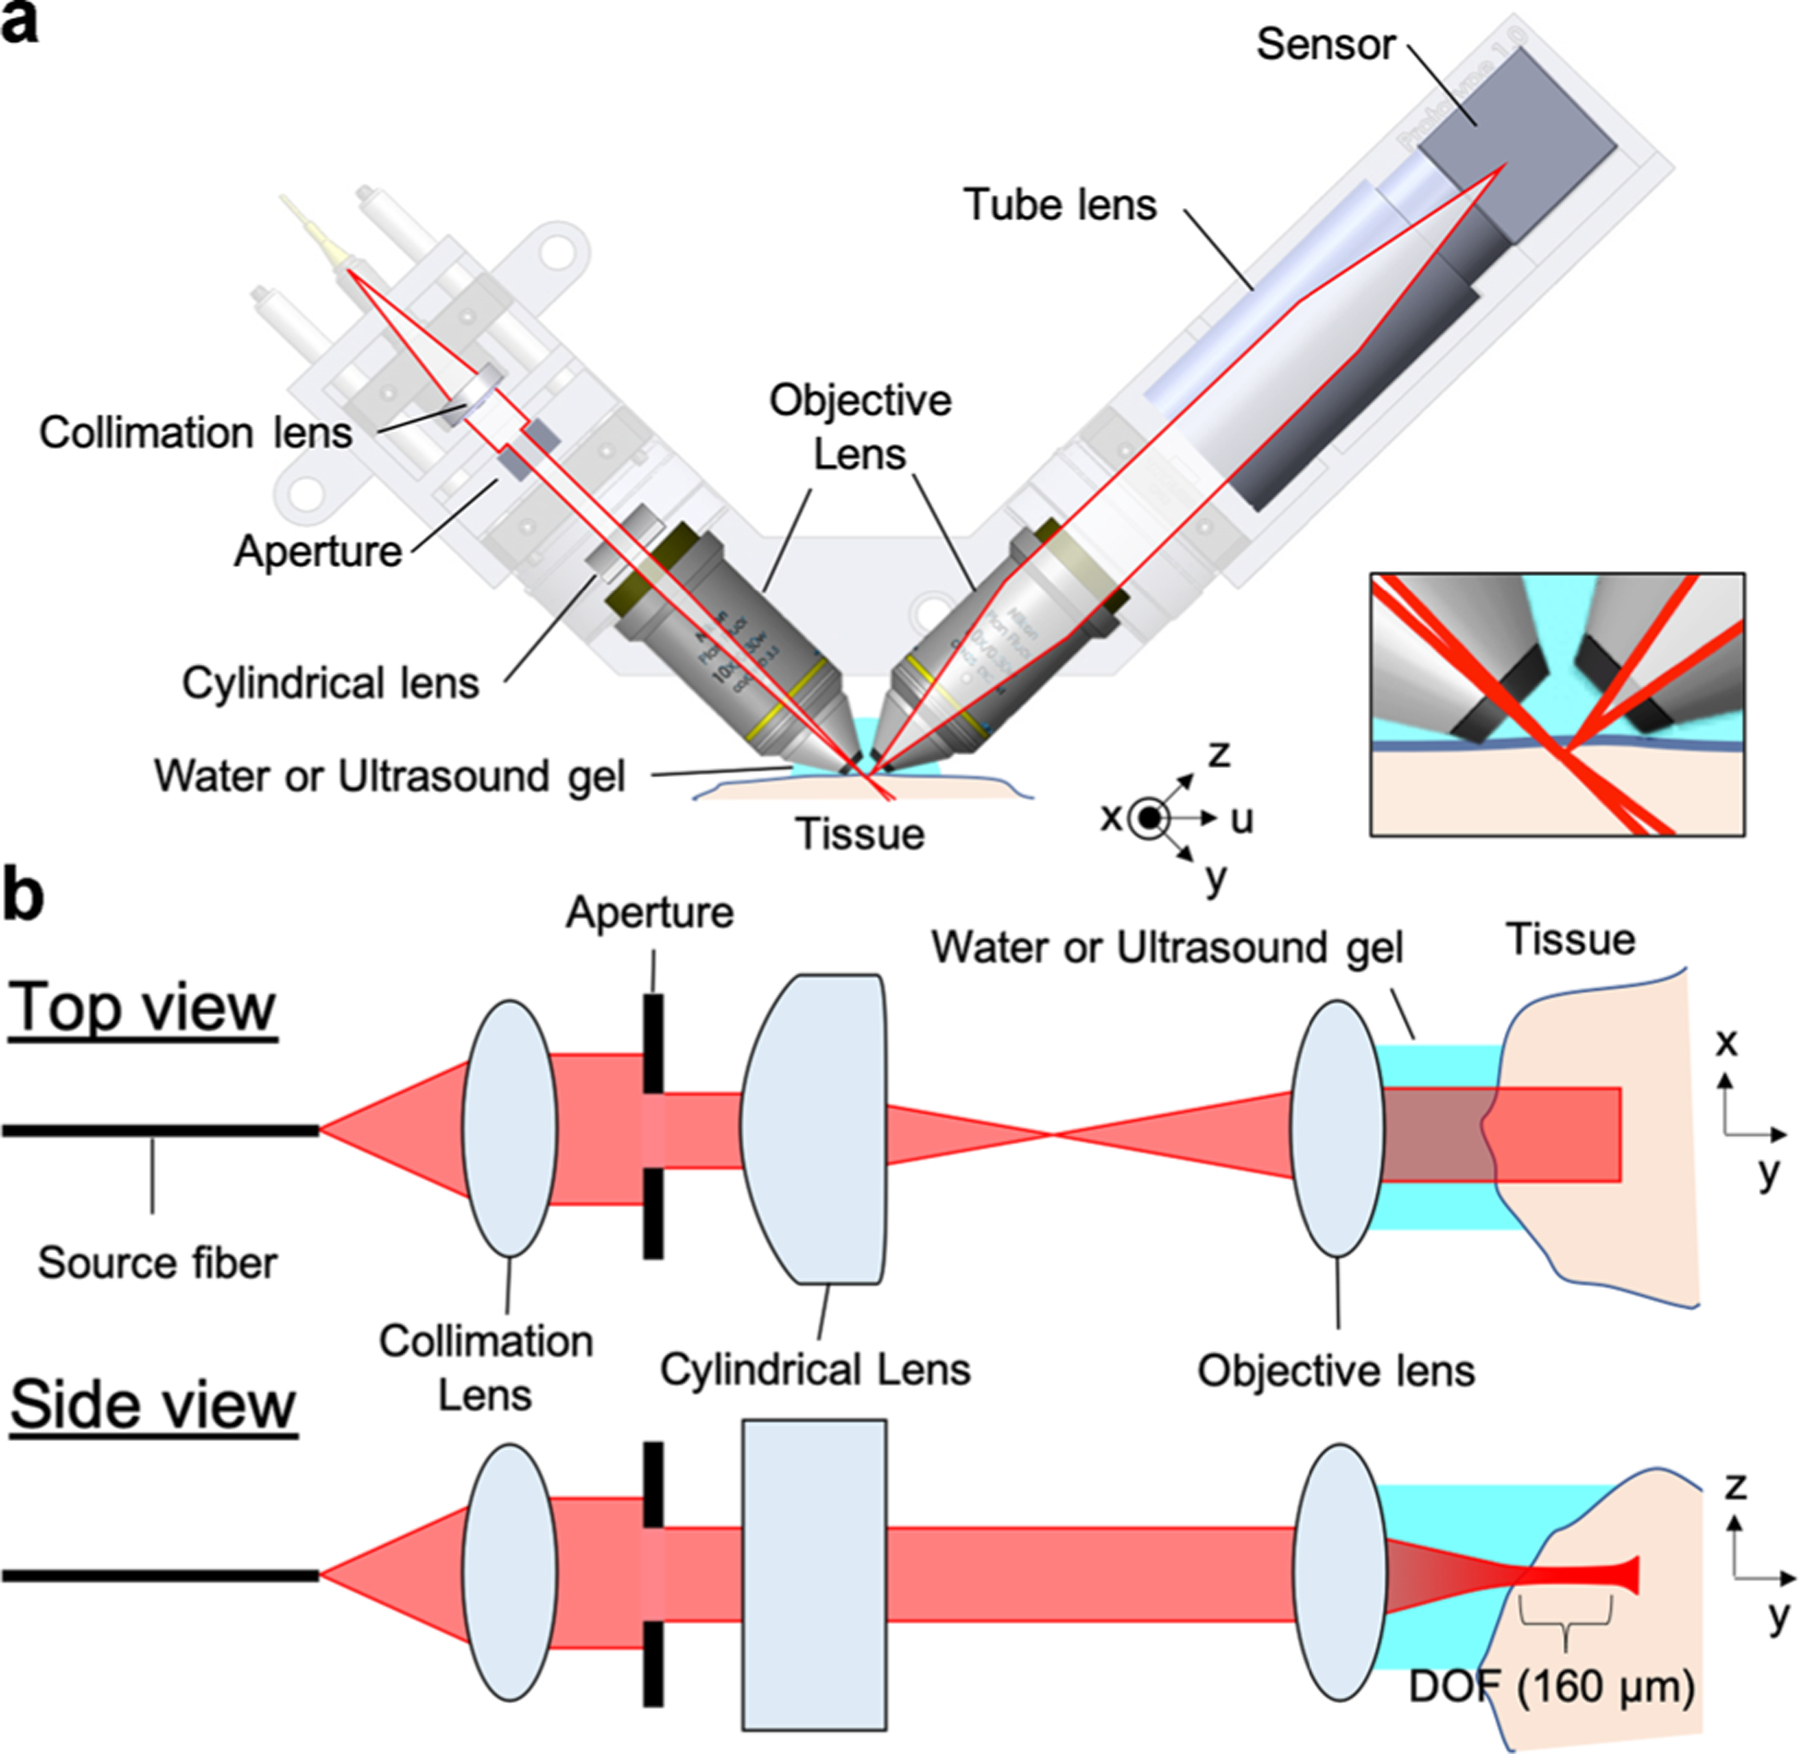
Schematic of scattering-based light sheet microscope (sLSM) (a) and detailed beam path in the illumination optics (b). Inset in (a)—detailed view of the illumination and detection beam paths around the tissue.
Light scattered from the tissue was captured by a second water-immersion objective lens (N10XW-PF; Nikon; f = 20 mm; NA = 0.3; water immersion) and focused by a camera lens (f = 50 mm) onto a monochromatic complementary metal–oxide–semiconductor (CMOS) sensor (acA4024–29um; Basler (Germany); 4,024 × 3,036 pixels; pixel size = 1.85 μm). The expected resolution of the detection optics with the given detection NA and wavelength was 1.4 μm and DOF 12.3 μm. The magnification of 2.5 between the tissue plane and CMOS sensor made the pixel size on the tissue plane as 0.74 μm. The horizontal axis of the acquired image corresponded to the x-axis denoted in Figure 1a and the vertical axis to the y-axis (also the optical axis of the illumination optics).
Theoretical resolution was evaluated in a Matlab (Mathworks, Natick, MA) code that used the Born-Wolf model [19] for simulating the focused beam profile. The illumination and detection pupils were assumed to have a uniform intensity distribution. For the illumination light sheet intensity profile, the point-spread function (PSF) for the NA of 0.0625 was first calculated and then convoluted with a line along the x-axis. A cross-section of the illumination light sheet on the yz-plane is shown in Figure 2. The detection PSF was calculated with the NA of 0.3. The illumination intensity and detection PSF were multiplied to generate the effective sLSM PSF. A magnified view of the sLSM PSF (inset, Fig. 2) shows that the PSF is elongated more along the z-axis than y-axis. Although the lateral resolution (along the y-axis) stayed constant regardless of the y position on the FOV, the axial resolution (along the z-axis) varied due to the light sheet thickness change. Figure 3 shows the theoretical FWHM of the light sheet thickness (dashed line) at each y position. Within the DOF of 284 μm, the theoretical FWHM was thinner than 7.0 μm, with which axial resolution scattering-based cellular imaging was shown feasible [20].
Fig. 2.
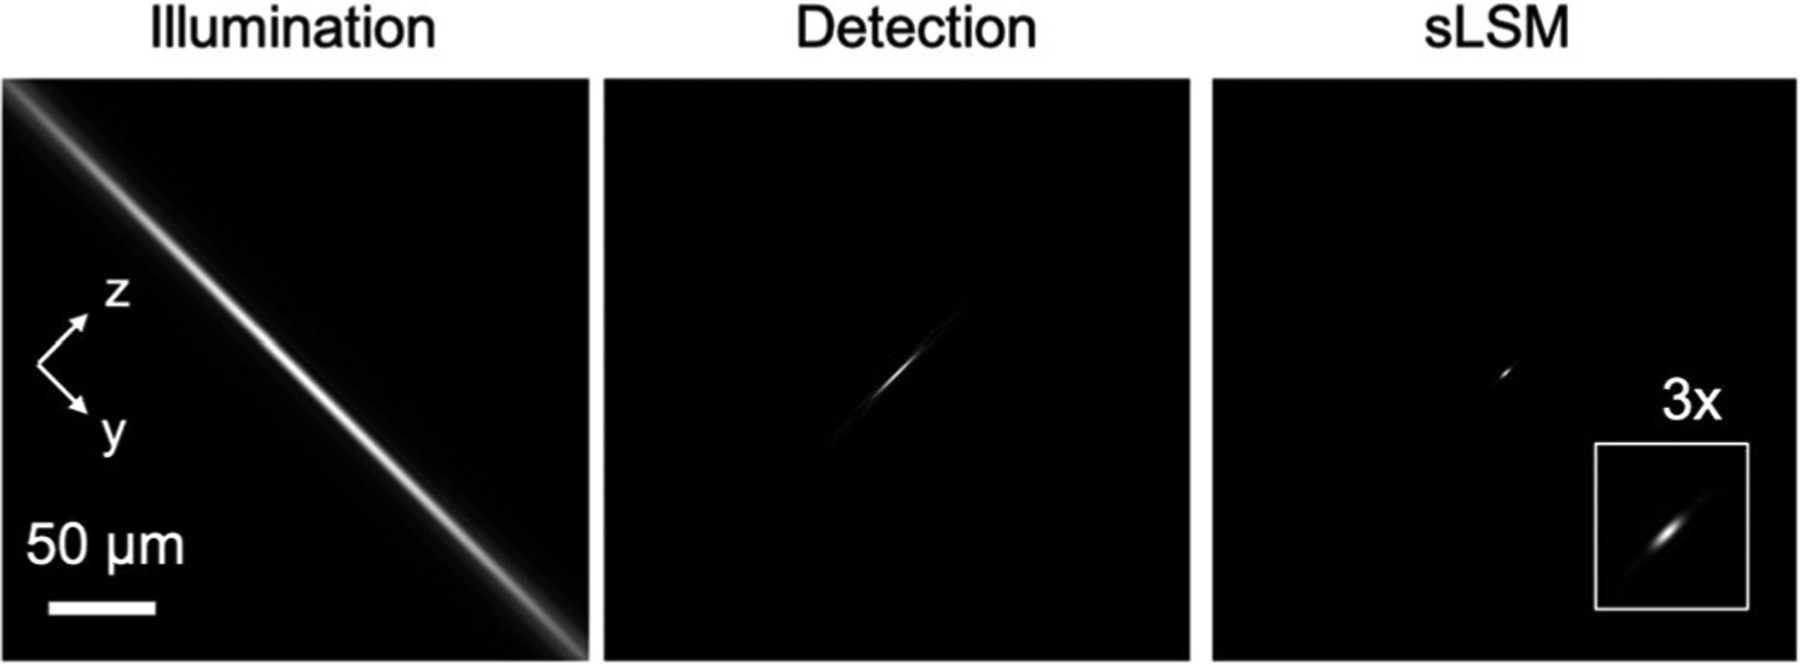
Simulation of the illumination light sheet intensity distribution, detection PSF, and effective sLSM PSF. PSF, point-spread function; sLSM, scattering-based light sheet microscope.
Fig. 3.
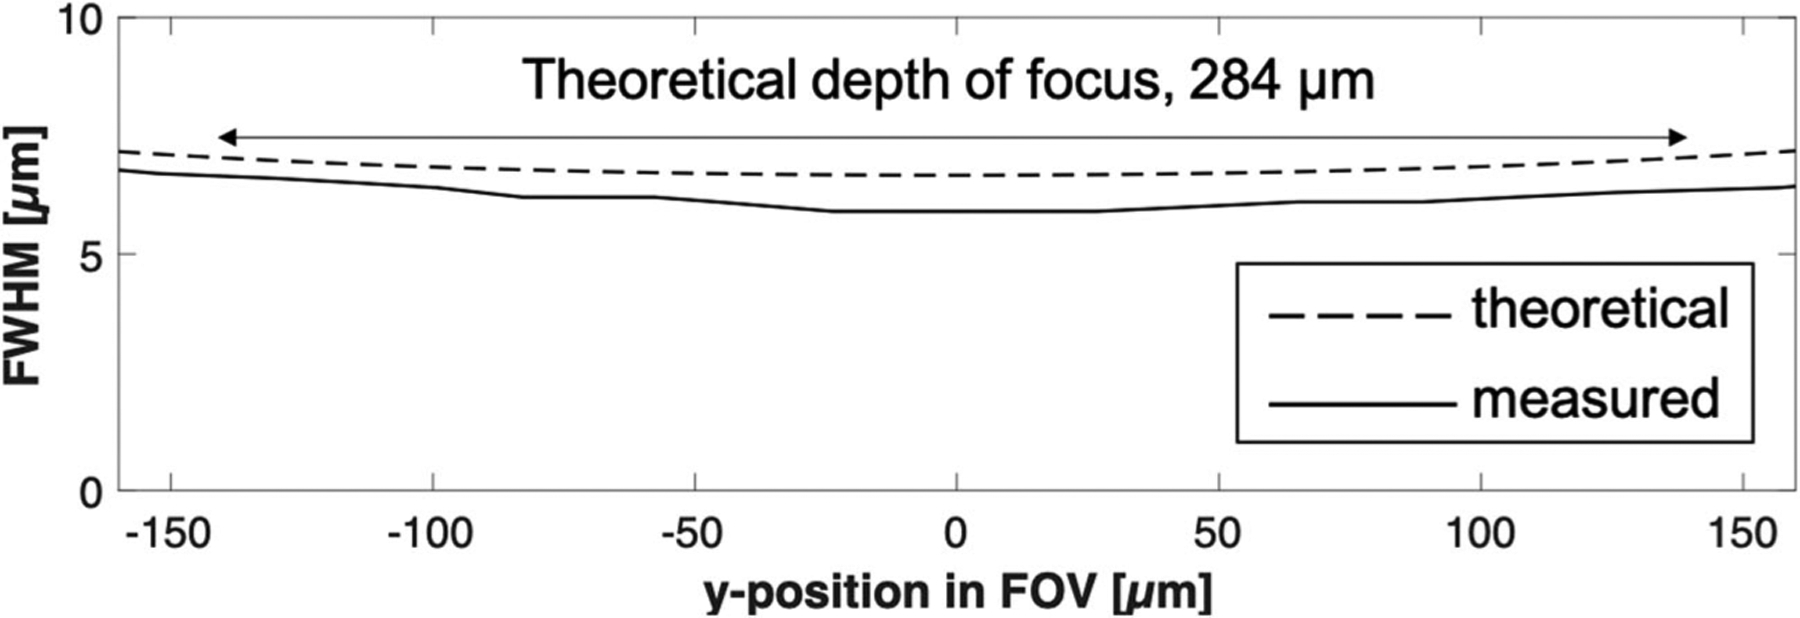
Theoretical and measured light sheet thicknesses as a function of the y position in the field of view. FWHM, full width half maximum
Optical performance of the LSM device was experimentally evaluated. First, the light sheet thickness was measured by imaging a mirror while positioning the mirror reflection in various y positions in the FOV. The light sheet thickness was defined as the FWHM of the intensity profile. Second, the lateral resolution of the detection optics was evaluated by imaging a United States Air Force (USAF) resolution target. FWHM of the line-spread function (LSF) was calculated.
Tissue imaging performance was evaluated by imaging excised animal tissues. The illumination power on the tissue was kept at 0.9 mW. The exposure time of the CMOS sensor was adjusted between 2 and 9 milliseconds depending on the tissue reflectivity. The imaging speed was kept at 30 frames/s and the image data was transferred to a laptop over a USB 3.0 cable. In all sLSM images presented except Figure 8h, the horizontal axis of the image corresponds to the x-axis in Figure 1 and the vertical axis to the y-axis. Ultrasound gel was placed between the sLSM device and tissue as the immersion medium. Freshly-excised swine kidney and duodenum tissues were gently cleaned with water and imaged. The swine tissue was translated at the imaging speed of 0.75 mm/s along the u-axis in Figure 1a, resulting in the 25 μm displacement between frames. Under-sampling along the u-axis was conducted to demonstrate rapid examination of a large tissue area (e.g., 2.5 mm × 3 mm) within a short procedural time (e.g., 4 seconds).
Fig. 8.
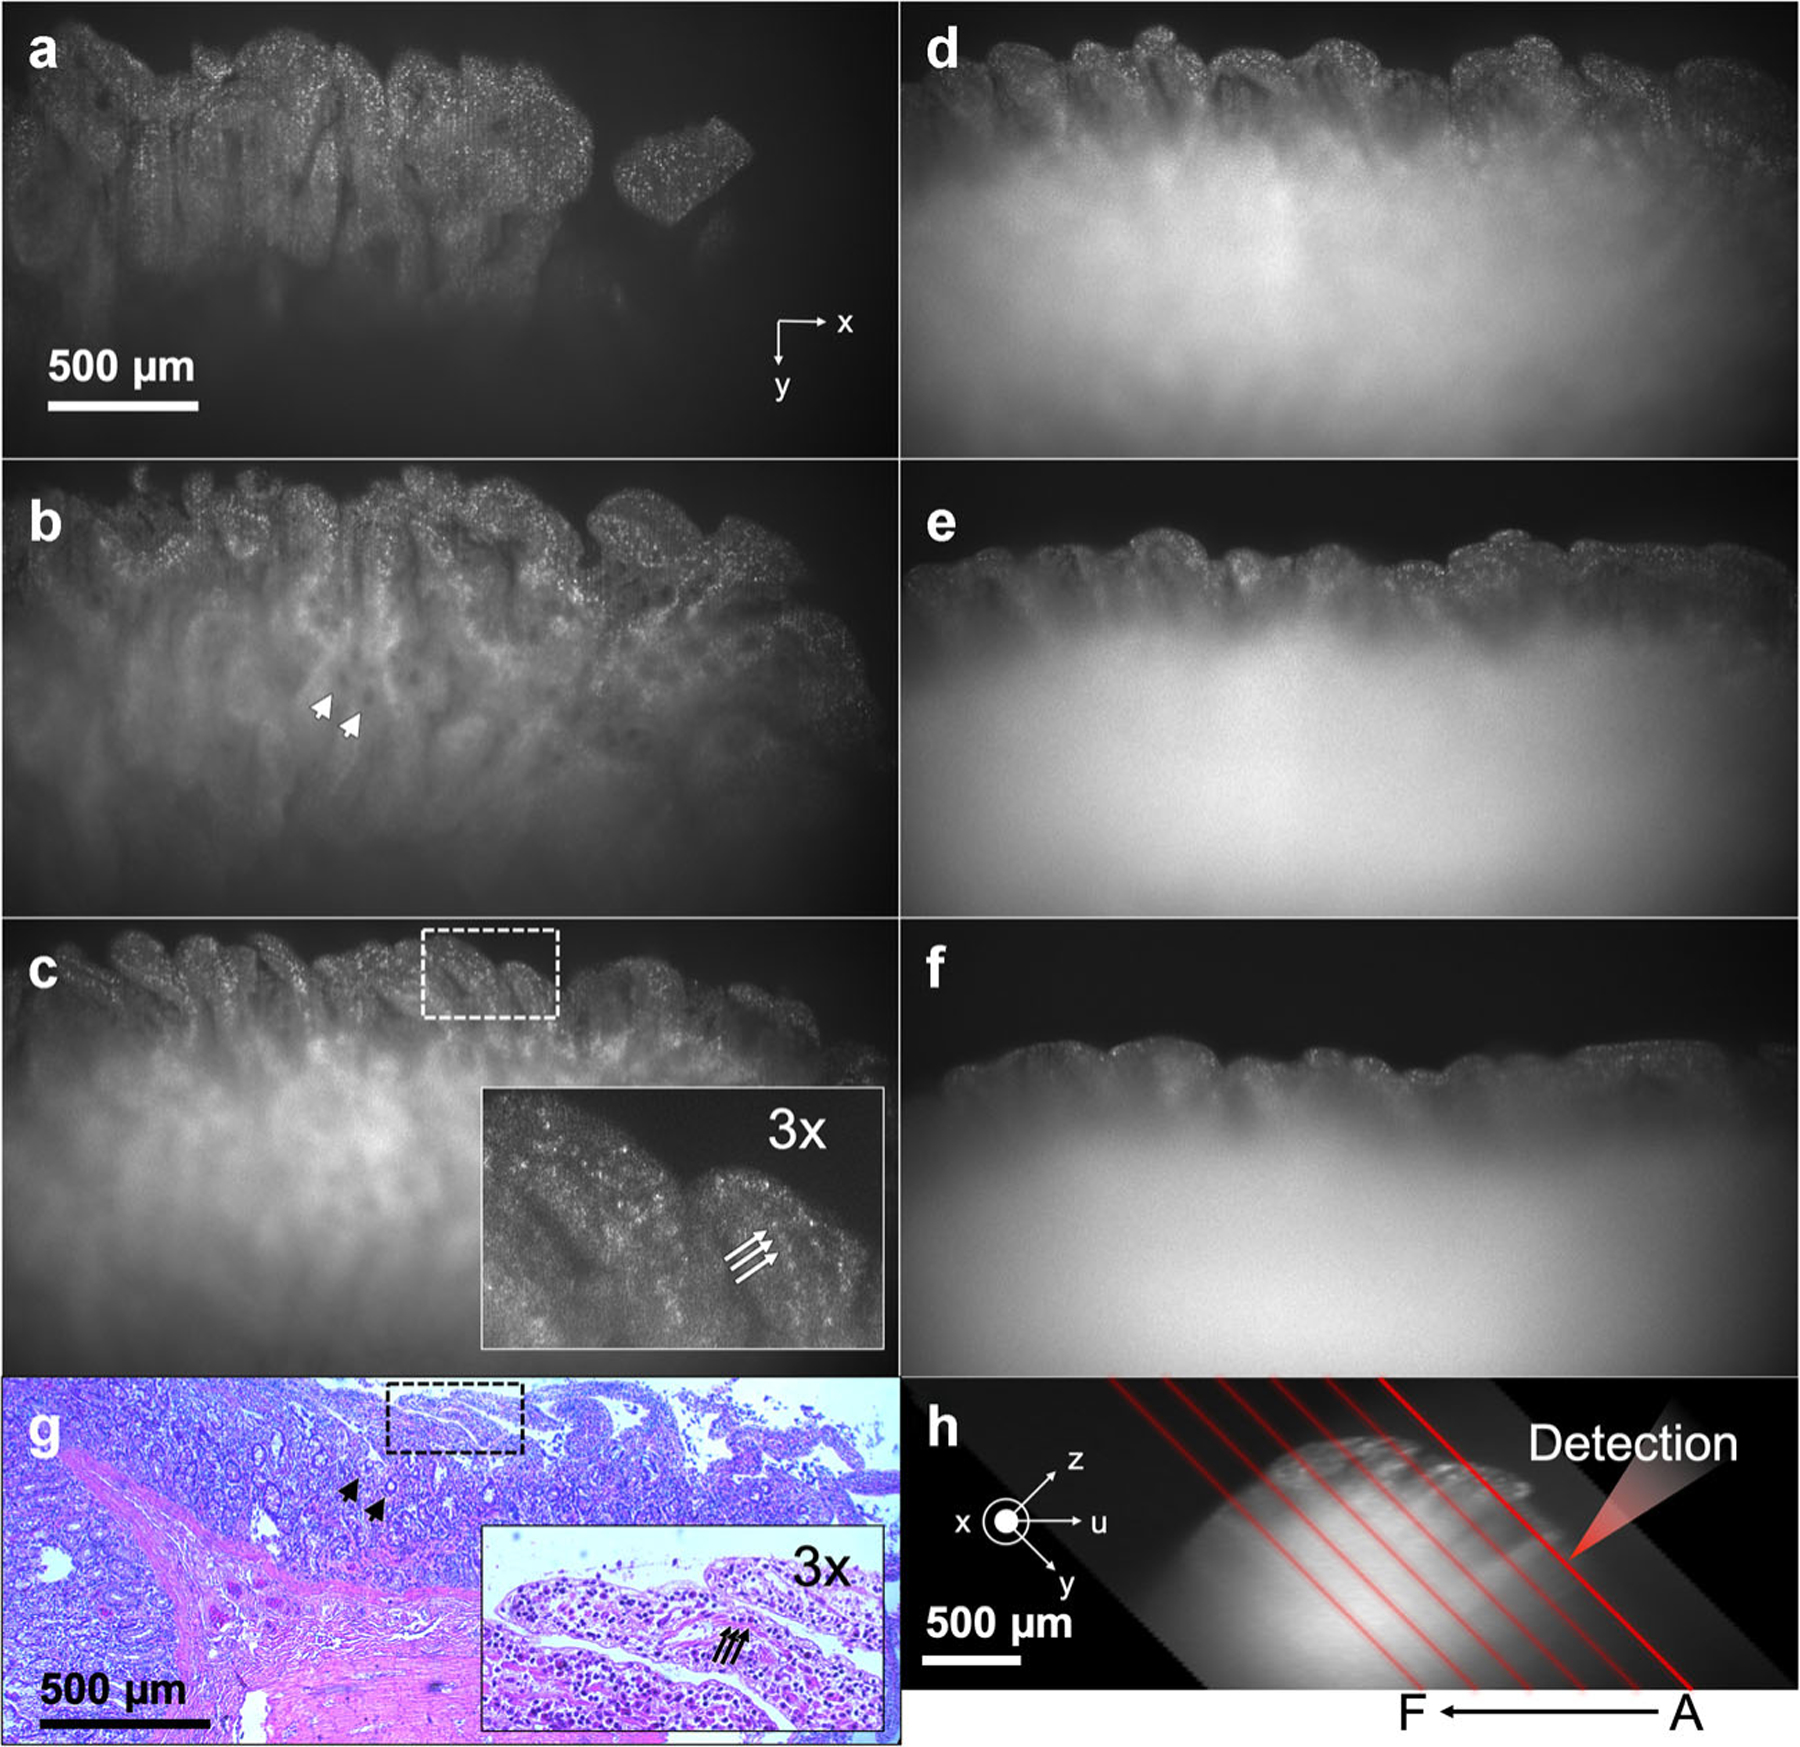
sLSM and histologic images of the excised swine duodenum tissue. (a–f) sLSM images at six different locations as depicted in (h); (g) H&E-stained slide image; and (h) cross-sectional image of the tissue. Arrow, cell nucleus; arrowhead, gland. H&E, hematoxylin and eosin; sLSM, scattering-based light sheet microscope.
The image contrast was quantitatively analyzed. A flowchart of the image contrast calculation is shown in Figure 4. For each sLSM image with 4,024 (x) × 3,036 (y) pixels, the central 50% of the image was segmented into 10 strips with each strip being 201 (x) × 3,036 (y) pixels. For each strip, the average and standard deviation of the intensity profile along the x-axis at a given y position was calculated. The contrast at the y position was then calculated by dividing the standard deviation by the average. This resulted in a contrast curve as a function of the y position for each strip. The contrast curve was shifted along the y-axis to locate the tissue surface at the center of the y range. The 10 contrast curves were then averaged to generate a representative contrast curve for each image. This process was repeated for the remaining images in the data set. The average and standard deviation of the contrast curves for the entire data set was analyzed.
Fig. 4.

Flowchart of the image contrast calculation.
For images of swine duodenum, we quantitatively evaluated the height of visible villi. The villus height was measured as the difference between the tissue surface and the deepest tissue depth that visualized epithelial cell nuclei. Epithelial cell nuclei were automatically identified using a custom Matlab code: (i) each image was Gaussian blurred with an average cell nuclear diameter, 3.7 μm, to reduce speckle noise, (ii) background image was generated by applying Gaussian blur with 11 μm, (iii) the speckle-reduced image was subtracted by the background image to highlight cell nuclei, and (iv) the resulting image was binarized to identify cell nuclei. Villus height was calculated for each of the 10 strips, and average and standard deviation of the 10 villus height values were calculated for each image.
RESULTS
The measured light sheet thickness is shown as the solid line in Figure 3. At the center of the imaging FOV, the light sheet thickness was measured to be 5.9 μm (Fig. 3). Within the theoretical DOF of 284 μm, the light sheet maintained a thickness of 6.7 μm or less. The discrepancy between the measured and theoretical values was likely caused by the actual aperture dimension being slightly larger than the design dimension.
A representative image of the USAF resolution target is shown in Figure 5. The line pattern in the group 8, element 4 (line width = 1.38 μm) was clearly distinguished along the x-axis. The same line pattern was not resolved along the y-axis due to the 45° detection angle relative to the sample, which decreased the effective line width of the sample by a factor of 1.4 and made the pattern harder to distinguish. The FWHM of the LSF was measured to be 1.83 ± 0.15 μm.
Fig. 5.
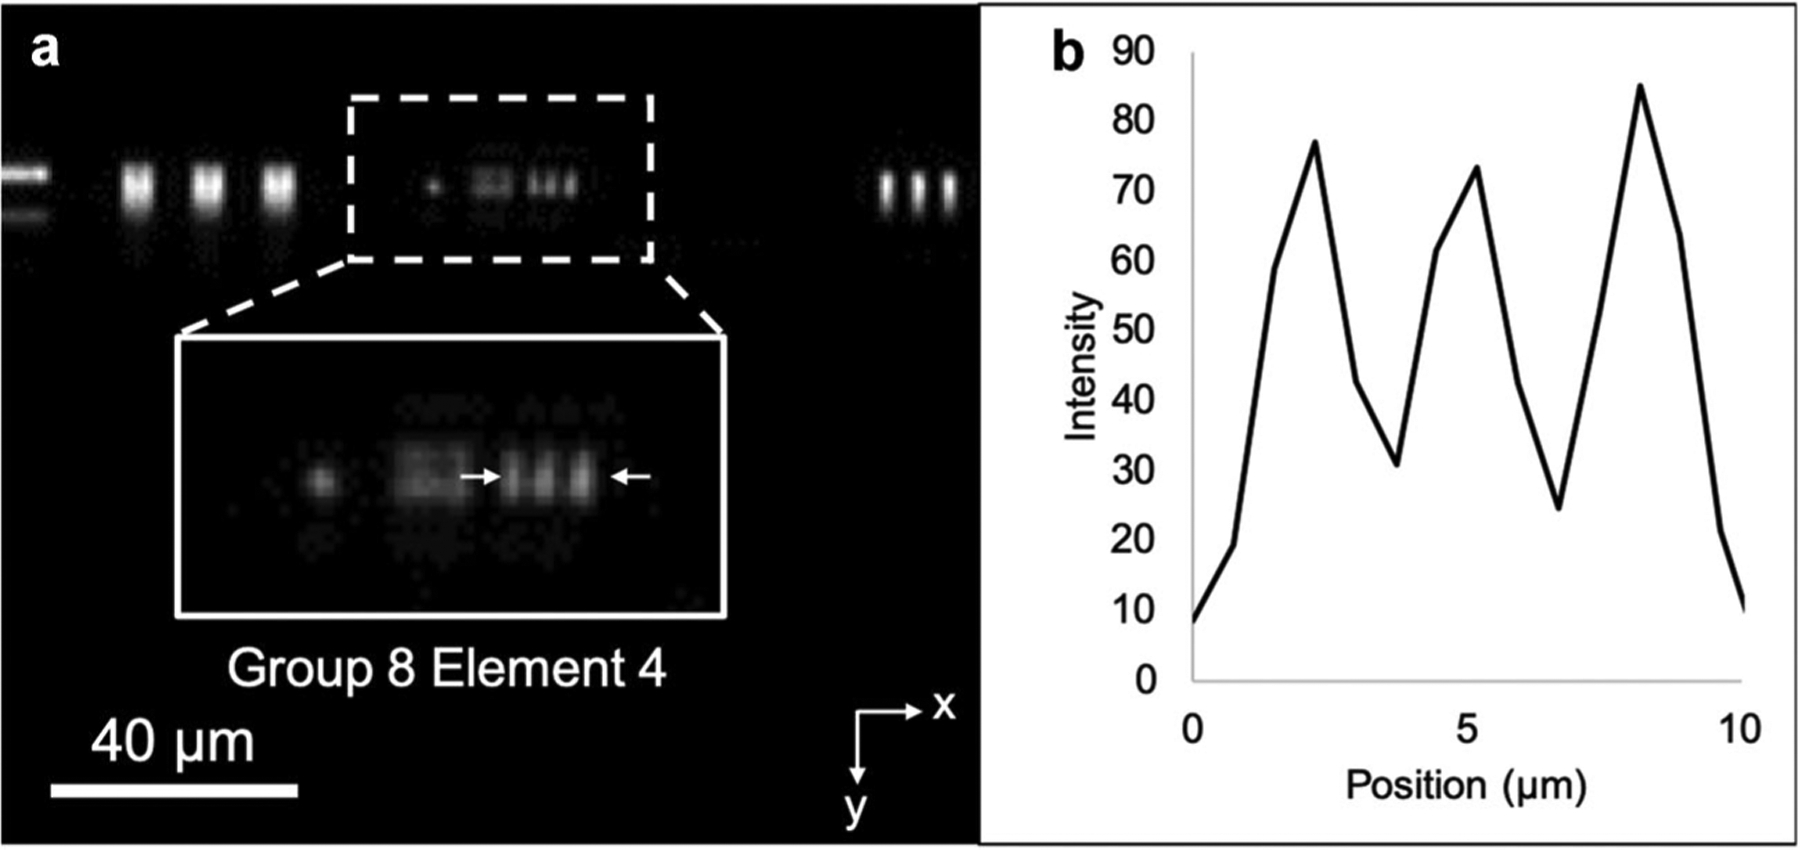
sLSM image of the USAF target (a) and the intensity profile along the line pattern at the group 8, element 4 (b). sLSM, scattering-based light sheet microscope; USAF, United States Air Force.
Figure 6 shows the sLSM and histology images of the excised swine kidney tissue. The low-magnification image (Fig. 6a) reveals the lobular structure of the tissue. A magnified view (Fig. 6b) revealed two different types of tubular structures, circular tubules (arrows) and elongated tubules (arrowheads), which had similar sizes and shapes to the proximal (arrows) and distal (arrowheads) tubules in the histologic image obtained from the same tissue (Fig. 6c).
Fig. 6.

sLSM and histologic images of the excised swine kidney tissue. (a) Low-magnification sLSM image; (b) magnified view of the dotted box in (a); and (c) H&E-stained slide image. Arrow, proximal tubule; arrowhead, distal tubule. H&E, hematoxylin and eosin; sLSM, scattering-based light sheet microscope.
The image contrast was plotted as a function of the imaging depth along the y-axis (Fig. 7). The solid line shows the average curve of 120 images and the gray areas the standard deviation. The standard deviation was small because the tissue surface was mostly flat and all the images visualized similar tissue structures. The maximum contrast was 0.39, achieved around the tissue surface. The image contrast decreased as a function of the imaging depth mainly due to the increase of the light sheet thickness and light scattering in the tissue. From the qualitative visual assessment of the images, the cellular morphologic details were observed up to the imaging depth of ~200 μm (Fig. 6b), at which imaging depth the image contrast was approximately 0.12.
Fig. 7.
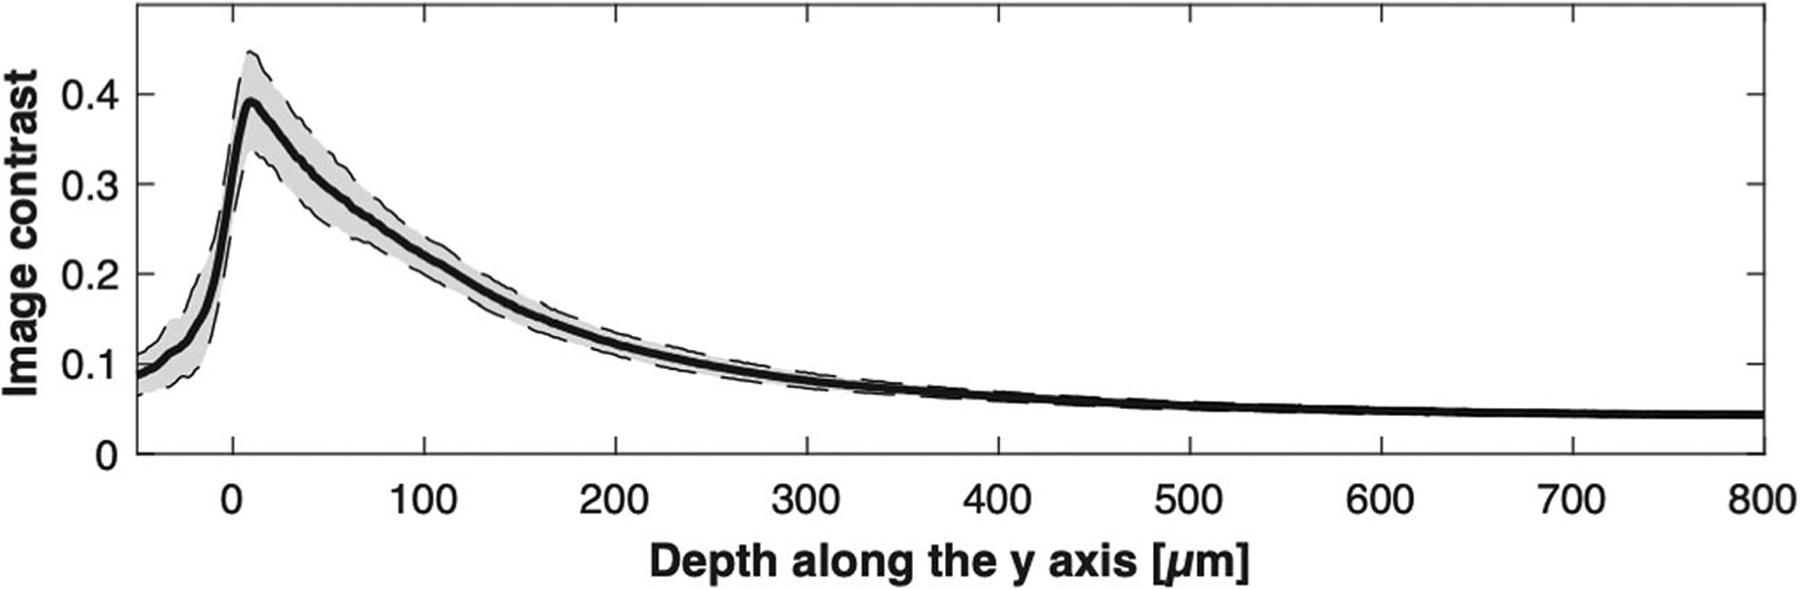
Contrast as a function of the depth along the y-axis for the swine kidney images. Solid line, average of contrast curves for the 120 images; dotted lines, standard deviation.
sLSM and histologic images of the swine duodenum ex vivo are shown in Figure 8. Six sLSM images are shown with each image 275 μm translated along the negative u-axis from the previous image. Location of the light sheet for each image relative to the tissue cross-sectional profile is shown in Figure 8h. The imaging depth for the detection optics was the shallowest in Figure 8a among the six images. In Figure 8a, the sLSM image visualizes the finger-like villi architecture of the duodenum with numerous bright scattered dots. Figure 8b and c also visualize the villi architecture with bright dots in a similar manner to the histology image of the same tissue (Fig. 8g). The image contrast of Figure 8b and c, however, degrades as the imaging depth increases. Dark holes (arrowheads in Fig. 8b) are visible in the deeper region of the tissue, likely due to the lack of scattering signal at the opening of the gland (arrowheads in Fig. 8g). Bright dots shown in a magnified view of the sLSM image (inset, Fig. 8c) appear to have similar size and spacing as the cell nuclei shown in a magnified histologic image (inset, Fig. 8g). In Figure 8d and e, the villi structure is visible, but the range of y that provides good image contrast is reduced significantly. In Figure 8f, even the superficial part of the image has limitations in visualizing the villi architecture.
The image contrast curves for the six images shown in Figure 8 are presented together (Fig. 9a). As the imaging location changed from A to F (Fig. 8h), the imaging depth range that provided higher than 0.12 contrast decreased, from 651 to 78 μm. This trend can be explained by the increased tissue thickness for the detection path as the imaging location changed from A to F. The imaging depth range that achieved the 0.12 contrast or higher was similar to the imaging depth range that provided visible cellular morphologies per the qualitative assessment of each image. Average and standard deviation of the contrast for 60 images are shown in Figure 9b. The image contrast had more variations between images when compared with the swine kidney data set (Fig. 7). The maximum contrast was 0.31, and higher than 0.12 contrast was achieved up to the imaging depth range of 224 μm. Figure 10 shows the height of visible villi for each image shown in Figure 8. The measured villus height varied from 47 to 455 μm. Capability to visualize this range of villus height can be beneficial in certain applications, including examination of villus atrophy associated with celiac disease as shown in a previous OCT study [21].
Fig. 9.

Contrast as a function of the depth along the y-axis for the swine duodenum images. (a) Contrast curves for the six images shown in Figure 8a–f (b) Average and standard deviation of contrast curves for the 60 images
Fig. 10.
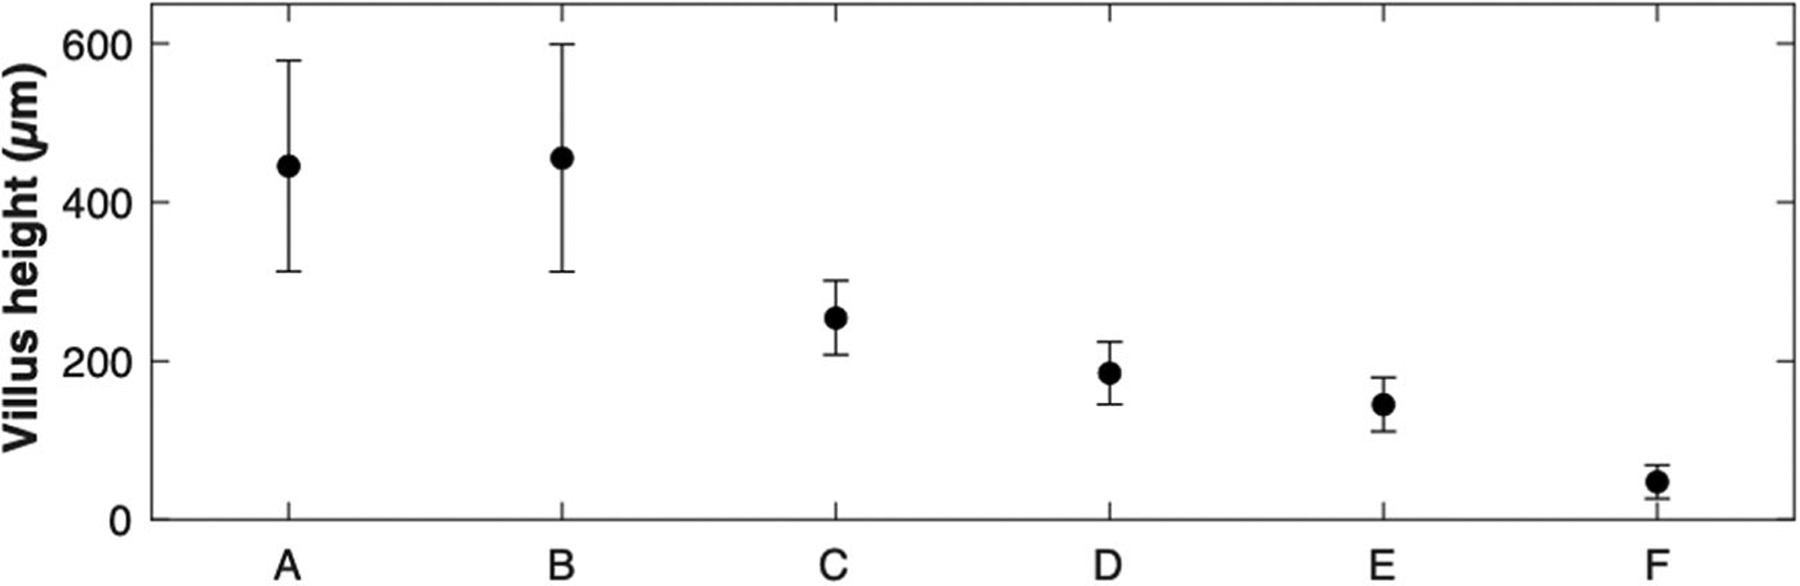
Hight of visible villi in each image shown in Fig. 8. Standard deviation is shown as error bars.
DISCUSSION
In summary, we have developed a sLSM. Preliminary images obtained from swine tissues visualized cellular morphologic details up to the illumination depth of ~200 μm. As inexpensive components such as low-NA objective lenses, a consumer-grade CMOS sensor, and a sLED are used, the sLSM device can be made at a low cost. The current material cost was approximately $7,000. Notably, the current sLED source (cost = ~$2,800) can be easily replaced by an inexpensive sLED with similar specifications (e.g., EXS210040–01; Exalos; cost = ~$370). By using miniature objective lenses with the NA of 0.3, the device size, weight, and cost can be further reduced. As the tissue can be imaged without any preparations (e.g., fluorescent dye staining, incubation, and washing), sLSM imaging can be conducted immediately after the tissue excision or directly on the human patient in vivo.
Preliminary results of visualizing tubules, villi, and cell nuclei from the animal kidney and duodenum tissues might show promises in imaging other organs from human subjects. A potential clinical application is the imaging of Barrett’s esophagus, where the normal squamous mucosa is replaced by a villi architecture and further dysplastic changes involve irregularly-shaped glands and loss of nuclear polarity [14]. sLSM might be also useable for imaging cervical and oral lesions, where cellular morphology (e.g., cell-to-cell distance, cell nuclear size) plays an important role in differentiating between normal/benign and malignant tissues [15,22]. Skin lesions can be imaged with sLSM to examine changes in keratinocyte shape and size, thickening of epidermis, and presence of tumor nest [23–25]. Some of the in vivo imaging applications will require translation of the sLSM technology into an endoscopic device, which can be realized using miniature objective lenses [26] and compact cameras [27,28]. For each clinical application, we will first image normal and diseased human tissues ex vivo with the sLSM device and evaluate the diagnostic accuracy in comparison with the standard histopathology as the gold standard.
The swine duodenum imaging results revealed both the potentials and challenges of the sLSM approach. When the light sheet is approximately parallel to and close to tissue surface (Fig. 8a), the tissue thickness that the detection optics has to image through became shallow and the image revealed the cellular details (bright dots) over a large illumination depth. This could imply that if the cellular morphology around the superficial tissue region is of importance, the light sheet can be oriented more parallel to the tissue surface and the detection optical axis more perpendicular to the tissue surface. This illumination and detection condition can be achieved by using a fold mirror in the illumination beam path and orienting the detection optics more normal to the tissue surface. When the detection optics needed to image through a thick tissue as shown in Figure 8f (nominal tissue thickness for the detection path = ~1.4 mm), the image did not reveal any cellular details even in the superficial region. This reveals the challenge in imaging tissues with an unknown surface profile. When the overall tissue surface is flat as was the case for the swine kidney tissue, however, the images showed a similar cellular contrast trend regardless of the lateral imaging location on the tissue surface (Fig. 7). A coverslip made of a material with a close refractive index to water (e.g., fluorinated ethylene propylene, FEP) can be gently placed on the tissue surface to flatten the tissue surface and achieve more consistent tissue imaging performance.
Even when the tissue surface is flat (Fig. 6), however, the image contrast changes as a function of the y position. Although this can be useful in examining cellular details for superficial regions and architectural structures in deeper regions in one image (e.g., Fig. 8b), the change of contrast can pose challenges in interpreting the image. sLSM images of various tissues can be analyzed in comparison with the corresponding histology to establish effective imaging depth for each tissue type. This information can be used to display the image only over the imaging depth that has been validated to have sufficient cellular contrast.
In our sLSM device, two low-NA (0.3) objective lenses were used. The relatively long focal distance of the low-NA objective lens, f = 20 mm, provided a large FOV, ~2.5 mm, when compared with the previous LSM devices that use a single, high-NA objective lens and oblique light sheet illumination [29]. However, the two-objective approach requires careful alignment of the illumination light sheet and detection focal plane. In addition, the refractive index mismatch between the immersion medium and tissue might degrade the colocalization of the illumination light sheet and detection focal plane.
In future, we will improve the image quality through the following approaches: We will further reduce the speckle noise using the angular-diverse illumination [30] or implementing the moving diffuser [31,32], which will help analyze the cellular details. Although the imaging depth demonstrated in this preliminary study, ~200 μm, might be sufficient for examining the epithelial layer, where many of the disease-associated cellular changes are present, a larger imaging depth will be desirable for imaging deeper regions. We will explore the rapid scanning of the point illumination to improve the imaging depth in scattering tissues [11,33–35]. Finally, we will develop a miniature, handheld sLSM device and test the device for various ex vivo and in vivo imaging applications.
ACKNOWLEDGMENTS
Research reported in this publication was supported by the National Cancer Institute of the National Institutes of Health under award number P30CA023074.
Footnotes
Conflict of Interest Disclosures: All authors have completed and submitted the ICMJE Form for Disclosure of Potential Conflicts of Interest and none were reported.
REFERENCES
- 1.Rajadhyaksha M, Marghoob A, Rossi A, Halpern AC, Nehal KS. Reflectance confocal microscopy of skin in vivo: From bench to bedside. Lasers Surg Med 2017;49(1):7–19. [DOI] [PMC free article] [PubMed] [Google Scholar]
- 2.Leitgeb R. En face optical coherence tomography: A technology review. Biomed Opt Express 2019;10(5):2177–2201. [DOI] [PMC free article] [PubMed] [Google Scholar]
- 3.Drexler W, Liu M, Kumar A, Kamali T, Unterhuber A, Leitgeb RA. Optical coherence tomography today: Speed, contrast, and multimodality. J Biomed Opt 2014;19(7):071412. [DOI] [PubMed] [Google Scholar]
- 4.Dubois A, Levecq O, Azimani H, et al. Line-field confocal optical coherence tomography for high-resolution noninvasive imaging of skin tumors. J Biomed Opt 2018;23(10):106007. [DOI] [PubMed] [Google Scholar]
- 5.Liu L, Gardecki JA, Nadkarni SK, et al. Imaging the subcellular structure of human coronary atherosclerosis using micro–optical coherence tomography. Nat Med 2011;17(8):1010–1014. [DOI] [PMC free article] [PubMed] [Google Scholar]
- 6.Wu Y, Ghitani A, Christensen R, et al. Inverted selective plane illumination microscopy (iSPIM) enables coupled cell identity lineaging and neurodevelopmental imaging in Caenorhabditis elegans. Proc Natl Acad Sci 2011;108(43):17708–17713. [DOI] [PMC free article] [PubMed] [Google Scholar]
- 7.Chen B-C, Legant WR, Wang K, et al. Lattice light-sheet microscopy: Imaging molecules to embryos at high spatio-temporal resolution. Science 2014;346(6208):1257998. [DOI] [PMC free article] [PubMed] [Google Scholar]
- 8.Olarte OE, Andilla J, Gualda EJ, Loza-Alvarez P. Light-sheet microscopy: A tutorial. Adv Opt Photonics 2018;10(1):111–179. [Google Scholar]
- 9.Wang D, Meza D, Wang Y, Gao L, Liu JT. Sheet-scanned dual-axis confocal microscopy using Richardson–Lucy deconvolution. Opt Lett 2014;39(18):5431–5434. [DOI] [PMC free article] [PubMed] [Google Scholar]
- 10.Glaser AK, Reder NP, Chen Y, et al. Light-sheet microscopy for slide-free non-destructive pathology of large clinical specimens. Nat Biomed Eng 2017;1(7):0084. [DOI] [PMC free article] [PubMed] [Google Scholar]
- 11.Truong TV, Supatto W, Koos DS, Choi JM, Fraser SE. Deep and fast live imaging with two-photon scanned light-sheet microscopy. Nat Methods 2011;8(9):757–760. [DOI] [PubMed] [Google Scholar]
- 12.Packard RRS, Baek KI, Beebe T, et al. Automated segmentation of light-sheet fluorescent imaging to characterize experimental doxorubicin-induced cardiac injury and repair. Sci Rep 2017;7(1):8603. [DOI] [PMC free article] [PubMed] [Google Scholar]
- 13.Abadie S, Jardet C, Colombelli J, et al. 3D imaging of cleared human skin biopsies using light-sheet microscopy: A new way to visualize in-depth skin structure. Skin Res Technol 2018;24(2):294–303. [DOI] [PubMed] [Google Scholar]
- 14.Kang D, Suter MJ, Boudoux C, et al. Comprehensive imaging of gastroesophageal biopsy samples by spectrally encoded confocal microscopy. Gastrointest Endosc 2010;71(1):35–43. [DOI] [PMC free article] [PubMed] [Google Scholar]
- 15.Collier T, Guillaud M, Follen M, Malpica A, Richards-Kortum R. Real-time reflectance confocal microscopy: Comparison of two-dimensional images and three-dimensional image stacks for detection of cervical precancer. J Biomed Opt 2007;12(2): 024021–024027. [DOI] [PubMed] [Google Scholar]
- 16.Brachtel EF, Johnson NB, Huck AE, et al. Spectrally encoded confocal microscopy for diagnosing breast cancer in excision and margin specimens. Lab Invest 2016;96(4):459–467. [DOI] [PMC free article] [PubMed] [Google Scholar]
- 17.Evans JA, Poneros JM, Bouma BE, et al. Optical coherence tomography to identify intramucosal carcinoma and high-grade dysplasia in Barrett’s esophagus. Clin Gastroenterol Hepatol 2006;4(1):38–43. [DOI] [PMC free article] [PubMed] [Google Scholar]
- 18.Yang Z, Downie H, Rozbicki E, Dupuy LX, MacDonald MP. Light sheet tomography (LST) for in situ imaging of plant roots. Opt Express 2013;21(14):16239–16247. [DOI] [PubMed] [Google Scholar]
- 19.Born M, Wolf E. Principles of optics: Electromagnetic Theory of Propagation, Interference and Diffraction of Light. Cambridge University Press: Cambridge University Press; 1999. [Google Scholar]
- 20.Kang D, Do D, Ryu J, et al. A miniaturized, tethered, spectrally-encoded confocal endomicroscopy capsule. Lasers Surg Med 2019;51(5):452–458. [DOI] [PMC free article] [PubMed] [Google Scholar]
- 21.Masci E, Mangiavillano B, Albarello L, Mariani A, Doglioni C, Testoni PA. Pilot study on the correlation of optical coherence tomography with histology in celiac disease and normal subjects. J Gastroenterol Hepatol 2007;22(12):2256–2260. [DOI] [PubMed] [Google Scholar]
- 22.Muldoon TJ, Roblyer D, Williams MD, Stepanek VM, Richards–Kortum R, Gillenwater AM. Noninvasive imaging of oral neoplasia with a high-resolution fiber-optic micro-endoscope. Head Neck 2012;34(3):305–312. [DOI] [PMC free article] [PubMed] [Google Scholar]
- 23.Aghassi D, Anderson RR, González S. Confocal laser microscopic imaging of actinic keratoses in vivo: A preliminary report. J Am Acad Dermatol 2000;43(1):42–48. [DOI] [PubMed] [Google Scholar]
- 24.González S, Tannous Z. Real-time, in vivo confocal reflectance microscopy of basal cell carcinoma. J Am Acad Dermatol 2002;47(6):869–874. [DOI] [PubMed] [Google Scholar]
- 25.Gambichler T, Orlikov A, Vasa R, et al. In vivo optical coherence tomography of basal cell carcinoma. J Dermatol Sci 2007;45(3):167–173. [DOI] [PubMed] [Google Scholar]
- 26.Kang D, Carruth RW, Kim M, et al. Endoscopic probe optics for spectrally encoded confocal microscopy. Biomed Opt Express 2013;4(10):1925–1936. [DOI] [PMC free article] [PubMed] [Google Scholar]
- 27.Gong F, Swain P, Mills T. Wireless endoscopy. Gastrointest Endosc 2000;51(6):725–729. [DOI] [PubMed] [Google Scholar]
- 28.Abu Gazala M, Shussman N, Abu Gazala S, et al. Miniature camera for enhanced visualization for single-port surgery and NOTES. J Laparoendosc Adv Surg Tech 2012;22(10):984–988. [DOI] [PubMed] [Google Scholar]
- 29.Bouchard MB, Voleti V, Mendes CS, et al. Swept confocally-aligned planar excitation (SCAPE) microscopy for high-speed volumetric imaging of behaving organisms. Nat Photonics 2015;9(2):113–119. [DOI] [PMC free article] [PubMed] [Google Scholar]
- 30.Desjardins A, Vakoc B, Oh W-Y, Motaghiannezam S, Tearney G, Bouma B. Angle-resolved optical coherence tomography with sequential angular selectivity for speckle reduction. Opt Express 2007;15(10):6200–6209. [DOI] [PMC free article] [PubMed] [Google Scholar]
- 31.Farrokhi H, Rohith TM, Boonruangkan J, Han S, Kim H, Kim S-W, Kim Y-J. High-brightness laser imaging with tunable speckle reduction enabled by electroactive micro-optic diffusers. Sci Rep 2017;7(1):15318. [DOI] [PMC free article] [PubMed] [Google Scholar]
- 32.Liba O, Lew MD, SoRelle ED, et al. Speckle-modulating optical coherence tomography in living mice and humans. Nat Commun 2017;8:15845. [DOI] [PMC free article] [PubMed] [Google Scholar]
- 33.Glaser A, Wang Y, Liu J. Assessing the imaging performance of light sheet microscopies in highly scattering tissues. Biomed Opt Express 2016;7(2):454–466. [DOI] [PMC free article] [PubMed] [Google Scholar]
- 34.Vettenburg T, Dalgarno HI, Nylk J, et al. Light-sheet microscopy using an Airy beam. Nat Methods 2014;11(5):541–544. [DOI] [PubMed] [Google Scholar]
- 35.Baumgart E, Kubitscheck U. Scanned light sheet microscopy with confocal slit detection. Opt Express 2012;20 (19):21805–21814. [DOI] [PubMed] [Google Scholar]