

Abstract
Background
Studying time-related changes in susceptible pathogens causing healthcare-associated infections (HAIs) is vital in improving local antimicrobial and infection control practices.
Objectives
Describe susceptibility patterns to several antimicrobials in gram-positive and gram-negative pathogens isolated from patients causing HAIs at three private tertiary care hospitals in Saudi Arabia over a 5-year period.
Methods
Data on trends of antimicrobial susceptibility among bacteria causing HAIs events in children and adults at three tertiary private hospitals located in Riyadh and Qassim, Saudi Arabia, were collected retrospectively between 2015 and 2019 using the surveillance data datasets.
Results
Over a 5-year period, 38,624 pathogens caused 17,539 HAI events in 17,566 patients. About 9450 (53.8%) of patients who suffered HAIs were females and the average age was 41.7 ± 14.3 years (78.1% were adults and 21.9% were children). Gram-negative pathogens were 2.3-times more likely to cause HAIs compared to gram-positive bacteria (71.9% vs. 28.1%). The ranking of causative pathogens in decreasing order was: Escherichia coli (38%), Klebsiella species (15.1%), and Staphylococcus aureus (12.6%). Gram-positive isolates were mostly susceptible to linezolid (91.8%) whereas they were resistant to ampicillin (52.6%), cefoxitin (54.2%), and doxycycline (55.9%). Gram-negative isolates were mostly sensitive to tigecycline (95%) whereas they were resistant to cefotaxime (49.5%) and cefixime (59.6%). During the 5 years, there were relatively stable susceptibility patterns to all tested antimicrobials, except for cefotaxime which shown a susceptibility reduction by 41.4%, among Escherichia coli and Klebsiella species. An increase in the susceptibility of Acinetobacter and Enterobacter and Citrobacter species to all studied antimicrobials was observed except for colistin that had a slight sensitivity reduction in 2019 by 4.3% against Acinetobacter species. However, we noted reduced sensitivity of MRSA, CoNS and Enterococcus species to gentamicin; and increased resistance of MRSA to linezolid and vancomycin.
Conclusion
The observed increase in susceptibility of gram-positive and gram-negative bacteria to studied antimicrobials is important; however, reduced sensitivity of MRSA, CoNS and Enterococcus species to gentamicin; and increased resistance of MRSA to linezolid and vancomycin is a serious threat and calls for effective antimicrobial stewardship programs.
Keywords: Antibiotics, Antimicrobials, Gram-positive, Gram-negative, Healthcare-associated infections, Rates, Saudi Arabia, Sensitivity, Susceptibility
Background
Antimicrobial resistance (AMR) is a major threat to public health imposing significant health and economic burdens on healthcare system and patients [1, 2]. Unless proactive solutions are found to address AMR, global costs are estimated to reach USD 3 trillion annually by 2050 and an additional 10 million people could die each year; cumulated costs could reach over USD 100 trillion [3]. Decreasing private sector investment in the development of new antimicrobials to treat AMR infections threatens global efforts to fight this danger; and AMR requires international attention and collaboration, because bacteria do not recognize borders. In Saudi Arabia, misuse of antimicrobials is high and complicated primarily because antibiotics are available to buy by anyone over-the-counter via the community pharmacies without a legal prescription [4]. Only two years ago, Saudi Ministry of Health has implemented a nationwide ban on the sale of antibiotics without a legal prescription; however, despite this law, dispensing antibiotics without prescription is still common [4]. Routine clinical microbiology laboratory data provide a profile of the susceptibilities of specific bacteria to antimicrobial agents for monitoring and responding to emerging antimicrobial issues. Data can be utilized to help in the selection of empirical therapy by selecting the most appropriate antibiotics before susceptibility results are available, but remains generally unexploited for purposes of epidemiological surveillance. Although Antimicrobial stewardship programs focus on antibiotic prescribing practice, it is supported by an understanding of local antibiotic susceptibility trends, which in turn depends on the availability of a reliable medical microbiology laboratory resource. The Medical Group has implemented antimicrobial stewardship (AMS) programs since January 2014 and employs various strategies to reduce inappropriate utilization of antimicrobials, minimize the emergence of AMR and lower incidence of health-care-associated infections (HAIs) and reduce cost [1, 5].
Several local studies have estimated the rates of susceptibility among gram-positive and gram-negative bacteria in Saudi Arabia [6–10], but none was comprehensive, and comparisons are complicated by variable methods and study periods that influence the findings explanation and interpretation.
Aim
This study aimed to examine patterns of antimicrobial susceptibility of gram-positive and gram-negative pathogens isolated from inpatients and outpatients causing HAIs using the surveillance data datasets collected from three HMG hospitals (Altakhassusi, Arryan and Qassim) over a 5-year period, in Saudi Arabia.
Settings
The private tertiary medical group is considered as one of the largest private healthcare providers in the Middle Eastern region. Currently, the medical group operates 14 medical facilities across Saudi Arabia, UAE and Bahrain, including 7 hospitals and 6 medical centers.
Study was conducted at three tertiary and specialized health facilities with adequate medical professional resources with 237-bed capacity, 365-bed and 150-bed capacity, respectively located in two different cities in Saudi Arabia.
These facilities provide healthcare services to a wide range of patients in various specialties and subspecialties. Yearly, the three healthcare facilities encounter over 127,364 surgical cases, nearly 1,742,144 visits to emergency departments, and over 360,587 admissions.
Methods
Study design
Data of trends in antimicrobial susceptibility among of all reports of four types of gram-positive isolates [Staphylococcus aureus, Methicillin-resistant Staphylococcus aureus (MRSA), Coagulase-negative staphylococci (CoNS) and Enterococcus species] and six types of gram-negative isolates [Escherichia coli, Klebsiella species, Pseudomonas species, Acinetobacter species, Proteus species, and Enterobacter and Citrobacter species] causing HAIs, collected from the infection control and prevention surveillance data between January 2015 and December 2019 from adult and pediatric patients in three tertiary private hospitals in Saudi Arabia, were extracted using standard customized Excel data collection sheets (Microsoft Corp, Redmond, WA, USA). The antimicrobial susceptibility patterns for selected antimicrobials were analyzed and reported.
We extracted the following patient data from the patient records meeting the inclusion criteria: age, gender, patient location (wards, intensive care units, and outpatient settings), specimen type, HAI type, organism identified, and antimicrobial susceptibility test results.
Inclusion–exclusion criteria
Data on incidence of targeted bacterial isolates causing HAIs and susceptibility trends of selected pathogens to various antimicrobials collected from medical and surgical wards, intensive care units (ICUs), emergency rooms and hospital-affiliated outpatient clinics from inpatients and outpatients with blood, urinary, rectal, cerebral spinal fluid, respiratory, saliva, nasal, cervical, lavages, wound, tissue, and semen cultures (consecutive, one per patient, per infection site) were included.
Representatives from all clinically important antimicrobial classes have been tested (ampicillin, cloxacillin, amoxicillin/clavulanic acid, piperacillin/tazobactam, cefoxitin, cefazolin, cefuroxime, cefixime, cefotaxime, ceftriaxone, ceftazidime, cefepime, ciprofloxacin, levofloxacin, ofloxacin, nitrofurantoin, erythromycin, clindamycin, trimethoprim-sulfamethoxazole, amikacin, gentamicin, doxycycline, tetracycline, vancomycin, linezolid, imipenem, meropenem, tigecycline and colistin).
Infection events and response of pathogens to antibacterials lacking microorganism and/or culture and sensitivity testing information were excluded.
Antimicrobial susceptibility testing
Species identification of isolates and their antimicrobial susceptibility profiles were obtained with different automated systems at every single laboratory of the three facilities using (VITEK®2 system, BioMariex, France), BD Phoenix system (BD Biosciences, NJ, USA), MicroScan plus (Beckman Coulter, CA, USA), and BD BACTEC system (BD Biosciences) according to manufacturers’ specifications, between 2015 and 2019, with susceptibility interpretations based on the Clinical and Laboratory Standards Institute (CLSI) broth microdilution and breakpoint criteria [11]. To ensure data compatibility, quality control was performed using control strains from the following American Type Culture Collection (ATCCs): Staphylococcus aureus ATCC 29213, Pseudomonas aeruginosa ATCC 2853, Escherichia coli ATCC 25922, Escherichia coli ATCC 35218, Klebsiella pneumoniae ATCC 27736 and Enterococcus faecalis ATCC 29212. Data are only included when the quality control test results were in acceptable ranges.
Statistical analysis
Variables that were continuous were presented as means and categorical variables were presented as frequencies and percentages. Susceptibility patterns of pathogens were presented over time. The difference in sensitivity trends between 2015 and 2019 was examined using the multivariate analysis of variance (MANOVA) and a two-sided P-values < 0.05 were considered to be statistically significant. The proportion of susceptible isolates was calculated as the sum of susceptible organisms (neither intermediately susceptible nor resistant) relative to the total number of organisms tested. SPSS (Version 25.0. Armonk, NY: IBM Corp) and Microsoft Excel Professional Plus 2019 (Microsoft Corp., Redmond, WA, USA) were used for all statistical analyses.
Our study was performed in accordance with the ethical standards of the Declaration of Helsinki and its later amendments or comparable ethical standards. Ethics approval (RC20.10.95-2) was obtained by the Ethics Committee of the coordinator center (IRB Committee of Dr. Sulaiman Al Habib Medical Group, Riyadh, Saudi Arabia).
Results
Incidence of pathogens causing HAIs and patient characteristics
A total of 41,813 pathogens were isolated over 5 years in the three of our medical group’s facilities of which 38,624 pathogens caused 17,539 HAI events in 17,566 patients. These HAIs events were contracted in HMG Hospital in Altakhassusi (6016 HAI events = 34.3%), HMG Hospital in Arryan (5893 HAI events = 33.6%) and HMG Hospital in Qassim (5630 HAI events = 32.1%). Reported HAIs varied in type: catheter-associated urinary tract infection (CAUTI) (29.4%), central line-associated bloodstream infection (CLABSI) (27.3%), surgical site infection (SSI) (26.1%) and ventilator-associated events (VAE) (17.2%). Processed samples were blood (24.7%), urinary (19.1%), respiratory (13.4%), cerebral spinal fluid (8.5%), cervical (8.2%), saliva (5.2%), nasal (5.1), rectal (4.9%), lavages (4.7%), wound (3.9%), tissue (1.4%), and semen (0.9%). These HAI events were isolated in the intensive care units (37.2%), wards (32.9%), and outpatients (29.9%). In our study, we excluded 6232 (16.1%) HAI events due to the lack of data on the antimicrobial, pathogen, and/or culture response and sensitivity testing. About 9450 (53.8%) of patients who suffered HAIs were identified as females and had a mean age of 41.7 ± 14.3 years (78.1% were adults and 21.9% were children). Of 38,624 isolates taken from clinical specimens between 2015 and 2019, 27,754 (71.9%) were gram-negative organisms and 10,870 (28.1%) were gram-positive organisms. The ranking of causative pathogens in decreasing order was: Escherichia coli (38%), Klebsiella species (15.1%), Staphylococcus aureus (12.6%), Pseudomonas species (10.1%), and Enterococcus species (5.9%) (Fig. 1).
Fig. 1.
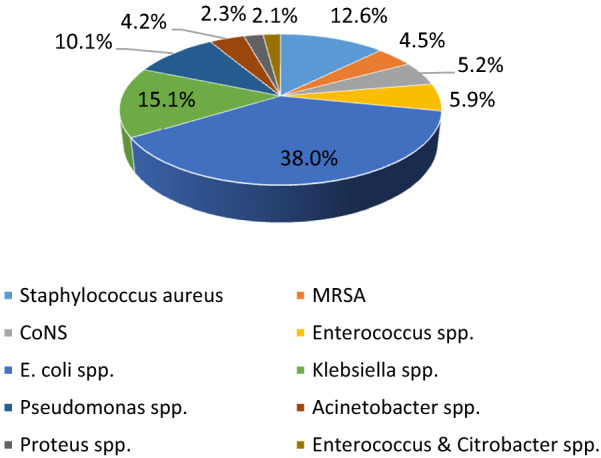
Total frequency of isolated gram-positive and gram-negative bacteria causing healthcare-associated infections in the three facilities in Saudi Arabia (2015–2019)
Trends of susceptibility among gram-positive bacteria
A total of 79,280 gram-positive pathogen sensitivity events against 14 clinically important antimicrobials occurred at HMG Hospital in Altakhassusi (38.2%), HMG Hospital in Arryan (36.6%), and HMG Hospital in Qassim (25.2%). Gram-positive bacteria showed an overall susceptibility of ≥ 52.6%. Antimicrobial susceptibility patterns in gram-positive pathogens over time are presented in Table 1.
Table 1.
Antimicrobial susceptibility rates found in gram-positive bacteria causing healthcare-associated infections in three HMG facilities in Saudi Arabia (2015–2019)
| Staphylococcus aureus | 2015 | 2016 | 2017 | 2018 | 2019 | Total | P-value* | ||||||||||||
|---|---|---|---|---|---|---|---|---|---|---|---|---|---|---|---|---|---|---|---|
| (N = 903 isolates) | (N = 666 isolates) | (N = 940 isolates) | (N = 1,122 isolates) | (N = 1,222 isolates) | (N = 4,853 isolates) | ||||||||||||||
| T | S | S% | T | S | S% | T | S | S% | T | S | S% | T | S | S% | T | S | S% | ||
| AMP | 191 | 64 | 33.5 | 131 | 52 | 39.7 | 169 | 93 | 55 | 157 | 87 | 55.4 | 222 | 63 | 28.4 | 870 | 359 | 41.3 | 0.828 |
| CLX | 677 | 544 | 80.4 | 444 | 331 | 74.5 | 797 | 656 | 82.3 | 747 | 679 | 90.9 | 887 | 735 | 82.9 | 3552 | 2945 | 82.9 | 0.649 |
| CTN | 230 | 109 | 47.4 | 209 | 89 | 42.6 | 266 | 134 | 50.4 | 266 | 154 | 57.9 | 252 | 161 | 63.9 | 1223 | 647 | 52.9 | 0.937 |
| CIP | 664 | 457 | 68.8 | 446 | 321 | 72 | 671 | 498 | 74.2 | 511 | 453 | 88.6 | 548 | 487 | 88.9 | 2840 | 2216 | 78 | 0.993 |
| LVX | 389 | 288 | 74 | 228 | 169 | 74.1 | 552 | 426 | 77.2 | 588 | 532 | 90.5 | 700 | 627 | 89.6 | 2457 | 2042 | 83.1 | 0.864 |
| DCN | 322 | 153 | 47.5 | 155 | 87 | 56.1 | 181 | 93 | 51.4 | 258 | 124 | 48.1 | 192 | 139 | 72.4 | 1108 | 596 | 53.8 | 0.983 |
| TCN | 514 | 305 | 59.3 | 489 | 423 | 86.5 | 891 | 838 | 94.1 | 1001 | 989 | 98.8 | 1201 | 1079 | 89.8 | 4096 | 3634 | 88.7 | 0.335 |
| GMN | 888 | 819 | 92.2 | 641 | 582 | 90.8 | 889 | 871 | 98 | 1022 | 955 | 93.4 | 1193 | 1098 | 92 | 4633 | 4325 | 93.4 | 0.775 |
| EMN | 722 | 696 | 96.4 | 558 | 473 | 84.8 | 791 | 740 | 93.6 | 971 | 813 | 83.7 | 991 | 929 | 93.7 | 4033 | 3651 | 90.5 | 0.659 |
| CMN | 804 | 780 | 97 | 576 | 513 | 89.1 | 896 | 871 | 97.2 | 1103 | 967 | 87.7 | 1187 | 1071 | 90.2 | 4566 | 4202 | 92 | 0.697 |
| NFT | 441 | 317 | 71.9 | 334 | 207 | 62 | 454 | 371 | 81.7 | 454 | 321 | 70.7 | 345 | 266 | 77.1 | 2028 | 1482 | 73.1 | 0.712 |
| TMP-SMZ | 595 | 463 | 77.8 | 591 | 524 | 88.7 | 865 | 819 | 94.7 | 1022 | 947 | 92.7 | 1201 | 996 | 82.9 | 4274 | 3749 | 87.7 | 0.542 |
| LZD | 903 | 903 | 100 | 641 | 625 | 97.5 | 790 | 773 | 97.8 | 1110 | 1003 | 90.4 | 1100 | 1076 | 97.8 | 4544 | 4380 | 96.4 | 0.931 |
| VMN | 901 | 895 | 99.3 | 651 | 624 | 95.9 | 938 | 931 | 99.3 | 1113 | 1109 | 99.6 | 1200 | 1181 | 98.4 | 4803 | 4740 | 98.7 | 0.721 |
| MRSA | 2015 | 2016 | 2017 | 2018 | 2019 | Total | P-value* | ||||||||||||
|---|---|---|---|---|---|---|---|---|---|---|---|---|---|---|---|---|---|---|---|
| (N = 359 isolates) | (N = 335 isolates) | (N = 284 isolates) | (N = 443 isolates) | (N = 310 isolates) | (N = 1,731 isolates) | ||||||||||||||
| T | S | S% | T | S | S% | T | S | S% | T | S | S% | T | S | S% | T | S | S% | ||
| AMP | 90 | 13 | 14.4 | 44 | 8 | 18.2 | 51 | 7 | 13.7 | 74 | 15 | 20.3 | 69 | 21 | 30.4 | 328 | 64 | 19.5 | 0.814 |
| CLX | 116 | 72 | 62.1 | 147 | 86 | 58.5 | 147 | 81 | 55.1 | 311 | 138 | 44.4 | 290 | 141 | 48.6 | 1011 | 518 | 51.2 | 0.963 |
| CTN | 11 | 7 | 63.6 | 33 | 9 | 27.3 | 64 | 13 | 20.3 | 67 | 11 | 16.4 | 50 | 8 | 16 | 225 | 48 | 21.3 | 0.956 |
| CIP | 190 | 141 | 74.2 | 187 | 112 | 59.9 | 229 | 108 | 47.2 | 401 | 198 | 49.4 | 301 | 245 | 81.4 | 1308 | 804 | 61.5 | 0.924 |
| LVX | 55 | 31 | 56.4 | 99 | 46 | 46.5 | 187 | 75 | 40.1 | 366 | 131 | 35.8 | 260 | 115 | 44.2 | 967 | 398 | 41.2 | 0.693 |
| DCN | 222 | 110 | 49.5 | 189 | 122 | 64.6 | 280 | 141 | 50.4 | 410 | 191 | 46.6 | 307 | 154 | 50.2 | 1408 | 718 | 51 | 0.964 |
| TCN | 141 | 101 | 71.6 | 211 | 118 | 55.9 | 179 | 108 | 60.3 | 440 | 251 | 57 | 303 | 271 | 89.4 | 1274 | 849 | 66.6 | 0.860 |
| GMN | 291 | 121 | 41.6 | 277 | 129 | 46.6 | 151 | 116 | 76.8 | 432 | 216 | 50 | 300 | 284 | 94.7 | 1451 | 866 | 59.7 | 0.888 |
| EMN | 144 | 91 | 63.2 | 177 | 102 | 57.6 | 111 | 97 | 87.4 | 331 | 176 | 53.2 | 271 | 232 | 85.6 | 1034 | 698 | 67.5 | 0.878 |
| CMN | 220 | 93 | 42.3 | 254 | 113 | 44.5 | 161 | 108 | 67.1 | 411 | 203 | 49.4 | 300 | 264 | 88 | 1346 | 781 | 58 | 0.838 |
| NFT | 181 | 117 | 64.6 | 311 | 213 | 68.5 | 281 | 241 | 85.8 | 441 | 399 | 90.5 | 308 | 287 | 93.2 | 1522 | 1257 | 82.6 | 0.346 |
| TMP-SMZ | 233 | 88 | 37.8 | 268 | 114 | 42.5 | 229 | 108 | 47.2 | 409 | 201 | 49.1 | 290 | 227 | 78.3 | 1429 | 738 | 51.6 | 0.892 |
| LZD | 241 | 118 | 49 | 264 | 138 | 52.3 | 223 | 123 | 55.2 | 439 | 251 | 57.2 | 299 | 175 | 58.5 | 1466 | 805 | 54.9 | 0.974 |
| VMN | 299 | 121 | 40.5 | 285 | 138 | 48.4 | 258 | 123 | 47.7 | 440 | 251 | 57 | 305 | 175 | 57.4 | 1587 | 808 | 50.9 | 0.975 |
| CoNS | 2015 | 2016 | 2017 | 2018 | 2019 | Total | P-value* | ||||||||||||
|---|---|---|---|---|---|---|---|---|---|---|---|---|---|---|---|---|---|---|---|
| (N = 543 isolates) | (N = 276 isolates) | (N = 351 isolates) | (N = 426 isolates) | (N = 424 isolates) | (N = 2,020 isolates) | ||||||||||||||
| T | S | S% | T | S | S% | T | S | S% | T | S | S% | T | S | S% | T | S | S% | ||
| AMP | 190 | 31 | 16.3 | 177 | 21 | 11.9 | 166 | 33 | 19.9 | 291 | 42 | 14.4 | 348 | 51 | 14.7 | 1172 | 178 | 15.2 | 0.948 |
| CLX | 164 | 88 | 53.7 | 190 | 64 | 33.7 | 289 | 96 | 33.2 | 408 | 146 | 35.8 | 333 | 114 | 34.2 | 1384 | 508 | 36.7 | 0.936 |
| CTN | 491 | 263 | 53.6 | 270 | 239 | 99.6 | 340 | 301 | 88.5 | 420 | 364 | 86.7 | 409 | 373 | 91.2 | 1930 | 1570 | 81.3 | 0.962 |
| CIP | 277 | 122 | 44 | 257 | 124 | 48.2 | 300 | 94 | 31.3 | 360 | 129 | 35.8 | 340 | 170 | 50 | 1534 | 639 | 41.7 | 0.991 |
| LVX | 130 | 46 | 35.4 | 211 | 56 | 26.5 | 288 | 142 | 49.3 | 420 | 173 | 41.2 | 211 | 85 | 40.3 | 1260 | 502 | 39.8 | 0.903 |
| DCN | 511 | 336 | 65.8 | 271 | 261 | 96.3 | 349 | 313 | 89.7 | 410 | 378 | 92.2 | 420 | 381 | 90.7 | 1961 | 1669 | 85.1 | 0.951 |
| TCN | 499 | 169 | 33.9 | 270 | 211 | 78.1 | 333 | 283 | 85 | 420 | 316 | 75.2 | 424 | 378 | 89.2 | 1946 | 1357 | 69.7 | 0.930 |
| GMN | 538 | 292 | 54.3 | 255 | 176 | 69 | 348 | 269 | 77.3 | 418 | 320 | 76.6 | 420 | 327 | 77.9 | 1979 | 1384 | 69.9 | 0.982 |
| EMN | 333 | 95 | 28.5 | 116 | 51 | 44 | 270 | 83 | 30.7 | 339 | 106 | 31.3 | 198 | 98 | 49.5 | 1256 | 433 | 34.5 | 0.966 |
| CMN | 531 | 255 | 48 | 266 | 156 | 58.6 | 269 | 235 | 87.4 | 399 | 282 | 70.7 | 339 | 293 | 86.4 | 1804 | 1221 | 67.7 | 0.981 |
| NFT | 170 | 77 | 45.3 | 233 | 99 | 42.5 | 331 | 225 | 68 | 411 | 250 | 60.8 | 400 | 344 | 86 | 1545 | 995 | 64.4 | 0.819 |
| TMP-SMZ | 369 | 153 | 41.5 | 276 | 199 | 72.1 | 350 | 298 | 85.1 | 400 | 349 | 87.3 | 407 | 327 | 80.3 | 1802 | 1326 | 73.6 | 0.831 |
| LZD | 541 | 535 | 98.9 | 276 | 273 | 98.9 | 351 | 351 | 100 | 426 | 426 | 100 | 424 | 424 | 100 | 2018 | 2009 | 99.6 | 0.967 |
| VMN | 543 | 537 | 98.9 | 276 | 276 | 100 | 351 | 351 | 100 | 426 | 426 | 100 | 424 | 424 | 100 | 2020 | 2014 | 99.7 | 0.968 |
| Enterococcus species | 2015 | 2016 | 2017 | 2018 | 2019 | Total | P-value* | ||||||||||||
|---|---|---|---|---|---|---|---|---|---|---|---|---|---|---|---|---|---|---|---|
| (N = 481 isolates) | (N = 370 isolates) | (N = 447 isolates) | (N = 411 isolates) | (N = 557 isolates) | (N = 2266 isolates) | ||||||||||||||
| T | S | S% | T | S | S% | T | S | S% | T | S | S% | T | S | S% | T | S | S% | ||
| AMP | 460 | 305 | 66.3 | 330 | 252 | 76.4 | 422 | 378 | 89.6 | 377 | 318 | 84.4 | 533 | 508 | 95.3 | 2122 | 1761 | 83 | 0.539 |
| CLX | 469 | 280 | 59.7 | 340 | 299 | 87.9 | 430 | 364 | 84.7 | 388 | 381 | 98.2 | 499 | 433 | 86.8 | 2126 | 1757 | 82.6 | 0.618 |
| CTN | 281 | 61 | 21.7 | 277 | 79 | 28.5 | 414 | 110 | 26.6 | 350 | 124 | 35.4 | 444 | 151 | 34 | 1766 | 525 | 29.7 | 0.850 |
| CIP | 369 | 164 | 44.4 | 299 | 127 | 42.5 | 398 | 169 | 42.5 | 322 | 111 | 34.5 | 471 | 97 | 20.6 | 1859 | 668 | 35.9 | 0.965 |
| LVX | 379 | 243 | 64.1 | 310 | 182 | 58.7 | 441 | 305 | 69.2 | 401 | 275 | 68.6 | 333 | 188 | 56.5 | 1864 | 1193 | 64 | 0.928 |
| DCN | 244 | 32 | 13.1 | 177 | 20 | 11.3 | 288 | 44 | 15.3 | 200 | 59 | 29.5 | 347 | 67 | 19.3 | 1256 | 222 | 17.7 | 0.812 |
| TCN | 201 | 32 | 15.9 | 222 | 40 | 18 | 333 | 203 | 61 | 190 | 92 | 48.4 | 500 | 143 | 28.6 | 1446 | 510 | 35.3 | 0.213 |
| GMN | 298 | 113 | 37.9 | 191 | 76 | 39.8 | 430 | 123 | 28.6 | 310 | 152 | 49 | 499 | 183 | 36.7 | 1728 | 647 | 37.4 | 0.972 |
| EMN | 411 | 145 | 35.3 | 301 | 42 | 14 | 357 | 153 | 42.9 | 188 | 53 | 28.2 | 331 | 65 | 19.6 | 1588 | 458 | 28.8 | 0.824 |
| CMN | 177 | 28 | 15.8 | 191 | 45 | 23.6 | 299 | 61 | 20.4 | 191 | 77 | 40.3 | 189 | 81 | 42.9 | 1047 | 292 | 27.9 | 0.506 |
| NFT | 322 | 116 | 36 | 355 | 300 | 84.5 | 438 | 393 | 89.7 | 391 | 364 | 93.1 | 541 | 482 | 89.1 | 2047 | 1655 | 80.9 | 0.306 |
| TMP-SMZ | 280 | 63 | 22.5 | 339 | 276 | 81.4 | 409 | 291 | 71.1 | 336 | 273 | 81.3 | 534 | 376 | 70.4 | 1898 | 1279 | 67.4 | 0.646 |
| LZD | 481 | 470 | 97.7 | 370 | 370 | 100 | 447 | 447 | 100 | 411 | 411 | 100 | 557 | 556 | 99.8 | 2266 | 2254 | 99.5 | 0.874 |
| VMN | 481 | 237 | 49.3 | 370 | 361 | 97.6 | 440 | 435 | 98.9 | 410 | 364 | 88.8 | 550 | 537 | 97.6 | 2251 | 1934 | 85.9 | 0.517 |
| Overall | 2015 | 2016 | 2017 | 2018 | 2019 | Total | P-value* | ||||||||||||
|---|---|---|---|---|---|---|---|---|---|---|---|---|---|---|---|---|---|---|---|
| (N = 2286 isolates) | (N = 1647 isolates) | (N = 2022 isolates) | (N = 2402 isolates) | (N = 2513 isolates) | (N = 10,870 isolates) | ||||||||||||||
| T | S | S% | T | S | S% | T | S | S% | T | S | S% | T | S | S% | T | S | S% | ||
| AMP | 931 | 413 | 44.4 | 682 | 333 | 48.8 | 808 | 511 | 63.2 | 899 | 462 | 51.4 | 1172 | 643 | 54.9 | 4492 | 2362 | 52.6 | 0.971 |
| CLX | 1426 | 984 | 69 | 1121 | 780 | 69.6 | 1663 | 1197 | 72 | 1854 | 1344 | 72.5 | 2009 | 1423 | 70.8 | 8073 | 5728 | 71 | 0.874 |
| CTN | 1013 | 440 | 43.4 | 789 | 446 | 56.5 | 1084 | 558 | 51.5 | 1103 | 653 | 59.2 | 1155 | 693 | 60 | 5144 | 2790 | 54.2 | 0.933 |
| CIP | 1500 | 884 | 58.9 | 1189 | 684 | 57.5 | 1598 | 869 | 54.4 | 1594 | 891 | 55.9 | 1660 | 999 | 60.2 | 7541 | 4327 | 57.4 | 0.969 |
| LVX | 953 | 608 | 63.8 | 848 | 453 | 53.4 | 1468 | 948 | 64.6 | 1775 | 1111 | 62.6 | 1504 | 1015 | 67.5 | 6548 | 4135 | 63.1 | 0.610 |
| DCN | 1299 | 631 | 48.6 | 792 | 490 | 61.9 | 1098 | 591 | 53.8 | 1278 | 752 | 58.8 | 1266 | 741 | 58.5 | 5733 | 3205 | 55.9 | 0.939 |
| TCN | 1355 | 607 | 44.8 | 1192 | 792 | 66.4 | 1736 | 1432 | 82.5 | 2051 | 1648 | 80.4 | 2428 | 1871 | 77.1 | 8762 | 6350 | 72.5 | 0.556 |
| GMN | 2015 | 1345 | 66.7 | 1364 | 963 | 70.6 | 1818 | 1379 | 75.9 | 2182 | 1643 | 75.3 | 2412 | 1892 | 78.4 | 9791 | 7222 | 73.8 | 0.905 |
| EMN | 1610 | 1027 | 63.8 | 1152 | 668 | 58 | 1529 | 1073 | 70.2 | 1829 | 1148 | 62.8 | 1791 | 1324 | 73.9 | 7911 | 5240 | 66.2 | 0.965 |
| CMN | 1732 | 1156 | 66.7 | 1287 | 827 | 64.3 | 1625 | 1275 | 78.5 | 2104 | 1529 | 72.7 | 2015 | 1709 | 84.8 | 8763 | 6496 | 74.1 | 0.922 |
| NFT | 1114 | 627 | 56.3 | 1233 | 819 | 66.4 | 1504 | 1230 | 81.8 | 1697 | 1334 | 78.6 | 1594 | 1379 | 86.5 | 7142 | 5389 | 75.5 | 0.032 |
| TMP-SMZ | 1477 | 767 | 51.9 | 1474 | 1113 | 75.5 | 1853 | 1516 | 81.8 | 2167 | 1770 | 81.7 | 2432 | 1926 | 79.2 | 9403 | 7092 | 75.4 | 0.595 |
| LZD | 2166 | 2026 | 93.5 | 1551 | 1406 | 90.7 | 1811 | 1694 | 93.5 | 2386 | 2091 | 87.6 | 2380 | 2231 | 93.7 | 10,294 | 9448 | 91.8 | 0.875 |
| VMN | 2224 | 1790 | 80.5 | 1582 | 1399 | 88.4 | 1987 | 1849 | 92.6 | 2389 | 2163 | 90 | 2479 | 2357 | 93.5 | 10,661 | 9558 | 89.1 | 0.901 |
N Number of pathogens causing healthcare-associated infections, T number of tested isolates, S number of susceptible pathogens, S (%) percentage of susceptible pathogens, MRSA methicillin-resistant Staphylococcus aureus, CoNS coagulase-negative staphylococci, AMP ampicillin, CLX cloxacillin, CTN cefoxitin, CIP ciprofloxacin, LVX levofloxacin, NFT nitrofurantoin, EMN erythromycin, CMN clindamycin, TMP-SMZ trimethoprim-sulfamethoxazole, GMN gentamicin, DCN doxycycline, TCN tetracycline, VMN vancomycin, LZD linezolid
*Multivariate analysis of variance (MANOVA) for resistance trend
Generally, the highest susceptibilities of gram-positive pathogens to antimicrobials were seen towards vancomycin and linezolid by Staphylococcus aureus, 98.7% and 96.4%; CoNS, 99.7% and 99.6%; and Enterococcus species, 99.5% and 85.9%; respectively. Moreover, Staphylococcus aureus was found to be highly sensitive to gentamicin (93.4%), clindamycin (92%), and erythromycin (90.5%); MRSA was most sensitive to nitrofurantoin (82.6%); CoNS was sensitive to doxycycline (85.1%) and cefoxitin (81.3%); and Enterococcus species was sensitive to ampicillin (83%), cloxacillin (82.6%) and nitrofurantoin (80.9%) over the 5-year period.
In opposite, lowest susceptibilities of gram-positive pathogens to antimicrobials were seen to ampicillin by CoNS, 15.2%; MRSA, 19.5%; and Staphylococcus aureus, 41.3%; respectively. Also, Enterococcus species was least susceptible to doxycycline (17.7%); and MRSA was slightly sensitive to cefoxitin (21.3%).
Tetracycline, trimethoprim-sulfamethoxazole, levofloxacin and cloxacillin retained activity against 88.7%, 87.7%, 83.1%, and 82.9% of Staphylococcus aureus isolates, respectively, whereas trimethoprim-sulfamethoxazole was active against 73.6% of the CoNS isolates.
Over the 5 years, sensitivity of nitrofurantoin to overall gram-positive bacteria was the only antimicrobial to increase significantly (30.2% increase, p-value = 0.032). Prominent insignificant increase in the susceptibility of specific gram-positive bacteria to some antimicrobials occurred in 2019 compared to 2015 by: 30.5% for Staphylococcus aureus to tetracycline; 53.1% and 45.7% for MRSA to gentamicin and clindamycin, respectively; 37.6%, 55.3%,38.4%, 38.5% and 40.7% for CoNS to cefoxitin, tetracycline, clindamycin, trimethoprim-sulfamethoxazole and nitrofurantoin, respectively; 53.1%, 47.9% and 48.3% for Enterococcus species to trimethoprim-sulfamethoxazole, nitrofurantoin and vancomycin, respectively. However, noticeable insignificant decrease in susceptibility were seen in 2019 compared to 2015 by: 47.6% for MRSA to cefoxitin; and 23.8% for Enterococcus species to ciprofloxacin.
Overall, among the studied antibiotics the gram-positive isolates were mostly sensitive to linezolid (91.8%) whereas they were resistant to ampicillin (52.6%), cefoxitin (54.2%), and doxycycline (55.9%) (Table 1).
Trends of susceptibility among gram-negative bacteria
A total of 314,624 gram-negative pathogen sensitivity events against 21 clinically important antimicrobials occurred at HMG Hospital in Altakhassusi (35.9%), HMG Hospital in Arryan (39.3%), and HMG Hospital in Qassim (24.8%). Gram-negative bacteria showed an overall susceptibility of ≥ 49.5%. Antimicrobial susceptibility patterns in gram-negative pathogens over time are presented in Table 2.
Table 2.
Antimicrobial susceptibility rates found in gram-negative bacteria causing healthcare-associated infections in three HMG facilities in Saudi Arabia (2015–2019)
| Escherichia coli | 2015 | 2016 | 2017 | 2018 | 2019 | Total | P-value* | ||||||||||||
|---|---|---|---|---|---|---|---|---|---|---|---|---|---|---|---|---|---|---|---|
| (N = 2,481 isolates) | (N = 2,458 isolates) | (N = 2,509 isolates) | (N = 3,085 isolates) | (N = 4,149 isolates) | (N = 14,682 isolates) | ||||||||||||||
| T | S | S% | T | S | S% | T | S | S% | T | S | S% | T | S | S% | T | S | S% | ||
| AMP | 1100 | 761 | 69.2 | 1130 | 793 | 70.2 | 1158 | 803 | 69.3 | 1100 | 987 | 89.7 | 1800 | 1654 | 91.9 | 6288 | 4998 | 79.5 | 0.460 |
| AMX/CLA | 1920 | 1679 | 87.4 | 2100 | 1805 | 86 | 2103 | 1874 | 89.1 | 2700 | 2326 | 86.1 | 3258 | 2825 | 86.7 | 12,081 | 10,509 | 87 | 0.835 |
| CZN | 333 | 126 | 37.8 | 999 | 841 | 84.2 | 666 | 470 | 70.6 | 987 | 631 | 63.9 | 1852 | 1412 | 76.2 | 4837 | 3480 | 71.9 | 0.683 |
| CRX | 788 | 660 | 83.8 | 1125 | 828 | 73.6 | 547 | 378 | 69.1 | 981 | 732 | 74.6 | 1987 | 1505 | 75.7 | 5428 | 4103 | 75.6 | 0.911 |
| CFX | 1968 | 819 | 41.6 | 645 | 496 | 76.9 | 752 | 432 | 57.4 | 896 | 772 | 86.2 | 879 | 534 | 60.8 | 5140 | 3053 | 59.4 | 0.981 |
| CTM | 456 | 253 | 55.5 | 488 | 282 | 57.8 | 456 | 238 | 52.2 | 541 | 290 | 53.6 | 654 | 274 | 41.9 | 2595 | 1337 | 51.5 | 0.920 |
| CTX | 2388 | 1764 | 73.9 | 1933 | 1757 | 90.9 | 1901 | 1610 | 84.7 | 2456 | 2134 | 86.9 | 3896 | 3007 | 77.2 | 12,574 | 10,272 | 81.7 | 0.682 |
| CZM | 1963 | 1059 | 53.9 | 1025 | 896 | 87.4 | 2005 | 1113 | 55.5 | 1754 | 1275 | 72.7 | 1785 | 1384 | 77.5 | 8532 | 5727 | 67.1 | 0.998 |
| CPM | 1347 | 1007 | 74.8 | 1987 | 1775 | 89.3 | 2111 | 1764 | 83.6 | 2666 | 2158 | 80.9 | 3101 | 2849 | 91.9 | 11,212 | 9553 | 85.2 | 0.846 |
| IPM | 2477 | 2451 | 99 | 2358 | 2158 | 91.5 | 2430 | 2395 | 98.6 | 3081 | 3069 | 99.6 | 4130 | 4022 | 97.4 | 14,476 | 14,095 | 97.4 | 0.676 |
| MPM | 2480 | 2412 | 97.3 | 2400 | 2238 | 93.3 | 2414 | 2392 | 99.1 | 3074 | 3048 | 99.2 | 4099 | 4022 | 98.1 | 14,467 | 14,112 | 97.5 | 0.654 |
| PIP-TZP | 2360 | 2270 | 96.2 | 2347 | 2146 | 91.4 | 2456 | 2322 | 94.5 | 2996 | 2882 | 96.2 | 3896 | 3533 | 90.7 | 14,055 | 13,153 | 93.6 | 0.805 |
| TMP-SMZ | 1456 | 1293 | 88.8 | 1745 | 1463 | 83.8 | 1736 | 1249 | 71.9 | 1987 | 1775 | 89.3 | 2898 | 2589 | 89.3 | 9822 | 8369 | 85.2 | 0.529 |
| GMN | 2223 | 2128 | 95.7 | 2314 | 2178 | 94.1 | 2300 | 2124 | 92.3 | 2965 | 2742 | 92.5 | 3991 | 3589 | 89.9 | 13,793 | 12,761 | 92.5 | 0.726 |
| ACN | 2470 | 2135 | 86.4 | 2389 | 2400 | 100.5 | 2490 | 2414 | 96.9 | 3030 | 3009 | 99.3 | 4110 | 4030 | 98.1 | 14,489 | 13,988 | 96.5 | 0.697 |
| CIP | 2001 | 1726 | 86.3 | 1999 | 1804 | 90.2 | 1800 | 1737 | 96.5 | 2789 | 2240 | 80.3 | 3008 | 2951 | 98.1 | 11,597 | 10,458 | 90.2 | 0.739 |
| OXN | 1136 | 785 | 69.1 | 1107 | 909 | 82.1 | 700 | 612 | 87.4 | 698 | 548 | 78.5 | 687 | 442 | 64.3 | 4328 | 3296 | 76.2 | 0.967 |
| LVX | 1147 | 785 | 68.4 | 1165 | 918 | 78.8 | 565 | 438 | 77.5 | 1365 | 1016 | 74.4 | 1777 | 1393 | 78.4 | 6019 | 4550 | 75.6 | 0.923 |
| NFT | 1455 | 1241 | 85.3 | 2411 | 2317 | 96.1 | 2425 | 2314 | 95.4 | 2905 | 2704 | 93.1 | 3896 | 3790 | 97.3 | 13,092 | 12,366 | 94.5 | 0.489 |
| TGN | 2377 | 2269 | 95.5 | 2450 | 2420 | 98.8 | 2500 | 2499 | 100 | 3083 | 3069 | 99.5 | 4144 | 4131 | 99.7 | 14,554 | 14,388 | 98.9 | 0.420 |
| CLN | 1365 | 1106 | 81 | 1130 | 722 | 63.9 | 789 | 570 | 72.2 | 2029 | 1016 | 50.1 | 4011 | 3974 | 99.1 | 9324 | 7388 | 79.2 | 0.120 |
| Klebsiella species | 2015 | 2016 | 2017 | 2018 | 2019 | Total | P-value* | ||||||||||||
|---|---|---|---|---|---|---|---|---|---|---|---|---|---|---|---|---|---|---|---|
| (N = 1,000 isolates) | (N = 839 isolates) | (N = 1,299 isolates) | (N = 1,357 isolates) | (N = 1,356 isolates) | (N = 5,851 isolates) | ||||||||||||||
| T | S | S% | T | S | S% | T | S | S% | T | S | S% | T | S | S% | T | S | S% | ||
| AMP | 300 | 206 | 68.7 | 222 | 172 | 77.5 | 221 | 94 | 42.5 | 801 | 611 | 76.3 | 512 | 333 | 65 | 2056 | 1416 | 68.9 | 0.258 |
| AMX/CLA | 654 | 534 | 81.7 | 654 | 565 | 86.4 | 906 | 841 | 92.8 | 1001 | 938 | 93.7 | 896 | 739 | 82.5 | 4111 | 3617 | 88 | 0.772 |
| CZN | 159 | 75 | 47.2 | 400 | 312 | 78 | 456 | 356 | 78.1 | 562 | 467 | 83.1 | 753 | 462 | 61.4 | 2330 | 1672 | 71.8 | 0.786 |
| CRX | 654 | 223 | 34.1 | 258 | 137 | 53.1 | 358 | 278 | 77.7 | 452 | 354 | 78.3 | 963 | 369 | 38.3 | 2685 | 1361 | 50.7 | 0.975 |
| CFX | 700 | 444 | 63.4 | 402 | 321 | 79.9 | 456 | 295 | 64.7 | 458 | 370 | 80.8 | 456 | 269 | 59 | 2472 | 1699 | 68.7 | 0.989 |
| CTM | 112 | 82 | 73.2 | 111 | 86 | 77.5 | 255 | 104 | 40.8 | 320 | 134 | 41.9 | 358 | 114 | 31.8 | 1156 | 520 | 45 | 0.997 |
| CTX | 753 | 543 | 72.1 | 654 | 507 | 77.5 | 801 | 770 | 96.1 | 987 | 887 | 89.9 | 1,196 | 851 | 71.2 | 4391 | 3558 | 81 | 0.607 |
| CZM | 656 | 367 | 55.9 | 456 | 326 | 71.5 | 687 | 413 | 60.1 | 454 | 394 | 86.8 | 756 | 396 | 52.4 | 3009 | 1896 | 63 | 0.269 |
| CPM | 550 | 310 | 56.4 | 654 | 589 | 90.1 | 1010 | 845 | 83.7 | 900 | 829 | 92.1 | 1120 | 814 | 72.7 | 4234 | 3387 | 80 | 0.821 |
| IPM | 961 | 778 | 81 | 832 | 781 | 93.9 | 1190 | 1113 | 93.5 | 1290 | 1208 | 93.6 | 1310 | 1116 | 85.2 | 5583 | 4996 | 89.5 | 0.626 |
| MPM | 800 | 742 | 92.8 | 765 | 731 | 95.6 | 1120 | 1104 | 98.6 | 1291 | 1207 | 93.5 | 1312 | 1104 | 84.1 | 5288 | 4888 | 92.4 | 0.544 |
| PIP-TZP | 751 | 631 | 84 | 741 | 664 | 89.6 | 1130 | 933 | 82.6 | 1140 | 1021 | 89.6 | 1100 | 906 | 82.4 | 4862 | 4155 | 85.5 | 0.765 |
| TMP-SMZ | 654 | 535 | 81.8 | 659 | 596 | 90.4 | 874 | 788 | 90.2 | 1122 | 903 | 80.5 | 1145 | 905 | 79 | 4454 | 3727 | 83.7 | 0.561 |
| GMN | 963 | 696 | 72.3 | 801 | 700 | 87.4 | 1122 | 1019 | 90.8 | 1260 | 1167 | 92.6 | 1258 | 1152 | 91.6 | 5404 | 4734 | 87.6 | 0.462 |
| ACN | 852 | 774 | 90.8 | 811 | 782 | 96.4 | 1125 | 1087 | 96.6 | 1290 | 1150 | 89.1 | 1322 | 1272 | 96.2 | 5400 | 5065 | 93.8 | 0.604 |
| CIP | 789 | 652 | 82.6 | 753 | 686 | 91.1 | 1100 | 954 | 86.7 | 1299 | 1068 | 82.2 | 1300 | 916 | 70.5 | 5241 | 4276 | 81.6 | 0.641 |
| OXN | 350 | 265 | 75.7 | 402 | 273 | 67.9 | 582 | 404 | 69.4 | 654 | 589 | 90.1 | 1101 | 789 | 71.7 | 3089 | 2320 | 75.1 | 0.624 |
| LVX | 300 | 265 | 88.3 | 582 | 321 | 55.2 | 452 | 360 | 79.6 | 542 | 441 | 81.4 | 900 | 745 | 82.8 | 2776 | 2132 | 76.8 | 0.870 |
| NFT | 258 | 137 | 53.1 | 456 | 322 | 70.6 | 652 | 505 | 77.5 | 521 | 478 | 91.7 | 456 | 379 | 83.1 | 2343 | 1821 | 77.7 | 0.106 |
| TGN | 753 | 512 | 68 | 500 | 356 | 71.2 | 587 | 417 | 71 | 530 | 517 | 97.5 | 874 | 639 | 73.1 | 3244 | 2441 | 75.2 | 0.984 |
| CLN | 466 | 378 | 81.1 | 665 | 654 | 98.3 | 1200 | 1179 | 98.3 | 529 | 517 | 97.7 | 1199 | 1023 | 85.3 | 4059 | 3751 | 92.4 | 0.736 |
| Pseudomonas species | 2015 | 2016 | 2017 | 2018 | 2019 | Total | P-value* | ||||||||||||
|---|---|---|---|---|---|---|---|---|---|---|---|---|---|---|---|---|---|---|---|
| (N = 850 isolates) | (N = 806 isolates) | (N = 696 isolates) | (N = 733 isolates) | (N = 837 isolates) | (N = 3,922 isolates) | ||||||||||||||
| T | S | S% | T | S | S% | T | S | S% | T | S | S% | T | S | S% | T | S | S% | ||
| AMP | 221 | 46 | 20.8 | 400 | 193 | 48.3 | 333 | 269 | 80.8 | 401 | 377 | 94 | 514 | 441 | 85.8 | 1869 | 1326 | 70.9 | 0.636 |
| AMX/CLA | 410 | 296 | 72.2 | 147 | 78 | 53.1 | 415 | 300 | 72.3 | 159 | 94 | 59.1 | 652 | 416 | 63.8 | 1783 | 1184 | 66.4 | 0.519 |
| CZN | 119 | 61 | 51.3 | 302 | 111 | 36.8 | 512 | 264 | 51.6 | 412 | 303 | 73.5 | 452 | 329 | 72.8 | 1797 | 1068 | 59.4 | 0.046 |
| CRX | 300 | 109 | 36.3 | 411 | 178 | 43.3 | 466 | 222 | 47.6 | 454 | 301 | 66.3 | 552 | 489 | 88.6 | 2183 | 1299 | 59.5 | 0.188 |
| CFX | 147 | 76 | 51.7 | 430 | 188 | 43.7 | 501 | 249 | 49.7 | 541 | 334 | 61.7 | 611 | 401 | 65.6 | 2230 | 1248 | 56 | 0.186 |
| CTM | 109 | 29 | 26.6 | 156 | 67 | 42.9 | 247 | 110 | 44.5 | 268 | 137 | 51.1 | 254 | 133 | 52.4 | 1034 | 476 | 46 | 0.923 |
| CTX | 358 | 276 | 77.1 | 547 | 369 | 67.5 | 240 | 110 | 45.8 | 260 | 137 | 52.7 | 219 | 133 | 60.7 | 1624 | 1025 | 63.1 | 0.746 |
| CZM | 800 | 676 | 84.5 | 789 | 686 | 86.9 | 614 | 495 | 80.6 | 660 | 480 | 72.7 | 653 | 558 | 85.5 | 3516 | 2895 | 82.3 | 0.952 |
| CPM | 598 | 300 | 50.2 | 658 | 567 | 86.2 | 611 | 512 | 83.8 | 614 | 500 | 81.4 | 678 | 568 | 83.8 | 3159 | 2447 | 77.5 | 0.961 |
| IPM | 753 | 541 | 71.8 | 782 | 614 | 78.5 | 660 | 574 | 87 | 603 | 576 | 95.5 | 801 | 710 | 88.6 | 3599 | 3015 | 83.8 | 0.925 |
| MPM | 741 | 564 | 76.1 | 788 | 617 | 78.3 | 671 | 570 | 84.9 | 654 | 582 | 89 | 822 | 713 | 86.7 | 3676 | 3046 | 82.9 | 0.944 |
| PIP-TZP | 820 | 631 | 77 | 799 | 692 | 86.6 | 680 | 590 | 86.8 | 721 | 608 | 84.3 | 810 | 742 | 91.6 | 3830 | 3263 | 85.2 | 0.956 |
| TMP-SMZ | 658 | 321 | 48.8 | 654 | 456 | 69.7 | 514 | 477 | 92.8 | 654 | 522 | 79.8 | 769 | 687 | 89.3 | 3249 | 2463 | 75.8 | 0.535 |
| GMN | 830 | 744 | 89.6 | 800 | 730 | 91.3 | 688 | 642 | 93.3 | 701 | 672 | 95.9 | 780 | 759 | 97.3 | 3799 | 3547 | 93.4 | 0.989 |
| ACN | 840 | 755 | 89.9 | 801 | 756 | 94.4 | 680 | 665 | 97.8 | 699 | 686 | 98.1 | 820 | 784 | 95.6 | 3840 | 3646 | 94.9 | 0.990 |
| CIP | 801 | 631 | 78.8 | 771 | 646 | 83.8 | 670 | 604 | 90.1 | 652 | 597 | 91.6 | 700 | 667 | 95.3 | 3594 | 145 | 87.5 | 0.997 |
| OXN | 80 | 13 | 16.3 | 154 | 71 | 46.1 | 230 | 110 | 47.8 | 325 | 187 | 57.5 | 400 | 191 | 47.8 | 1189 | 572 | 48.1 | 0.030 |
| LVX | 775 | 608 | 78.5 | 658 | 492 | 74.8 | 677 | 369 | 54.5 | 541 | 359 | 66.4 | 521 | 381 | 73.1 | 3172 | 2209 | 69.6 | 0.921 |
| NFT | 302 | 111 | 36.8 | 321 | 128 | 39.9 | 321 | 177 | 55.1 | 428 | 201 | 47 | 451 | 290 | 64.3 | 1823 | 907 | 49.8 | 0.491 |
| TGN | 346 | 339 | 98 | 420 | 409 | 97.4 | 511 | 498 | 97.5 | 541 | 533 | 98.5 | 681 | 678 | 99.6 | 2499 | 2457 | 98.3 | 0.142 |
| CLN | 711 | 706 | 99.3 | 670 | 661 | 98.7 | 587 | 571 | 97.3 | 301 | 291 | 96.7 | 328 | 321 | 97.9 | 2597 | 2550 | 98.2 | 0.853 |
| Acinetobacter species | 2015 | 2016 | 2017 | 2018 | 2019 | Total | P-value* | ||||||||||||
|---|---|---|---|---|---|---|---|---|---|---|---|---|---|---|---|---|---|---|---|
| (N = 611 isolates) | (N = 275 isolates) | (N = 280 isolates) | (N = 262 isolates) | (N = 182 isolates) | (N = 1,610 isolates) | ||||||||||||||
| T | S | S% | T | S | S% | T | S | S% | T | S | S% | T | S | S% | T | S | S% | ||
| AMP | 90 | 33 | 36.7 | 150 | 74 | 49.3 | 320 | 110 | 34.4 | 264 | 130 | 49.2 | 275 | 142 | 51.6 | 1099 | 489 | 44.5 | 0.262 |
| AMX/CLA | 110 | 29 | 26.4 | 120 | 53 | 44.2 | 168 | 76 | 45.2 | 191 | 91 | 47.6 | 201 | 103 | 51.2 | 790 | 352 | 44.6 | 0.291 |
| CZN | 60 | 19 | 31.7 | 60 | 21 | 35 | 96 | 29 | 30.2 | 67 | 34 | 50.7 | 79 | 44 | 55.7 | 362 | 147 | 40.6 | 0.538 |
| CRX | 75 | 24 | 32 | 82 | 36 | 43.9 | 78 | 33 | 42.3 | 86 | 41 | 47.7 | 98 | 53 | 54.1 | 419 | 187 | 44.6 | 0.480 |
| CFX | 64 | 11 | 17.2 | 70 | 24 | 34.3 | 77 | 23 | 29.9 | 76 | 36 | 47.4 | 88 | 47 | 53.4 | 375 | 141 | 37.6 | 0.101 |
| CTM | 58 | 10 | 17.2 | 35 | 10 | 28.6 | 34 | 12 | 35.3 | 39 | 17 | 43.6 | 47 | 26 | 55.3 | 213 | 75 | 35.2 | 0.551 |
| CTX | 86 | 18 | 20.9 | 31 | 14 | 45.2 | 33 | 22 | 66.7 | 71 | 29 | 40.8 | 76 | 38 | 50 | 297 | 121 | 40.7 | 0.478 |
| CZM | 64 | 14 | 21.9 | 43 | 21 | 48.8 | 79 | 33 | 41.8 | 98 | 46 | 46.9 | 98 | 51 | 52 | 382 | 165 | 43.2 | 0.523 |
| CPM | 23 | 3 | 13 | 29 | 11 | 37.9 | 39 | 17 | 43.6 | 70 | 36 | 51.4 | 81 | 43 | 53.1 | 242 | 110 | 45.5 | 0.573 |
| IPM | 240 | 62 | 25.8 | 78 | 35 | 44.9 | 108 | 50 | 46.3 | 130 | 70 | 53.8 | 157 | 79 | 50.3 | 713 | 296 | 41.5 | 0.450 |
| MPM | 149 | 35 | 23.5 | 127 | 62 | 48.8 | 100 | 50 | 50 | 129 | 70 | 54.3 | 171 | 91 | 53.2 | 676 | 308 | 45.6 | 0.112 |
| PIP-TZP | 97 | 17 | 17.5 | 89 | 44 | 49.4 | 70 | 38 | 54.3 | 90 | 47 | 52.2 | 110 | 59 | 53.6 | 456 | 205 | 45 | 0.550 |
| TMP-SMZ | 310 | 75 | 24.2 | 348 | 172 | 49.4 | 287 | 141 | 49.1 | 220 | 115 | 52.3 | 300 | 177 | 59 | 1465 | 680 | 46.4 | 0.420 |
| GMN | 378 | 93 | 24.6 | 186 | 144 | 77.4 | 190 | 88 | 46.3 | 171 | 91 | 53.2 | 240 | 127 | 52.9 | 1165 | 543 | 46.6 | 0.660 |
| ACN | 220 | 49 | 22.3 | 189 | 84 | 44.4 | 121 | 56 | 46.3 | 155 | 80 | 51.6 | 168 | 94 | 56 | 853 | 363 | 42.6 | 0.413 |
| CIP | 127 | 29 | 22.8 | 114 | 49 | 43 | 130 | 59 | 45.4 | 125 | 67 | 53.6 | 148 | 78 | 52.7 | 644 | 282 | 43.8 | 0.415 |
| OXN | 89 | 21 | 23.6 | 94 | 36 | 38.3 | 111 | 48 | 43.2 | 122 | 67 | 54.9 | 139 | 73 | 52.5 | 555 | 245 | 44.1 | 0.322 |
| LVX | 40 | 8 | 20 | 17 | 8 | 47.1 | 36 | 17 | 47.2 | 40 | 24 | 60 | 58 | 33 | 56.9 | 191 | 90 | 47.1 | 0.697 |
| NFT | 128 | 41 | 32 | 321 | 77 | 24 | 310 | 140 | 45.2 | 290 | 151 | 52.1 | 287 | 151 | 52.6 | 1336 | 560 | 41.9 | 0.102 |
| TGN | 369 | 350 | 94.9 | 197 | 188 | 95.4 | 142 | 139 | 97.9 | 148 | 138 | 93.2 | 113 | 108 | 95.6 | 969 | 923 | 95.3 | 0.022 |
| CLN | 401 | 381 | 95 | 134 | 124 | 92.5 | 169 | 164 | 97 | 120 | 116 | 96.7 | 129 | 117 | 90.7 | 953 | 902 | 94.6 | 0.089 |
| Proteus species | 2015 | 2016 | 2017 | 2018 | 2019 | Total | P-value* | ||||||||||||
|---|---|---|---|---|---|---|---|---|---|---|---|---|---|---|---|---|---|---|---|
| (N = 212 isolates) | (N = 192 isolates) | (N = 150 isolates) | (N = 135 isolates) | (N = 197 isolates) | (N = 886 isolates) | ||||||||||||||
| T | S | S% | T | S | S% | T | S | S% | T | S | S% | T | S | S% | T | S | S% | ||
| AMP | 200 | 92 | 46 | 186 | 89 | 47.8 | 74 | 40 | 54.1 | 99 | 59 | 59.6 | 181 | 100 | 55.2 | 740 | 380 | 51.4 | 0.527 |
| AMX/CLA | 201 | 143 | 71.1 | 187 | 146 | 78.1 | 147 | 100 | 68 | 129 | 114 | 88.4 | 170 | 155 | 91.2 | 834 | 658 | 78.9 | 0.797 |
| CZN | 107 | 48 | 44.9 | 180 | 99 | 55 | 140 | 126 | 90 | 125 | 101 | 80.8 | 190 | 132 | 69.5 | 742 | 506 | 68.2 | 0.828 |
| CRX | 83 | 35 | 42.2 | 178 | 44 | 24.7 | 91 | 51 | 56 | 113 | 74 | 65.5 | 130 | 81 | 62.3 | 595 | 285 | 47.9 | 0.863 |
| CFX | 60 | 19 | 31.7 | 62 | 27 | 43.5 | 89 | 49 | 55.1 | 128 | 77 | 60.2 | 191 | 110 | 57.6 | 530 | 282 | 53.2 | 0.266 |
| CTM | 112 | 36 | 32.1 | 81 | 40 | 49.4 | 78 | 52 | 66.7 | 97 | 64 | 66 | 141 | 76 | 53.9 | 509 | 268 | 52.7 | 0.760 |
| CTX | 203 | 112 | 55.2 | 179 | 133 | 74.3 | 130 | 121 | 93.1 | 127 | 100 | 78.7 | 180 | 161 | 89.4 | 819 | 627 | 76.6 | 0.878 |
| CZM | 150 | 77 | 51.3 | 150 | 70 | 46.7 | 136 | 115 | 84.6 | 131 | 79 | 60.3 | 174 | 116 | 66.7 | 741 | 457 | 61.7 | 0.913 |
| CPM | 90 | 41 | 45.6 | 128 | 63 | 49.2 | 137 | 71 | 51.8 | 131 | 118 | 90.1 | 179 | 127 | 70.9 | 665 | 420 | 63.2 | 0.692 |
| IPM | 130 | 61 | 46.9 | 167 | 78 | 46.7 | 141 | 102 | 72.3 | 133 | 127 | 95.5 | 160 | 140 | 87.5 | 731 | 508 | 69.5 | 0.619 |
| MPM | 200 | 121 | 60.5 | 189 | 150 | 79.4 | 149 | 130 | 87.2 | 121 | 101 | 83.5 | 189 | 179 | 94.7 | 848 | 681 | 80.3 | 0.821 |
| PIP-TZP | 199 | 113 | 56.8 | 180 | 129 | 71.7 | 147 | 122 | 83 | 129 | 119 | 92.2 | 179 | 161 | 89.9 | 834 | 644 | 77.2 | 0.935 |
| TMP-SMZ | 131 | 64 | 48.9 | 179 | 78 | 43.6 | 140 | 98 | 70 | 118 | 100 | 84.7 | 189 | 109 | 57.7 | 757 | 449 | 59.3 | 0.598 |
| GMN | 141 | 88 | 62.4 | 167 | 109 | 65.3 | 145 | 140 | 96.6 | 120 | 102 | 85 | 170 | 148 | 87.1 | 743 | 587 | 79 | 0.417 |
| ACN | 198 | 115 | 58.1 | 169 | 138 | 81.7 | 140 | 131 | 93.6 | 129 | 117 | 90.7 | 181 | 173 | 95.6 | 817 | 674 | 82.5 | 0.871 |
| CIP | 191 | 93 | 48.7 | 187 | 108 | 57.8 | 135 | 133 | 98.5 | 131 | 122 | 93.1 | 179 | 147 | 82.1 | 823 | 603 | 73.3 | 0.775 |
| OXN | 76 | 30 | 39.5 | 71 | 39 | 54.9 | 70 | 40 | 57.1 | 109 | 61 | 56 | 131 | 77 | 58.8 | 457 | 247 | 54 | 0.588 |
| LVX | 40 | 17 | 42.5 | 40 | 22 | 55 | 66 | 37 | 56.1 | 97 | 55 | 56.7 | 137 | 81 | 59.1 | 380 | 212 | 55.8 | 0.218 |
| NFT | 197 | 91 | 46.2 | 180 | 119 | 66.1 | 135 | 131 | 97 | 127 | 110 | 86.6 | 187 | 140 | 74.9 | 826 | 591 | 71.5 | 0.871 |
| TGN | 190 | 176 | 92.6 | 188 | 178 | 94.7 | 139 | 134 | 96.4 | 130 | 123 | 94.6 | 191 | 188 | 98.4 | 838 | 799 | 95.3 | 0.759 |
| CLN | 179 | 166 | 92.7 | 183 | 178 | 97.3 | 140 | 133 | 95 | 129 | 124 | 96.1 | 177 | 173 | 97.7 | 808 | 774 | 95.8 | 0.687 |
| Enterobacter and Citrobacter species | 2015 | 2016 | 2017 | 2018 | 2019 | Total | P-value* | ||||||||||||
|---|---|---|---|---|---|---|---|---|---|---|---|---|---|---|---|---|---|---|---|
| (N = 162 isolates) | (N = 135 isolates) | (N = 85 isolates) | (N = 124 isolates) | (N = 297 isolates) | (N = 803 isolates) | ||||||||||||||
| T | S | S% | T | S | S% | T | S | S% | T | S | S% | T | S | S% | T | S | S% | ||
| AMP | 66 | 32 | 48.5 | 90 | 40 | 44.4 | 60 | 54 | 90 | 90 | 70 | 77.8 | 184 | 165 | 89.7 | 490 | 361 | 73.7 | 0.023 |
| AMX/CLA | 39 | 17 | 43.6 | 36 | 11 | 30.6 | 60 | 29 | 48.3 | 66 | 40 | 60.6 | 83 | 60 | 72.3 | 284 | 157 | 55.3 | 0.084 |
| CZN | 41 | 21 | 51.2 | 58 | 27 | 46.6 | 51 | 31 | 60.8 | 118 | 60 | 50.8 | 159 | 141 | 88.7 | 427 | 280 | 65.6 | 0.068 |
| CRX | 58 | 27 | 46.6 | 78 | 33 | 42.3 | 78 | 41 | 52.6 | 120 | 66 | 55 | 87 | 71 | 81.6 | 421 | 238 | 56.5 | 0.003 |
| CFX | 60 | 21 | 35 | 70 | 36 | 51.4 | 77 | 47 | 61 | 85 | 46 | 54.1 | 79 | 53 | 67.1 | 371 | 203 | 54.7 | 0.801 |
| CTM | 81 | 33 | 40.7 | 89 | 44 | 49.4 | 69 | 53 | 76.8 | 80 | 59 | 73.8 | 93 | 67 | 72 | 412 | 256 | 62.1 | 0.803 |
| CTX | 41 | 23 | 56.1 | 89 | 46 | 51.7 | 80 | 66 | 82.5 | 100 | 79 | 79 | 157 | 129 | 82.2 | 467 | 343 | 73.4 | 0.548 |
| CZM | 49 | 24 | 49 | 102 | 56 | 54.9 | 83 | 62 | 74.7 | 81 | 66 | 81.5 | 107 | 93 | 86.9 | 422 | 301 | 71.3 | 0.409 |
| CPM | 88 | 45 | 51.1 | 128 | 72 | 56.3 | 80 | 79 | 98.8 | 122 | 114 | 93.4 | 151 | 126 | 83.4 | 569 | 436 | 76.6 | 0.791 |
| IPM | 132 | 69 | 52.3 | 130 | 80 | 61.5 | 85 | 81 | 95.3 | 120 | 105 | 87.5 | 180 | 154 | 85.6 | 647 | 489 | 75.6 | 0.171 |
| MPM | 141 | 75 | 53.2 | 131 | 82 | 62.6 | 84 | 80 | 95.2 | 119 | 105 | 88.2 | 221 | 161 | 72.9 | 696 | 503 | 72.3 | 0.596 |
| PIP-TZP | 120 | 60 | 50 | 110 | 67 | 60.9 | 78 | 61 | 78.2 | 121 | 116 | 95.9 | 160 | 135 | 84.4 | 589 | 439 | 74.5 | 0.180 |
| TMP-SMZ | 128 | 65 | 50.8 | 122 | 73 | 59.8 | 79 | 63 | 79.7 | 118 | 101 | 85.6 | 174 | 144 | 82.8 | 621 | 446 | 71.8 | 0.378 |
| GMN | 100 | 59 | 59 | 112 | 61 | 54.5 | 80 | 66 | 82.5 | 122 | 101 | 82.8 | 188 | 154 | 81.9 | 602 | 441 | 73.3 | 0.417 |
| ACN | 160 | 85 | 53.1 | 125 | 75 | 60 | 81 | 70 | 86.4 | 123 | 114 | 92.7 | 229 | 160 | 69.9 | 718 | 504 | 70.2 | 0.666 |
| CIP | 134 | 77 | 57.5 | 130 | 81 | 62.3 | 84 | 69 | 82.1 | 123 | 117 | 95.1 | 189 | 149 | 78.8 | 660 | 493 | 74.7 | 0.428 |
| OXN | 130 | 72 | 55.4 | 133 | 96 | 72.2 | 84 | 60 | 71.4 | 115 | 96 | 83.5 | 153 | 131 | 85.6 | 615 | 455 | 74 | 0.868 |
| LVX | 60 | 33 | 55 | 98 | 48 | 49 | 67 | 57 | 85.1 | 94 | 81 | 86.2 | 147 | 116 | 78.9 | 466 | 335 | 71.9 | 0.166 |
| NFT | 63 | 26 | 41.3 | 91 | 76 | 83.5 | 81 | 63 | 77.8 | 88 | 54 | 61.4 | 151 | 118 | 78.1 | 474 | 337 | 71.1 | 0.430 |
| TGN | 149 | 136 | 91.3 | 127 | 120 | 94.5 | 83 | 80 | 96.4 | 114 | 110 | 96.5 | 288 | 278 | 96.5 | 761 | 724 | 95.1 | 0.180 |
| CLN | 143 | 122 | 85.3 | 130 | 123 | 94.6 | 76 | 71 | 93.4 | 116 | 111 | 95.7 | 280 | 279 | 99.6 | 745 | 706 | 94.8 | 0.370 |
| Overall | 2015 | 2016 | 2017 | 2018 | 2019 | Total | P-value* | ||||||||||||
|---|---|---|---|---|---|---|---|---|---|---|---|---|---|---|---|---|---|---|---|
| (N = 5,316 isolates) | (N = 4,705 isolates) | (N = 5,019 isolates) | (N = 5,696 isolates) | (N = 7,018 isolates) | (N = 27,754 isolates) | ||||||||||||||
| T | S | S% | T | S | S% | T | S | S% | T | S | S% | T | S | S% | T | S | S% | ||
| AMP | 1977 | 1170 | 59.2 | 2178 | 1361 | 62.5 | 2166 | 1370 | 63.3 | 2755 | 2234 | 81.1 | 3466 | 2835 | 81.8 | 12,542 | 8970 | 71.5 | 0.683 |
| AMX/CLA | 3334 | 2698 | 80.9 | 3244 | 2658 | 81.9 | 3799 | 3220 | 84.8 | 4246 | 3603 | 84.9 | 5260 | 4298 | 81.7 | 19,883 | 16,477 | 82.9 | 0.976 |
| CZN | 819 | 350 | 42.7 | 1999 | 1411 | 70.6 | 1921 | 1276 | 66.4 | 2271 | 1596 | 70.3 | 3485 | 2520 | 72.3 | 10,495 | 7153 | 68.2 | 0.375 |
| CRX | 1958 | 1078 | 55.1 | 2132 | 1256 | 58.9 | 1618 | 1003 | 62 | 2206 | 1568 | 71.1 | 3817 | 2568 | 67.3 | 11,731 | 7473 | 63.7 | 0.662 |
| CFX | 2999 | 1390 | 46.3 | 1679 | 1092 | 65 | 1952 | 1095 | 56.1 | 2184 | 1635 | 74.9 | 2304 | 1414 | 61.4 | 11,118 | 6626 | 59.6 | 0.961 |
| CTM | 928 | 443 | 47.7 | 960 | 529 | 55.1 | 1139 | 569 | 50 | 1345 | 701 | 52.1 | 1547 | 690 | 44.6 | 5919 | 2932 | 49.5 | 0.911 |
| CTX | 3829 | 2736 | 71.5 | 3433 | 2826 | 82.3 | 3185 | 2699 | 84.7 | 4001 | 3366 | 84.1 | 5724 | 4319 | 75.5 | 20,172 | 15,946 | 79.1 | 0.975 |
| CZM | 3682 | 2217 | 60.2 | 2565 | 2055 | 80.1 | 3604 | 2231 | 61.9 | 3178 | 2340 | 73.6 | 3573 | 2598 | 72.7 | 16,602 | 11,441 | 68.9 | 0.998 |
| CPM | 2696 | 1706 | 63.3 | 3584 | 3077 | 85.9 | 3988 | 3288 | 82.4 | 4503 | 3755 | 83.4 | 5310 | 4527 | 85.3 | 20,081 | 16,353 | 81.4 | 0.866 |
| IPM | 4693 | 3962 | 84.4 | 4347 | 3746 | 86.2 | 4614 | 4315 | 93.5 | 5357 | 5155 | 96.2 | 6738 | 6221 | 92.3 | 25,749 | 23,399 | 90.9 | 0.965 |
| MPM | 4511 | 3949 | 87.5 | 4400 | 3880 | 88.2 | 4538 | 4326 | 95.3 | 5388 | 5113 | 94.9 | 6814 | 6270 | 92 | 25,651 | 23,538 | 91.8 | 0.966 |
| PIP-TZP | 4347 | 3722 | 85.6 | 4266 | 3742 | 87.7 | 4561 | 4066 | 89.1 | 5197 | 4793 | 92.2 | 6255 | 5536 | 88.5 | 24,626 | 21,859 | 88.8 | 0.981 |
| TMP-SMZ | 3337 | 2353 | 70.5 | 3707 | 2838 | 76.6 | 3630 | 2816 | 77.6 | 4219 | 3516 | 83.3 | 5475 | 4611 | 84.2 | 20,368 | 16,134 | 79.2 | 0.869 |
| GMN | 4635 | 3808 | 82.2 | 4380 | 3922 | 89.5 | 4525 | 4079 | 90.1 | 5339 | 4875 | 91.3 | 6627 | 5929 | 89.5 | 25,506 | 22,613 | 88.7 | 0.967 |
| ACN | 4740 | 3913 | 82.6 | 4484 | 4235 | 94.4 | 4637 | 4423 | 95.4 | 5426 | 5156 | 95 | 6830 | 6513 | 95.4 | 26,117 | 24,240 | 92.8 | 0.960 |
| CIP | 4043 | 3208 | 79.3 | 3954 | 3374 | 85.3 | 3919 | 3556 | 90.7 | 5119 | 4211 | 82.3 | 5524 | 4908 | 88.8 | 22,559 | 19,257 | 85.4 | 0.971 |
| OXN | 1861 | 1186 | 63.7 | 1961 | 1424 | 72.6 | 1777 | 1274 | 71.7 | 2023 | 1548 | 76.5 | 2611 | 1703 | 65.2 | 10,233 | 7135 | 69.7 | 0.985 |
| LVX | 2362 | 1716 | 72.7 | 2560 | 1809 | 70.7 | 1863 | 1278 | 68.6 | 2679 | 1976 | 73.8 | 3540 | 2749 | 77.7 | 13,004 | 9528 | 73.3 | 0.847 |
| NFT | 2403 | 1647 | 68.5 | 3780 | 3039 | 80.4 | 3924 | 3330 | 84.9 | 4359 | 3698 | 84.8 | 5428 | 4868 | 89.7 | 19,894 | 16,582 | 83.4 | 0.921 |
| TGN | 4184 | 3782 | 90.4 | 3882 | 3671 | 94.6 | 3962 | 3767 | 95.1 | 4546 | 4490 | 98.8 | 6291 | 6022 | 95.7 | 22,865 | 21,732 | 95 | 0.968 |
| CLN | 3265 | 2859 | 87.6 | 2912 | 2462 | 84.5 | 2961 | 2688 | 90.8 | 3224 | 2175 | 67.5 | 6124 | 5887 | 96.1 | 18,486 | 16,071 | 86.9 | 0.608 |
N number of pathogens causing healthcare-associated infections, T number of tested isolates, S number of susceptible pathogens, S (%) percentage of susceptible pathogens, AMP ampicillin, AMX/CLA amoxicillin/clavulanic acid, CZN cefazolin, CRX cefuroxime, CFX cefixime, CTM cefotaxime, CTX ceftriaxone, CZM ceftazidime, CPM cefepime, IPM imipenem, MPM meropenem, PIP-TZP piperacillin/tazobactam, TMP-SMZ trimethoprim-sulfamethoxazole, GMN gentamicin, ACN amikacin, CIP ciprofloxacin, OXN ofloxacin, LVX levofloxacin, NFT nitrofurantoin, TGN tigecycline, CLN colistin
*Multivariate analysis of variance (MANOVA) for resistance trend
Generally, the highest susceptibilities of gram-negative pathogens to antimicrobials were seen towards: tigecycline, meropenem, imipenem and amikacin by Escherichia coli, 98.9%, 97.5%, 97.4% and 96.5%, respectively; amikacin, meropenem and colistin by Klebsiella species, 93.8%, 92.4% and 92.4%, respectively; tigecycline, colistin, amikacin and gentamicin by Pseudomonas species, 98.3%, 98.2%, 94.9% and 93.4%, respectively; tigecycline and colistin by Acinetobacter species, 95.3% and 94.6%, respectively; colistin and tigecycline by Proteus species, 95.8% and 95.3%, respectively; and tigecycline and colistin by Enterobacter and Citrobacter sepcies,95.1% and 94.8%, respectively.
Moreover, Escherichia coli was found to be highly sensitive to nitrofurantoin (94.5%), piperacillin-tazobactam (93.6%), gentamicin (92.5%) and ciprofloxacin (90.5%); against Klebsiella species, imipenem, amoxicillin/clavulanic acid, gentamicin and piperacillin-tazobactam retained susceptibility > 85%; Pseudomonas species were sensitive to ciprofloxacin (87.5%), piperacillin-tazobactam (85.2%), imipenem (83.8%), meropenem (82.9%) and ceftazidime (82.3%); Proteus species were sensitive to amikacin (82.5%) and meropenem (80.3%); and Enterobacter and Citrobacter species were sensitive by ≥ 70% to most of the tested antimicrobials over the 5-year period.
In contrary, lowest susceptibilities of gram-negative pathogens to antimicrobials were seen to cefotaxime and cefixime by Acinetobacter species, 35.2% and 37.6%, respectively. Acinetobacter species shown low sensitivity of ≥ 40% almost to all antimicrobials; and both Klebsiella and Pseudomonas species were slightly sensitive to cefotaxime (45% and 46%, respectively).
Over the 5 years, sensitivity of cefazolin and ofloxacin to Pseudomonas species increased significantly (21.5% and 31.5% increase, p-values = 0.046 and 0.030; respectively). The small sensitivity increase of Acinetobacter species towards tigecycline was found to be significant (0.4% increase, p-value = 0.022). In addition, large difference in susceptibility were found for both ampicillin and cefuroxime towards Enterobacter and Citrobacter species (41.2% and 35.1% increase, p-values = 0.023 and 0.003; respectively).
Prominent insignificant increase in the susceptibility of specific gram-negative bacteria to some antimicrobials occurred in 2019 compared to 2015 by: 38.4% for Escherichia coli to cefazolin; 30% for Klebsiella species to nitrofurantoin; and 65%, 52.3%, 40.6%, 33.6% and 31.5% for Pseudomonas species to ampicillin, cefuroxime, trimethoprim-sulfamethoxazole, cefepime and ofloxacin, respectively.
For a 5-year difference, sensitivity of Acinetobacter species to antimicrobials shown many insignificant increases: (rate of sensitivity increase: for cefepime, 40%; for cefotaxime, 38.1%; for levofloxacin, 36.9%; for cefixime, 36.2%; for piperacillin-tazobactam, 36.1%; for trimethoprim-sulfamethoxazole, 34.8%; for amikacin, 33.7%; and for ceftazidime, 30.2%.
Enterobacter and Citrobacter species exhibited most of the sensitivity increase changes to antimicrobials of all gram-negative isolates. In 2019 compared to 2015, Enterobacter and Citrobacter species susceptibility increased insignificantly by: 41.2% for ampicillin; 37.9% for ceftazidime; 37.5% for cefazolin; 36.9% for nitrofurantoin; 35.1% for cefuroxime; 34.4% for piperacillin-tazobactam; 33.3% for imipenem; 32.3% for cefepime; 32.1% for cefixime; 32% for trimethoprim-sulfamethoxazole; 31.3% for cefotaxime; and 30.2% for ofloxacin. However, a big insignificant decrease in susceptibility was seen in 2019 compared to 2015 by cefotaxime for Klebsiella species (41.4%).
Overall, among the studied antibiotics the gram-negative isolates were mostly sensitive to tigecycline (95%) whereas they were resistant to cefotaxime (49.5%) and cefixime (59.6%) (Table 2).
Discussion
This retrospective study describes the distribution of pathogens causing HAIs and susceptibility patterns for a very high number of samples collected from both the ward and clinics in Saudi Arabia from 2015 to 2019, with an emphasis on the antibiotic classes frequently utilized to treat common infections given by a huge national surveillance program. The most commonly encountered organisms were Escherichia coli, Klebsiella species, and Staphylococcus aureus. Though various studies have previously described susceptibility rates in several infectious isolates, Saudi data are limited either to single-center studies [7, 12–20] or to research concentrating on the susceptibility to single or double antimicrobial classes [21–26].
One of the vital findings of the data analysis of this study was the significant increase of sensitivity for overall gram-positive bacteria to nitrofurantoin over the 5 years (30.2% increase, p-value = 0.032). Interestingly, the susceptibility of Staphylococcus aureus to tetracycline; MRSA to gentamicin and clindamycin; CoNS to cefoxitin, tetracycline, clindamycin, trimethoprim-sulfamethoxazole and nitrofurantoin; and Enterococcus species to trimethoprim-sulfamethoxazole, nitrofurantoin and vancomycin; increased insignificantly over time by ≥ 30% although this was likely due to the change of followed guidelines used for antimicrobial susceptibility testing at the Medical Group facilities, a shift from the Clinical and Laboratory Standards Institute (CLSI) to the European Committee on Antimicrobial Susceptibility Testing (EUCAST) [11, 27].
A comparison of the current results with findings from previous studies can offer some validation of the findings of this present study and identify methodological distinctions in their approaches. As expected, HAI events were more frequent in the ICUs (37.2%) compared with non-ICU locations [HAI events in wards and outpatients were 32.9% and 29.9%, respectively], a finding which was previously described in local studies [10, 28] and may reflect the epicenter role of ICU in both infections and antimicrobial resistance. The predominant isolates to cause HAIs were gram-negative organisms (71.9% vs. 28.1%); this finding was similar with many Saudi studies made in different cities in Saudi Arabia including Riyadh [6, 28, 29], Makkah [30, 31], Dhahran [32], Bisha [33], and Aljouf [10]; with the majority being Escherichia coli (38%) accounting approximately for 52.9% of the gram-negative bacterial growth in line with previous national studies [7, 29, 30, 32, 34]. The second predominant isolates of the gram-negative organisms were the Klebsiella species (15.1%), this finding was similar to the bacterial isolates prevalence studies from Dhahran [7], and Riyadh [6]. The proportions of Klebsiella were 17.2% in Dhahran [7], and 14.7% in Riyadh [6]. The culture rate in our study for Proteus species (2.3%) was comparable to previously reported rates in two different studies in Riyadh (1.2% and 1.8%) [6, 35]. Also, the incidence of Acinetobacter species in our study was very close to the rate reported before (4.2% vs 5.5%) [6]; in contrast to the much higher rates found in two separate studies in Riyadh (31.7% and 25.3%) [35, 36]. Our prevalence of Staphylococcus aureus was similar to the rate described in a previous report done in Riyadh (12.6% vs 13.9%) [6]. We report a lower rate of MRSA (15.9%) compared to two previous studies made in Riyadh (24.4% and 30.3%, respectively) [28] but similar to the rate reported before in another study in Riyadh (17.5%) [29]. We report a higher susceptibility of Enterococcus species to vancomycin (85.9% vs 79.7%) compared to one study in Riyadh [6]. In our study, proportion of Pseudomonas species that caused HAIs is less than what was reported in Riyadh (10.1% vs 15.4%) [6]; however, our prevalence was in agreement to the bacterial frequency in a study from Dhahran (12.8%) [7]. Frequency of CoNS in causing HAIs in this study is in line with a study from Riyadh (5.2% vs 6.5%) [6] but much lower than the rate reported previously in a study in Riyadh (28.4%) [29]. In our study, incidence of Enterococcus species as causative pathogens for HAIs is almost half of the reported rate by a study in Riyadh (4.5% vs 8.6%) [6]; however, rate was in parallel to the prevalence reported in other study in Riyadh (5.9%) [28] but contradicts with the rate reported in another study in Riyadh (15.8%) [29].
Our data analysis regarding the susceptibility patterns of antimicrobials confirm or contradict the findings of previous local studies. For example, Pseudomonas and Acinetobacter were most susceptible to colistin and amikacin in a study in Riyadh [29], whereas in our study, tigecycline and colistin had higher susceptibility rates. On the other hand, Escherichia coli, Klebsiella pneumonia, Enterobacter and Citrobacter species were most sensitive to amikacin, imipenem and meropenem [29], whereas in our study, Escherichia coli and Enterobacter and Citrobacter species were most susceptible to tigecycline, and Klebsiella species was most susceptible to amikacin. However, our study support the finding that CoNS were most susceptible to vancomycin and linezolid [29] and we found the susceptibility of Staphylococcus aureus to clindamycin and trimethoprim-sulfamethoxazole were almost identical to the results of the aforementioned study (92% vs 94% and 87.7 vs 87%, respectively). This is might be due the fact that the sample was drawn from tertiary private hospitals in Saudi Arabia where the level of environmental hygiene is higher and staff are highly restricted to infection control practices.
Linezolid and vancomycin had the best susceptibility profile to Staphylococcus aureus, CoNS, and Enterococcus species while gentamicin shown low sensitivity towards MRSA, CoNS and enterococcus species. In the context of emergence of resistance of malicious gram-positive bacteria to gentamicin, linezolid and vancomycin have become effective alternatives to gentamicin treatment frequently associated with nephrotoxicity [37]. Linezolid and vancomycin are active against the most serious gram-positive bacteria, including streptococci, vancomycin-resistant enterococci (VRE) and MRSA [38]. Nevertheless, we noted a low rate of susceptibility of linezolid and vancomycin against MRSA (54.9% and 50.9%, respectively) likely because of antibiotic selection pressure and possibly a reflection of selective reporting of susceptibility testing; this finding contradicts those of a recent study in Riyadh, which identified a 100%-sensitivity of both antimicrobial agents for MRSA [29]. The relatively lower susceptibility in gram-positive bacteria in the current study may be reflecting Saudi prescription trends in recent years that overuse fluoroquinolones [1, 39] and carbapenems [40, 41] at the expenses of other broad-spectrum such as linezolid and vancomycin due to increased availability and reduced cost of these drugs. However, nitrofurantoin maintained the greatest efficacy against MRSA in our study (82.6%); supporting the finding of a recent study in Aseer that shown 100% susceptibility of MRSA to nitrofurantoin [42].
Over the 5-year period, it is interesting to note imipenem and meropenem either retained its activity or shown susceptibility increase patterns towards all the studied gram-negative pathogens except for imipenem which was less sensitive in 2019 by 1.6% against Escherichia coli and for meropenem that shown a minor sensitivity reduction by 8.6% to Klebsiella species. Previous studies from Saudi found high susceptibility of Pseudomonas to carbapenems [7, 41]; however, in other local studies, the susceptibility of Pseudomonas to meropenem declined over a five-year period [29] and nonsusceptibility of Acinetobacter and Pseudomonas aeruginosa to carbapenems was very high (68.3% and 76%) [6, 41]. Furthermore, there were relatively stable susceptibility patterns to all tested antimicrobials, except for cefotaxime which shown a susceptibility reduction by 41.4%, among Escherichia coli and Klebsiella species; in opposite to the finding of a local study in Dhahran that shown a reduction trend in the susceptibility of antibiotics to Escherichia coli and Klebsiella species [7]. Moreover, we observed an increase in the susceptibility of Acinetobacter and Enterobacter and Citrobacter species to all studied antimicrobials except for colistin that had a slight sensitivity reduction by 4.3% against Acinetobacter species. This can be considered as a part of the success of the combating strategies implemented since January 2014 at the medical settings to reduce further emergence and spread of AMR, lower the percentage of HAIs and MDR organisms, and save on needless healthcare expenses [1].
Significant differences in antibiogram findings between different healthcare facilities and regions may suggest differences in populations of the served patients, patterns of antimicrobial use, or deficiencies in hospital infection control and hygiene practices that could be further explored.
Limitations
This study had a few limitations. Firstly, the retrospective design and the risk of misclassification and selection bias. For instance, even though the laboratories follow the highest standards, there may be a possibility that some isolates had some contaminants. Furthermore, since all three hospitals in this study are tertiary care hospitals, they receive more complicated cases that may be caused by resistant pathogens which may not indicate the antibiotic susceptibility trend and microbiology of the general population. Nevertheless, our study’s findings will add to local and global data on antimicrobial susceptibility, especially with highly threatening infections.
Conclusion
Systematic collection and analysis of routine clinical laboratory data is important in assessing the antimicrobial resistance burden. Nationwide surveillance is urgently needed to provide policy makers, antimicrobial stewardship committees, infection preventionists, microbiologists, and epidemiologists with essential information to guide proper action plans. The observed increase in susceptibility of gram-positive and gram-negative bacteria to studied antimicrobials is important; however, reduced sensitivity of MRSA, CoNS and Enterococcus species to gentamicin; and increased resistance of MRSA to linezolid and vancomycin is a serious threat and calls for effective antimicrobial stewardship programs.
Acknowledgements
The authors would like to thank the Microbiology staff at Altakhassusi, Arryan and Qassim HMG Hospitals in Riyadh and Qassim, Saudi Arabia, for identifying all the isolates and for their assistance with data collection. We would also like to thank the reviewers for very helpful and valuable comments and suggestions for improving the paper.
Abbreviations
- AMS
Antimicrobial Stewardship
- HAIs
Healthcare Associated Infections
- MRSA
Methicillin-resistant Staphylococcus aureus
- VRE
Vancomycin-resistant Enterococci
- CoNS
Coagulase-negative Staphylococci
- CLABSI
Central line associated bloodstream infection
- CAUTI
Catheter-associated urinary tract infection
- SSI
Surgical site infection
- VAE
Ventilator-associated events
- HMG
Habib Medical Group
- AMR
Antimicrobial resistance
- MANOVA
Multivariate analysis of variance
- ICUs
Intensive care units
- CLSI
Clinical and Laboratory Standards Institute
- EUCAST
European Committee on Antimicrobial Susceptibility Testing
- ATCC
American Type Culture Collection
Authors’ contributions
Conceptualization, SA, AA and ZA; methodology, SA, AA and AAO; formal analysis, SA, ZA, and AAR; data curation, SA; writing—original draft preparation, SA, AA and AAR; writing—review and editing, SA, AA, ZA, AAR, AJA, AMA, IB, IA, MT, NA, MA, AHA, FA, HA and AAO; supervision, SA, AA and AAO; project administration, SA and AA. All authors read and approved the final manuscript.
Funding
This research received no external funding.
Availability of data and materials
Data are available upon request, please contact author for data requests.
Declarations
Ethics approval and consent to participate
Ethical approval of the current study was obtained from Dr. Sulaiman Habib Institutional Review Board (RC20.10.95-2).
Consent for publication
All authors agreed to this publication.
Competing of interest
The authors have no conflicts of interest to declare.
Footnotes
Publisher's Note
Springer Nature remains neutral with regard to jurisdictional claims in published maps and institutional affiliations.
Contributor Information
Saad Alhumaid, Email: saalhumaid@moh.gov.sa.
Abbas Al Mutair, Email: abbas.almutair@almoosahospital.com.sa.
Zainab Al Alawi, Email: dr_z.alawi@hotmail.com.
Ahmad J. Alzahrani, Email: ajalzahrani@imamu.edu.sa
Mansour Tobaiqy, Email: mtobaiqy@uj.edu.sa.
Ahmed M. Alresasi, Email: aalresasi@moh.gov.sa
Ibrahim Bu-Shehab, Email: ibushehab@moh.gov.sa.
Issa Al-Hadary, Email: ialhadary@moh.gov.sa.
Naif Alhmeed, Email: nalhmeed@moh.gov.sa.
Mossa Alismail, Email: moalsmail@moh.gov.sa.
Ahmed H. Aldera, Email: ahaldera@moh.gov.sa
Fadhil AlHbabi, fadelhh2@googlemail.com.
Haifa Al-Shammari, Email: dr_hf_ksa@hotmail.com.
Ali A. Rabaan, Email: ali.rabaan@jhah.com
Awad Al-Omari, Email: research.center@drsulaimanalhabib.com.
References
- 1.Al-Omari A, Al Mutair A, Alhumaid S, Salih S, Alanazi A, Albarsan H, Abourayan M, Al SM. The impact of antimicrobial stewardship program implementation at four tertiary private hospitals: results of a five-years pre-post analysis. Antimicrob Resist Infect Control. 2020;9(1):1–9. doi: 10.1186/s13756-020-00751-4. [DOI] [PMC free article] [PubMed] [Google Scholar]
- 2.Cassini A, Högberg LD, Plachouras D, Quattrocchi A, Hoxha A, Simonsen GS, Colomb-Cotinat M, Kretzschmar ME, Devleesschauwer B, Cecchini M. Attributable deaths and disability-adjusted life-years caused by infections with antibiotic-resistant bacteria in the EU and the European Economic Area in 2015: a population-level modelling analysis. Lancet Infect Dis. 2019;19(1):56–66. doi: 10.1016/S1473-3099(18)30605-4. [DOI] [PMC free article] [PubMed] [Google Scholar]
- 3.O’neill J. Review on antimicrobial resistance. Tackling drug-resistant infection globally: final report and recommendations. UK Government, Wellcome Trust. 2016.
- 4.Alrasheedy AA, Alsalloum MA, Almuqbil FA, Almuzaini MA, Aba Alkhayl BS, Albishri AS, Alharbi FF, Alharbi SR, Alodhayb AK, Alfadl AA. The impact of law enforcement on dispensing antibiotics without prescription: a multi-methods study from Saudi Arabia. Expert Rev Anti Infect Ther. 2020;18(1):87–97. doi: 10.1080/14787210.2020.1705156. [DOI] [PubMed] [Google Scholar]
- 5.Al Mutair A, Alhumaid S, Al Alawi Z, Zaidi ARZ, Alzahrani AJ, Al-Tawfiq JA, Al-Shammari H, Rabaan AA, Khojah O, Al-Omari A. Five-year resistance trends in pathogens causing healthcare-associated infections at a multi-hospital healthcare system in Saudi Arabia, 2015–2019. J Global Antimicrob Resist. 2021;25:142–150. doi: 10.1016/j.jgar.2021.03.009. [DOI] [PubMed] [Google Scholar]
- 6.Balkhy HH, El-Saed A, Alshamrani MM, Alsaedi A, Al Nasser W, El Gammal A, Aljohany SM, Almunif S, Arabi Y, Alqahtani S. Ten-year resistance trends in pathogens causing healthcare-associated infections; reflection of infection control interventions at a multi-hospital healthcare system in Saudi Arabia, 2007–2016. Antimicrob Resist Infect Control. 2020;9(1):21. doi: 10.1186/s13756-020-0678-0. [DOI] [PMC free article] [PubMed] [Google Scholar]
- 7.Al-Tawfiq JA, Rabaan AA, Saunar JV, Bazzi AM. Antimicrobial resistance of gram-negative bacteria: a six-year longitudinal study in a hospital in Saudi Arabia. J Infect Public Health. 2020;13:737–745. doi: 10.1016/j.jiph.2020.01.004. [DOI] [PubMed] [Google Scholar]
- 8.Almangour TA, Alenazi B, Ghonem L, Alhifany AA, Aldakheel BA, Alruwaili A. Inhaled colistin for the treatment of nosocomial pneumonia due to multidrug-resistant gram-negative bacteria: a real-life experience in tertiary care hospitals in Saudi Arabia. Saudi Pharmaceut J. 2020;28(8):1009–1013. doi: 10.1016/j.jsps.2020.06.023. [DOI] [PMC free article] [PubMed] [Google Scholar]
- 9.Batool S, Almaghaslah D, Alqahtani A, Almanasef M, Alasmari M, Vasudevan R, Attique S, Riaz F. Aetiology and antimicrobial susceptibility pattern of bacterial isolates in community acquired pneumonia patients at Asir region, Saudi Arabia. Int J Clin Pract. 2020;75:e13667. doi: 10.1111/ijcp.13667. [DOI] [PubMed] [Google Scholar]
- 10.Bandy A, Almaeen AH. Pathogenic spectrum of blood stream infections and resistance pattern in gram-negative bacteria from Aljouf region of Saudi Arabia. PLoS ONE. 2020;15(6):e0233704. doi: 10.1371/journal.pone.0233704. [DOI] [PMC free article] [PubMed] [Google Scholar]
- 11.Institute CaLS. M100|Performance standards for antimicrobial susceptibility testing. 30th Edn; 2020.
- 12.Ibrahim ME, Abbas M, Al-Shahrai AM, Elamin BK. Phenotypic characterization and antibiotic resistance patterns of extended-spectrum β-Lactamase-and AmpC β-lactamase-producing gram-negative bacteria in a referral hospital, Saudi Arabia. Canadian J Infect Dis Med Microbiol. 2019;2019:1–9. doi: 10.1155/2019/6054694. [DOI] [PMC free article] [PubMed] [Google Scholar]
- 13.El-Badawy MF, Abdelwahab SF, Alghamdi SA, Shohayeb MM. Characterization of phenotypic and genotypic traits of carbapenem-resistant Acinetobacter baumannii clinical isolates recovered from a tertiary care hospital in Taif, Saudi Arabia. Infect Drug Resist. 2019;12:3113. doi: 10.2147/IDR.S206691. [DOI] [PMC free article] [PubMed] [Google Scholar]
- 14.Farman M, Yasir M, Al-Hindi RR, Farraj SA, Jiman-Fatani AA, Alawi M, Azhar EI. Genomic analysis of multidrug-resistant clinical Enterococcus faecalis isolates for antimicrobial resistance genes and virulence factors from the western region of Saudi Arabia. Antimicrob Resist Infect Control. 2019;8(1):55. doi: 10.1186/s13756-019-0508-4. [DOI] [PMC free article] [PubMed] [Google Scholar]
- 15.Aldrazi FA, Rabaan AA, Alsuliman SA, Aldrazi HA, Alabdalslam MJ, Alsadiq SA, Alhani HM, Bueid AS. ESBL expression and antibiotic resistance patterns in a hospital in Saudi Arabia: do healthcare staff have the whole picture? J Infect Public Health. 2020;13(5):759–766. doi: 10.1016/j.jiph.2019.12.001. [DOI] [PubMed] [Google Scholar]
- 16.Albarrag A, Shami A, Almutairi A, Alsudairi S, Aldakeel S, Al-Amodi A. Prevalence and molecular genetics of methicillin-resistant Staphylococcus aureus colonization in nursing homes in Saudi Arabia. Canadian J Infect Dis Med Microbiol. 2020;2020:1–6. doi: 10.1155/2020/2434350. [DOI] [PMC free article] [PubMed] [Google Scholar]
- 17.Alqasim A, Jaffal AA, Almutairi N, Arshad M, Alyousef AA. Isolation, phenotypic and genotypic characterization of Escherichia coli from the bloodstream samples in Riyadh, Saudi Arabia. J King Saud Univ Sci. 2020;32(2):1464–1469. doi: 10.1016/j.jksus.2019.11.043. [DOI] [Google Scholar]
- 18.Al Bshabshe A, Al-Hakami A, Alshehri B, Al-Shahrani KA, Alshehri AA, Al Shahrani MB, Assiry I, Joseph MR, Alkahtani A, Hamid ME. Rising Klebsiella pneumoniae infections and its expanding drug resistance in the intensive care unit of a tertiary Healthcare Hospital, Saudi Arabia. Cureus. 2020;12(8). [DOI] [PMC free article] [PubMed]
- 19.Alsaleh NA, Al-Omar HA, Mayet AY, Mullen AB. Evaluating the appropriateness of carbapenem and piperacillin-tazobactam prescribing in a tertiary care hospital in Saudi Arabia. Saudi Pharmaceut J. 2020;28:1492–1498. doi: 10.1016/j.jsps.2020.09.015. [DOI] [PMC free article] [PubMed] [Google Scholar]
- 20.Alnimr AM, Alamri AM. Antimicrobial activity of cephalosporin-beta-lactamase inhibitor combinations against drug-susceptible and drug-resistant Pseudomonas aeruginosa strains. J Taibah Univ Med Sci. 2020;15(3):203. doi: 10.1016/j.jtumed.2020.04.004. [DOI] [PMC free article] [PubMed] [Google Scholar]
- 21.Alghoribi MF, Doumith M, Upton M, Al Johani SM, Alzayer M, Woodford N, Ellington MJ, Balkhy HH. Complete Genome Sequence of a Colistin-Resistant Uropathogenic Escherichia coli Sequence Type 131 fimH22 Strain Harboring mcr-1 on an IncHI2 Plasmid, Isolated in Riyadh, Saudi Arabia. Microbiology resource announcements. 2019;8(18). [DOI] [PMC free article] [PubMed]
- 22.Ishaqui AA, Khan AH, Sulaiman SAS, Alsultan MT, Khan I, Naqvi AA. Assessment of efficacy of Oseltamivir-Azithromycin combination therapy in prevention of Influenza-A (H1N1) pdm09 infection complications and rapidity of symptoms relief. Expert Rev Respir Med. 2020;14(5):533–541. doi: 10.1080/17476348.2020.1730180. [DOI] [PubMed] [Google Scholar]
- 23.Aljihani SA, Alehaideb Z, Alarfaj RE, Alghoribi MF, Akiel MA, Alenazi TH, Al-Fahad AJ, Al Tamimi SM, Albakr TM, Alshehri A. Enhancing azithromycin antibacterial activity by encapsulation in liposomes/liposomal-N-acetylcysteine formulations against resistant clinical strains of Escherichia coli. Saudi J Biol Sci. 2020;27(11):3065–3071. doi: 10.1016/j.sjbs.2020.09.012. [DOI] [PMC free article] [PubMed] [Google Scholar]
- 24.Eed EM, Hawash YA, Khalifa AS, Alsharif KF, Alghamdi SA, Saber T, Ismail KA, Shehab-Eldeen SA. Molecular diagnosis of Helicobacter pylori antibiotic resistance in the Taif region, Saudi Arabia. Microbiol Immunol. 2019;63(6):199–205. doi: 10.1111/1348-0421.12686. [DOI] [PubMed] [Google Scholar]
- 25.Al-Zahrani IA, Al-Ahmadi BM. Dissemination of VIM-producing Pseudomonas aeruginosa associated with high-risk clone ST654 in a tertiary and quaternary hospital in Makkah, Saudi Arabia. J Chemother. 2020;33:1–9. doi: 10.1080/1120009X.2020.1785741. [DOI] [PubMed] [Google Scholar]
- 26.El-Badawy MF, Alrobaian MM, Shohayeb MM, Abdelwahab SF. Investigation of six plasmid-mediated quinolone resistance genes among clinical isolates of pseudomonas: a genotypic study in Saudi Arabia. Infect Drug Resist. 2019;12:915. doi: 10.2147/IDR.S203288. [DOI] [PMC free article] [PubMed] [Google Scholar]
- 27.Balkhy HH, El-Saed A, Alshamrani MM, Alsaedi A, Al Nasser W, El Gammal A, Aljohany SM, Arabi Y, Alqahtani S, Bonnie HB. High Burden of resistant gram negative pathogens causing device-associated healthcare infections in a tertiary care setting in Saudi Arabia, 2008–2016. J Global Antimicrob Resist. 2020;23:26–32. doi: 10.1016/j.jgar.2020.07.013. [DOI] [PubMed] [Google Scholar]
- 28.El-Saed A, Balkhy HH, Alshamrani MM, Aljohani S, Alsaedi A, Al Nasser W, El Gammal A, Almohrij SA, Alyousef Z, Almunif S. High contribution and impact of resistant gram negative pathogens causing surgical site infections at a multi-hospital healthcare system in Saudi Arabia, 2007–2016. BMC Infect Dis. 2020;20:1–9. doi: 10.1186/s12879-020-4939-6. [DOI] [PMC free article] [PubMed] [Google Scholar]
- 29.Farah SM, Alshehri MA, Alfawaz TS, Alasmeri FA, Alageel AA, Alshahrani DA. Trends in antimicrobial susceptibility patterns in King Fahad Medical City, Riyadh, Saudi Arabia. Saudi Med J. 2019;40(3):252. doi: 10.15537/smj.2019.3.23947. [DOI] [PMC free article] [PubMed] [Google Scholar]
- 30.Haseeb A, Faidah HS, Bakhsh AR, AlMalki WH, Elrggal ME, Saleem F, ur Rahman S, Khan TM, Hassali MA. Antimicrobial resistance among pilgrims: a retrospective study from two hospitals in Makkah, Saudi Arabia. Int J Infect Dis. 2016;47:92–94. doi: 10.1016/j.ijid.2016.06.006. [DOI] [PubMed] [Google Scholar]
- 31.Asghar AH, Faidah HS. Frequency and antimicrobial susceptibility of gram-negative bacteria isolated from 2 hospitals in Makkah, Saudi Arabia. Saudi Med J. 2009;30(8):1017–1023. [PubMed] [Google Scholar]
- 32.Al-Tawfiq JA, Anani AA. Antimicrobial susceptibility pattern of bacterial pathogens causing urinary tract infections in a Saudi Arabian hospital. Chemotherapy. 2009;55(2):127–131. doi: 10.1159/000198698. [DOI] [PubMed] [Google Scholar]
- 33.Ibrahim ME. High antimicrobial resistant rates among gram-negative pathogens in intensive care units: a retrospective study at a tertiary care hospital in Southwest Saudi Arabia. Saudi Med J. 2018;39(10):1035. doi: 10.15537/smj.2018.10.22944. [DOI] [PMC free article] [PubMed] [Google Scholar]
- 34.Almalki MA, Varghese R. Prevalence of catheter associated biofilm producing bacteria and their antibiotic sensitivity pattern. J King Saud Univ Sci. 2020;32(2):1427–1433. doi: 10.1016/j.jksus.2019.11.037. [DOI] [Google Scholar]
- 35.Al Johani SM, Akhter J, Balkhy H, El-Saed A, Younan M, Memish Z. Prevalence of antimicrobial resistance among gram-negative isolates in an adult intensive care unit at a tertiary care center in Saudi Arabia. Ann Saudi Med. 2010;30(5):364–369. doi: 10.4103/0256-4947.67073. [DOI] [PMC free article] [PubMed] [Google Scholar]
- 36.Memish ZA, Shibl AM, Kambal AM, Ohaly YA, Ishaq A, Livermore DM. Antimicrobial resistance among non-fermenting gram-negative bacteria in Saudi Arabia. J Antimicrob Chemother. 2012;67(7):1701–1705. doi: 10.1093/jac/dks091. [DOI] [PubMed] [Google Scholar]
- 37.Paquette F, Bernier-Jean A, Brunette V, Ammann H, Lavergne V, Pichette V, Troyanov S, Bouchard J. Acute kidney injury and renal recovery with the use of aminoglycosides: a large retrospective study. Nephron. 2015;131(3):153–160. doi: 10.1159/000440867. [DOI] [PubMed] [Google Scholar]
- 38.Beibei L, Yun C, Mengli C, Nan B, Xuhong Y, Rui W. Linezolid versus vancomycin for the treatment of gram-positive bacterial infections: meta-analysis of randomised controlled trials. Int J Antimicrob Agents. 2010;35(1):3–12. doi: 10.1016/j.ijantimicag.2009.09.013. [DOI] [PubMed] [Google Scholar]
- 39.Balkhy HH, El-Saed A, El-Metwally A, Arabi YM, Aljohany SM, Al Zaibag M, Baharoon S, Alothman AF. Antimicrobial consumption in five adult intensive care units: a 33-month surveillance study. Antimicrob Resist Infect Control. 2018;7(1):156. doi: 10.1186/s13756-018-0451-9. [DOI] [PMC free article] [PubMed] [Google Scholar]
- 40.Balkhy H, Al Othman A, Bonnie IB, Arabi Y, El-Saed A. Consumption of carbapenems in different intensive care units in a Saudi tertiary care hospital. Antimicrob Resist Infect Control. 2015;4(1):1-.
- 41.Abdallah M, Badawi M, Amirah MF, Rasheed A, Mady AF, Alodat M, Alharthy A. Impact of carbapenem restriction on the antimicrobial susceptibility pattern of Pseudomonas aeruginosa isolates in the ICU. J Antimicrob Chemother. 2017;72(11):3187–3190. doi: 10.1093/jac/dkx273. [DOI] [PubMed] [Google Scholar]
- 42.Al Bshabshe A, Joseph MR, Awad El-Gied AA, Fadul AN, Chandramoorthy HC, Hamid ME. Clinical relevance and antimicrobial profiling of methicillin-resistant Staphylococcus aureus (MRSA) on routine antibiotics and ethanol extract of Mango Kernel (Mangifera indica L.) BioMed Res Int. 2020;2020:1–8. doi: 10.1155/2020/4150678. [DOI] [PMC free article] [PubMed] [Google Scholar]
Associated Data
This section collects any data citations, data availability statements, or supplementary materials included in this article.
Data Availability Statement
Data are available upon request, please contact author for data requests.