

Abstract
The interfacial tension of phase‐separated biomolecular condensates affects their fusion and multiphase organization, and yet how this important property depends on the composition and interactions of the constituent macromolecules is poorly understood. Here we use molecular dynamics simulations to determine the interfacial tension and phase equilibrium of model condensate‐forming systems. The model systems consist of binary mixtures of Lennard‐Jones particles or chains of such particles. We refer to the two components as drivers and regulators; the former has stronger self‐interactions and hence a higher critical temperature (T c) for phase separation. In previous work, we have shown that, depending on the relative strengths of driver‐regulator and driver‐driver interactions, regulators can either promote or suppress phase separation (i.e., increase or decrease T c). Here we find that the effects of regulators on T c quantitatively match the effects on interfacial tension (γ). This important finding means that, when a condensate‐forming system experiences a change in macromolecular composition or a change in intermolecular interactions (e.g., by mutation or posttranslational modification, or by variation in solvent conditions such as temperature, pH, or salt), the resulting change in T c can be used to predict the change in γ and vice versa. We also report initial results showing that disparity in intermolecular interactions drives multiphase coexistence. These findings provide much needed guidance for understanding how biomolecular condensates mediate cellular functions.
Keywords: biomolecular condensates, interfacial tension, multiphase coexistence, phase equilibrium, phase separation
1. INTRODUCTION
Biomolecular condensates formed via phase separation often appear as micro‐sized liquid droplets. The surface tension, γ, at the interface between the dense phase and the surrounding bulk phase is a very important property that affects the dynamics, organization, and, ultimately, function of biomolecular condensates. Notably, interfacial tension drives the fusion of droplets and is thus a main determinant of fusion speed. 1 , 2 , 3 Experimental studies have revealed that, instead of a single homogeneous phase, condensates, including membraneless organelles such as nucleolus, can occur as multiple coexisting dense phases, each with a distinct composition. 1 , 4 , 5 , 6 , 7 , 8 , 9 , 10 Interfacial tension may play a vital role in the spatial organization of the multiple dense phases. 1 Moreover, the material states of condensates often evolve over time, both for normal cellular functions and as an aberrant transitions. 11 The time evolution is also partly driven by material properties including interfacial tension.
Inside cells, condensates often comprise dozens to hundreds of macromolecular components. 4 The complex composition provides ample opportunities for the perturbation of interfacial tension, by changes in macromolecular composition or their interactions through mutations, posttranslational modifications, and variations in solvent conditions such as temperature, pH, and salt. It is very possible that compositions of condensates are tailored to achieve desired interfacial tensions. 1 However, there is no general understanding of how interfacial tension depends on macromolecular composition.
Many theoretical and computational studies have focused on calculating binodals, that is, coexistence curves between dense and bulk phases. 12 , 13 , 14 , 15 , 16 , 17 , 18 , 19 , 20 These studies, even when based on highly simplified models, have generated far‐reaching conclusions on phase equilibrium. In particular, results for spherical particles and polymer chains, as models for structured and disordered proteins, respectively, have shown that chain systems tend to have a higher critical temperature (T c) and lower densities in both phases. 14 Most relevant for the present study, our computations led to general predictions for how T c is perturbed by compositional changes (Figure 1(a)). 15 , 18 When two macromolecular species is mixed, one capable of phase separation on its own (or doing so at a higher T c) and known as driver whereas the other known as regulator, the change in T c depends on the strength of driver‐regulator attraction (ε DR) and the amount of regulator added. Regulators with ε DR < ε DD (strength of driver self‐attraction) decreases T c and are called weak‐attraction suppressors of phase separation – they do so by partitioning into the dense phase and thereby replacing some of the stronger driver‐driver interactions with weaker driver‐regulator interactions. In contrast, regulators with ε DR > ε DD have the opposite effect at low concentrations and are called strong‐attraction promotors. At higher concentrations, regulator‐regulator interactions in the dense phase start to dominate and hence T c exhibits a turnover. Corresponding effects on the threshold driver concentration for phase separation at a given temperature are predicted, with promotion and suppression of phase separation indicated by decrease and increase of the threshold concentration, respectively. These predictions were validated by our own experiments and also explain many experimental observations reported in the literature. 18 Extending such computations to predict interfacial tension was the main motivation for the present work.
FIGURE 1.
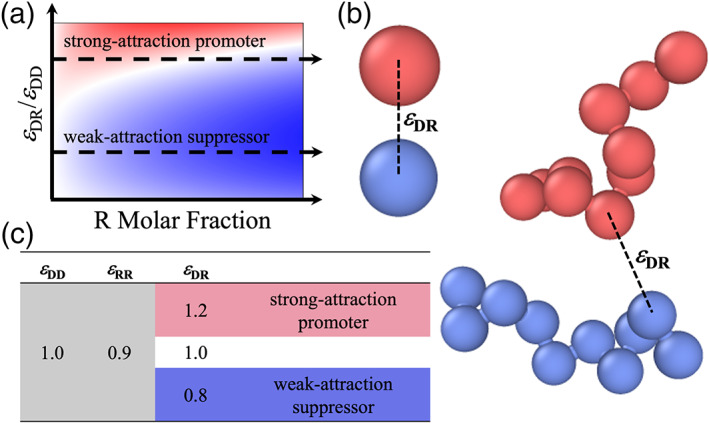
Motivation and general description of the simulation systems. (a) Dependence of the critical temperature for phase separation on the strength of driver‐regulator attraction and the amount of regulator added. Red, white, and blue indicate increase, no change, and decrease in T c, respectively. (b) Illustration of the driver (red) and regulator (blue) particles and chains. (c) Values of the interaction strengths between different species
The calculation of interfacial tensions for phase‐separated model systems has a long history. 21 , 22 , 23 Here we note only a few studies that have direct relevance to the present work. Lee et al 24 and Stephan et al 25 both reported interfacial tensions for binary mixtures of Lennard‐Jones particles. The latter study presented interfacial tensions when the strength of the cross‐species interactions was varied. Silmore et al 26 reported interfacial tensions for pure Lennard‐Jones chains at different lengths. Our work here covers binary mixtures of both Lennard‐Jones particles and Lennard‐Jones chains, over a range of temperatures. Our focus is the relation between T c and γ at a given temperature when the molar ratio of the two species is varied.
The Lennard‐Jones interaction energy between two particles is
| (1) |
where r is the interparticle distance, ε represents the strength of the attraction, and σ denotes the diameter of the particles. For a pure Lennard‐Jones particle system, T c scales with ε. This scaling relation illustrates that phase separation is driven by attractive interactions between constituent macromolecules; the stronger the attraction, the higher the critical temperature for phase separation. An approximate expression for the interfacial tension is 27
| (2) |
where ρ d is the density of the dense phase. This approximation illustrates that the interfacial tension also scales with the interaction strength. Since both T c and γ scale with ε, we can expect correlation between T c and γ when intermolecular interactions are perturbed. Our results below indeed conform to this expectation. We also present unexpected behaviors, indicated by anomalous γ for certain mixtures.
2. RESULTS AND DISCUSSION
We studied binary mixtures of Lennard‐Jones particles or chains comprising 10 such particles (Figure 1(b)). The strength, ε DD, of the self‐interaction of driver particles is assigned a value of 1 to set the energy scale. The counterpart, ε RR, for regulator particles has a value of 0.9. Similar to previous work, 15 , 18 we study three different values for ε DR, that is, 0.8, 1.0, and 1.2 (Figure 1(c)). The first ε DR value is less than ε RR and expected to model weak‐attraction suppressors whereas the third ε DR value is greater than ε DD and expected to model strong‐attraction promotors. For a given ε DR value, we also study the whole range of mixing ratios between driver and regulator particles or chains, with regulator mole fraction, x R, at 0 (pure driver), 0.2, 0.4, 0.6, 0.8, and 1 (pure regulator). Lastly, for each ε DR and x R, we study a range of temperatures, for particles starting at 0.65 and going all the way toward T c with increments of 0.02 whereas for chains starting at 1.7 and going all the way toward T c with increments of 0.1. We use the term ''corresponding'' to refer to a particle system and a chain system that have the same values for ε DR and x R.
The equilibrium between the dense and bulk phases was sampled by molecular dynamics (MD) simulations using the slab method (see Computational Methods). 21 The simulations produce a dense phase, as a slab in the middle, at equilibrium with the bulk phase on the opposite sides, in a rectangular box (Figure 2).
FIGURE 2.
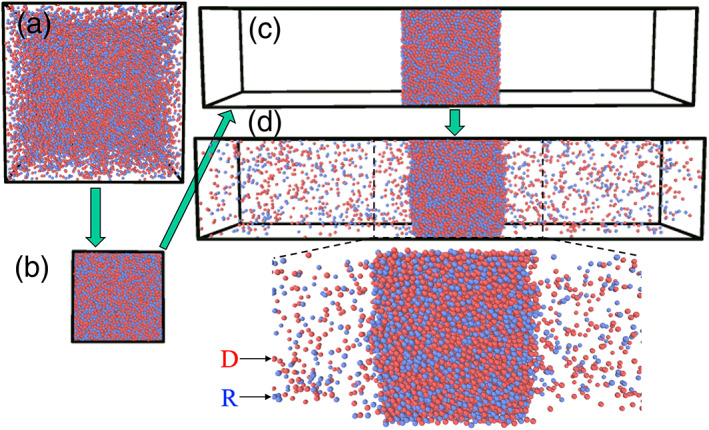
Setup and simulation to reach phase‐separated equilibrium. (a) System in an initial cubic box. (b) System after two‐fold compression in each direction. (c) Enlarged box in z direction. (d) Two‐phase equilibrium. A zoomed view of the dense phase and the neighboring regions in the bulk phase is shown at the bottom
2.1. Strength of D‐R interactions dictates regulatory effects on critical temperature
From the MD simulations, we obtain the total densities, ρ b and ρ d, of the two components in the bulk and dense phases (see Computational Methods and Figure S1a) at a series of temperatures (Figure 3(a) for particles and Figure 3(b) for chains). We fit the resulting binodals to the following equations:
| (3a) |
| (3b) |
where ρ c is the critical density, A and B are constants, and the exponent β is set to 0.32. Equation [3a] is called the law of rectilinear diameters, 28 whereas Equation [3b] is a scaling relation. 28 , 29
FIGURE 3.
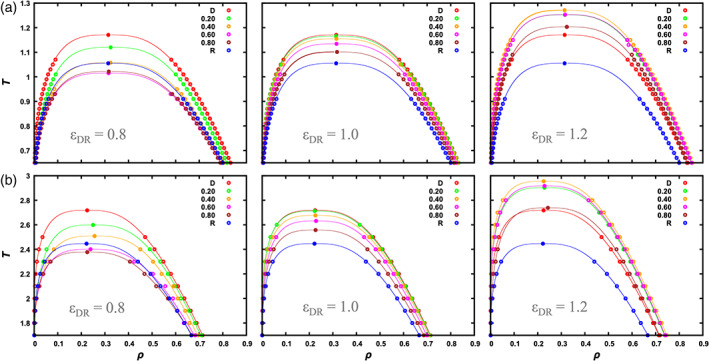
Binodals of (a) particle and (b) chain systems. The driver‐regulator interaction strength, ε DR, is listed near the bottom of each panel; the mole fraction of the regulator species is listed at the top right. Symbols are densities of the two phases at a given temperature, determined by fitting the density profile to a hyperbolic tangent function. The curves are fits of the binodals to Equation [3]. Given the greater uncertainties near the critical region, we successively removed data closest to T c, until the fitted values of T c and ρ c were stable. 15 Note that at ε DR = 1.2 the results at x R = 0.2 and 0.6 are very close to each other, especially for the particle systems
The critical temperature for the pure driver particle system is 1.171, in good agreement with a value 1.16 in a previous study with the same cutoff. 12 The pure regulator particle system is identical to the pure driver counterpart, except that the interaction energy is reduced by a factor of 0.9. Correspondingly the critical temperature is expected to be reduced to 1.171 × 0.9 = 1.054, which is nearly identical to the T c value, 1.055, determined from our simulations of the pure regulator particle system. When regulator particles are mixed with driver particles, very different changes in T c are observed depending on the value of ε DR (Figures 3(a) and 4(a)). At ε DR = 0.8, as x R increases from 0, T c gets lower. Then at x R = 0.6 and 0.8, where the regulator becomes the major species, T c is even lower than that for pure regulator particles. Of course as x R→ 1, T c must come back to the value for pure regulator particles. The dependence of T c on x R for at ε DR = 0.8 has the shape of an upward parabola.
FIGURE 4.
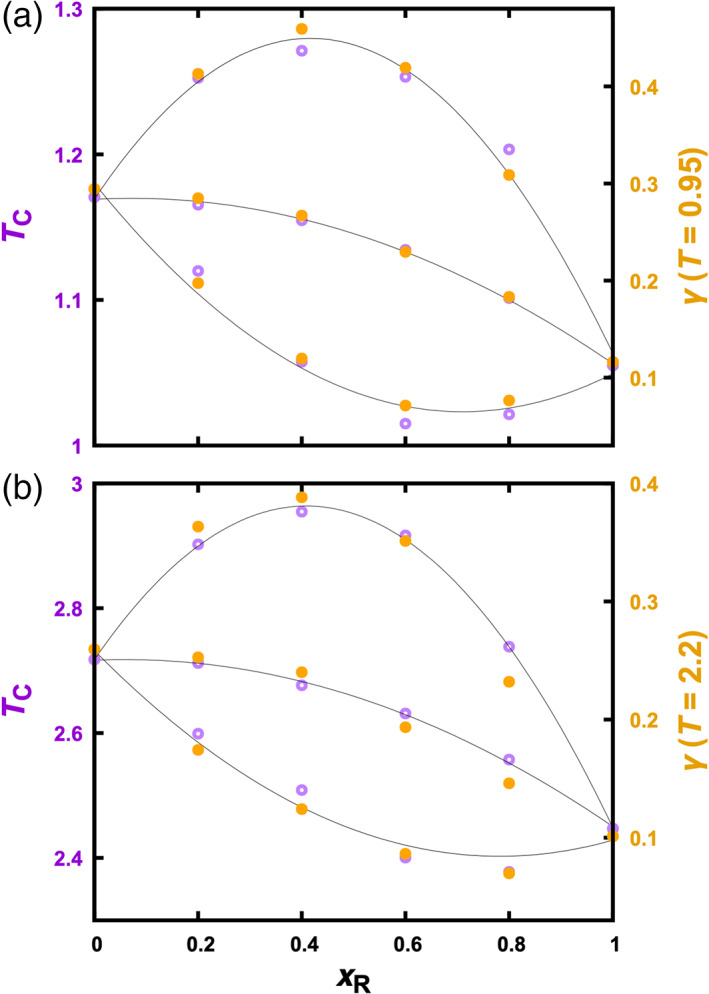
Regulatory effects on T c and on γ. (a) Particle systems. (b) Chain systems. T c values are determined by fitting binodals. Curves are parabolic fits to guide the eye. Data at ε DR = 1.2, 1.0, and 0.8 are displayed from top to bottom in each panel
At ε DR = 1.2, T c initially increases with increasing x R, which is just opposite to the situation at ε DR = 0.8. At x R = 0.6 the trend is reversed and T c decreases all the way till x R = 1, but still is above that for pure driver particles even at x R = 0.8. The overall shape of the dependence of T c on x R is a downward parabola. At ε DR = 1.0, the dependence of T c on x R is close to a linear interpolation between the two end values (i.e., for pure driver and pure regulator), but with a small downward curvature.
The T c trends at the different ε DR values are qualitatively in line with our conclusion in previous studies, 15 , 18 where regulators with ε DR < ε DD and with ε DR > ε DD are classified as weak‐attraction suppressors and strong‐attraction promotors, respectively. One difference between the present work and our previous studies lies in the self‐attraction of regulator particles. In the previous studies, regulator particles experience only steric repulsion among themselves, whereas here they experience Lennard‐Jones interactions, albeit with a weaker strength than that for the driver particles. Therefore, in our previous studies, the extent of weak‐attraction suppression of phase separation, as measured by the decrease in T c, increases monotonically with x R, whereas here the decrease in T c reaches a maximum at an intermediate x R. Similarly, in our previous studies, once strong‐attraction regulators switch from being promotors to suppressors at a certain x R, T c decreases indefinitely with further increase in x R, but here T c decreases at most to the value for pure regulator particles.
The T c trends at the three ε DR values for binary mixtures of Lennard‐Jones chains (Figures 3(b) and 4(b)) qualitatively parallel those for the Lennard‐Jones particles. Quantitatively, two differences are worth noting. Firstly, the critical temperatures of the chain systems are higher, by a factor α T≈ 2.3, than the corresponding particle systems. Secondly, the binodals shift toward lower densities. These two differences in the binodals of particle and chain systems have been pointed out previously based on predictions of perturbation theories. 14
2.2. Particle systems and chain systems have approximately equal interfacial tensions at matching temperatures
For each binary mixture at a given temperature, we calculated the interfacial tension according to the Kirkwood‐Buff method. 30 We noted already that, in either the particle case or the chain case, the two pure systems (at x R = 0 and 1) are identical except that the interaction energies are at a ratio of 0.9. As can be seen by their units (i.e., ε/k B and ε/σ 2, respectively), both of T and γ scale with the interaction strength. Therefore we expect that the values for the pure driver systems, (T D, γ D), should equal the counterparts for the pure regulator systems, (T R, γ R), when the latter quantities are both scaled up by a factor of 1/0.9. That is, γ D = γ R/0.9 when T D = T R/0.9. The results of our MD simulations indeed agree with this expectation (Figure S2).
Figure 5(a) displays illustrative results for a mixture, comprising Lennard‐Jones particles at ε DR = 1.2 and x R = 0.4. In all cases, γ gradually decreases toward 0 as T increases toward T c. The dependence of γ on T fits well to the scaling relation 28 , 29
| (4) |
with μ = 1.255 (Figures 5(a) inset, 6(a), and 6(b)). This fit provides a second route to the determination of T c. The resulting values are in very close agreement with those determined by fitting the binodals (Figure 5(b)).
FIGURE 5.
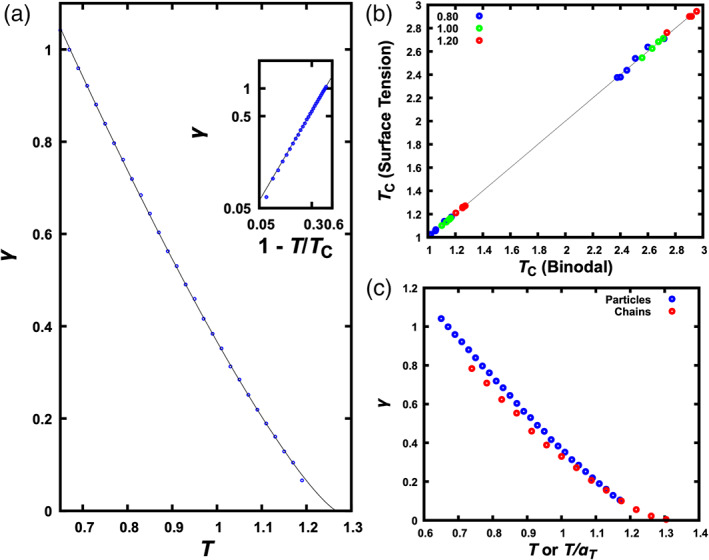
Temperature dependence of interfacial tension. (a) Results for a mixture of Lennard‐Jones particles at ε DR = 1.2 and x R = 0.4. The curve is a fit to Equation [4]. The inset displays a similar plot but with both γ and 1 − T/T c on a logarithmic scale. (b) Comparison of critical temperatures determined via two different routes, by fitting either binodal or interfacial tension. Data points at the lower left and at the upper right are for particles and chains, respectively. The line represents perfect agreement between the two routes. (c) Comparison of interfacial tensions of the corresponding particle and chain systems at ε DR = 1.2 and x R = 0.4. For the chain system, the abscissa represents temperature scaled down by a factor α T= 2.3
FIGURE 6.
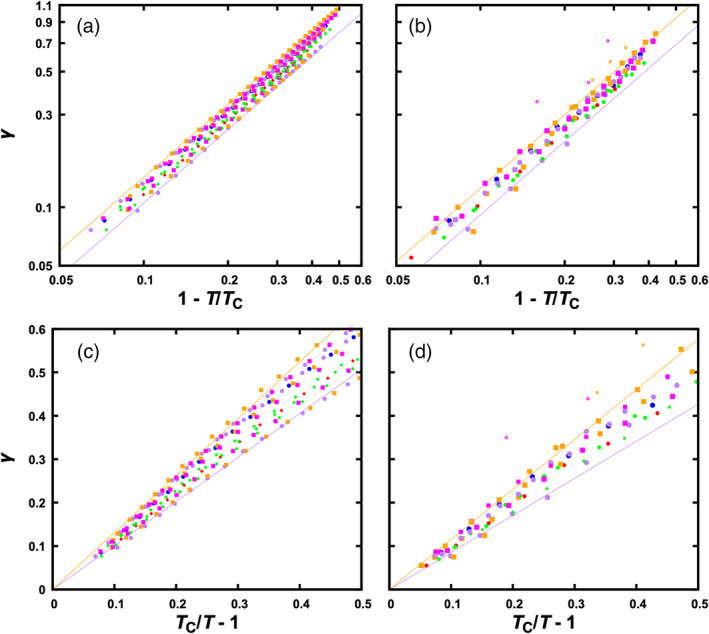
Scaling of interfacial tension with T or with T c. (a) Scaling of γ with 1 − T/T c for the particle systems, displayed on a log–log scale. The fits to Equation [4] for two sets of data near the borders are shown as lines. (b) Corresponding plots for the chain systems. (c) Scaling of γ with T c/T − 1 for the particle systems. Fits to Equation [7], with T c fixed at the values from fitting interfacial tensions, for two sets of data (each for a given mixture in a range of T) near the borders are shown as lines. (d) Corresponding plots for the chain systems. Anomalous γ values due to multiphase coexistence are shown as open symbols in panels (b) and (d)
Comparing the interfacial tensions of the particle systems and the corresponding chain systems, we find that they are approximately equal at matching temperatures, especially at T close to T c (Figure 5(c)). By matching temperatures, we mean that a temperature T for a particle system is equivalent to a temperature α T T for the corresponding chain system. The similarity in interfacial tension between corresponding particle and chain systems will be further discussed below.
Combining Equations [3b] and [4], we obtain a third scaling relation
| (5) |
The exponent is expected to be 3.92, based on the above β and μ values. Our data fit well to this scaling relation, with exponents very close to the expected value (mean and standard deviation of exponents at 3.93 ± 0.07; Figure S3). The last scaling relation indicates that, other things being equal, γ grows with increasing difference in density between the dense and bulk phases. This density difference and hence γ decrease toward 0 as T approaches T c.
2.3. Regulatory effects on Tc and on γ match each other
At a given temperature, the overall mole fraction, x R, of the regulator species affects the composotions (Figure 3) and interactions of the two coexisting phases and therefore the interfacial tension. The dependence of γ on x R for Lennard‐Jones particles was reported by Stephan et al 25 at a single temperature. Here we studied the interfacial tensions of both particle and chain systems over a range of temperatures. The results are illustrated in Figure 4 for the particle systems at T = 0.95 and the chain systems at T = 2.2. Interestingly, the effects of regulator particles and chains on γ at a fixed T match almost perfectly with the corresponding effects on T c. Simple reasoning as presented in the Introduction gave us an inkling for a correlation between γ and T c, but the degree of correlation exhibited by the data is somewhat surprising.
Given the high degree of correlation between T c and γ, the trends described above for T c at different ε DR also translate into those for γ. That is, at ε DR = 0.8, regulators decrease γ, even to values below γ R when x R is at 0.6 and 0.8; at ε DR = 1.2, regulators initially increase γ but at x R = 0.6 reverse the trend, though γ is still higher than γ D even at x R = 0.8; at ε DR = 1.0, the regulatory effects on γ are close to a linear interpolation between γ D and γ R but with a small downward curvature.
We find that the match in the regulatory effects on T c and on γ is better when T is closer to T c. While Figure 4(a) compares T c with γ at T = 0.95 for particle mixtures, when a similar plot is made for γ at T = 0.65 we see larger deviations of the γ trends from the T c trends (Figure S4a). For the chain mixtures at ε DR = 0.8, we even see γ values at x R = 0.4 and 0.6 that buck the trend set by T c (Figure S4b; see also Figure S3b). We will elaborate below on this anomalous behavior.
2.4. γ and Tc have a linear relation
The foregoing results show that regulatory effects on T c can predict the corresponding effects on γ at any temperature, and vice versa. Figure 4 even suggests a linear relation between γ and T c. To provide a justification, let us manipulate the scaling relation given by Equation [4] (see Figure 6(a), (b)), for T close to T c. Let δ = T c − T. Expressing T c in terms of δ and carrying out a Taylor expansion, we obtain
| (6) |
This expression suggests that we plot γ against T c/T − 1 and fit the resulting relation to a power law. Such fits yield exponents that are very close to 1, or an approximate linear relation between γ and T c,
| (7) |
Figure 6(c), (d) display this linear relation, for T c/T − 1 < 0.5. For the particle systems, the slope γ 1 falls within the range of 1.01 to 1.31; the corresponding range for the chain systems is 0.85 to 1.15.
The similar slopes of the particle and chain systems are supported by the finding made clear above by Figure 5(c), which is that corresponding particle and chain systems have nearly equal interfacial tensions at matching temperatures close to their respective T c values. When matching temperatures, we scale both T c and T by the same factor α T, thus leaving T c/T the same for the particle and chain systems. If both γ and T c/T − 1 are the same, then the slope γ 1 has to be the same for corresponding particle and chain systems.
A linear relation, or indeed any one‐to‐one relation, between T c and γ is highly significant. It means that, when a condensate‐forming system experiences a change in macromolecular composition or a change in intermolecular interactions (e.g., by mutation or posttranslational modification, or by a perturbation in solvent conditions such as temperature, pH, or salt), the resulting change in T c can be used to predict the change in γ and vice versa.
2.5. Disparity in self‐ and cross‐species interactions drives multiphase coexistence
Finally let us focus our attention to the anomalous interfacial tension observed on the chain mixtures at ε DR = 0.8, x R = 0.4 and 0.6, and T below 2.2 (Figures 6(b), (d), S3b, and S4b). Inspecting snapshots from the simulations, we were surprised to discover that the dense phase is not a homogeneous mixture of the two components (Figure 7(a)). Instead, driver chains and regulator chains demix to form two distinct dense phases: a driver‐rich region at the center, bordered by two regulator‐rich regions on the two sides (Figure 7(b)). Instead of a single interface between the dense and bulk phases in each half of the simulation box (Figure 2(d)), we now see two interfaces, the first between the driver‐rich and regulator‐rich regions, and the second between the regulator‐rich region and the bulk phase. For T≥ 2.2, even though the interfacial tension does not appear anomalous, the driver and regulator species are not homogeneously distributed in the dense phase, but not to such an extent as to yield a new interface between the driver‐rich and regulator‐rich region (Figure S5a). Rather, the inhomogeneous distributions are best described as regulator enrichment at the interface of the dense and bulk phases. This interfacial enrichment of the regulator (i.e., lower T c) species was also observed in the particle systems with ε DR = 0.8 at T = 0.65 (Figure S5b, but not at T > 0.8), and has been reported in previous studies of mixtures of Lennard‐Jones particles. 24 , 25 , 31 , 32 (As ε DR was further decreased for the particle systems, we also observed their demixing to form distinct dense phases.) This type of multiphase coexistence has been reported in many experimental studies 1 , 7 , 9 , 10 and in some recent computational studies, 10 , 33 , 34 and may underlie the organization of many membraneless organelles. 1 , 4 , 5 , 6 , 8 It is interesting that our highly simplified model systems recapitulate this complex phenomenon, affording us an opportunity to elucidate its general physical basis. In fact, our initial observations on the model systems are qualitatively in line with Steinberg's suggestion (back in 1962) 35 that intermixing, interfacial enrichment of the regulator species (''spreading''), and demixing occur at high, intermediate, and low ε DR, respectively.
FIGURE 7.
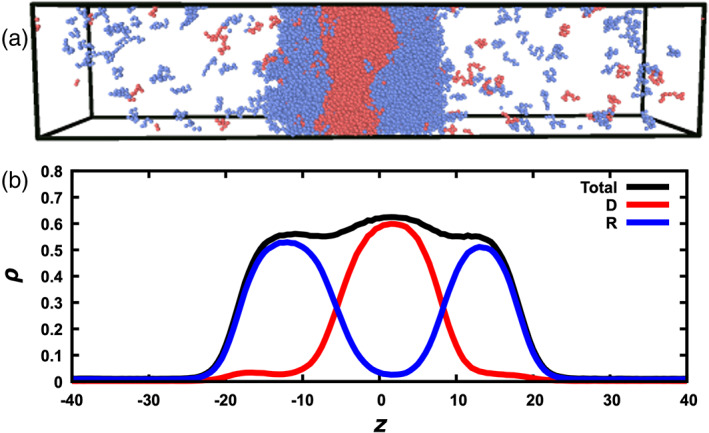
Multiphase coexistence observed for the chain systems. (a) A snapshot of the system at ε DR = 0.8, x R = 0.6, and T = 2.0. Driver and regulator chains are in red and blue, respectively. (b) Density profiles for the driver species, regulator species, and both species combined
Our initial observations already allow us to draw some tentative conclusions. First, in the ranges of parameters studied, driver‐regulator demixing occurred only at low ε DR (and low T). Demixing means that the driver species wants to stay with itself and the regulator species wants to stay with itself. A ε DR that is lower than both ε DD and ε RR would explain why that happens, as doing so would minimize the less favorable cross‐species interactions and maximize the more favorable self‐interactions of each species. Low T would accentuate the disparity between the cross‐species interaction strength ε DR and the self‐interaction strengths ε DD and ε RR, as the contrast between the corresponding Boltzmann factors would be magnified at low T. Second, demixing was observed most readily at x R = 0.4 and 0.6, namely close to a 1:1 ratio between the driver and regulator species. The 1:1 M ratio is where the two species would have the highest chance of interacting with each other if they were homogeneously mixed. That demixing was observed readily around this molar ratio directly indicates that demixing results from the avoidance of cross‐species interactions. A full investigation into the physical basis of multiphase coexistence will be carried out in the future.
Multiphase coexistence creates problems for the analysis methods that are designed for two‐phase systems. For example, the profiles of the component densities or even the total density are no longer a single transition as a function of z (compare Figure S1a and Figure S1b). There is an additional mini‐transition between the driver‐rich region and the regulator‐rich region. When we fit the profile of the total density to a hyperbolic tangent function, the high‐density plateau represents the average density of the two dense regions. Moreover, instead of a single type of interface (i.e., between the dense and bulk phases), we now have two types of interfaces, one between the driver‐rich phase and the regulator‐rich phase, and one between the regulator‐rich phase and the bulk phase. The interfacial tension determined by the Kirkwood‐Buff method is probably some kind of average of the surface tensions at these interfaces, but the exact nature remains to be clarified.
3. CONCLUSION
The results for both mixtures of Lennard‐Jones particles and mixtures of Lennard‐Jones chains have demonstrated that, when intermolecular interactions are perturbed (by, in particular, a compositional variation), the resulting changes in critical temperature and in interfacial tension are highly correlated. Our previous studies have shown that, depending on the relative strength ε DR/ε DD, T c as a function of x R follows distinct trends, and the predicted trends have been validated by experiments. 15 , 18 Now we can predict that γ as a function of x R follows exactly the same trends. Extending the experimental test to the predictions on γ will be very interesting. Beyond this experimental test, the results obtained here deepen our general understanding of how interfacial tensions of biomolecular condensates are affected by macromolecular compositions or interactions, and therefore how biomolecular condensates mediate cellular functions. While the present work focused on changes in T c and γ brought by compositional variations, the correlation between them should extend to other kinds of perturbations in intermolecular interactions, for example, by mutation or posttranslational modification, or by a variation in solvent conditions such as temperature, pH, or salt. The close correlation between T c and γ allows the data for one property to be used to predict the other property. Lastly, the observation that the highly simplified model systems studied here exhibit multiphase coexistence puts us in a position to learn what drives this phenomenon. A tentative conclusion is that the multiphase coexistence observed here is driven by disparity in self‐ and cross‐species interactions; that is, the two species demix in order to minimize the less favorable cross‐species interactions and maximize the more favorable self‐interactions of each species. Much more can be learned in future studies.
4. COMPUTATIONAL METHODS
4.1. Molecular dynamics simulations
Binodals and interfacial tensions were calculated from MD simulations, using the open‐source software package HOOMD‐blue (version 2.5.0) on graphics‐processing units. 36 We largely followed Silmore et al 26 but studied two sets of binary mixtures: one comprising Lennard‐Jones particles and the other comprising chains of 10 Lennard‐Jones particles (Figure 1(b)). The two species of particles have different self‐interaction strengths (Figure 1(c)). The interaction strength of the ''driver'' species, ε DD, is set to ε, which is the unit of energies. The ''regulator'' species has an interaction strength of ε RR = 0.9ε. Several values of the cross‐species interaction strength, ε DR, are studied. Driver chains are homopolymers of driver particles whereas regulator chains are homopolymers of regulator particles. All the particles have the same diameter σ, which is the unit of lengths, and the same mass m. The units for number density, temperature, interfacial tension, and time are σ −3, ε/k B, ε/σ 2, and , respectively.
Periodic boundary conditions were applied in the simulations. In the unit cell, the total number of particles was 20,000 for the particle systems and correspondingly the total number of chains were 2000 for all the chain systems. The mole fraction, x R, of the regulator species was varied to span the entire range, from pure drivers (x R = 0) to pure regulators (x R = 1). The Lennard‐Jones interactions were truncated and shifted, with a cutoff 3σ for all the particle systems and 6σ for all the chain systems. For chains, Lennard‐Jones interactions were not applied between neighboring particles. Instead, they were constrained by a harmonic potential with a spring constant 75,000ε/σ 2 and an equilibrium length σ. In addition to volume, the temperature of the system was also kept constant by running Langevin dynamics with a friction coefficient of 0.1m/τ. The integration timestep was 0.005τ for the particle systems and 0.001τ for the chain systems.
The procedure to prepare the system for phase separation is illustrated in Figure 2. To start, particles or chains of particles were randomly placed in a cubic box with dimensions L x = L y = L z = 60σ (corresponding to a low initial density of 0.093; Figure 2(a)), and energy minimized to relieve clashes. The particles were then linearly compressed at a high temperature of T = 4ε/k B for 5,000 timesteps, to reduce the cubic box to half of its original dimension in each direction (density at 0.74; Figure 2(b)). Finally, the box, but not the particles, was elongated in the z direction to L z = 150σ, creating empty space on both sides of the compressed particles (Figure 2(c)). Hereafter, we set the temperature to a desired value (below T c) and started the simulation to allow the system to relax and reach a phase‐separated equilibrium (Figure 2(d)). The total simulation length was 10 million steps; the second 5 million steps were used for calculating average properties, as described next.
4.2. Determination of densities in the dense and bulk phases
500 snapshots in the equilibrated portion of the simulation were saved (at intervals of 10,000 timesteps). The density profile, ρ(z), along the z direction was calculated by dividing the simulation box of each snapshot into slabs of thickness 0.5σ along z. The total number of particles (or particles of a given species) in each slab divided by the slab volume gave an estimate for the density at that particular z. This estimate was then averaged over the 500 snapshots to yield ρ(z).
To obtain the densities, ρ d and ρ b, in the dense and bulk phases, we fitted the density profile for z between 0 and 75σ (covering half of the simulation box) to the following hyperbolic tangent function
| (8) |
where z 0 represents the midpoint of the interface between the two phases, and w is a measure of the width of the interface. As illustrated in Figure S1a, the fitting works very well. The corner leading to the ρ b plateau given by the tanh function can be a bit too gradual, but that does not affect the accuracy of the value determined for ρ b.
4.3. Determination of interfacial tension
The interfacial tension was determined according to the Kirkwood‐Buff method, 30 in which γ is expressed as
| (9) |
where p xx, p yy, and p yy are the diagonal elements of the pressure tensor, and the brackets indicate an equilibrium average. We calculated these diagonal elements on snapshots separated by 10 timesteps and averaged them over the 0.5 million such snapshots in the equilibrated portion of the simulation. We also verified that the results by the Kirkwood‐Buff method agree with those by the method of Irving and Kirkwood. 37
AUTHOR CONTRIBUTIONS
Konstantinos Mazarakos: Conceptualization; investigation; methodology. Huanxiang Zhou: Conceptualization; supervision; writing‐original draft; writing‐review & editing.
Supporting information
Appendix S1: Supporting information
ACKNOWLEDGEMENT
This work was supported by National Institutes of Health Grant GM118091.
Mazarakos K, Zhou H‐X. Macromolecular regulators have matching effects on the phase equilibrium and interfacial tension of biomolecular condensates. Protein Science. 2021;30:1360–1370. 10.1002/pro.4084
Funding information National Institutes of Health, Grant/Award Number: GM118091
REFERENCES
- 1. Feric M, Vaidya N, Harmon TS, et al. Coexisting liquid phases underlie nucleolar subcompartments. Cell. 2016;165:1686–1697. [DOI] [PMC free article] [PubMed] [Google Scholar]
- 2. Wang J, Choi JM, Holehouse AS, et al. A molecular grammar governing the driving forces for phase separation of prion‐like RNA binding proteins. Cell. 2018;174:688–699. [DOI] [PMC free article] [PubMed] [Google Scholar]
- 3. Ghosh A, Zhou HX. Determinants for fusion speed of biomolecular droplets. Angew Chem Int Ed. 2020;59:20837–20840. [DOI] [PMC free article] [PubMed] [Google Scholar]
- 4. Jain S, Wheeler JR, Walters RW, Agrawal A, Barsic A, Parker R. ATPase‐modulated stress granules contain a diverse proteome and substructure. Cell. 2016;164:487–498. [DOI] [PMC free article] [PubMed] [Google Scholar]
- 5. West JA, Mito M, Kurosaka S, et al. Structural, super‐resolution microscopy analysis of paraspeckle nuclear body organization. J Cell Biol. 2016;214:817–830. [DOI] [PMC free article] [PubMed] [Google Scholar]
- 6. Fei J, Jadaliha M, Harmon TS, et al. Quantitative snalysis of multilayer organization of proteins and RNA in nuclear speckles at super resolution. J Cell Sci. 2017;130:4180–4192. [DOI] [PMC free article] [PubMed] [Google Scholar]
- 7. Boeynaems S, Holehouse AS, Weinhardt V, et al. Spontaneous driving forces give rise to protein−RNA condensates with coexisting phases and complex material properties. Proc Natl Acad Sci U S A. 2019;116:7889–7898. [DOI] [PMC free article] [PubMed] [Google Scholar]
- 8. Putnam A, Cassani M, Smith J, Seydoux G. A gel phase promotes condensation of liquid P granules in Caenorhabditis elegans embryos. Nat Struct Mol Biol. 2019;26:220–226. [DOI] [PMC free article] [PubMed] [Google Scholar]
- 9. Ghosh A, Zhang X, Zhou HX. Tug of war between condensate phases in a minimal macromolecular system. J Am Chem Soc. 2020;142:8848–8861. [DOI] [PMC free article] [PubMed] [Google Scholar]
- 10. Alshareedah I, Moosa MM, Raju M, Potoyan DA, Banerjee PR. Phase transition of RNA‐protein complexes into ordered hollow condensates. Proc Natl Acad Sci U S A. 2020;117:15650–15658. [DOI] [PMC free article] [PubMed] [Google Scholar]
- 11. Woodruff JB, Hyman AA, Boke E. Organization and function of non‐dynamic biomolecular condensates. Trends Biochem Sci. 2018;43:81–94. [DOI] [PubMed] [Google Scholar]
- 12. Dunikov DO, Malyshenko SP, Zhakhovskii VV. Corresponding states law and molecular dynamics simulations of the Lennard‐Jones fluid. J Chem Phys. 2001;115:6623–6631. [Google Scholar]
- 13. Qin S, Zhou HX. Fast method for computing chemical potentials and liquid‐liquid phase equilibria of macromolecular solutions. J Phys Chem B. 2016;120:8164–8174. [DOI] [PMC free article] [PubMed] [Google Scholar]
- 14. Zhou HX, Nguemaha V, Mazarakos K, Qin S. Why do disordered and structured proteins behave differently in phase separation? Trends Biochem Sci. 2018;43:499–516. [DOI] [PMC free article] [PubMed] [Google Scholar]
- 15. Nguemaha V, Zhou HX. Liquid‐liquid phase separation of patchy particles illuminates diverse effects of regulatory components on protein droplet formation. Sci Rep. 2018;8:6728. [DOI] [PMC free article] [PubMed] [Google Scholar]
- 16. Das S, Amin AN, Lin YH, Chan HS. Coarse‐grained residue‐based models of disordered protein condensates: Utility and limitations of simple charge pattern parameters. Phys Chem Chem Phys. 2018;20:28558–28574. [DOI] [PubMed] [Google Scholar]
- 17. Dignon GL, Zheng W, Kim YC, Best RB, Mittal J. Sequence determinants of protein phase behavior from a coarse‐grained model. PLoS Comput Biol. 2018;14:e1005941. [DOI] [PMC free article] [PubMed] [Google Scholar]
- 18. Ghosh A, Mazarakos K, Zhou HX. Three archetypical classes of macromolecular regulators of protein liquid‐liquid phase separation. Proc Natl Acad Sci U S A. 2019;116:19474–19483. [DOI] [PMC free article] [PubMed] [Google Scholar]
- 19. McCarty J, Delaney KT, Danielsen SPO, Fredrickson GH, Shea JE. Complete phase diagram for liquid‐liquid phase separation of intrinsically disordered proteins. J Phys Chem Lett. 2019;10:1644–1652. [DOI] [PMC free article] [PubMed] [Google Scholar]
- 20. Choi JM, Dar F, Pappu RV. LASSI: A lattice model for simulating phase transitions of multivalent proteins. PLoS Comput Biol. 2019;15:e1007028. [DOI] [PMC free article] [PubMed] [Google Scholar]
- 21. Rao M, Levesque D. Surface‐structure of a liquid‐film. J Chem Phys. 1976;65:3233–3236. [Google Scholar]
- 22. Ghoufi A, Malfreyt P, Tildesley DJ. Computer modelling of the surface tension of the gas–liquid and liquid–liquid interface. Chem Soc Rev. 2016;45:1387–1409. [DOI] [PubMed] [Google Scholar]
- 23. Benayad Z, von Bulow S, Stelzl LS, Hummer G. Simulation of FUS protein condensates with an adapted coarse‐grained model. J Chem Theory Comput. 2021;17:525–537. [DOI] [PMC free article] [PubMed] [Google Scholar]
- 24. Lee DJ, Telo da Gama MM, Gubbins KE. The vapour‐liquid interface for a Lennard‐Jones model of argon‐krypton mixtures. Mol Phys. 1984;53:1113–1130. [Google Scholar]
- 25. Stephan S, Langenbach K, Hasse H. Interfacial properties of binary Lennard‐Jones mixtures by molecular simulation and density gradient theory. J Chem Phys. 2019;150:174704. [DOI] [PubMed] [Google Scholar]
- 26. Silmore KS, Howard MP, Panagiotopoulos AZ. Vapour–liquid phase equilibrium and surface tension of fully flexible Lennard–Jones chains. Mol Phys. 2017;115:320–327. [Google Scholar]
- 27. Rowlinson JS, Widom B. Molecular Theory of Capillarity. Mineola, NY: Dover Publications, Inc., 2002. [Google Scholar]
- 28. Guggenheim EA. The principle of corresponding states. J Chem Phys. 1945;13:253–261. [Google Scholar]
- 29. Widom B. Surface tension and molecular correlations near the critical point. J Chem Phys. 1965;43:3892–3897. [Google Scholar]
- 30. Kirkwood JG, Buff FP. The statistical mechanical theory of surface tension. J Chem Phys. 1949;17:338–343. [Google Scholar]
- 31. Protsenko SP, Baidakov VG. Binary Lennard‐Jones mixtures with highly asymmetric interactions of the components. 1. Effect of the energy parameters on phase equilibria and properties of liquid‐gas interfaces. Fluid Phase Equilibr. 2016;429:242–253. [Google Scholar]
- 32. Stephan S, Hasse H. Interfacial properties of binary mixtures of simple fluids and their relation to the phase diagram. Phys Chem Chem Phys. 2020;22:12544–12564. [DOI] [PubMed] [Google Scholar]
- 33. Pal T, Wessén J, Das S, Chan HS. Subcompartmentalization of polyampholyte species in organelle‐like condensates is promoted by charge‐pattern mismatch and strong excluded‐volume interaction. Phys Rev E. 2021;103:042406. [DOI] [PubMed] [Google Scholar]
- 34. Regy RM, Dignon GL, Zheng W, Kim YC, Mittal J. Sequence dependent phase separation of protein‐polynucleotide mixtures elucidated using molecular simulations. Nucleic Acids Res. 2020;48:12593–12603. [DOI] [PMC free article] [PubMed] [Google Scholar]
- 35. Steinberg MS. On the mechanism of tissue reconstruction by dissociated cells. III. Free energy relations and the reorganization of fused, heteronomic tissue fragments. Proc Natl Acad Sci U S A. 1962;48:1769–1776. [DOI] [PMC free article] [PubMed] [Google Scholar]
- 36. Glaser J, Nguyen TD, Anderson JA, et al. Strong scaling of general‐purpose molecular dynamics simulations on GPUs. Comput Phys Commun. 2015;192:97–107. [Google Scholar]
- 37. Irving JH, Kirkwood JG. The statistical mechanical theory of transport processes. IV. The equations of hydrodynamics. J Chem Phys. 1950;18:817–829. [Google Scholar]
Associated Data
This section collects any data citations, data availability statements, or supplementary materials included in this article.
Supplementary Materials
Appendix S1: Supporting information