Abstract
Background
The 2019 novel coronavirus SARS-CoV-2 caused large outbreaks of COVID-19 worldwide. COVID-19 resembles community-acquired pneumonia (CAP). Our aim was to identify lymphocyte subpopulations to distinguish between COVID-19 and CAP.
Methods
We compared the peripheral blood lymphocytes and their subsets in 296 patients with COVID-19 and 130 patients with CAP. Parameters for independent prediction of COVID-19 were calculated by logistic regression.
Results
The main lymphocyte subpopulations (CD3+CD4+, CD16+CD56+, and CD4+/CD8+ ratio) and cytokines (TNF-α and IFN-γ) of COVID-19 patients were significantly different from that of CAP patients. CD16+CD56+%, CD4+/CD8+ratio, CD19+, and CD3+CD4+ were identified as predictors of COVID-19 diagnosis by logistic regression. In addition, the CD3+CD4+counts, CD3+CD8+ counts, andTNF-α are independent predictors of disease severity in patients.
Conclusions
Lymphopenia is an important part of SARS-CoV-2 infection, and lymphocyte subsets and cytokines may be useful to predict the severity and clinical outcomes of the disease.
1. Introduction
COVID-19 is a newly emerging disease with high infection rates, unclear pathogenesis, rapid disease progression, and relatively high incidence of mortality. COVID-19 has affected many countries, with the World Health Organization (WHO) reporting 122536880 confirmed cases and 2703780 deaths up to March21, 2021, globally [1].
Most of the early reports are classified cases as COVID-19 based on the clinical case definition, but specific laboratory confirmation could be made following recognition of SARS-CoV-2 as the pathogen [2]. As the COVID-19 epidemic surges across the globe, researchers are struggling to understand a key epidemiological puzzle—what percentage of infected people have mild or no symptoms and may pass the virus on to others. Some preliminary and detailed estimates of these clandestine cases suggest that they may account for about 60% of all infections [3]. The symptoms COVID-19 appears to cause are similar to other causes of community-acquired pneumonia (CAP), such as fever, cough, shortness of breath, dyspnoea, chest tightness, and diarrhea [4, 5]. Distinguishing COVID-19 from other causes of CAP is one of the main challenges of the COVID-19 outbreak. Our group and others have previously reported numerous hematological abnormalities in COVID-19 [5–8]. Prominent amongst the abnormalities is lymphopenia; although, lymphocyte subsets have not been reported in most studies.
In this study, lymphocyte subsets were examined in a cohort of 296 COVID-19 patients and 130 CAP patients. The present study is aimed at evaluating the ability of lymphocyte subsets and cytokines for distinguishing COVID-19 from CAP.
2. Materials and Methods
2.1. Patients and Data Collection
The 296 COVID-19 patients presented to our hospital from Feb1, 2020, to Mar10, 2020. All patients were laboratory confirmed to be SARS-CoV-2 infected by real-time RT-PCR. The CAP group consisted of 130 patients who visited our hospital from January 2019 to November 2019. The inclusion criteria included the following: (a) pneumonia was defined as pulmonary infiltration and one or more of the following symptoms: fever (body temperature ≥ 38.0°C), cough with or without sputum discharge, dyspnea, or changes in breathing sounds by auscultation; (b) complete patient records of lymphocyte subsets; and (c) hospital patients. The exclusion criteria were as follows: (a) patients lacking data on clinical lymphocyte subsets and (b) outpatient patients. During that hard time, 244 (82.4%) COVID-19 patients took antiviral medicine at home, but none of the COVID-19 patients received immunomodulating drugs before visiting the hospital. All the COVID-19 patients received blood sampling after the onset of symptoms. The clinical data collected from the patients was approved by the Ethics Committee of Zhongnan Hospital of Wuhan University. The Ethics Committee waived written informed consent for emerging infectious diseases.
2.2. Lymphocyte Subpopulation Test
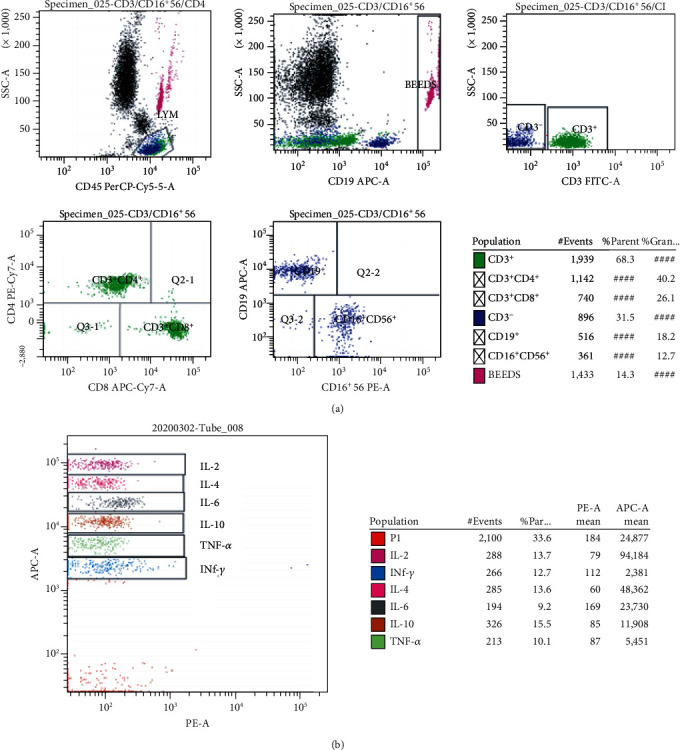
Fasting whole blood from every patient was collected aseptically by venipuncture into ethylenediamine tetraacetic acid (EDTA) collection tubes for the quantification of the main lymphocyte subpopulations. Whole blood was incubated with BD Multitest 6-color TBNK reagent and then lysed with BD FACS™ lysing solution. Lymphocyte subpopulations were acquired and analyzed with BD FACSCanto clinical software. The BD Multitest 6-color TBNK reagent contains the following antibodies to identify and count different lymphocyte subsets: CD3 FITC was used for T lymphocyte identification, CD16 and CD56 PE for NK lymphocyte identification, CD45 PerCP-Cy™5.5 for lymphocyte population identification, CD4 PE-Cy™7 for T-helper/inducer lymphocyte identification and CD19 APC B lymphocyte identification, and CD8 APC-Cy7 for inhibitory/toxic T lymphocyte subset identification. The final results can be easily observed in the flow cytometry template we established (Figure 1(a)).
Figure 1.

Flow cytometry analysis template to detect the CD3+, CD3+CD4+, CD3+CD8+, CD19+, and CD16+CD56+ cells (a) and 6 kinds of cytokines (b) in one tube simultaneously.
Generally, we pipette 20 μL of BD Multitest 6-color TBNK reagent into the bottom of the BD Trucount tube and then pipette 50 μL of well-mixed, anticoagulated whole blood into the bottom of the tube. Cap the tube and vortex gently to mix followed by incubating for 15 minutes in the dark at room temperature (20°C–25°C). We add 450 μL of 1X BD FACS lysing solution to the tube and incubate the tube for 15 minutes in the dark at room temperature. The samples were then analyzed on the flow cytometer. Absolute counts are calculated by BD FACSCanto clinical software using the following formula.
| (1) |
∗This value is found on the BD Trucount tube foil pouch label and can vary from lot to lot.
2.3. Cytokine Analysis
This method involved Multiplex Cytometric Bead Array (CBA) for quantitative analysis of 6 kinds of cytokines, including tumor necrosis factor-alpha (TNF-α), interferon-gamma (IFN-γ), IL-6, IL-2, IL-4, and IL-10. The multiplex CBA was performed according to the manufacturer's instructions. Briefly, 25 μL serum was mixed with an equal volume of capture beads and incubated with 25 μL of PE-binding antibodies in the dark at room temperature for 2.5 hours. The beads were then centrifuged at 200 g for 5 min, and the supernatant was gently aspirated and resuscitated with phosphate buffer brine (PBS) (100 μL). The CBA was addressed in a flow cytometer (BD) and analyzed by clinical software. The final result can be easily observed in the flow cytometry template we have established (Figure 1(b)).
2.4. Statistical Analysis
Statistical analysis was performed using SPSS (Version 22.0, SPSS, Inc., Chicago, IL, USA). Statistical analysis for the results was performed using the Student t-test. A p value <0.05 was considered statistically significant.
3. Results
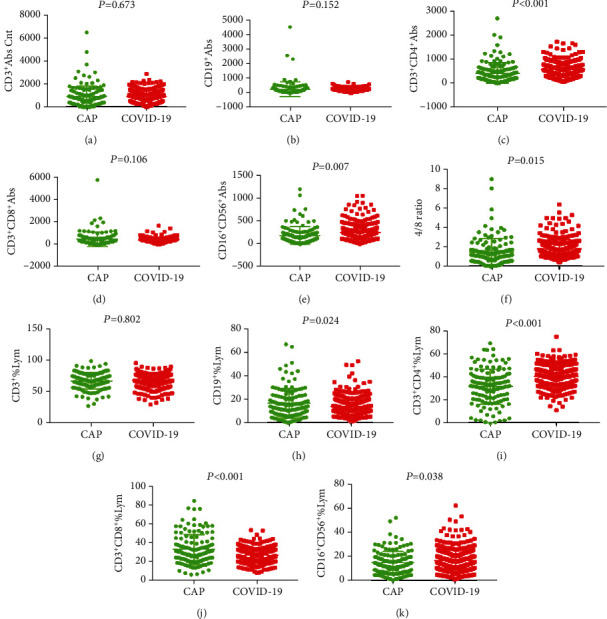
A total of 296 COVID-19 patients (152male vs. 144female), with a mean age of 53 years and 130 CAP patients (80male vs. 50female), with a mean age of 50 years that were hospitalized at Zhongnan Hospital of Wuhan University, were enrolled in the study. Among the 130 CAP patients, 76 (58.5%) patients had bacterial pneumonia, 31 (23.8%) had viral pneumonia, 5 (3.8%) patients had fungal pneumonia, 5 (3.8%) patients had mycoplasma pneumonia, and 13 (10.0%) patients had pneumocystosis or other infection. The mean values of lymphocyte subpopulations indexes in COVID-19 patients and CAP patients were demonstrated in Table 1 and Figures 1 and 2. The mean values of CD19+% and CD3+CD8+% in COVID-19 patients were significantly lower than those in patients with CAP. The mean values of CD3+CD4+, CD16+CD56+, CD4/CD8 ratio, CD3+CD4+%, and CD16+CD56+% in COVID-19 patients were significantly higher than those in patients with CAP. The mean values of CD3+, CD19+, and CD3+CD8+ were not significantly different between the COVID-19 group and CAP group.
Table 1.
Laboratory values of COVID-19 patients and CAP patients.
| Variable | CAP (n = 130) | COVID-19 (n = 296) | p |
|---|---|---|---|
| Age (years) | 50 (32-72) | 53 (41-64) | 0.230 |
| Gender (M/F) | 80/50 | 152/144 | 0.057 |
| CD3+ | 936.37 (322.75-1187.5) | 973.11 (596.75-1274) | 0.673 |
| CD19+ | 248.5 (55.25-285.5) | 184.43 (92-246) | 0.152 |
| CD3+CD4+ | 426.42 (133.25-580.25) | 579.1 (334-766.5) | <0.001 |
| CD3+CD8+ | 462.48 (123.75-540.75) | 368.9 (212.75-488) | 0.106 |
| CD16+CD56+ | 183.98 (64.25-227.5) | 238.59 (107.75-304.25) | 0.007 |
| 4/8 ratio | 1.47 (0.57-1.73) | 1.81 (1.19-2.21) | 0.015 |
| CD3+% lym | 67.5 (60.1-77.19) | 67.8 (62.43-74.87) | 0.802 |
| CD19+% lym | 16.69 (7.41-22.32) | 14 (8.6-17.8) | 0.024 |
| CD3+CD4+% lym | 31.79 (21.81-39.57) | 40.38 (33.72-46.49) | <0.001 |
| CD3+CD8+% lym | 31.87 (21.18-39.42) | 25.7 (20-31.4) | <0.001 |
| CD16+CD56+% lym | 14.6 (7.21-19.4) | 16.75 (9.68-22.2) | 0.038 |
Figure 2.

General characteristics of lymphocyte subpopulations between CAP patients and COVID-19 patients.
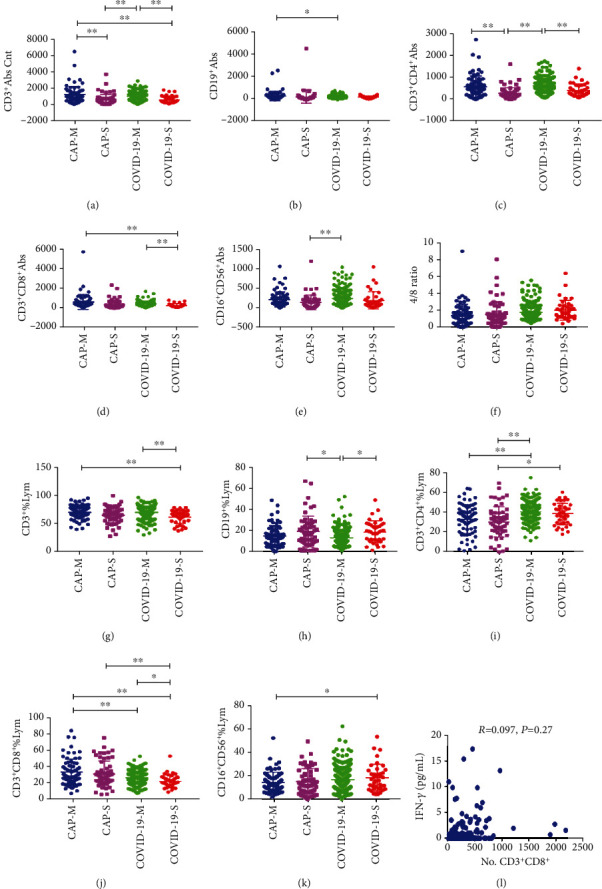
In the mild group (71 CAP and 257 COVID-19), COVID-19 patients showed decreased CD19+, CD3+CD8+%, and increased CD3+CD4+%, compared with that of CAP patients. Similarly, in the severe patients (59 CAP and 39 COVID-19), COVID-19 patients had increased CD3+CD4+% and decreased CD3+CD8+%, compared with that of CAP patients (Figure 3).
Figure 3.

General characteristics of lymphocyte subpopulations in mild CAP patients (CAP-M), severe CAP patients (CAP-S), mild COVID-19 patients (COVID-19-M), and severe COVID-19 patients (COVID-19-S). ∗p < 0.05, ∗∗p < 0.01.
The proportion of patients with abnormal lymphocyte subpopulations is shown in Table 2. Both COVID-19 patients and CAP patients had lymphopenia. A higher percentage of CAP patients showed reduced CD3+, CD3+CD4+, reduced CD16+CD56+, reduced CD4+/CD8+ ratio, increased CD19+%, and normal CD3+CD4+% compared with the COVID-19 patients. Logistic regression analysis showed that laboratory indicators could independently distinguish between COVID-19 and CAP. The ORs of the factors to predict COVID-19 versus CAP were demonstrated in Table 3.The CD16+CD56+%, CD4+/CD8+ ratio, CD19+, and CD3+CD4+ independently discriminating COVID-19 from CAP. In addition, the CD3+CD4+ and CD3+CD8+ counts are independent predictors of disease severity in the COVID-19 group and the combined COVID-19 and CAP group (Table 4).
Table 2.
Abnormal laboratory results for COVID-19 patients and CAP patients.
| Variate | COVID-19 (n = 296) | CAP (n = 130) | p |
|---|---|---|---|
| CD3+ | <0.001 | ||
| Normal | 185 (62.5%) | 56 (43.1%) | |
| High | 0 (0%) | 2 (1.5%) | |
| Low | 111 (37.5%) | 72 (55.4%) | |
|
| |||
| CD19+ | 0.032 | ||
| Normal | 81 (27.4%) | 35 (26.9%) | |
| High | 0 (0%) | 3 (2.3%) | |
| Low | 215 (72.6%) | 92 (70.8%) | |
|
| |||
| CD3+CD4+ | <0.001 | ||
| Normal | 217 (73.3%) | 59 (45.4%) | |
| High | 0 (0%) | 1 (0.8%) | |
| Low | 79 (26.7%) | 70 (53.8%) | |
|
| |||
| CD3+CD8+ | 0.216 | ||
| Normal | 140 (47.3%) | 55 (42.3%) | |
| High | 0 (0%) | 1 (0.8%) | |
| Low | 156 (52.7%) | 74 (56.9%) | |
|
| |||
| CD16+CD56+ | 0.008 | ||
| Normal | 129 (43.6%) | 39 (30%) | |
| Low | 167 (56.4%) | 91 (70%) | |
|
| |||
| 4/8 ratio | <0.001 | ||
| Normal | 169 (57.1%) | 58 (44.6%) | |
| High | 88 (29.7%) | 26 (20%) | |
| Low | 39 (13.2%) | 46 (35.4%) | |
|
| |||
| CD3+% lym | 0.679 | ||
| Normal | 153 (51.7%) | 70 (53.8%) | |
| High | 139 (47%) | 57 (43.8%) | |
| Low | 4 (1.4%) | 3 (2.3%) | |
|
| |||
| CD19+% lym | 0.004 | ||
| Normal | 164 (55.4%) | 66 (50.8%) | |
| High | 15 (5.1%) | 19 (14.6%) | |
| Low | 117 (39.5%) | 45 (34.6%) | |
|
| |||
| CD3+CD4+% lym | <0.001 | ||
| Normal | 106 (35.8%) | 69 (51.1%) | |
| High | 189 (63.9%) | 45 (36.7%) | |
| Low | 1 (0.3%) | 16 (12.2%) | |
|
| |||
| CD3+CD8+% lym | <0.001 | ||
| Normal | 264 (89.2%) | 88 (67.7%) | |
| High | 15 (5.1%) | 34 (26.2%) | |
| Low | 17 (5.7%) | 8 (6.2%) | |
|
| |||
| CD16+CD56+% lym | 0.018 | ||
| Normal | 231 (78%) | 88 (67.7%) | |
| High | 16 (5.4%) | 5 (3.8%) | |
| Low | 49 (16.6%) | 37 (28.5%) | |
Table 3.
Multivariate predictors of COVID-19 versus CAP.
| Variate | OR | 95% CI | p |
|---|---|---|---|
| CD3+CD4+% lym | 0.951 | 0.637-1.422 | 0.808 |
| CD19+% lym | 1.048 | 0.805-1.363 | 0.729 |
| CD3+% lymcnt | 0.871 | 0.54-1.402 | 0.569 |
| CD16+CD56+% lym | 1.338 | 1.032-1.736 | 0.028 |
| CD3+CD8+% lym | 1.334 | 0.886-2.009 | 0.167 |
| 4/8 ratio | 1.538 | 1.166-2.028 | 0.002 |
| CD19+ | 0.743 | 0.566-0.975 | 0.032 |
| CD3+CD4+ | 1.822 | 1.417-2.343 | <0.001 |
| CD16+CD56+ | 1.102 | 0.838-1.449 | 0.488 |
| CD3+ | 1.174 | 0.776-1.778 | 0.447 |
| CD3+CD8+ | 0.834 | 0.636-1.094 | 0.19 |
Table 4.
Multivariate predictors of lymphocyte subsets on disease severity.
| Variate | COVID-19 | CAP and COVID-19 | ||||
|---|---|---|---|---|---|---|
| OR | 95% CI | p | OR | 95% CI | p | |
| 4/8 ratio | 0.901 | 0.531-1.527 | 0.698 | 1.083 | 0.762-1.539 | 0.657 |
| CD16+CD56+% lym | 0.851 | 0.519-1.395 | 0.522 | 1.068 | 0.774-1.474 | 0.688 |
| CD16+CD56+ abs | 1.212 | 0.744-1.975 | 0.441 | 1.133 | 0.811-1.583 | 0.463 |
| CD19+% lym | 0.874 | 0.552-1.386 | 0.568 | 0.911 | 0.677-1.226 | 0.539 |
| CD19+ abs | 0.622 | 0.387-1 | 0.05 | 0.744 | 0.528-1.049 | 0.092 |
| CD3+% lymcnt | 0.585 | 0.287-1.194 | 0.141 | 0.864 | 0.542-1.378 | 0.54 |
| CD3+abs cnt | 0.873 | 0.425-1.796 | 0.713 | 1.277 | 0.821-1.988 | 0.278 |
| CD3+CD4+% lym | 0.938 | 0.402-2.186 | 0.881 | 0.93 | 0.597-1.448 | 0.747 |
| CD3+CD4+ abs | 2.046 | 1.328-3.151 | 0.001 | 2.515 | 1.862-3.397 | <0.001 |
| CD3+CD8+% lym | 1.041 | 0.546-1.984 | 0.904 | 1.161 | 0.767-1.757 | 0.48 |
| CD3+CD8+ abs | 2.218 | 1.288-3.819 | 0.004 | 1.539 | 1.126-2.103 | 0.007 |
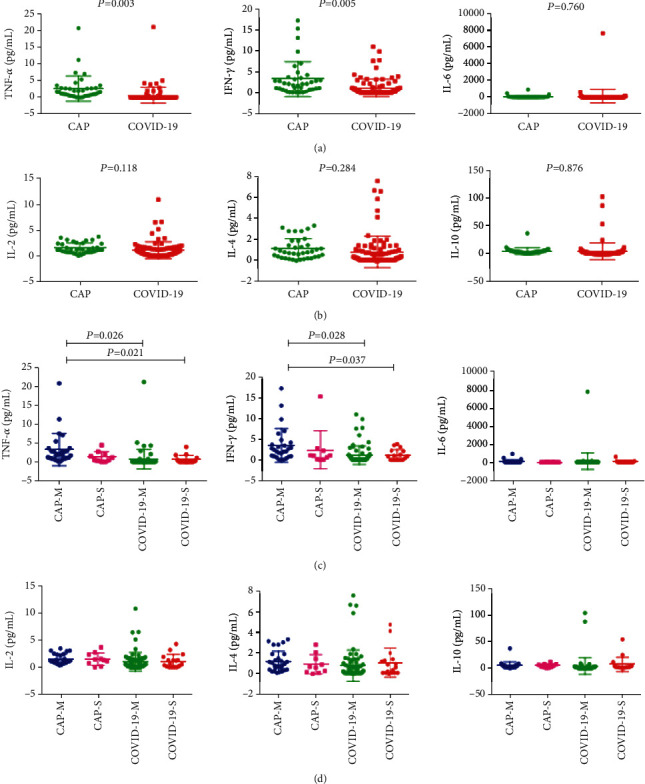
In this study, we also analyzed 6 kinds of cytokines data in 92 COVID-19 patients and 38 CAP patients (Figures 1(b) and 4). TNF-α and IFN-γ had lower level in COVID-19 patients compared with the CAP patients. However, we found that IFN-γ levels were not correlated with CD8+ cytotoxic T lymphocytes in COVID-19 patients based on the database analysis, suggesting that decreased IFN-γ is not caused by CD8+ cytotoxic T lymphocytes (Figure 3(l)). As to IL-6, IL-2, IL-4, and IL-10, we did not find significant difference between the two groups. Logistic regression analysis revealed that TNF-α independently discriminate disease severity in COVID-19 patients (Table 5).
Figure 4.

General characteristics of cytokines in patients with mild CAP (CAP-M), severe CAP (CAP-S), mild COVID-19 (COVID-19-M), and severe COVID-19 (COVID-19-S). ∗p < 0.05, ∗∗p < 0.01.
Table 5.
Multivariate predictors of cytokines on disease severity.
| Variate | COVID-19 | CAP and COVID-19 | ||||
|---|---|---|---|---|---|---|
| OR | 95% CI | p | OR | 95% CI | p | |
| IFN-γ | 1.04 | 0.76-1.423 | 0.807 | 1.017 | 0.865-1.195 | 0.841 |
| IL-10 | 1.187 | 0.996-1.414 | 0.055 | 1.01 | 0.982-1.038 | 0.503 |
| IL-2 | 0.626 | 0.203-1.926 | 0.414 | 1.021 | 0.461-2.26 | 0.96 |
| IL-4 | 1.794 | 0.971-3.315 | 0.062 | 1.265 | 0.823-1.942 | 0.283 |
| IL-6 | 0.998 | 0.996-1 | 0.092 | 0.999 | 0.997-1.001 | 0.306 |
| TNF-α | 0.361 | 0.138-0.941 | 0.037 | 0.874 | 0.694-1.101 | 0.254 |
4. Discussion
The interaction between COVID-19 and the immune system is complex. In the current study, lymphocyte subsets and cytokines were examined in COVID-19 and CAP patients. A significant proportion of COVID-19 patients had reduced lymphocyte subpopulations. This study confirmed the lymphopenia observed in most of the other series of COVID-19 cases [5–7]. The data discussed here extend these observations, showing that the CD3+CD4+ and CD16+CD56+ lymphocyte counts were higher but the TNF-α and IFN-γ were lower in COVID-19 patients compared with those of CAP patients.
The most commonly used lymphocyte subsets are currently detected, including T lymphocytes (CD3+), B lymphocytes (CD19+), NK cells (CD16+56+), helper T lymphocytes (CD3+CD4+), and suppressor T lymphocytes (CD3+CD8+). Percentages and absolute counts of T and B lymphocytes and the ratio of helper/inducer versus suppressor/cytotoxic T cells provide valuable information on immune status for a number of patient conditions [7]. Helper T lymphocytes cells can help B cells secrete antibodies and regulate the immune response of other T cells [9]. It can release IL-2, IFN-γ, IL-4, and other cytokines and activate macrophages and NK cells [10]. Suppressor T lymphocytes cells often exhibit cytotoxic activity and are the major cytotoxic effector cells. As the main immune cells of the body's natural immune system, NK lymphocytes have been shown to be cytotoxic to certain tumors and viruses [11, 12]. Secreted antibodies and mediator humoral immune response are the major functions of B lymphocytes. Activated B lymphocytes can secrete antigens and induce T cell immunity.
Lymphopenia is an important part of COVID-19, and the lymphocyte count may be used to predict the severity of the disease and clinical outcome. Total and subset lymphopenia also occurs in other human coronavirus SARS infections [13]. Experimental coronavirus 229E infections resulted in lymphopenia in humans [14]. The lymphopenia in COVID-19 may be attributed to direct viral invasion and destruction of lymphocytes from SARS-CoV-2. However, studies suggest that the human receptor for COVID-19 could be angiotensin-converting enzyme 2 (ACE2) [15]. ACE2 is the functional cellular receptor for the SARS-CoV-2 but does not express in B or T lymphocytes [16, 17]. This suggests that lymphopenia in COVID-19 is not directly infected and destroyed by SARS-CoV-2 and requires further study.
Other possible explanations for lymphopenia are lymphocyte isolation in the lung where SARS-CoV-2 damage is most pronounced [18], or cytokine-mediated altered lymphocyte transport [7]. Coronavirus 229E can induce apoptosis of monocytes/macrophages in vitro [19]. It is not clear whether different strains of SARS-CoV-2 induce lymphocyte apoptosis. SARS-CoV-2-induced immunosuppression may be predisposed to secondary infection, especially in severely ill patients, and it remains to be determined whether there are any long-term effects on humoral or cell-mediated immunity.
Our findings demonstrated that lymphocyte subsets features, especially CD16+CD56+%, CD4+/CD8+ ratio, CD19+, and CD3+CD4+ independently predicted the differentiation of COVID-19 and CAP. The CD3+CD4+, CD3+CD8+ counts, and TNF-α are independent predictors of disease severity. Thus, detection of lymphocyte subsets and cytokines provides new insights into the pathogenesis of COVID-19 and CAP, which is helpful to understand the immune function of patients and is worthy of popularization and application.
Acknowledgments
We acknowledge all health-care workers involved in the diagnosis and treatment of patients in Wuhan.
Contributor Information
Yunbao Pan, Email: panyunbao@outlook.com.
Haibo Xu, Email: xuhaibo11202021@126.com.
Data Availability
The data used to support the findings of this study are included within the article.
Conflicts of Interest
The authors have no conflicts of interest to declare.
Authors' Contributions
Guohong Liu and Xianghu Jiang contributed equally to this work and should be considered as co-first authors.
References
- 1.WHO. Weekly epidemiological update on COVID-19. 2021. https://www.who.int/publications/m/item/weekly-epidemiological-update-on-covid-19---23-march-2021.
- 2.Yu F., Yan L., Wang N., et al. Quantitative detection and viral load analysis of SARS-CoV-2 in infected patients. Clinical Infectious Diseases. 2020;71(15):793–798. doi: 10.1093/cid/ciaa345. [DOI] [PMC free article] [PubMed] [Google Scholar]
- 3.Qiu J. Covert coronavirus infections could be seeding new outbreaks. Nature. 2020 doi: 10.1038/d41586-020-00822-x. [DOI] [PubMed] [Google Scholar]
- 4.Yu N., Li W., Kang Q., et al. Clinical features and obstetric and neonatal outcomes of pregnant patients with COVID-19 in Wuhan, China: a retrospective, single-centre, descriptive study. The Lancet Infectious Diseases. 2020;20(5):559–564. doi: 10.1016/S1473-3099(20)30176-6. [DOI] [PMC free article] [PubMed] [Google Scholar]
- 5.Chen T., Wu D. I., Chen H., et al. Clinical characteristics of 113 deceased patients with coronavirus disease 2019: retrospective study. BMJ. 2020;368:p. m1091. doi: 10.1136/bmj.m1091. [DOI] [PMC free article] [PubMed] [Google Scholar]
- 6.Zhang G., Zhang J., Wang B., Zhu X., Wang Q., Qiu S. Analysis of clinical characteristics and laboratory findings of 95 cases of 2019 novel coronavirus pneumonia in Wuhan, China: a retrospective analysis. Respiratory Research. 2020;21(1):p. 74. doi: 10.1186/s12931-020-01338-8. [DOI] [PMC free article] [PubMed] [Google Scholar]
- 7.Chen G., Wu D., Guo W., et al. Clinical and immunological features of severe and moderate coronavirus disease 2019. The Journal of Clinical Investigation. 2020;130(5):2620–2629. doi: 10.1172/JCI137244. [DOI] [PMC free article] [PubMed] [Google Scholar]
- 8.Pan Y., Ye G., Zeng X., et al. Can routine laboratory tests discriminate SARS-CoV-2-infected pneumonia from other causes of community-acquired pneumonia? Clinical and Translational Medicine. 2020;10(1):161–168. doi: 10.1002/ctm2.23. [DOI] [PMC free article] [PubMed] [Google Scholar]
- 9.Cho S. H., Raybuck A. L., Blagih J., et al. Hypoxia-inducible factors in CD4(+) T cells promote metabolism, switch cytokine secretion, and T cell help in humoral immunity. Proceedings of the National Academy of Sciences of the United States of America. 2019;116(18):8975–8984. doi: 10.1073/pnas.1811702116. [DOI] [PMC free article] [PubMed] [Google Scholar]
- 10.Kido T., Ishiwata K., Suka M., Yanagisawa H. Inflammatory response under zinc deficiency is exacerbated by dysfunction of the T helper type 2 lymphocyte-M2 macrophage pathway. Immunology. 2019;156(4):356–372. doi: 10.1111/imm.13033. [DOI] [PMC free article] [PubMed] [Google Scholar]
- 11.Zhang C., Wang X. M., Li S. R., et al. NKG2A is a NK cell exhaustion checkpoint for HCV persistence. Nature Communications. 2019;10(1):p. 1507. doi: 10.1038/s41467-019-09212-y. [DOI] [PMC free article] [PubMed] [Google Scholar]
- 12.Zhang C., Hu Y., Shi C. Targeting natural killer cells for tumor immunotherapy. Frontiers in Immunology. 2020;11:p. 60. doi: 10.3389/fimmu.2020.00060. [DOI] [PMC free article] [PubMed] [Google Scholar]
- 13.Fan C. K., Yieh K. M., Peng M. Y., Lin J. C., Wang N. C., Chang F. Y. Clinical and laboratory features in the early stage of severe acute respiratory syndrome. Journal of Microbiology, Immunology, and Infection. 2006;39(1):45–53. [PubMed] [Google Scholar]
- 14.Callow K. A., Parry H. F., Sergeant M., Tyrrell D. A. J. The time course of the immune response to experimental coronavirus infection of man. Epidemiology and Infection. 1990;105(2):435–446. doi: 10.1017/S0950268800048019. [DOI] [PMC free article] [PubMed] [Google Scholar]
- 15.Letko M., Marzi A., Munster V. Functional assessment of cell entry and receptor usage for SARS-CoV-2 and other lineage B betacoronaviruses. Nature Microbiology. 2020;5(4):562–569. doi: 10.1038/s41564-020-0688-y. [DOI] [PMC free article] [PubMed] [Google Scholar]
- 16.Li W., Moore M. J., Vasilieva N., et al. Angiotensin-converting enzyme 2 is a functional receptor for the SARS coronavirus. Nature. 2003;426(6965):450–454. doi: 10.1038/nature02145. [DOI] [PMC free article] [PubMed] [Google Scholar]
- 17.Hamming I., Timens W., Bulthuis M. L. C., Lely A. T., Navis G. J., van Goor H. Tissue distribution of ACE2 protein, the functional receptor for SARS coronavirus. A first step in understanding SARS pathogenesis. The Journal of Pathology. 2004;203(2):631–637. doi: 10.1002/path.1570. [DOI] [PMC free article] [PubMed] [Google Scholar]
- 18.Xu Z., Shi L., Wang Y., et al. Pathological findings of COVID-19 associated with acute respiratory distress syndrome. The Lancet respiratory medicine. 2020;8(4):420–422. doi: 10.1016/S2213-2600(20)30076-X. [DOI] [PMC free article] [PubMed] [Google Scholar]
- 19.Collins A. R. In vitro detection of apoptosis in monocytes/macrophages infected with human coronavirus. Clinical and Diagnostic Laboratory Immunology. 2002;9(6):1392–1395. doi: 10.1128/cdli.9.6.1392-1395.2002. [DOI] [PMC free article] [PubMed] [Google Scholar]
Associated Data
This section collects any data citations, data availability statements, or supplementary materials included in this article.
Data Availability Statement
The data used to support the findings of this study are included within the article.


