Abstract
The health systems in many countries are still unable to control the evolution and persistence of the COVID-19 pandemic despite the large mobilisation of national resources. International attention has focussed on finding a cure, and preventive measures and national and international strategies to be adopted and implemented with regard to other future pandemics have been neglected despite their predictability and high probability of occurrence. This work aims to anticipate a reading on experience feedback in light of the current pandemic situation, and to identify the main spatial elements of vulnerability in Batna, Algeria, which seems to control the ability of an urban area to prevent the spread of the COVID-19 virus. We used a digital model based on a multi-criteria approach implemented in a geo-decisional GIS database to serve as a decision support tool for dealing with an epidemiological situation as a preventive or curative action. The results from the model seem to adequately reflect the reality of confirmed incidents in Batna. In addition, the results of the analysis of the spatiotemporal evolution of the virus clearly confirm that the urban sectors characterised by high vulnerability are those that have recorded an increasing number of confirmed COVID-19 incidents since the start of the epidemic until December 2020.
Keywords: COVID-19, Geo-governance, Vulnerability, GIS, Spatial model
Introduction
The scale and implications of the COVID-19 virus pandemic that the world is currently experiencing will remain deeply engraved in the annals of international epidemiology. The speed of transmission of this virus, both locally and internationally, surprised the governments, scientists, and international health organisations, as in a few months. The consequences on public health and their impacts on the world economy have been dramatic. This situation will result in a long-term international economic recession (Atkeson, 2020; Kabaka, 2020; Maital & Barzani, 2020; McKibbin & Fernando, 2020). At the same time, as we are writing this paper, the health systems in most countries are still unable to control the evolution and persistence of the COVID-19 pandemic and its reappearance now and then in a geographic area where the disease was considered to be “under control” (Dsouza et al., 2020; Giordano et al., 2020; Lancet, 2020; Wise, 2020).
It is understandable that the efforts of the international community are oriented solely towards the daily management of emergencies in the hope of containing the COVID-19 pandemic, however, it is essential to consider objective and discreet discussions to enable each nation to draw and conclude the necessary lessons to avoid this kind of a catastrophic situation in the future, which even exceeds the capacities of the richest and most powerful countries.
Algeria, for its part, anticipated the scale of the disaster and its socio-economic implications early. However, despite the profound ignorance of the risk of the virus, there was a lack of preparation of its health system for this unprecedented situation, compounded by other spatial, economic, environmental, and societal factors. Algeria now needs to reflect on the situation after COVID-19, taking into account the feedback of the experience, and establish the foundations of a comprehensive national strategy for preventive risk management, which is highly integrated into the territorial reality.
To be a part of this prospective vision of preventive management of pandemics, we have undertaken this research to model the territorial vulnerability in the event of a new pandemic situation that may arise in the future. This analysis model was developed using a GIS database intended to serve as a geo-decisional tool in the management of large-scale epidemiological situations. The analytical model was tested on the city of Batna, which has been one of the hard-hit cities during national epidemics in the recent decades.
GIS as a mapping and control tool for COVID-19
In December 2019, a new virus (initially called ‘Novel Coronavirus 2019-nCoV’ and later renamed to SARS-CoV-2) causing severe acute respiratory syndrome (coronavirus disease; COVID-19) emerged in Wuhan, Hubei Province, China (Surveillances, 2020), by the 30th of January 2020, the World Health Organization (WHO) declared that the new SARS-CoV-2 coronavirus outbreak constitutes a Public Health Emergency of International Concern (PHEIC) owing to the fast spread across the world (Statement on the second meeting of the International Health Regulations (2005) Emergency Committee regarding the outbreak of novel coronavirus (2019-nCoV), 2020). GIS is widely used in health (Cromley & McLafferty, 2011; Lahmar et al., 2020a, 2020b). Its applications include online real- or near-real-time mapping of disease cases and of social media reactions to disease spread, and predictive risk mapping using population travel data (Boulos & Geraghty, 2020).
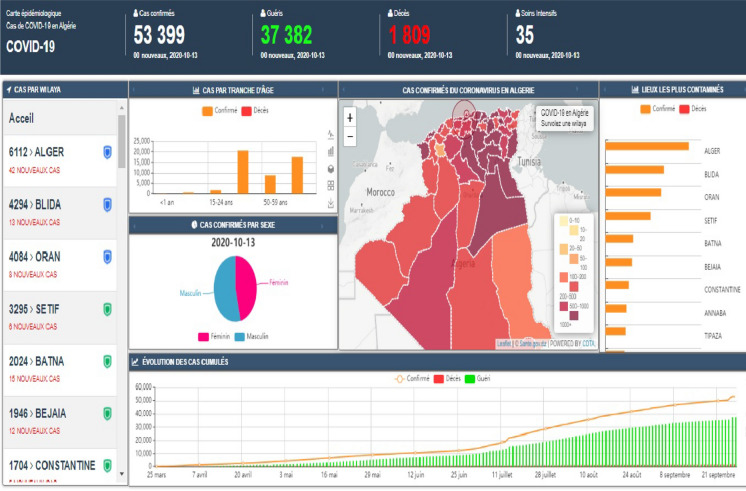
Indeed, health professionals have long considered mapping and disease control over the territories, to track infectious diseases, such as yellow fever and cholera (Issam & Said, 2017), through surveillance, preparedness, and response, and applied GIS technology to this work. For example, WHO unveiled its ArcGIS operations dashboard for COVID-19, to list the cases and the total number of deaths by country, with informational panels about the map and its data resources (Organization & others, 2020). In addition, on 25th March, 2020, Algeria unveiled its own dashboard (Fig. 1) to control the spread of COVID-19 by province, including cases classified by age, sex, etc. (Centre & others, 2020).
Fig 1.
GIS Dashboard for mapping COVID-19 in Algeria
In addition, different GIS techniques can be used not only to map cases and to display statistical information, but also to detect disease in the early stages. It is a key component of efficient disease control and prevention, and helps authorities in locating the highly affected areas and take appropriate actions (Sarwar et al., 2020).
Since COVID-19 is a novel disease, the vulnerability parameters are not well described. However Mollalo et al. (2020) tried to analyse the spatial correlation between multiple factors (topographic, demographic, environmental, behavioural, and socioeconomic factors) and disease spread in the United States using geographically weighted regression (GWR) and multi-scale GWR (MGWR) models. They concluded that the variables of median household income, income inequality, the percentage of nurse practitioners, and the percentage of black females in the population (called socio-economics variables), and the demographic parameters could explain a relatively high variability of the disease incidence in the United States, but other parameters (environmental, topographic, and behavioural factors) could be considered as predictors of low vulnerability to the disease incidence.
Because COVID-19 is characterised by a long incubation period, strong infectivity, and difficulty of detection, GIS is combined with other technologies such as big data. For example Zhou et al. (2020) analysed the spatial representation of the disease, material, population, and social psychology at three scales: (1) individual scale, by comparing the spatial epidemic tracking and the spatiotemporal trajectories of the patients, (2) group scale, by the estimation of population flow and the spatial distribution, and (3) regional scale, by analysing the balance between the supply and demand of medical resources, and the spatial differentiation analysis of material transportation capacity and social sentiment.
It is clear that many studies exploring COVID-19 from a geographic point of view using different parameters (e.g. environments, socio-economics, climate, physical conditions, etc.) (Boulos and Geraghty (2020), Cordes and Castro (2020), Kang et al. (2020), Mollalo et al. (2020), Sarwar et al. (2020); Sun et al. (2020)), have been published and will continue to be published, but the challenges that remain have to be studied to obtain more accurate results about the spatial factors for COVID-19 vulnerability, especially in developing countries in order to develop a universal strategy against future pandemics.
Study area
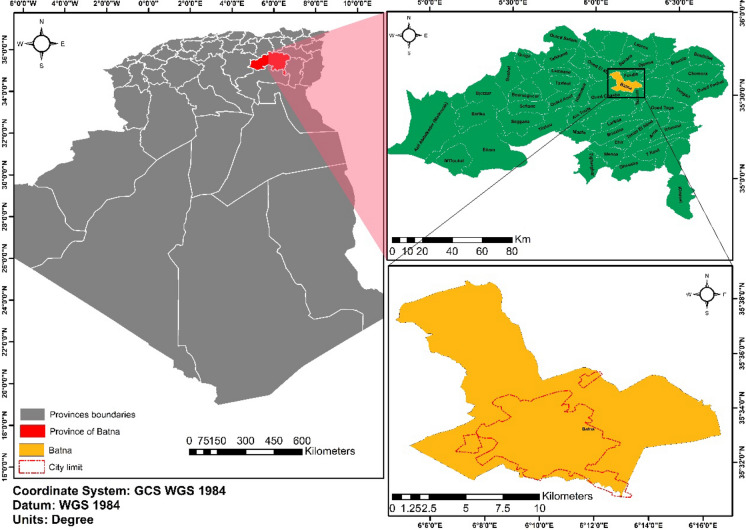
Batna is strategically located in the eastern highlands of Algeria (Fig. 2). It is the sixth-largest city in the country, and its geographical location has made it a hub with important crossroads connecting the country from every direction.
Fig. 2.
The study area
Administratively, the city is located in the Batna province, which is considered among the most populated territories in Algeria (Office, 2011). In addition, the Wilaya of Batna is distinguished from other regions of Algeria by a particular epidemiological situation in recent years, including susceptibility to epidemics like cutaneous leishmaniasis (Issam & Said, 2017), and typhoid fever (Abdelhalim et al., 2016), the quality of healthcare and the inequality in its access, and a limitation of resources in case of a major risk (Lahmar et al., 2020a, 2020b; LAHMAR et al., 2020a, 2020b). Currently, the city of Batna is recording an increasing number of COVID-19 cases. By the end of March, the city recorded 500 cases (first wave of COVID-19). Until this date (30 November 2020), the city has been recording an average of 100 cases per day (the second wave).
The study area has a total of 299,698 inhabitants that represent 3.05% of the total urban population in the country (Office, 2011). But the distribution of the population is not homogeneous; however, the city can be divided into two major zones (Lahmar et al., 2020a, 2020b):
1.Height density zone: This zone is mostly comprised of level 5 and 6 buildings and collective housing that were constructed by the government as result of the New Urbanized Housing Zone (ZHUN1) to address the housing problems.
2.Low-density zone: This zone represents individual houses, majority of which are not a part of planned construction; these have no architectural style and are of low quality. This area contains limited infrastructure and few public services.
Methods and tools
To assess the spatial vulnerability of the city of Batna to this type of epidemic, we opted for a spatial model based on the following approaches:
Define the vulnerability parameters (spatial factors).
Execute the spatial model developed for this purpose using the GIS environment, and map the spatial vulnerability using the equation provided by the analytic hierarchy process (AHP) analysis.
Test and validate the result provided by the model using the spread of COVID-19 in the city of Batna.
Factors selection
To assess the spatial vulnerability of the city of Batna to this type of epidemic, we opted for a spatial model that is based on vulnerability parameters, according to availability of data, and our estimation of these elements as factors of the spread of the epidemic. These parameters are:
Housing occupancy rate (TOL): The average housing occupancy rate is the ratio between the number of inhabitants or the number of families and the total number of available dwellings. This parameter reflects the level of promiscuity
Commercial spaces and supermarkets
Public facilities: including any building offers service public (Administrative, Education, health, environment, police and security, banks …etc.)
Places of worship: The faithful meet five times a day in mosques to pray
Schools (all levels): The education system in Algeria is organized into three (03) levels (primary, college and high school), each level has its own buildings, equipment, and staff. The average class occupancy rate differs from one urban sector to another (social differentiation). The risk of contamination is not the same.
Spatial analysis model
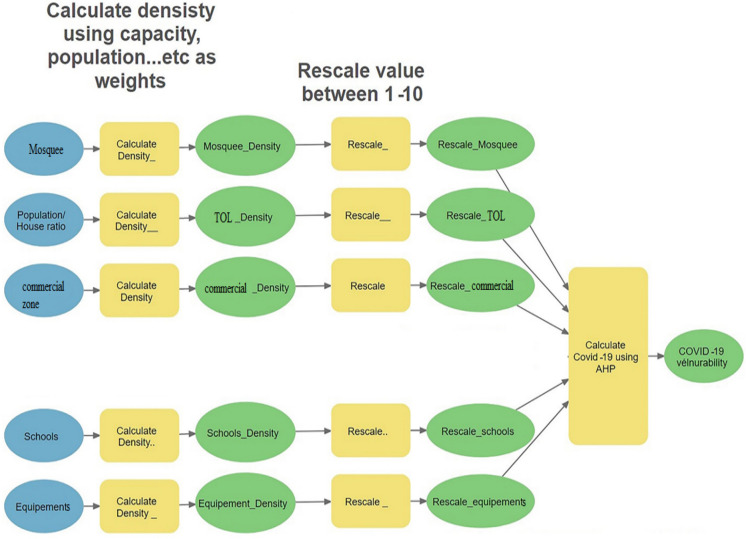
The proposed model (Fig. 3) has three main parts: the first s tune ep is calculating the density of every parameter using the functional capacity of every parameter as weight, the second step is to rescale density into range values from 1 to10, and the last step is to use hierarchical muti-criteria analysis method which allows to assign weights for each parameter according to its implication in the level of vulnerability to COVID-19. There are several applicable methods but we have opted for AHP method to map vulnerability (Saaty, 2008).
Fig. 3.
The spatial model
Multi-criteria method is preferred because it’s simple application, in addition it offers:
The initial hierarchical classification is selected by the operator according to his expertise and his actual knowledge of the field. The process is not completely left to the purely mathematical approach.
At the end of the process, the result is subjected to an evaluation of the level of consistency (The consistency index CI) which guarantees the efficiency of the analysis.
This model uses a model builder inside ArcGIS, which is a powerful graphical interface that allows us to use different tools and variables to create models inside the ArcGIS environment (“What is Model Builder?—ArcMap | Documentation,” 2020), the model aims to quantify and rescale all parameters to make it possible to compare, and make statistical analysis and math calculations for all factors side by side.
Step 1: The spatial density of the parameters
The “Density Calculation” tool uses point or line features as input to calculate a density map in an area of interest. The tool calculates an appropriate search distance to determine the size of the neighbourhoods. It allows to specify the weighting applied to the density function (we used the capacity of the equipment as an index of ‘weight’) (Understanding density analysis—ArcMap | Documentation, 2020).
Step 2: Rescale the values
The ‘Rescale by function’ tool allows to use a mathematical function (line or curve) to assign suitability values to an input raster at a continuous scale (usually between 1 and 10). Rescaling is a tool that perfectly meets the need for aptitude modelling (How Rescale by Function works—Help | ArcGIS for Desktop, 2020).
The “Reclassify” tool can be used to reclassify data into categories by resizing (reclassify) continuous data without creating discrete categories. This is the case with the approach we have advocated by expressing spatial densities.
These tools can be used for the analysis and diagnosis of many urban themes and functions.
Step 3: The AHP Analysis
The analysis method adopted is AHP (Saaty, 2008). It is a multi-criteria analysis method that can be used in the quantification of qualitative characteristics through its weighting. This makes it possible to classify according to their weight, the parameters chosen for their influence on a given phenomenon, in this case, the vulnerability of the various urban sectors of the city of Batna to contamination by the SARS-CoV-2 virus.
The principles of the AHP method are as follows:
Hierarchical structuring in the classification of parameters
Structuring of priorities, binary comparison
Logical consistency
The Table 1 explains the intensity of importance and classification of the parameters in an AHP analysis (Saaty, 1987, 2008):
Table 1.
Nine-point pairwise comparison
| Intensity of importance | Definition | Explanation |
|---|---|---|
| 1 | Equal importance | Two elements contribute equally to the objective |
| 3 | Moderate importance | Experience and judgment slightly favour one parameter over another |
| 5 | Strong importance | Experience and judgment strongly favour one parameter over another |
| 7 | Very strong importance | One parameter is favoured very strongly and is considered superior to another; its dominance is demonstrated in practice |
| 9 | Extreme importance | The evidence favouring one parameter as superior to another is of the highest possible order of affirmation |
The factors are ranked according to the degree of crowd grouping, and the frequency of daily public services, to their level of correlation with the number of reported cases of COVID-19 (Table 2).
Table 2.
Classification of factors according to their weight
| Factors | Weight |
|---|---|
| Housing ratio | C1 |
| Public facilities | C2 |
| Supermarket | C2 |
| Places of worship | C2 |
| Schools | C3 |
Test and validation
To test and validate the results, we mapped all COVID-19 incidents (confirmed by a COVID-19 RT-PCR test) and compared to the result of the vulnerability of Batna generated by the proposed model. Then, we calculated the approximation error, which is the difference between an exact value (reported COVID-19 incident in our case) and a certain approximate value (assessed vulnerability generated by the model).
The approximation error is calculated using the following equation:
where ∂ = approximation error, = actual value observed (reported COVID-19 incident), and = expected value (assessed vulnerability map).
Data
The data used in this study are collected from different sources. The study area is represented by the census division (locally known RGPH), which contains the number of populations per census district, housing data, etc., which is the main source of housing occupancy rate (TOL). Commercial spaces and supermarkets parameters are collected from the field using online mapping tools and geodatabase (Google Earth, wikimapia, and OpenStreetMap), public facilities are a personal database developed earlier in the LRNAT lab, places of worship data are collected from the local department of Religious Affairs and Endowments of Batna. The capacity of mosques is calculated using the relation between the area of the mosques and the number of visitors (mostly 1 m = 1 visitor); school parameter data is gathered from the field (location of schools), and general statistics are from the local department of education of Batna.
All data are converted into a geographic database. The following table (Table 3) represents the data, type of data in the database, the weight attribute, description, and source of data.
Table 3.
Data sources and descriptions
| Data | Type | Description | Source | |
|---|---|---|---|---|
| Input | Output (after executing spatial model) | |||
| Housing occupancy rate | Vector point (including capacities as weights) | Raster dataset | The number of family members based on RGPH geographic division. The weight to measure density is number of populations per district | Master plan on the city |
| Commercial spaces and supermarkets | Geographic location of major supermarkets, the weight is given according to category of every element (Weekly Market, Daily market, Wholesale shops, Retail shops) | Data collected from field | ||
| Public facilities | Geographic location of Public facilities | |||
| Places of worship | Geographic location of worships. The weight is the capacity of every mosque (maximum number of visitors per day) | |||
| Schools | Geographic location of schools. The weight is number of students in each classroom (group) | Data collected from field and local department of education | ||
| AHP tool | extAhp20—Analytic Hierarchy Process for ArcGIS 10.1 | It is a tool for the creation of suitability maps (spatial planning, risk mapping and more)! Manual and some example files included. Allows for up to 15 criteria | ||
Results and discussions
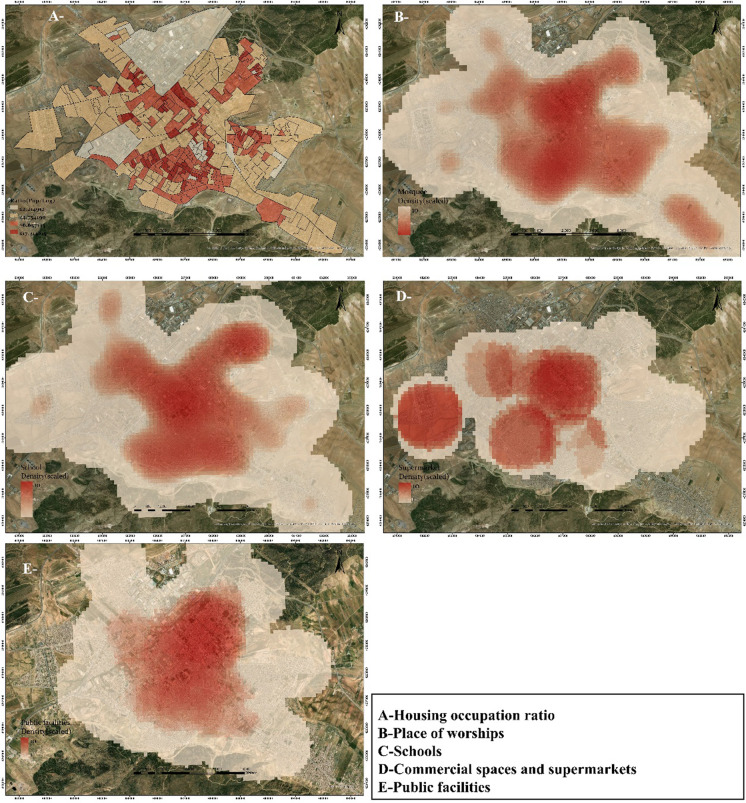
The first part of the model (calculating the density and rescaling the values) was executed in ArcGIS. The inputs in the model are vector points representing the geographic locations of the features of each parameter (location of schools, places of worship, public facilities, and commercial spaces and supermarkets). The weight attributes are used as inputs in calculating the density tool; the second step is to rescale the density map produced previously from the density tool into a rescaled map from 1 to 10. The following figure (Fig. 4) shows the result of the execution of the first part of the model.
Fig. 4.
Spatial analysis for the chosen parameters
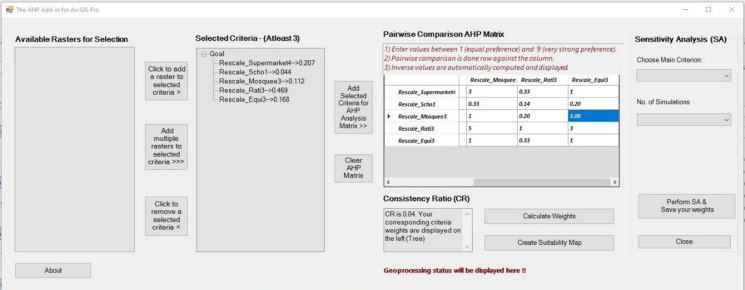
On examining the results of the AHP analysis, the most imporant priority and weight is assigned to the occupancy rates of the accommodations because of the degree of promiscuity and the risk of massive contamination that they can provide. Commercial areas and public facilities are also areas of daily contact between different populations and are highly contaminated environments (Table 4). The places of worship, in this case, are mosques distributed very densely over the entire urban space of the city and where the faithful meet five times a day in the same place, strongly contribute to the contamination by viruses; Fig. 5 represents the AHP tool with the previous factors and their weight in the AHP matrix:
Table 4.
Fact or s order and weights
| Factor | Order | Weight (%) |
|---|---|---|
| TOL | 5 | 46.9 |
| Public facilities | 3 | 16.8 |
| Commercial area and supermarket | 3 | 20.7 |
| Mosques | 3 | 11.2 |
| Schools | 1 | 4.4 |
Fig. 5.
Execution of the AHP tool in ArcGIS
To check the level of consistency of the judgments and to ensure that the data have a logical relationship with each other, (Saaty, 1987) suggests the following procedure: The consistency index CI:
n: the number of criteria.
The consistency ratio CR:
CA: is the consistency index of randomly generated pairs.
The CI calculated in previous studies as CI = 0.04, making the data have a logical relationship with each other. According to CI, the correlation between the spatial distribution of the level of vulnerability and those of cases of real contamination by spatialized COVID-19, can confirm or invalidate the reliability of the analysis model.
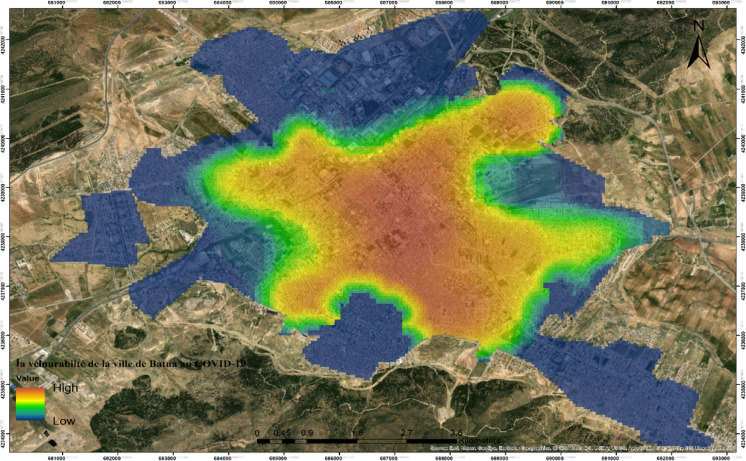
The vulnerability result (Fig. 6) is raster data, so a matrix that records the vulnerability value in pixels, the venerability map will be as follows:
Fig. 6.
The vulnerability of Batna to COVID-19
COVID-19 vulnerability equation = 0.469 ratio + 0.168 Public facilities + 0.207 Commercial area and supermarket + 0.112 mosques + 0.044 schools
Geolocation of COVID-19 cases
The process of converting addresses into geographic locations is known as geocoding, which is a basic operation in geographic information systems (GIS) (Longley et al., 2005). It is used widely in urban and territory planning (Cayo & Talbot, 2003; Davis & Fonseca, 2007) even in healthcare and epidemiologic situations (Bonner et al., 2003; Krieger et al., 2002; Mazumdar et al., 2008, 2016; Oliver et al., 2005).
Algeria does not have a “good and reliable” geocoding system, because address searches sometimes result in matches to point address and street address levels, but more often match to the street name and admin levels (Geocode coverage—ArcGIS REST API: World Geocoding Service ArcGIS for Developers, 2020). However (Akakba & Lahmar, 2020) developed a tool based on the geocoding technique for locating positive COVID-19 incidents in Ain Touta (province of Batna), this tool is based on composed locator address which merging available online and commercial geocoding services to locate streets and major administrative divisions, than using a personnel on-ground locator address to locate districts number, neighbourhoods number, bloc number and doors numbers, as a result, a sample validation can be above 90% of accuracy and this is acceptable in a large-scale study.
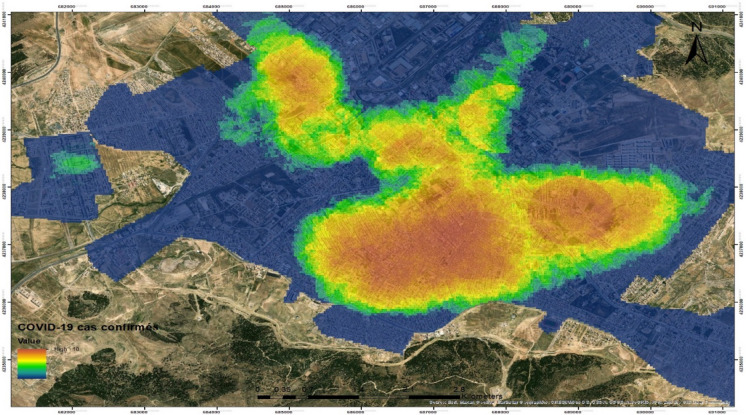
These tools have enabled us to locate the majority of addresses with acceptable precision. “Geographically”. The operation was completed by a search for addresses directly in the field (Fig. 7).
Fig. 7.
Mapping of COVID-19 incidents by the end of June 2020
Model validation
By observing the spatial distribution map of the real confirmed COVID-19 incidents on the urban space of Batna, we can see that it is superimposed on the vulnerability map obtained from our model. However, to specify the degree of validation, we proceeded to measure the difference between the two maps using the approximation error calculation, which is the difference between an exact value and a certain approximate value or its approximation. In our case, the gap between the assessed vulnerability status and the actual status of reported COVID-19 cases.
The error is calculated using the following equation:
∂ = percentage of error,
VA = actual value observed (confirmed cases)
VE = expected value (vulnerability calculated by the AHP method).
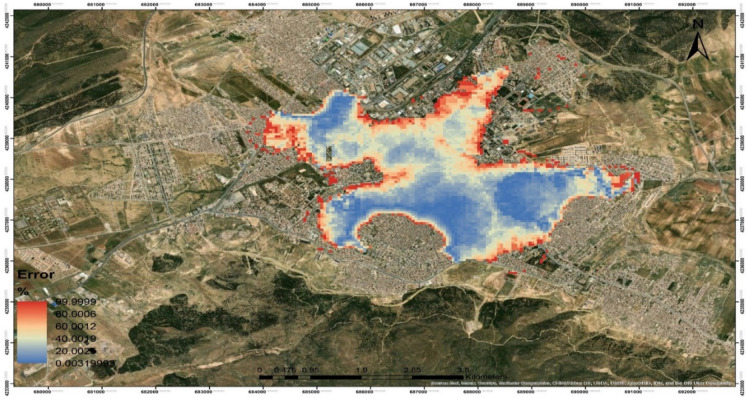
The previous figure (Fig. 8) represent three main results:
The centre of Batna is the most affected by COVID-19, because of regrouping the most public facilities and population, which is historically the old town.
There is a spatial correlation between the proposed factors and COVID-19 incidents, and this can be confirmed in the future using a spatial correlation model.
There is a certain pattern in the distribution of the approximation error, where the centre of the city has the lowest error, as we moved forward into the suburbs, the approximation error is increased, because of the lack of data (especially COVID-19 incidents and public facilities and TOL).
Fig. 8.
Spatialisation of approximation error
It emerges from this fact that the distribution of the estimated vulnerability is higher than 72% in relation to the spatial reality of COVID-19 contamination. As a result, we believe that the model reflects the reality on the ground fairly well. To improve the precision of the results, we plan to adopt a finer scale and more advanced parameters.
We considered this model to be acceptable due to the lack of data in large sectors in the city. Some of the data and parameters need to be optimised and use official ratios and standards instead of standardising all parameters using density (which already begin in LRNAT lab).
Conclusion
After each disaster, which deeply affects human societies in their flesh, goods, and environment, questions arise in retrospect on the circumstances of the disaster, the structural and non-structural failures of the system, and the level of societal preparation for this kind of a disaster crisis. The response to the questions constitutes the feedback on which it is necessary to rely, to orient forward actions to reduce the effects of disasters after assessing their territorial and societal vulnerabilities.
This research work is part of a vision for the future after COVID -19 and consists of the implementation of a digital tool for the analysis and preventive management of serious epidemic situations. At this level of research, the results provide us with a multicriteria spatial analysis model implemented in a GIS database, capable of performing a territorial diagnosis on the level of vulnerability of the urban system of the city of Batna to a virus of type COVID-19.
The map of the spatial distribution of vulnerability at the scale of urban sectors obtained with our analysis model has been amply validated by the spatial distribution of confirmed cases of inhabitants contaminated by the virus.
Despite the great difficulties in accessing certain data and the lack of a geocoding system, this research work constitutes a good contribution for a real opening on the way of digital and territorial intelligence in Algeria to face the future in a more enlightened way.
Funding
This research did not receive any specific grant from funding agencies in the public, commercial, or not-for-profit sectors.
Declarations
Conflict of interest
The authors (Dr. Kalla mohammed issam, Dr.Lahmar Belkacem, Dr. Guellouh Sami and Pr. Mahdi Kalla) declare that they have known competing financial interest or personal relationships that could have appeared to influence the work reported in this paper.
Consent for publication
This manuscript has not been published and is not under consideration for publication elsewhere. This article is approved by all authors (Dr. Kalla mohammed issam, Dr.Lahmar Belkacem, Dr. Guellouh Sami and Pr. Mahdi Kalla) and that, if accepted, it will not be published elsewhere in the same form, in English or in any other language, including electronically without the written consent of the copyright-holder.
Footnotes
In French: Zone d’habitat urbain nouvelle.
Publisher's Note
Springer Nature remains neutral with regard to jurisdictional claims in published maps and institutional affiliations.
Contributor Information
Mohammed Issam Kalla, Email: m.kalla@univ-batna2.dz.
Belkacem Lahmar, Email: b.lahmar@univ-batna2.dz.
Sami Geullouh, Email: s.guellouh@univ-batna2.dz.
Mahdi Kalla, Email: mahdi.kalla@univ-batna2.dz.
References
- Abdelhalim B, Hadda D, Mahdi K, Baziz N. Spatial analysis of typhoid fever vulnerability in the city of Batna (eastern Algeria) Environment Risques & Santé. 2016;15:228–237. [Google Scholar]
- Akakba A, Lahmar B. The use of geocoding for home healthcare application and management an epidemic situation: Case of COVID-19 virus outbreak. Geographica Pannonica. 2020;24:285–293. doi: 10.5937/gp24-28062. [DOI] [Google Scholar]
- Atkeson, A., (2020). What will be the economic impact of COVID-19 in the US? Rough estimates of disease scenarios. National Bureau of Economic Research.
- Bonner MR, Han D, Nie J, Rogerson P, Vena JE, Freudenheim JL. Positional accuracy of geocoded addresses in epidemiologic research. Epidemiology. 2003;14:408–412. doi: 10.1097/01.EDE.0000073121.63254.c5. [DOI] [PubMed] [Google Scholar]
- Boulos MNK, Geraghty EM. Geographical tracking and mapping of coronavirus disease COVID-19/severe acute respiratory syndrome coronavirus 2 (SARS-CoV-2) epidemic and associated events around the world: how 21st century GIS technologies are supporting the global fight against outbreaks and epidemics. International Journal of Health Geographics. 2020 doi: 10.1186/s12942-020-00202-8. [DOI] [PMC free article] [PubMed] [Google Scholar]
- Cayo MR, Talbot TO. Positional error in automated geocoding of residential addresses. International Journal of Health Geographics. 2003;2:10. doi: 10.1186/1476-072X-2-10. [DOI] [PMC free article] [PubMed] [Google Scholar]
- Center, for D. of A.T., others, 2020. Carte épidémiologique Cas de COVID-19 en Algérie COVID-19 (public dashboard). https://covid19.cdta.dz/dashboard/production/index.php
- Cordes J, Castro MC. Spatial analysis of COVID-19 clusters and contextual factors in New York City. Spatial Spatio-Temporal Epidemiology. 2020;34:100355. doi: 10.1016/j.sste.2020.100355. [DOI] [PMC free article] [PubMed] [Google Scholar]
- Cromley EK, McLafferty SL. GIS and public health. Guilford Press; 2011. [Google Scholar]
- Davis CA, Fonseca FT. Assessing the certainty of locations produced by an address geocoding system. GeoInformatica. 2007;11:103–129. doi: 10.1007/s10707-006-0015-7. [DOI] [PMC free article] [PubMed] [Google Scholar]
- Dsouza DD, Quadros S, Hyderabadwala ZJ, Mamun MA. Aggregated COVID-19 suicide incidences in India: Fear of COVID-19 infection is the prominent causative factor. Psychiatry Research. 2020;290:113145. doi: 10.1016/j.psychres.2020.113145. [DOI] [PMC free article] [PubMed] [Google Scholar]
- Edwards SE, Strauss B, Miranda ML. Geocoding large population-level administrative datasets at highly resolved spatial scales. Transactions in GIS. 2014;18:586–603. doi: 10.1111/tgis.12052. [DOI] [PMC free article] [PubMed] [Google Scholar]
- Geocode coverage—ArcGIS REST API: World Geocoding Service ArcGIS for Developers [WWW Document], 2020. URL https://developers.arcgis.com/rest/geocode/api-reference/geocode-coverage.htm (accessed 4.13.20)
- Giordano G, Blanchini F, Bruno R, Colaneri P, Di Filippo A, Di Matteo A, Colaneri M. Modelling the COVID-19 epidemic and implementation of population-wide interventions in Italy. Nature Medicine. 2020;26:855–860. doi: 10.1038/s41591-020-0883-7. [DOI] [PMC free article] [PubMed] [Google Scholar]
- How Rescale by Function works—Help | ArcGIS for Desktop [WWW Document], 2020.URL https://desktop.arcgis.com/en/arcmap/10.3/tools/spatial-analyst-toolbox/how-rescale-by-function-works.htm (accessed 11.21.20)
- Issam KM, Said GM. Using geomatics for assessing vulnerability to cutaneous leishmanisais. Application to the wilaya of Batna (Algeria) International Journal. 2017;13:9–15. [Google Scholar]
- Kabaka, P.I., 2020. La gestion internationale de l’épidémie du coronavirus COVID 19 en 2020. Analyse des conséquences socio-économiques et juridiques d’une atteinte à la santé publique mondiale.
- Kang D, Choi H, Kim J-H, Choi J. Spatial epidemic dynamics of the COVID-19 outbreak in China. International Journal of Infectious Diseases. 2020;94:96–102. doi: 10.1016/j.ijid.2020.03.076. [DOI] [PMC free article] [PubMed] [Google Scholar]
- Krieger N, Chen JT, Waterman PD, Soobader M-J, Subramanian S, Carson R. Geocoding and monitoring of US socioeconomic inequalities in mortality and cancer incidence: Does the choice of area-based measure and geographic level matter? The public health disparities geocoding project. American Journal of Epidemiology. 2002;156:471–482. doi: 10.1093/aje/kwf068. [DOI] [PubMed] [Google Scholar]
- Lahmar B, Dridi H, Akakba A. Territorial health approach outputs of geo-governance of health facilities: Case study of Batna, Algeria. GeoJournal. 2020 doi: 10.1007/s10708-020-10189-1. [DOI] [Google Scholar]
- Lahmar B, Dridi H, Akakba A. A GIS-based multicriteria spatial decision support system model to handle health facilities resources. Case of crisis management in Batna ALGERIA. Geographia Technical. 2020;15:173–186. doi: 10.21163/GT_2020.151.16. [DOI] [Google Scholar]
- Lancet T. India under COVID-19 lockdown. Lancet Lond. Engl. 2020;395:1315. doi: 10.1016/S0140-6736(20)30938-7. [DOI] [PMC free article] [PubMed] [Google Scholar]
- Longley PA, Goodchild MF, Maguire DJ, Rhind DW. Geographic information systems and science. Wiley; 2005. [Google Scholar]
- Maital S, Barzani E. The global economic impact of COVID-19: A summary of research. Samuel Neaman Institute for National Policy Research. 2020;2020:1–12. [Google Scholar]
- Mazumdar S, Butler D, Bagheri N, Konings P, Girosi F, Feng X, McRae I. How useful are primary care service areas? Evaluating PCSAs as a tool for measuring primary care practitioner access. Applied Geography. 2016;72:47–54. doi: 10.1016/j.apgeog.2016.05.005. [DOI] [Google Scholar]
- Mazumdar S, Rushton G, Smith BJ, Zimmerman DL, Donham KJ. Geocoding accuracy and the recovery of relationships between environmental exposures and health. International Journal of Health Geographics. 2008;7:13. doi: 10.1186/1476-072X-7-13. [DOI] [PMC free article] [PubMed] [Google Scholar]
- McKibbin, W., Fernando, R., 2020. The economic impact of COVID-19. Economics of Time COVID-19 45.
- Mollalo A, Vahedi B, Rivera KM. GIS-based spatial modeling of COVID-19 incidence rate in the continental United States. Science Total Environment. 2020;728:138884. doi: 10.1016/j.scitotenv.2020.138884. [DOI] [PMC free article] [PubMed] [Google Scholar]
- Office, N. des S., 2011. ARMATURE URBAIN (Collections Statistiques N: 163/2011 Série S: Statistiques Sociales). La Direction Technique Chargée des Statistiques Régionales, l’Agriculture et de la Cartographie.
- Oliver MN, Matthews KA, Siadaty M, Hauck FR, Pickle LW. Geographic bias related to geocoding in epidemiologic studies. International Journal of Health Geographics. 2005;4:29. doi: 10.1186/1476-072X-4-29. [DOI] [PMC free article] [PubMed] [Google Scholar]
- Organization, W.H., others, 2020. Novel coronavirus (COVID-19) situation (public dashboard). http://healthcybermap.org/WHO_COVID19/.
- Präger M, Kurz C, Böhm J, Laxy M, Maier W. Using data from online geocoding services for the assessment of environmental obesogenic factors: A feasibility study. International Journal of Health Geographics. 2019;18:13. doi: 10.1186/s12942-019-0177-9. [DOI] [PMC free article] [PubMed] [Google Scholar]
- Saaty RW. The analytic hierarchy process—What it is and how it is used. Mathematical Modeling. 1987;9:161–176. doi: 10.1016/0270-0255(87)90473-8. [DOI] [Google Scholar]
- Saaty TL. Decision making with the analytic hierarchy process. International Journal Services Science. 2008;1:83–98. doi: 10.1504/IJSSCI.2008.017590. [DOI] [Google Scholar]
- Sarwar S, Waheed R, Sarwar S, Khan A. COVID-19 challenges to Pakistan: Is GIS analysis useful to draw solutions? Science Total Environment. 2020;730:139089. doi: 10.1016/j.scitotenv.2020.139089. [DOI] [PMC free article] [PubMed] [Google Scholar]
- Statement on the second meeting of the International Health Regulations (2005) Emergency committee regarding the outbreak of novel coronavirus (2019-nCoV) [WWW Document], 2020. URL https://www.who.int/news/item/30-01-2020-statement-on-the-second-meeting-of-the-international-health-regulations-(2005)-emergency-committee-regarding-the-outbreak-of-novel-coronavirus-(2019-ncov) (accessed 11.18.20).
- Sun F, Matthews SA, Yang T-C, Hu M-H. A spatial analysis of the COVID-19 period prevalence in U.S. counties through June 28, 2020: Where geography matters? Annals of Epidemiology. 2020;52:54–59.e1. doi: 10.1016/j.annepidem.2020.07.014. [DOI] [PMC free article] [PubMed] [Google Scholar]
- Surveillances V. The epidemiological characteristics of an outbreak of 2019 novel coronavirus diseases (COVID-19)—China, 2020. China CDC Weekly. 2020;2:113–122. doi: 10.46234/ccdcw2020.032. [DOI] [PMC free article] [PubMed] [Google Scholar]
- Understanding density analysis—ArcMap | Documentation [WWW Document], 2020. URL https://desktop.arcgis.com/en/arcmap/latest/tools/spatial-analyst-toolbox/understanding-density-analysis.htm (accessed 11.21.20).
- Whitsel EA, Rose KM, Wood JL, Henley AC, Liao D, Heiss G. Accuracy and repeatability of commercial geocoding. American Journal of Epidemiology. 2004;160:1023–1029. doi: 10.1093/aje/kwh310. [DOI] [PubMed] [Google Scholar]
- Wise J. Covid-19: New coronavirus variant is identified in UK. British Medical Journal Publishing Group. 2020 doi: 10.1136/bmj.m4857. [DOI] [PubMed] [Google Scholar]
- Zhou C, Su F, Pei T, Zhang A, Du Y, Luo B, Cao Z, Wang J, Yuan W, Zhu Y, Song C, Chen J, Xu J, Li F, Ma T, Jiang L, Yan F, Yi J, Hu Y, Liao Y, Xiao H. COVID-19: Challenges to GIS with big data. Geographic Sustainability. 2020;1:77–87. doi: 10.1016/j.geosus.2020.03.005. [DOI] [Google Scholar]


