Abstract
Background:
Inappropriate acetabular component angular position is believed to increase the risk of hip dislocation following total hip arthroplasty (THA). However, manual measurement of these angles is time consuming and prone to inter-observer variability. The purpose of this study was to develop a deep learning tool to automate the measurement of acetabular component angles on postoperative radiographs.
Methods:
Two cohorts of 600 anteroposterior (AP) pelvis and 600 cross-table lateral hip postoperative radiographs were used to develop deep learning models to segment the acetabular component and the ischial tuberosities. Cohorts were manually annotated, augmented, and randomly split to train-validation-test datasets on an 8:1:1 basis. Two U-Net convolutional neural network (CNN) models (one for AP and one for cross-table lateral radiographs) were trained for 50 epochs. Image processing was then deployed to measure the acetabular component angles on the predicted masks on anatomical landmarks. Performance of the tool was tested on 80 AP and 80 cross-table lateral radiographs.
Results:
The CNN models achieved a mean Dice Similarity Coefficient of 0.878 and 0.903 on AP and cross-table lateral test datasets, respectively. The mean difference between human-level and machine-level measurements was 1.35° (σ=1.07°) and 1.39° (σ=1.27°) for the inclination and anteversion angles, respectively. Differences of 5 or more between human-level and machine-level measurements were observed in less than 2.5% of cases.
Conclusions:
We developed a highly accurate deep learning tool to automate the measurement of angular position of acetabular components for use in both clinical and research settings.
Keywords: total hip arthroplasty, acetabular component angle, inclination angle, anteversion angle, artificial intelligence, deep learning
INTRODUCTION
Total hip arthroplasty (THA) is one of the most successful surgical procedures, as it brings significant pain relief and increased quality of life for patients[1]. Dislocation is a relatively common complication following THA, representing a challenging problem for both patients and surgeons[2]. A pooled analysis of 4,633,935 primary THAs estimated the six-year cumulative incidence of dislocation to be 2.10%[3]. Dislocation can result in severe pain, limb dysfunction, readmission, and reoperation. Moreover, treatment costs for THA patients experiencing dislocation are estimated to be 300% higher than patients with uncomplicated THA[4]. Therefore, it is crucial to identify and mitigate factors that predispose patients to dislocation following THA.
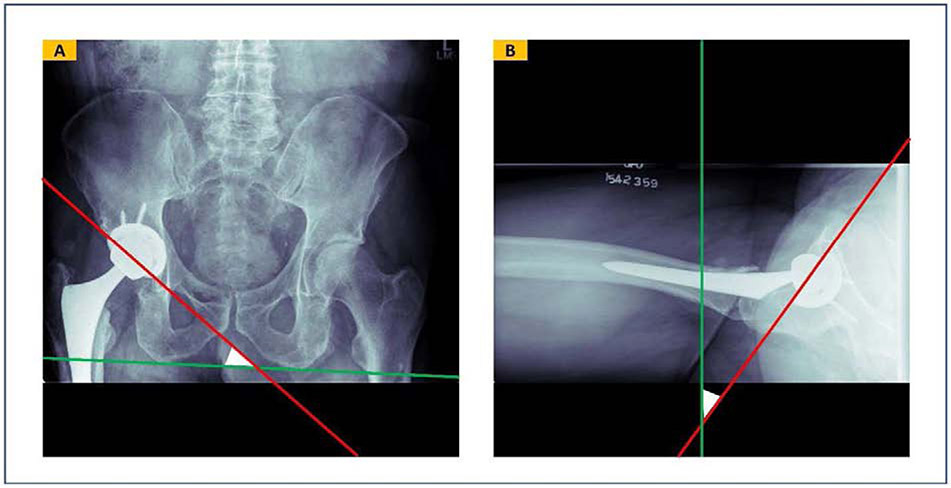
Acetabular component malpositioning is one of the most important and modifiable risk factors for post-THA instability and dislocation[5]. Defining acetabular component angles can be based on anatomical, operational, or radiologic reference systems[6]. In a radiology reference system, the inclination angle is defined as the angle between the acetabular component’s longitudinal axis and any line defining the horizontal axis of the pelvis on anteroposterior (AP) radiograph. Defining the horizontal axis of the pelvis is commonly performed with a line tangent to the base of the ischial tuberosities or the teardrop. Likewise, the radiographic anteversion angle is the angle between the acetabular component longitudinal axis and the coronal plane. While the measurement of the inclination angle is straightforward on AP radiographs (Figure 1A), several methods exist to measure the anteversion angles in different radiographic planes [7]. Among the available methods, the Woo and Morrey method has been widely used to measure the anteversion angle. This method measures the anteversion angle on cross-table lateral radiographs and define it as the angle formed between the acetabular component’s longitudinal axis and a vertical line drawn perpendicular to the table when the patient is supine (Figure 1B)[8]. Although the Woo and Morrey method has been questioned for accuracy, it has the highest intra- and inter-rater reliability[7]. This method is almost always applicable to radiographs, while other measurement methods may fail if borders or edges of implants are not clearly visible, which is especially problematic with methods that rely on drawing ellipses on AP radiographs.
FIGURE 1.
Inclination and anteversion acetabular component angles defined in a radiology reference system. (A) Inclination angle is defined as the angle between the acetabular component longitudinal axis and the trans-ischial tuberosity line on an anteroposterior radiograph. (B) Anteversion angle is defined by the angle between the acetabular component longitudinal axis and a standard vertical line perpendicularly drawn to the table on a hip cross-table lateral radiograph.
Convolutional neural networks (CNNs) are the current state-of-the-art artificial intelligence (AI) technique for analyzing images. These algorithms begin by looking for low-level image features such as edges and curves and then build up to higher level structures through a series of convolutional operations[9]. U-Nets are a type of CNN model that performs semantic segmentation, i.e. to identify pixels in an image which belong to one or multiple objects of interest[10].
This study aimed to develop a deep learning tool to automate the measurement of acetabular component angles on postoperative radiographs. Our hypothesis was that CNN could accurately identify inclination and anteversion angles on AP pelvis and cross-table lateral hip radiographs. Herein, we introduce a fully automated tool based on semantic segmentation U-Net models and image processing, to measure the acetabular component inclination and anteversion angles.
MATERIALS AND METHODS
Following Institutional Review Board (IRB) approval, we utilized our institution’s total joint registry to identify primary THA cases performed from 2000 – 2017. Out of this pool, image data was obtained for 600 random cases with AP pelvis and 600 random cases with cross-table lateral hip radiographs. We subsequently developed a tool for semantic segmentation of postoperative radiographs, and image processing on the segmentation masks to measure the acetabular component angles. We evaluated each step independently and then deployed the tool through a Graphical User Interface (GUI).
Semantic Segmentation
Assembling the Imaging Dataset
We retrospectively collected two groups of 600 AP and 600 cross-table lateral radiographs obtained at the first postoperative clinical visit of random cases. Random selection of AP and cross-table lateral hip radiographs were done independently and cases from the two groups did not necessarily overlap. Each group included no more than one image from each patient and was balanced based on three factors: (A) 300 from female cases and 300 from male cases; (B) 300 from cases that ultimately dislocated versus 300 from cases who never dislocated; and (c) 200 from cases with osteoarthritis, 200 from cases with rheumatoid arthritis, and 200 from cases with other indications for THA.
All images were zero-padded and resized to 512×512 pixels. One author (P.R., who had medical and programming expertise) manually segmented the radiographs using RIL-Contour, an open-source annotation tool[11]. Annotations were then verified by two orthopedic surgeons. We segmented the bilateral ischial tuberosities on AP images, and the acetabular components on both AP and cross-table lateral images (supplement 1). Each cohort was then randomly split to train, validation, and test datasets in an 8:1:1 ratio. Finally, images in the training dataset were augmented using horizontal flipping and random rotation up to ±20°. These modifications to the original data, a process known as data augmentation, facilitates generalizability of deep learning models to unseen future data [12].
Model Initialization and Training
We created two U-Net CNN models to segment AP pelvis and cross-table lateral hip images independently. Encoders of both models had the VGG-16 architecture and their initial weights were pooled from a model pre-trained on the ImageNet database [13][14]. The weights for the decoder layers were initialized randomly using the normal He distribution[15]. We trained the network’s decoder layers for 50 epochs, with a batch size of 8, and using the Adam optimizer[16]. Learning rate was initially set to 0.01 and was reduced gradually using a learning rate scheduler (learning rate was reduced by a factor of 0.1 after validation loss failed to improve for 5 consecutive epochs). We used a modification of the Dice Similarity Coefficient (DSC) which rewards a high degree of overlap between the predicted contour and the human-traced contour[17]. We added a focal loss because of the relatively small size of the contour compared to the entire image. During training, the model with the least validation loss was saved as the final model[18][19]. We trained our U-Net models on an NVIDIA Tesla V-100 GPU with 32 Gigabytes of RAM using TensorFlow (V2.0) framework running on Python (v3.6).
Outputs and Statistics
We evaluated model performance on independent test datasets which were not seen by the models during training and validation. For each model, the class-specific DSC and average DSC were reported. We also created integrated gradients maps (IGMs) for sample test images to demonstrate that both models are making decisions based on meaningful features within the images, enhancing confidence in performance reliability[20].
Image Processing
Workflow
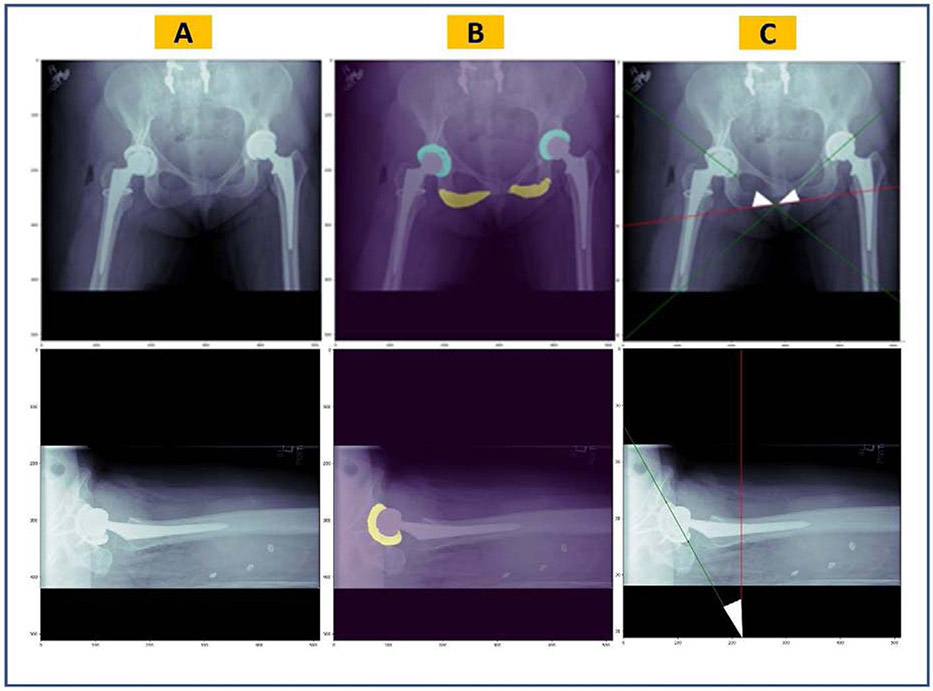
Semantic segmentation models generate a multi-channel 512×512-pixel mask for each input radiograph. The mask consists of three layers (acetabular component(s), ischial tuberosities and the background) for the AP model, and of two layers (acetabular component and the background) for the cross-table lateral model. An argmax function is used to convert the generated mask to a one-channel image such that there are non-zero-value pixels on regions of interest, and zero-value pixels elsewhere (Figure 3B). For example, this image will have pixels with a value of 1 in acetabular component regions, a value of 2 in ischial tuberosity regions, and a value of 0 for the rest of the image. We developed an algorithm to measure the acetabular component angles on these simplified representations of the original radiographs. The algorithm consisted of several successive steps. First, we optimized the segmentation masks generated by the U-Net models. To do so, we used the regionprops module from Scikit-Image framework (v0.16.2) to remove independent non-zero regions smaller than 150 pixels. This cut-off was determined empirically. Second, we searched the region of the acetabular component to find the two non-zero pixels which had the greatest distance from each other. From a geometric perspective, the line crossing those points would outline the acetabular component longitudinal axis. For the AP pelvis images, the most inferior points of both ischial tuberosities were also identified and a line was fit to those two points. Finally, the angle between the acetabular component longitudinal axis and the line tangent to the ischial tuberosity inferior borders was measured on AP pelvis radiographs. Similarly, the angle between the acetabular component longitudinal axis and a standard vertical line was measured on hip cross-table lateral images.
Figure 3.
Overview of the pipeline for automatic measurement of the acetabular component angles. (A) Original radiographic images, (B) predicted masks by the semantic segmentation U-Net models overlaid on the original images, (C) acetabular component longitudinal axes (in green) and the trans-ischial tuberosity line or standard vertical line (in red) which are estimated by image processing. Together, they form the inclination angle on AP pelvis images and anteversion angle on hip cross-table lateral images (white triangles).
Outputs and Statistics
We evaluated this algorithm on two random cohorts of 80 AP pelvis and 80 cross-table lateral radiographs. Neither of these cohorts were used to train or validate the segmentation models, nor for developing the algorithm. Two orthopedic surgeons manually annotated acetabular component angles on all images using the QREADS (v5.12.0) software[21]. Inclination angles ranged from 25.9° to 65.5° and anteversion angles ranged from 1.1° to 52.3° across the annotated images. To measure the acetabular component angles using our algorithm, we first generated segmentation masks for the radiographs using the U-Net models and then applied image processing on the generated masks. Finally, we compared human-level and machine-level measurements by descriptive reporting of inter-measurement differences. Additionally, the lines generated by the algorithm were plotted on sample original radiographs to demonstrate the image processing performance (Figure 3C).
Deployment
To increase the applicability of the tool in clinical and research settings, we used Tkinter (v8.6.10) to develop a GUI and packaged it into a standalone installer with PyInstaller (v3.6). Our program is compatible with any modern Windows or Mac computer, and it does not require any deep learning hardware or additional software packages (including Python itself).
RESULTS
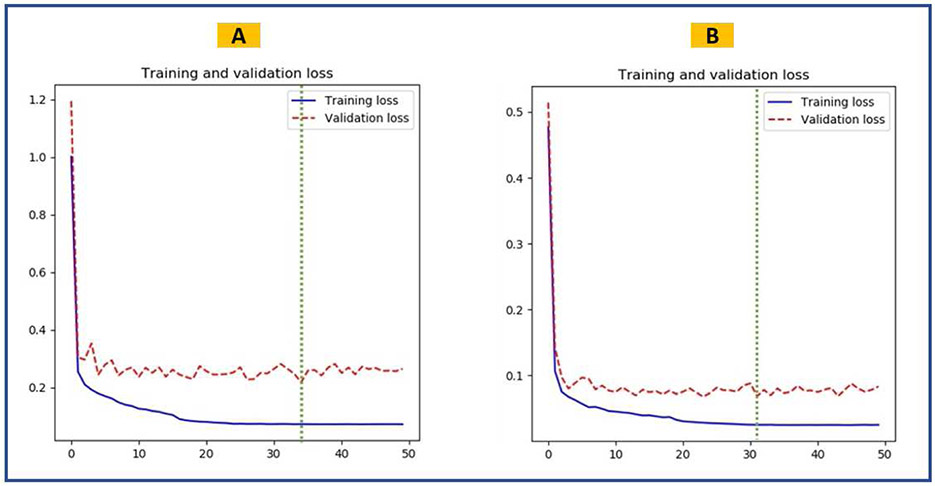
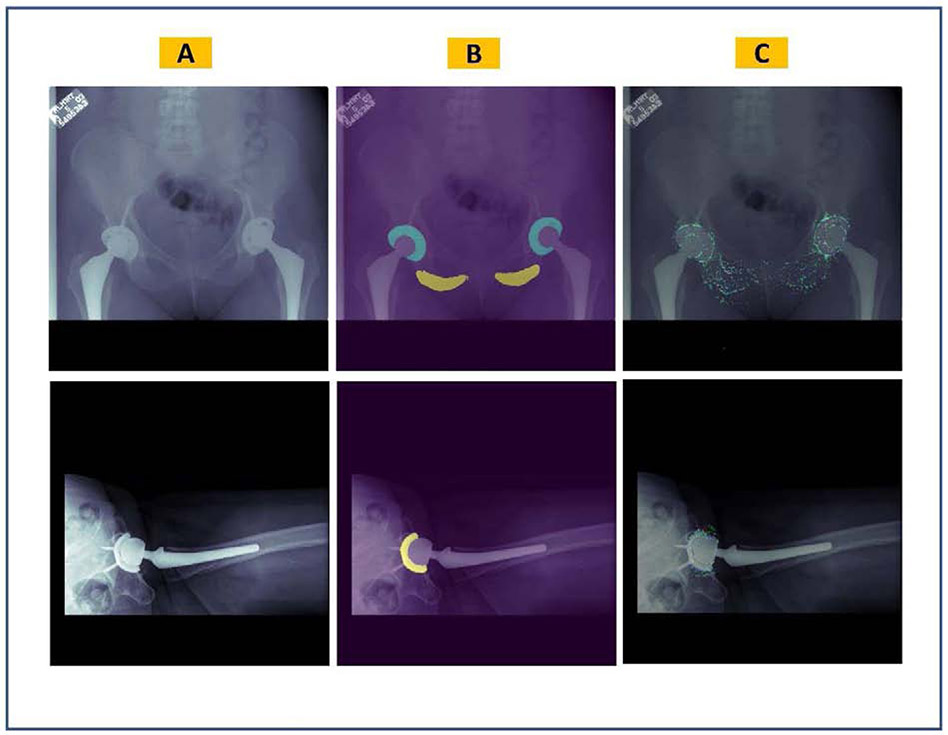
The U-Net models achieved a mean DSC of 0.878 and 0.903 in segmenting the input AP and cross-table lateral radiographs, respectively. Table 1 summarizes the performance of U-Net models on test datasets. Loss curves for training and validation datasets of both U-Net models are displayed in figure 4. Figure 5 shows representative input images, predicted masks, and IGMs for each U-Net model. Plotted IGMs provide evidence that both U-Net models placed emphasis on the acetabular component and the AP model also emphasized the ischial tuberosities.
TABLE 1.
Performance of the U-Net semantic segmentation models on the test datasets.
| Model | Performance Indicator | Value |
|---|---|---|
| Inclination Angle Model | Acetabular component DSC | 0.913 (σ=0.047) |
| Ischial tuberosity DSC | 0.843 (σ=0.082) | |
| Average DSC | 0.878 | |
| Anteversion Angle Model | Acetabular component DSC | 90.3 (σ=0.077) |
Figure 4.
Training performance of the semantic segmentation U-Net models. The green dashed line shows the epoch when the best model was saved. (A) Training and validation loss curves for the inclination model. (B) Training and validation loss curves for the anteversion model.
Figure 5.
Visualization of the semantic segmentation U-Net models overlaid on sample original images. (A) Original radiographic images, (B) predicted masks, (C) integrated gradients maps where the red color highlights the most influential pixels on the model’s predictions.
Figure 3 demonstrates how our algorithm measured acetabular component angles on representative postoperative radiographs. The mean absolute difference of machine-level and human-level acetabular component angle measurements were 1.35° (σ=1.07°) and 1.39° (σ=1.27°) over 80 AP and 80 cross lateral radiographs, respectively. In addition to the mean absolute difference being approximately 1.5 degrees or less, outliers were rare as evidenced by discrepancies of at least 5 occurring in less than 2.5% of evaluated cases.
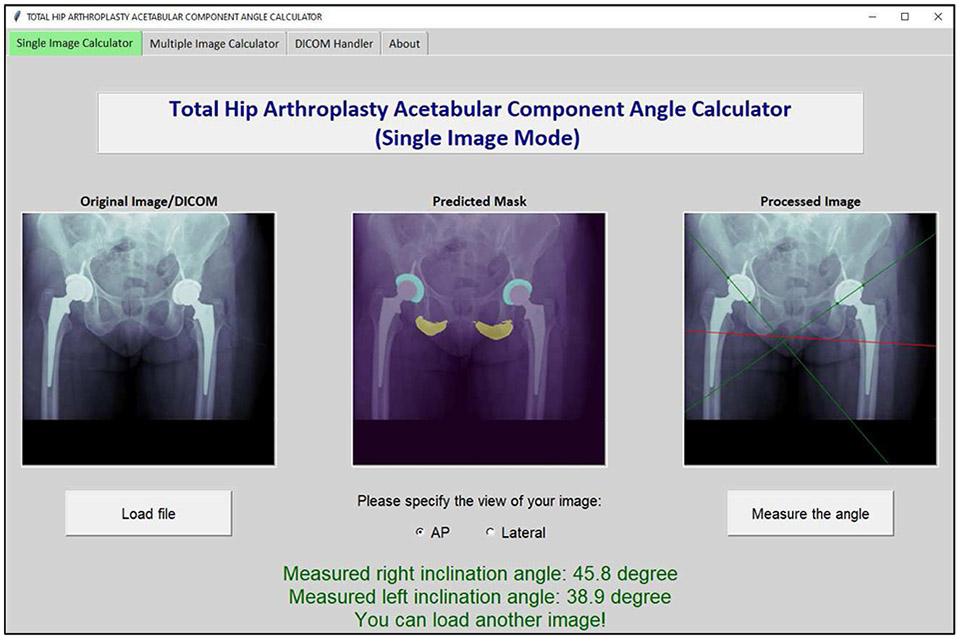
Figure 6 shows a screenshot from the Total Hip Arthroplasty Acetabular Component Angle Calculator software, a tool developed to deploy the U-Net models and their subsequent image processing workflow into a stand-alone GUI. The software can measure acetabular component angles on single or multiple PNG image (or DICOM) files. If applied over multiple files, it will generate a dataset of measured angles for all input radiographs. The software performs inference using the Central Processing Unit (CPU). On a Windows Machine with an Intel Core-i7-9750H CPU and 32 Gigabytes of Random-Access Memory (RAM), the mean time needed to measure a single acetabular component angle was 13 seconds. When an entire batch of 80 radiographs was queried simultaneously, the task completed in 545 seconds (mean 6.81 seconds per image). Supplement 2 includes detailed introduction of our software and its different applications.
Figure 6.
Screenshot from the Total Hip Arthroplasty Acetabular Component Angle Calculator software, a tool developed to deploy the semantic segmentation U-Net models and their subsequent image processing workflow into a stand-alone graphic user interface (GUI). The software can measure acetabular component angles on single or multiple PNG image (or DICOM) files.
DISCUSSION
Acetabular component inclination and anteversion angles denote positioning of the acetabular component following THA[22]. Different safe zones have been proposed for acetabular component angles, and therefore, measurement of those angles is essential to evaluate outcomes and risk-stratify patients[23]. Current digital tools require labor-intensive inputs from the user to measure acetabular component angles and are therefore prone to poor inter- and intr-aobserver reliability. We developed a fully automated tool to measure the acetabular component angles using deep learning semantic segmentation models and subsequent image processing. Our segmentation U-Net models were accurate and had high class-specific and average DSC scores.
The lowest DSC score (0.843) was observed in segmenting the ischial tuberosities on AP pelvis images (Table 1). During manual segmentation of AP images, we focused on accurate segmentation of the tuberosities inferior borders, which are critical in fitting the trans-ischial tuberosity line. The superior border of the tuberosity zone (which is not essential for image processing purposes) was annotated with slight variations. Therefore, the model learned an average of inconsistent segmentations for the superior border, and when it was evaluated on a single ground truth image from the test set, the DSC scores could be poor depending on how far the ground truth for the superior border deviated from the average learned by the model. Supplement 3 showcases this heterogenicity mathematically. The image processing algorithm had an absolute measurement error of less than 2.50° in 97.50% of both AP pelvis and hip cross-table lateral postoperative radiographs, making it a valid, reliable, and clinically applicable tool to annotate acetabular component angles. Additionally, our tool should reduce the time needed for measuring the acetabular component angles. Therefore, it can be incorporated into routine clinical practice and can also be used to annotate large imaging datasets for research. We recently used our tool to measure the acetabular angles on about 100,000 hip radiographs from our institution. Practically, it would be impossible to manually review that number of images for a clinical research study. However, the power added to studies by having discrete data on large volumes of patients is considerable.
IGMs are tools that highlight the importance of image areas or individual pixels in model decision making[20]. The IGMs generated by our segmentation models on representative images show that the U-Nets are looking at relevant regions of the input radiographs to segment the images. Also, we trained the segmentation models on datasets which were balanced based on sex, underlying pathology, and ultimate dislocation status. Because such factors may result in obvious or non-obvious imaging features in postoperative radiographs, the balanced datasets helped to train models that perform consistently when applied over different patient populations. Finally, plotting of the acetabular component longitudinal axis line and the trans-ischial tuberosity line showed that the image processing implemented by our tool is measuring the acetabular component angles in the standard way introduced in the literature. Due to the consistent nature of deep learning and image processing algorithms we used, our tool is reliable and will always produce the same result if applied to the same image.
Several digital image analysis softwares exist to help measure acetabular component angles[24][25][26]. Compared to our model, such alternative methodologies are primarily limited in 3 areas: 1) they require manual annotation by the user prior to running the model, 2) there is no way to determine if the acetabular component is anteverted or retroverted without a corresponding lateral image, and 3) They are all dependent on some inputs from the user (e.g. to outline the acetabular component and femoral head). To this latter point, we initially attempted to create a model that could measure both inclination and anteversion on an AP pelvis image. Inclination proved to be highly reliable; however, anteversion was more challenging, as annotation and segmentation of the acetabular component ellipse is extremely difficult in cases where the border between the acetabular component and the femoral head is not visible. In particular, defining the ellipse of the acetabular component can be nearly impossible for some implants, especially at low anteversion angles. As such, we created our anteversion angle measurement tool using the cross-table lateral image and the method described by Woo and Morrey, as this has the highest inter and intra-observer reliability. Given that only 2 lines have to be defined by the algorithm, this simplifies the deep learning task and results in improved model performance.
The main limitation of our tool was observed in images with poor patient positioning, such as rotation of the images over 45 degrees, images cropped such that the acetabular component or ischial tuberosities were not visible in the field-of-view, overlap of soft tissue obscuring the ischial tuberosities, and presence of unusual hardware in the field (e.g. periacetabular fracture hardware). These radiographs represent less than 2.5% of the images in the test dataset (Supplement 2). Model performance may still be acceptable in some of these cases; however, manual screening of the segmentation quality is recommended when applying the tool on such radiographs. The second limitation of our algorithm is that it does not control for the positioning of pelvis in radiographs before doing the measurements. In Woo and Morrey approach, the longitudinal axis of the acetabular component is being compared to a line perpendicular to the x-ray table as opposed to a fixed anatomic landmark. As such, altered positioning between patients, or with the same patient on subsequent radiographs, can potentially introduce inaccuracies[27]. Comparing the measured angles on radiographs with measurements done on CT-scans may reveal the inaccuracies, and prompt for clues to correct the radiographic measurements. Such experiments were beyond the scope of current study; however, our future work includes developing algorithms to correct radiographic acetabular angle measurements with respect to standard measurements done on CT-scans. We also aim to develop a separate model for measuring acetabular angles on preoperative radiographs.
CONCLUSION
We developed a digital tool to automate the measurement of the angular position of the acetabular component in THA on postoperative radiographs using deep learning semantic segmentation models and subsequent image processing. Performance metrics indicate highly accurate and precise measurements compared to human annotation, with very infrequent clinically relevant discrepancies. Our tool can reduce the interobserver variability and time needed to measure acetabular component angles and is therefore applicable for use in both clinical and research settings. Further work to validate the tool with respect to CT scan measurements are needed.
Supplementary Material
Figure 2.
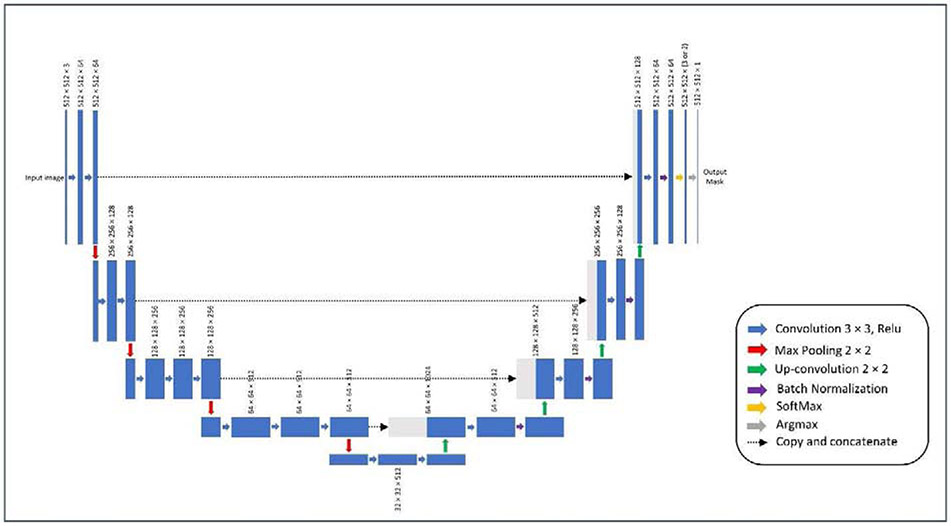
Architecture of U-Net CNN model used to segment the radiographic images. Encoder of the model had the VGG-16 architecture and its initial weights were pooled from a model pre-trained on the ImageNet database. The output of the model will initially have three channels (in AP model) or two channels (in cross-table lateral model). An argmax function will change this output to a one-channel 512×512-pixel mask, that is then used for image processing.
Acknowledgments
Funding: This work was supported by the Mayo Foundation Presidential Fund, and the National Institutes of Health (NIH) [grant numbers R01AR73147 and P30AR76312].
Footnotes
Publisher's Disclaimer: This is a PDF file of an unedited manuscript that has been accepted for publication. As a service to our customers we are providing this early version of the manuscript. The manuscript will undergo copyediting, typesetting, and review of the resulting proof before it is published in its final form. Please note that during the production process errors may be discovered which could affect the content, and all legal disclaimers that apply to the journal pertain.
REFERENCES
- [1].Learmonth ID, Young C, Rorabeck C. The operation of the century: total hip replacement. Lancet 2007;370:1508–19. 10.1016/S0140-6736(07)60457-7. [DOI] [PubMed] [Google Scholar]
- [2].Bozic KJ, Kurtz SM, Lau E, Ong K, Vail TP, Berry DJ. The epidemiology of revision total hip arthroplasty in the United States. J Bone Joint Surg Am 2009;91:128–33. 10.2106/JBJS.H.00155. [DOI] [PubMed] [Google Scholar]
- [3].Kunutsor SK, Barrett MC, Beswick AD, Judge A, Blom AW, Wylde V, et al. Risk factors for dislocation after primary total hip replacement: a systematic review and meta-analysis of 125 studies involving approximately five million hip replacements. Lancet Rheumatol 2019;1:e111–21. 10.1016/S2665-9913(19)30045-1. [DOI] [PubMed] [Google Scholar]
- [4].Abdel MP, Cross MB, Yasen AT, Haddad FS. The functional and financial impact of isolated and recurrent dislocation after total hip arthroplasty. Bone Joint J 2015;97-B:1046–9. 10.1302/0301-620X.97B8.34952. [DOI] [PubMed] [Google Scholar]
- [5].Biedermann R, Tonin A, Krismer M, Rachbauer F, Eibl G, Stöckl B. Reducing the risk of dislocation after total hip arthroplasty: the effect of orientation of the acetabular component. J Bone Joint Surg Br 2005;87:762–9. 10.1302/0301-620X.87B6.14745. [DOI] [PubMed] [Google Scholar]
- [6].Murray DW. The definition and measurement of acetabular orientation. J Bone Joint Surg Br 1993;75-B:228–32. 10.1302/0301-620X.75B2.8444942. [DOI] [PubMed] [Google Scholar]
- [7].Park Y, Shin WC, Lee S, Kwak S, Bae J, Suh K. The best method for evaluating anteversion of the acetabular component after total hip arthroplasty on plain radiographs. J Orthop Surg Res 2018;13:66. 10.1186/s13018-018-0767-4. [DOI] [PMC free article] [PubMed] [Google Scholar]
- [8].Woo RY, Morrey BF. Dislocations after total hip arthroplasty. J Bone Joint Surg Am 1982;64:1295–306. [PubMed] [Google Scholar]
- [9].Erickson BJ, Korfiatis P, Kline TL, Akkus Z, Philbrick K, Weston AD. Deep Learning in Radiology: Does One Size Fit All? J Am Coll Radiol 2018;15:521–6. 10.1016/j.jacr.2017.12.027. [DOI] [PMC free article] [PubMed] [Google Scholar]
- [10].Ronneberger O, Fischer P, Brox T. U-Net: Convolutional Networks for Biomedical Image Segmentation BT - Medical Image Computing and Computer-Assisted Intervention – MICCAI 2015. In: Navab N, Hornegger J, Wells WM, Frangi AF, editors., Cham: Springer International Publishing; 2015, p. 234–41. [Google Scholar]
- [11].Philbrick KA, Weston AD, Akkus Z, Kline TL, Korfiatis P, Sakinis T, et al. RIL-Contour: a Medical Imaging Dataset Annotation Tool for and with Deep Learning. J Digit Imaging 2019;32:571–81. 10.1007/s10278-019-00232-0. [DOI] [PMC free article] [PubMed] [Google Scholar]
- [12].Eaton-Rosen Z, Bragman FJS, Ourselin S, Cardoso MJ. Improving Data Augmentation for Medical Image Segmentation, 2018. [Google Scholar]
- [13].Liu S, Deng W. Very deep convolutional neural network based image classification using small training sample size. 2015 3rd IAPR Asian Conf. Pattern Recognit., 2015, p. 730–4. 10.1109/ACPR.2015.7486599. [DOI] [Google Scholar]
- [14].Deng J, Dong W, Socher R, Li L, Li K, Fei-Fei L. ImageNet: A large-scale hierarchical image database. 2009 IEEE Conf. Comput. Vis. Pattern Recognit., 2009, p. 248–55. 10.1109/CVPR.2009.5206848. [DOI] [Google Scholar]
- [15].He K, Zhang X, Ren S, Sun J. Delving Deep into Rectifiers: Surpassing Human-Level Performance on ImageNet Classification. 2015 IEEE Int. Conf. Comput. Vis., 2015, p. 1026–34. 10.1109/ICCV.2015.123. [DOI] [Google Scholar]
- [16].Kingma DP, Ba J. Adam: A Method for Stochastic Optimization. BT - 3rd International Conference on Learning Representations, ICLR 2015, San Diego, CA, USA, May 7-9, 2015, Conference Track Proceedings; 2015. [Google Scholar]
- [17].Andrews S, Hamarneh G. Multi-Region Probabilistic Dice Similarity Coefficient using the Aitchison Distance and Bipartite Graph Matching. ArXiv 2015;abs/1509.0. [Google Scholar]
- [18].Milletari F, Navab N, Ahmadi S-A. V-Net: Fully Convolutional Neural Networks for Volumetric Medical Image Segmentation. 2016 Fourth Int Conf 3D Vis 2016:565–71. [Google Scholar]
- [19].Lin T, Goyal P, Girshick R, He K, Dollár P. Focal Loss for Dense Object Detection. 2017 IEEE Int. Conf. Comput. Vis., 2017, p. 2999–3007. 10.1109/ICCV.2017.324. [DOI] [PubMed] [Google Scholar]
- [20].Sayres R, Taly A, Rahimy E, Blumer K, Coz D, Hammel N, et al. Using a Deep Learning Algorithm and Integrated Gradients Explanation to Assist Grading for Diabetic Retinopathy. Ophthalmology 2019;126:552–64. [DOI] [PubMed] [Google Scholar]
- [21].Eversman WG, Pavlicek W, Zavalkovskiy B, Erickson BJ. Performance and function of a desktop viewer at Mayo Clinic Scottsdale. J Digit Imaging 2000; 13:147–52. 10.1007/BF03167648. [DOI] [PMC free article] [PubMed] [Google Scholar]
- [22].Wang RY, Xu WH, Kong XC, Yang L, Yang SH. Measurement of acetabular inclination and anteversion via CT generated 3D pelvic model. BMC Musculoskelet Disord 2017;18:373. 10.1186/s12891-017-1714-y. [DOI] [PMC free article] [PubMed] [Google Scholar]
- [23].Lewinnek GE, Lewis JL, Tarr R, Compere CL, Zimmerman JR. Dislocations after total hip-replacement arthroplasties. J Bone Joint Surg Am 1978;60:217–20. [PubMed] [Google Scholar]
- [24].Craiovan B, Weber M, Worlicek M, Schneider M, Springorum HR, Zeman F, et al. Measuring Acetabular Cup Orientation on Antero-Posterior Radiographs of the Hip after Total Hip Arthroplasty with a Vector Arithmetic Radiological Method. Is It Valid and Verified for Daily Clinical Practice? Rofo 2016;188:574–81. 10.1055/s-0042-104205. [DOI] [PubMed] [Google Scholar]
- [25].Stilling M, Kold S, De Raedt S, Andersen N, Rahbek O, Søballe K. Superior accuracy of model-based radiostereometric analysis for measurement of polyethylene wear A PHANTOM STUDY. Bone Joint Res 2012;1:180–91. 10.1302/2046-3758.18.2000041. [DOI] [PMC free article] [PubMed] [Google Scholar]
- [26].Murphy MP, Killen CJ, Ralles SJ, Brown NM, Hopkinson WJ, Wu K. A precise method for determining acetabular component anteversion after total hip arthroplasty. Bone Joint J 2019;101-B:1042–9. 10.1302/0301-620X.101B9.BJJ-2019-0085.R1. [DOI] [PubMed] [Google Scholar]
- [27].Pulos N, Tiberi Iii JV 3rd, Schmalzried TP. Measuring acetabular component position on lateral radiographs - ischio-lateral method. Bull NYU Hosp Jt Dis 2011;69 Suppl 1:S84–9. [PubMed] [Google Scholar]
Associated Data
This section collects any data citations, data availability statements, or supplementary materials included in this article.


