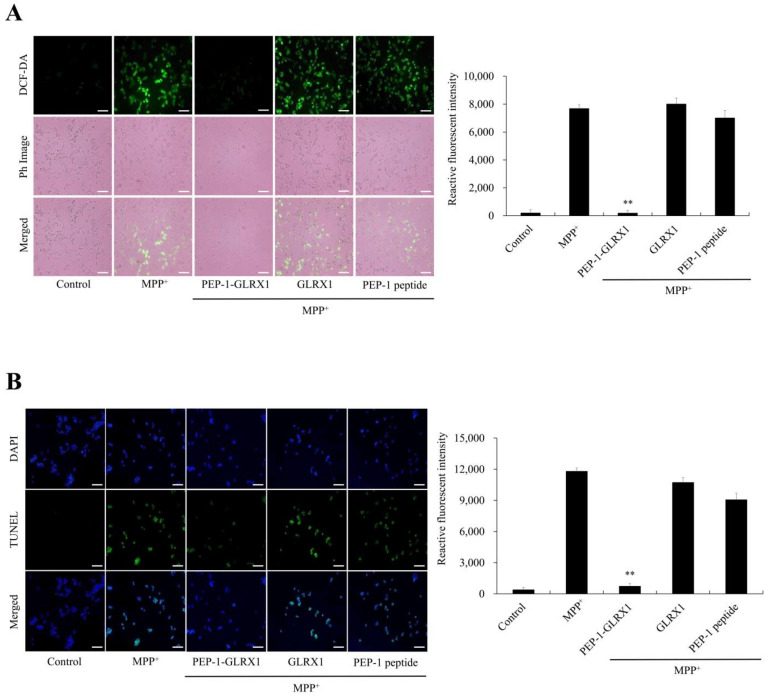
Figure 4.
Effects of PEP-1-GLRX1 against MPP+-induced ROS production and DNA fragmentation. SH-SY5Y cells were treated with PEP-1-GLRX1 or GLRX1 (3 μM) for 1 h before treatment with 5 mM of MPP+ for 1 h or 18 h, respectively. Then, intracellular ROS levels (A) and DNA fragmentation (B) were determined by DCF-DA staining and TUNEL staining. Fluorescence intensity was quantified using an ELISA plate reader. Scale bar = 50 μm. **p < 0.01 compared with MPP+-treated cells. The bars in the figure represent the mean ± SEM obtained from three independent experiments.

