Abstract
Degeneration of dopamine (DA) neurons in the midbrain underlies the pathogenesis of Parkinson’s disease (PD). Supplement of DA via L-Dopa alleviates motor symptoms but does not prevent the progressive loss of DA neurons. A large body of experimental studies, including those in nonhuman primates (NHP), demonstrates that transplantation of fetal mesencephalic tissues improves motor symptoms in animals, which culminated in open-label and double-blinded clinical trials of fetal tissue transplantation for PD1. Unfortunately, the outcomes are mixed, primarily due to the undefined and unstandardized donor tissues1,2. Generation of induced pluripotent stem cells (iPSCs) enables standardized and autologous transplantation therapy for PD. However, its efficacy, especially in primates, remains unclear. Here we show that over a 2-year period without immunosuppression, PD monkeys receiving autologous, but not allogenic, transplantation exhibited recovery from motor and depressive signs. These behavioral improvements were accompanied by robust grafts with extensive dopamine neuron axon growth as well as strong DA activity in Positron Emission Tomography. Mathematical modeling reveals correlations between the number of surviving DA neurons with PET signal intensity and behavior recovery regardless autologous or allogeneic transplant, suggesting a predictive power of PET and motor behaviors for surviving DA neuron number.
Reporting Summary
Further information on research design is available in the Life Sciences Reporting Summary linked to this article.
The advent of human pluripotent stem cells (hPSCs), including iPSCs, offers a continual source for producing a defined population of cells like DA neurons. Indeed, hPSC-derived DA neurons, following transplantation, form connections with host cells and improve motor functions in rodent3 and NHP4 PD models, leading to the preparation for clinical application5. Furthermore, the use of autologous iPSCs potentially avoids the necessity of immunosuppression for allogenic transplantation, a major practical challenge in clinics. The feasibility of the approach is demonstrated in NHP6,7 and excitingly in a PD patient for the first time8. However, until now only one monkey was reported to have limited motor behavior improvement7 and the PD patient showed minor recovery two years after autologous transplant8. These results raise a critical question if autologous transplantation therapy is effective.
Results
Generation and DA differentiation of iPSCs
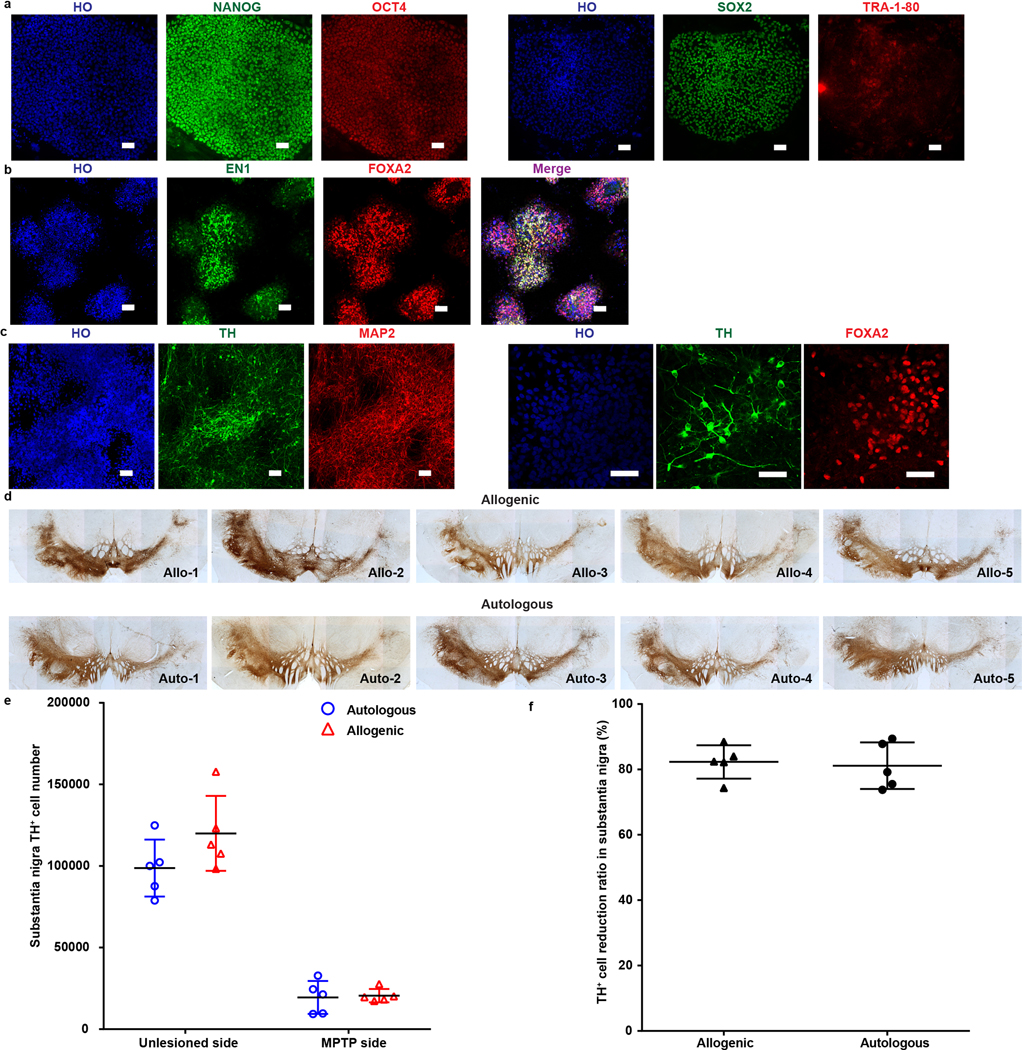
We established 5 rhesus iPSC (RhiPSC) lines from 5 of the 10 rhesus monkeys that were randomly assigned for autologous transplantation9. Another established RhiPSC line6 was used for allogenic transplantation. All the RhiPSCs expressed pluripotency markers (NANOG, OCT4, SOX2 and TRA-1–81) (Extended Data Fig. 1a). The RhiPSCs were then differentiated to midbrain DA neural progenitors following our protocol10. At day 30, the time for transplantation, the differentiated cell culture contained 91.5±3.2% FOXA2+ and 60.5±4.3% EN1+ DA progenitors (Extended Data Fig. 1b). The surplus progenitors from transplant were differentiated to MAP2-expressing neurons, and approximately 17.3±5.4% of the total cells expressed FOXA2 and TH (Extended Data Fig. 1c), markers for DA neurons.
Autologous and allogenic transplantation
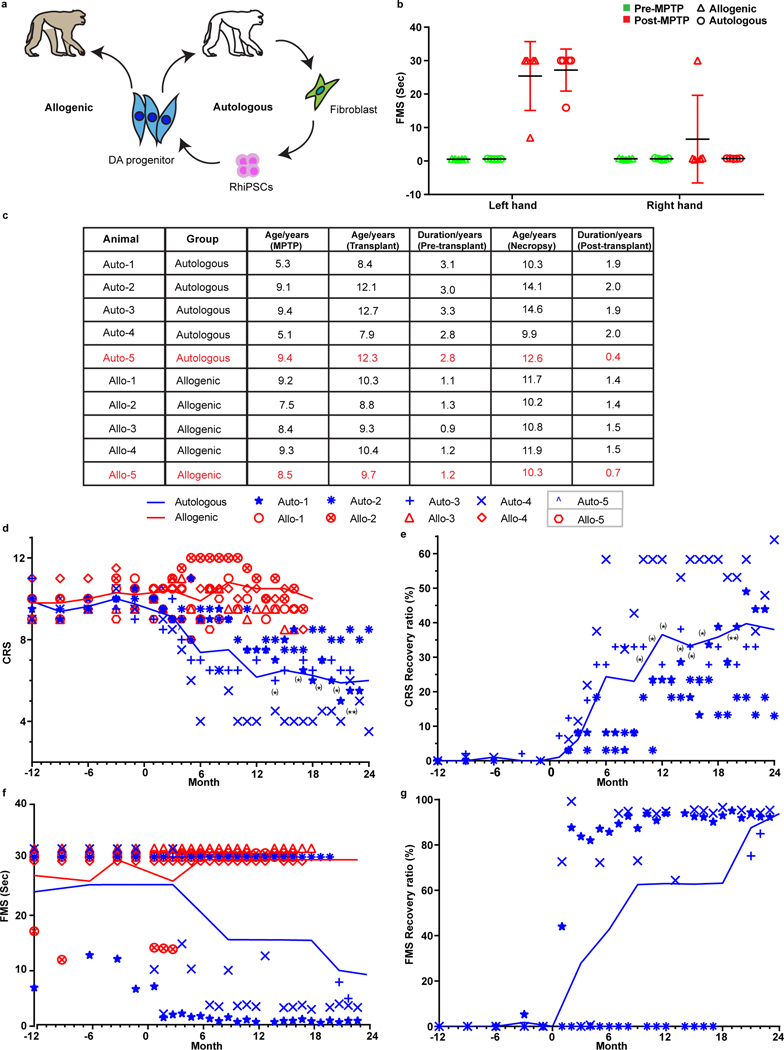
Age is an important factor affecting PD pathogenesis11 and the therapeutic efficacy in patients receiving fetal tissue transplantation12. NHP transplant reports often do not include animals’ age and/or time elapsed after MPTP intoxication3,7,13–16 or involve juvenile macaques (under 3 years old)4,17 which are less sensitive to MPTP and often spontaneously recover overtime4,7,18,19. We hence chose 10 rhesus macaques, aged 5–9 years (Fig. 1a,c), generated a stable hemiparkinsonian model20 by unilateral right intracarotid artery (ICA) infusion of the neurotoxin MPTP and assessed the animals’ parkinsonism using a clinical rating scale (CRS)20 and a fine motor skill (FMS)21. Monthly blinded evaluations showed that all the monkeys developed bradykinesia, postural and gait imbalances, as well as slight tremors and impairments in gross motor skills in the contralateral (left) hand (Fig. 1b), which persisted over the 1–3-year period before DA cell transplantation (Fig. 1b, d). Positron Emission Tomography (PET) with the radioligand 11C–labelled dihydrotetrabenazine ([11C]DTBZ), which binds to vesicular monoamine transporter 2 (VMAT2), indicated that all the monkeys had severe (>90%) unilateral loss of [11C]DTBZ binding potential (BPND) in the ipsilateral caudate and putamen when compared to the contralateral side (Fig. 2a) and such changes persisted over the 5–6-year period of the study, confirming decreased dopaminergic activity. Histological analysis validated the loss of over 80% of TH+ cells in the substantia nigra from both groups (Extended Data Fig. 1d,e,f).
Figure 1. Behavior evaluation of transplanted monkeys.
a, Experiment design of allogenic and autologous transplantation.
b, Pre- and post-MPTP fine motor skill (FMS) scores in monkeys from the allogenic and autologous groups. Each symbol represents one monkey. The data is presented as mean ± SD (n = 5 biologically independent monkeys in each group).
c, The age of each of the monkeys when they received MPTP, cell transplantation and necropsy. The monkeys highlighted as red died shortly post-transplantation.
d,e, Monthly CRS (d) and CRS improvement (e) of the monkeys receiving allogenic or autologous transplantation from 12 months before transplantation to 24 months after transplantation. The transplantation happened at month 0. Lines show mean values for every 3 months from the allogenic group or the autologous group. Significance was assessed by Friedman test (non-parametric statistical test) (d, e); * p < 0.05, ** p < 0.01.
f,g, Monthly FMS scores (f) and FMS improvement (g) in the monkeys receiving allogenic or autologous transplantation from 12 months before transplantation to 24 months after transplantation. The transplantation happened at month 0. Lines show mean values for every 3 months from the allogenic group or the autologous group.
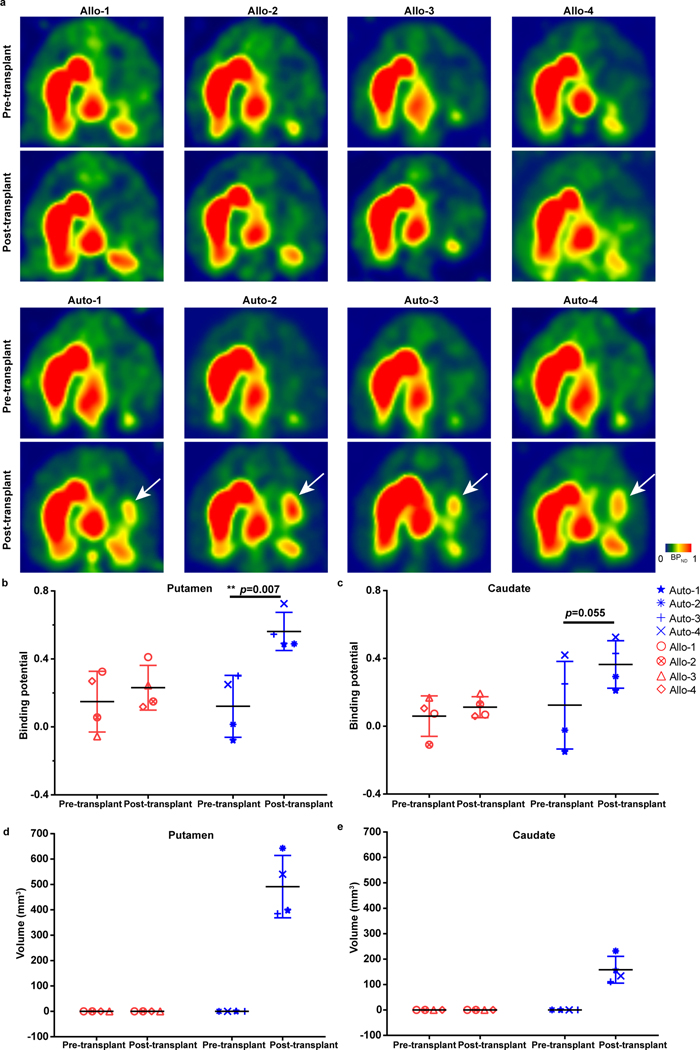
Figure 2. Graft evaluation in vivo by PET.
a, PET imaging with [11C]DTBZ from allogenic and autologous group at pre- and post-transplantation stages. The white arrows point to the grafts.
b,c, Quantification of [11C]DTBZ binding potential in putamen (b) and caudate (c) from the allogenic and autologous groups at pre- and post-transplantation stages. The data is presented as mean ± SD (n=4 for each group). Significance was assessed by a two-tailed, Paired t-test.
d,e, Quantification of the graft volumes in putamen (d) and caudate (e) from the allogenic and autologous groups based on [11C]DTBZ PET data threshold at pre- and post-transplantation stages. The data are presented as mean ± SD (n=4 for each group).
Cell transplantation in NHP PD models is usually conducted shortly (less than 1 year) after MPTP intoxication4,13,18,19. To mimic the clinical setting and ensure a stable PD model, we transplanted the DA progenitor cells 1~3 years after intoxication. The average time lapsed from MPTP treatment was 3 years for autologous transplant (Fig. 1c). The cells were targeted to the MPTP-treated putamen and caudate. Approximately 5.5~6 million total cells derived from the selected RhiPSC line were transplanted into the allogenic animals and 11–22 million cells to the autologous animals. The rationale for the different number of total cells grafted was to provide a similar number of DA neurons for each animal, given that the RhiPSC line used for the allogenic group had a higher DA differentiation efficiency (30%~40%)6,10 whereas the individual cell lines used for autologous transplant had variable and lower efficiency (10%~20%). The cells were infected with lentivirus expressing GFP one week before transplantation for visualization of the graft. During the study, we developed Real Time Intraoperative MRI (RT-IMRI) for accurate intracerebral cannula placement22, which requires 0.5–1 hour per target. To shorten the overall surgery time and decrease surgical risk, we did not transplant to the nigra in remaining animals. For this reason, the results were presented in parallel for both groups but the comparison and conclusion were made within the same group between pre- and post-transplant.
One monkey from each group, Auto-5 (post-anesthesia complications) and Allo-5 (severe anxious behavior), were euthanized at 4.8 months and 8.4 months post brain surgery, respectively, due to clinical reasons unrelated to cell transplantation (Fig. 1c). The rest of the animals remained in overall good health, and increased body weight overtime, as typically observed with aging rhesus macaques (Extended Data Table 1).
Behavioral improvement in grafted Animals
Unblinding of the collected data over 24 months following transplantation revealed that the animals with autologous grafts showed recovery while allogenic monkeys remained unchanged (Fig. 1d–g). In the autologous recipients, the amount of movement was increased and so were the speed and fluidity (Fig. 1d). The affected contralateral hand started to grasp or hold treats. Gait became less laborious and the four limbs were used while walking. Climbing in the cage, which is a slow and strenuous task for hemiparkinsonian monkeys, was greatly improved, so was the hunched posture. The CRS began to improve a few months after transplantation and stabilized during 6 to 12 months post transplantation with the average CRS recovery ratio of 40% and as high as 60% (Fig. 1e). FMS test showed that the ipsilateral hand in both groups was fully used and remained unchanged, although two allogenic monkeys (Allo-1, Allo-2) did not perform the task with either hand starting at month-11 post grafting without stimulation (Fig. 1f). The contralateral hand in the three allogenic animals (Allo-1, Allo-3, Allo-4) that failed to complete the task before grafting remained unable or worsened (Allo-4) afterwards. In contrast, the three autologous animals that previously required a longer time (Auto-1) or failed to complete the FMS task (Auto-3, Auto-4), started to progressively use the contralateral hand, completing the task with increasingly faster time (Fig. 1f,g). Thus, the monkeys with autologous but not allogenic grafts exhibited substantial improvement in motor function.
Besides motor deficits, the MPTP-induced PD monkeys displayed signs of mood disorders. After unblinding, Allo-2, Allo-3 and Allo-5 displayed anxious pacing (AP), defined as non-stop walking around the cage, after MPTP and the first 6 months post graft. This behavior was resolved or ameliorated in Allo-2 and Allo-5 (Extended Data Fig. 2a). Monkeys with lack of motivation (LOM) fail to interact with the tester to retrieve treats and remain seated or perched on a cage stand most of the time, which was observed in Allo-2 and Allo-5 before transplant. LOM persisted in Allo-5 throughout the study and developed in Allo-1 and Allo-3 (Extended Data Fig. 2b). Self-injury behavior (SIB) (e.g., overgrooming) was observed in Allo-1 and Allo-5 before transplant and worsened post-graft; Allo-3 developed episodes of SIB post graft (Extended Data Fig. 2c). In the autologous group, AP was present in all animals before and 6 months post-grafting and resolved overtime (Extended Data Fig. 2a). Auto-5 presented LOM before grafting that resolved after transplantation. SIB was not observed in autologous animals.
DA activity in grafted animals measured by PET
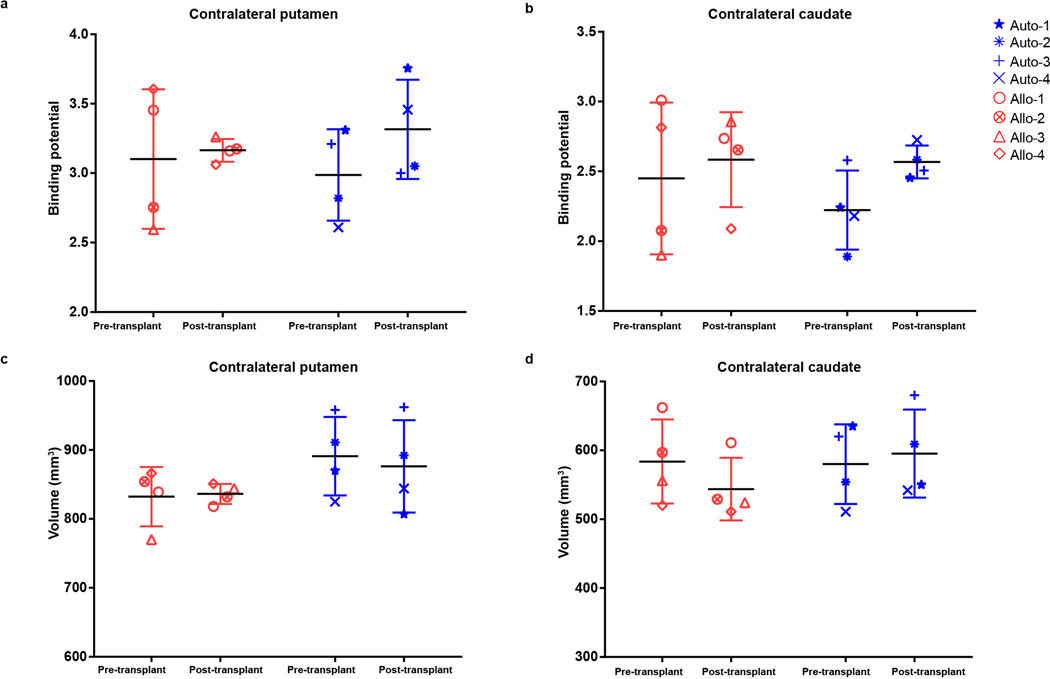
Compared to [18F]DOPA that measures aromatase activity and reflects in situ synthesis of dopamine and [11C]-PE2 that measures dopamine transporter activity23, [11C]DTBZ measures VMAT2 and is less affected by compensatory changes in the nigrostriatal DA system and long term use of PD drugs24. It is a validated method for monitoring PD progression25. PET with [11C]DTBZ at 12–18 months post-transplantation indicated that the BPND values for the contralateral putamen and caudate in all animals did not change over time (Fig. 2a, Extended Data Fig. 3a,b). In contrast, BPND values for the autologous animals in the ipsilateral putamen was increased by 366% (p=0.007) (Fig. 2a,b) and the caudate by 200% (p=0.055) following engraftment (Fig. 2a,c). In the allogenic animals, small (non-significant) increases of 60.0% and 66.7% were detected in the ipsilateral putamen (p=0.25) and caudate (p=0.64), respectively (Fig. 2b,c).
Based on PET measures, the volume of the autologous graft was 491.5±123.0 mm3 (Fig. 2d) in the putamen and 158.3±52.5 mm3 in the caudate (Fig. 2e). No graft volumes were detected in the allogenic animals based on the signal cut-off (Fig. 2d,e). The volume of the contralateral putamen in all animals did not change from pre-graft to post-graft (Extended Data Fig. 3c,d). Thus, the putamen with autologous but not allogenic transplant displays increased DA activity.
Histological evidence of grafts
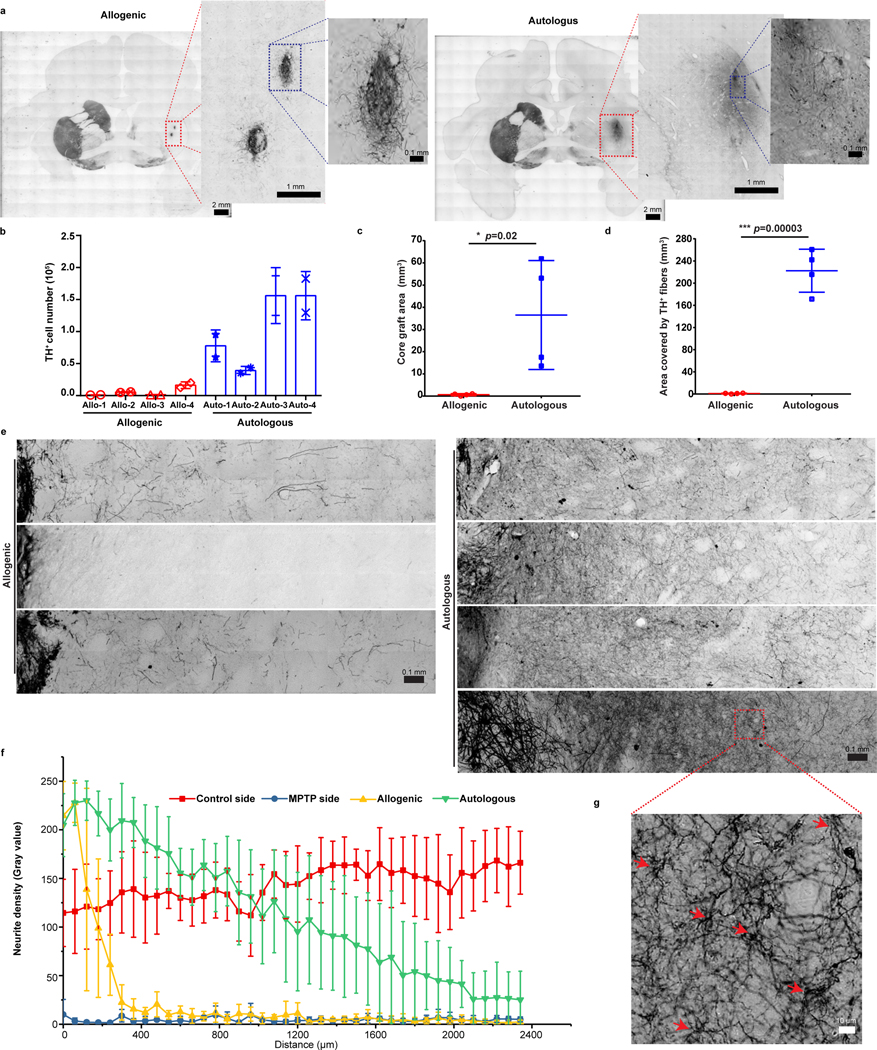
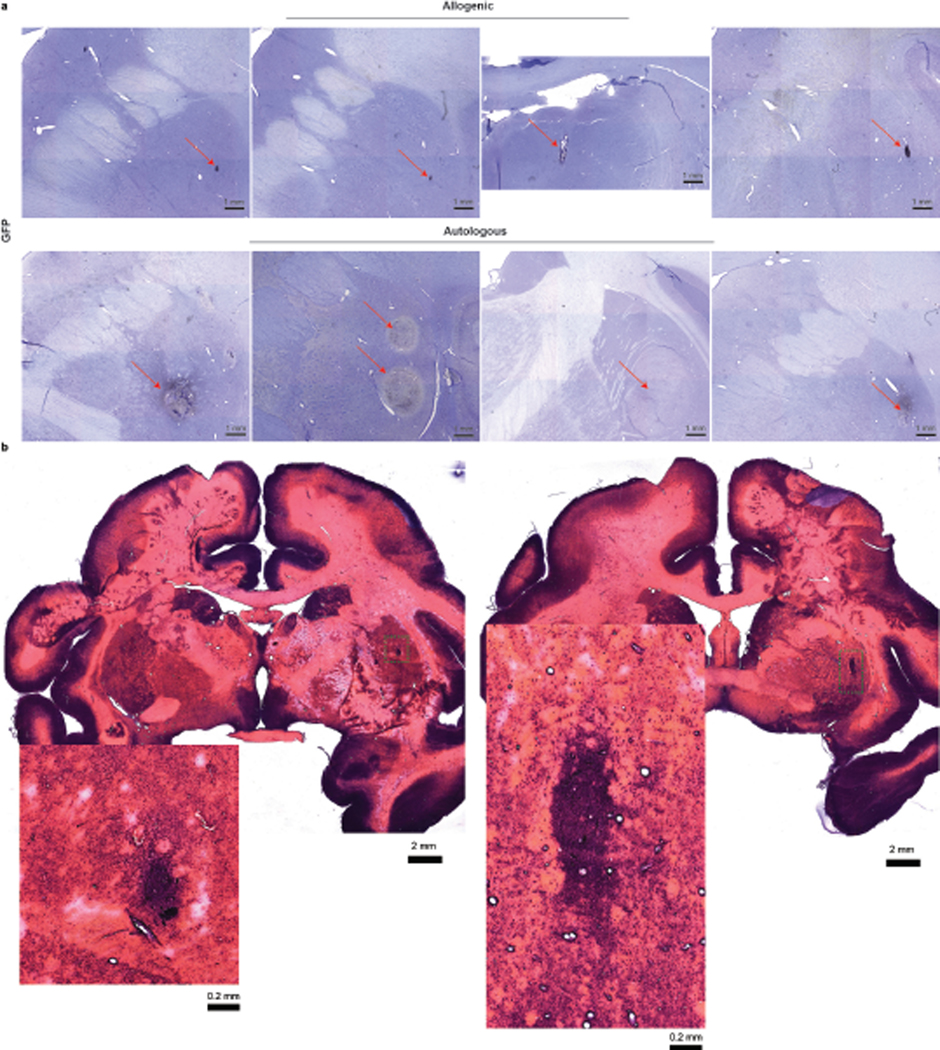
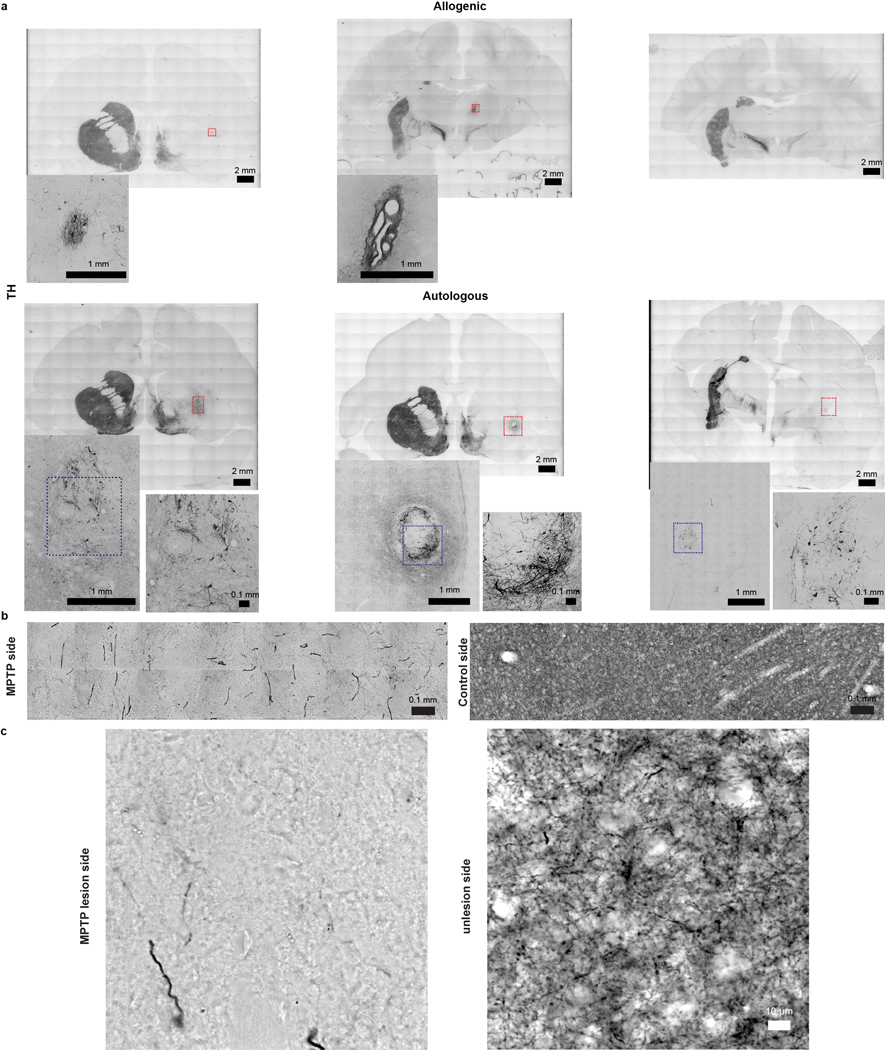
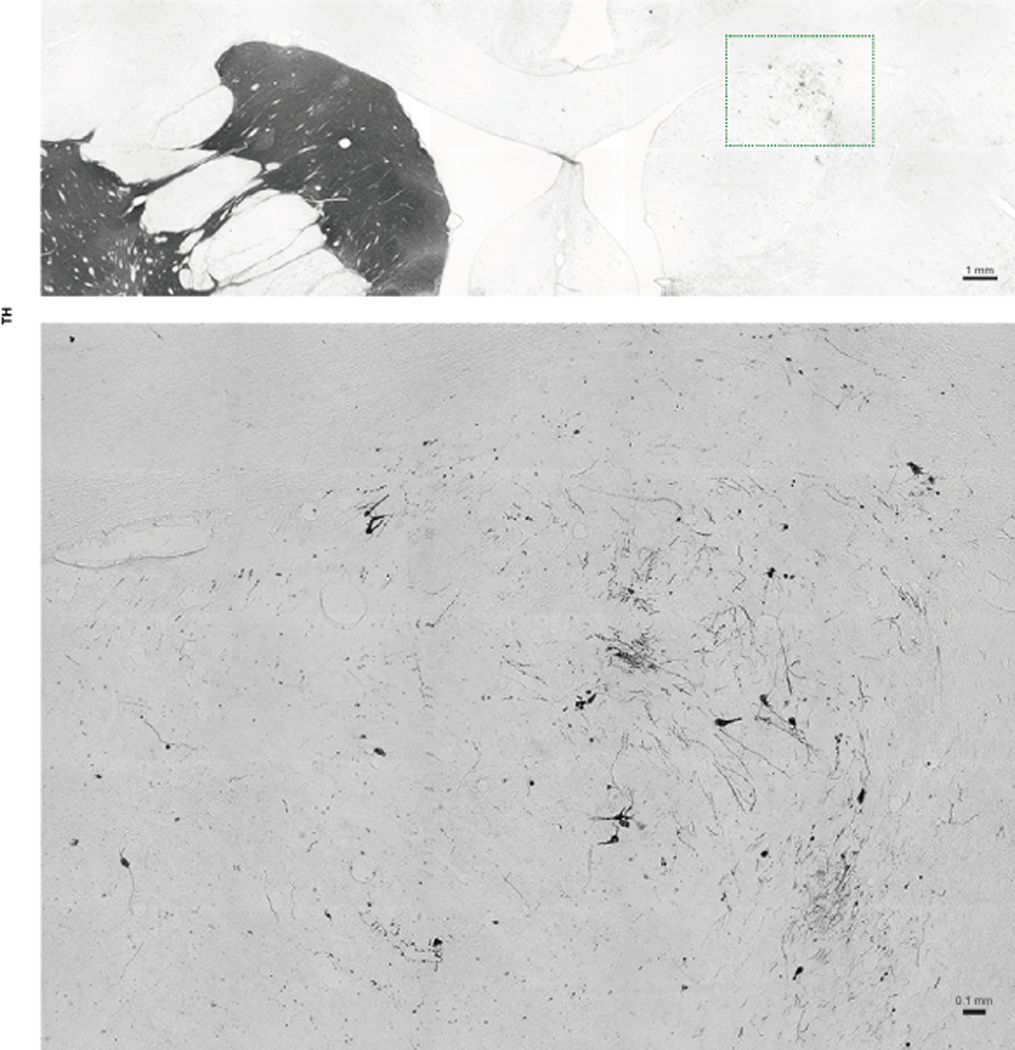
Evaluation of serial coronal brain sections stained with Nissl identified hypercellularity but no abnormal tissues in grafted areas, which was confirmed by H&E staining in autologous and allogenic animals (Extended Data Fig. 4a,4b). The allogenic grafts usually had a clear boundary whereas the autologous grafts often merged to the host tissues. This was also observed in TH immunostaining which demonstrated the presence of DA neurons in the grafts and extension of their DA fibers in the putamen up to 2 years post transplantation (Fig. 3a & Extended Data Fig. 5a). The TH+ neurons and fibers were also observed in the caudate of autologous animals (Extended Data Fig. 6) but not in the caudate and nigra of allogenic animals. Stereological measurement showed that the number of TH+ cells within the grafts were 0.61±0.70×10⁴ and 9.11±5.85×10⁴ cells in the allogenic and autologous animals, respectively (Fig. 3b). The graft core, defined as the minimal volume occupied by the transplanted cell bodies, was 0.63±0.46 mm3 and 36.51±2.45 mm3 in allogenic and autologous grafts, respectively (Fig. 3c).
Figure 3. Histological analysis of grafts.
a, Representative images of TH immunostaining in coronal brain sections from the allogenic and autologous groups. Enlarged images correspond to the grafts in putamen. All grafts (if present) in monkeys from both groups were examined. Data are representative of at least 3 sections having grafts from each monkey.
b, Stereological quantification of TH+ cell numbers in the grafts of allogenic and autologous groups. The data are presented as mean ± SD (n = 2 sets of serial brain sections from each monkey were quantified).
c,d, Quantification of graft size (c) and the area covered by TH+ fibers (d) from allogenic and autologous groups. The data are presented as mean ± SD (n = 4 biologically independent monkeys in each group). Significance was assessed by a two-tailed t-test.
e, Representative images of TH immunostaining of the grafts and the fiber extension area in the putamen from allogenic and autologous groups. All grafts (if present) in monkeys from both groups were examined. Data are representative of at least 3 sections having grafts from each monkey.
f, Quantification of neurite density from grafts of allogenic and autologous grafts, the control side and MPTP side without grafts. The data are presented as mean ± SD (n=4 for each group).
g, High magnification of fibers present in panel e (red square area). The red arrows indicate the branches of fibers. The histology was examined in all autologous monkeys. Data are representative of at least 3 sections having grafts in all autologous monkeys.
Due to the MPTP lesion, the TH+ fibers coming from the host substantia nigra were sparse in the putamen and caudate as compared to the unlesioned side (Extended Data Fig. 5b). High magnification images revealed that few fibers grew out of the grafts in the allogenic group while the fibers extended a long distance away from the graft in the autologous group (Fig. 3d,e). The space covered by TH+ fibers, defined as the maximal volume of the fibers extended from grafts, was 1.24±0.28 mm3 and 222.44±38.75 mm3 in the allogenic and autologous group, respectively (Fig. 3d). This is more clearly demonstrated by analyzing the optical density of the fibers away from the grafts at a given distance (Fig. 3e). In the unlesioned side, the distribution of TH+ fibers were even across the putamen (Fig. 3e, Extended Data 5b). In the lesion and graft side, the fiber density dropped sharply outside the allogenic graft whereas the fiber intensity decreased gradually and extended at least 2400 μm away from the autologous graft (Fig. 3f). More interestingly, the fibers from autologous transplantation exhibited extensive branches and numerous bead-like enlargements, structures typically seen in the nigral DA neurons from the host (Fig. 3g & Extended Data Fig. 5c). These results indicate the presence of substantial numbers of grafted DA neurons and their axons in the autologous animals.
Most of the grafted TH+ cells co-expressed GIRK2 (~70%) and the rest (~25%) Calbindin, signaling prevalence of A9 over A10 cell types (Extended Data Fig. 7a). A small population of neurons in the graft were positive for vGlu1 (glutaminergic), 5-HT (serotoninergic) and GABA (GABAergic) neurons (Extended Data Fig. 7b). COL1A1+ vascular leptomeningeal cells, which are present in hESC-derived DA grafts26, were observed in the host vasculature but not within the graft (Extended Data Fig. 7c).
Inflammatory and immunological response
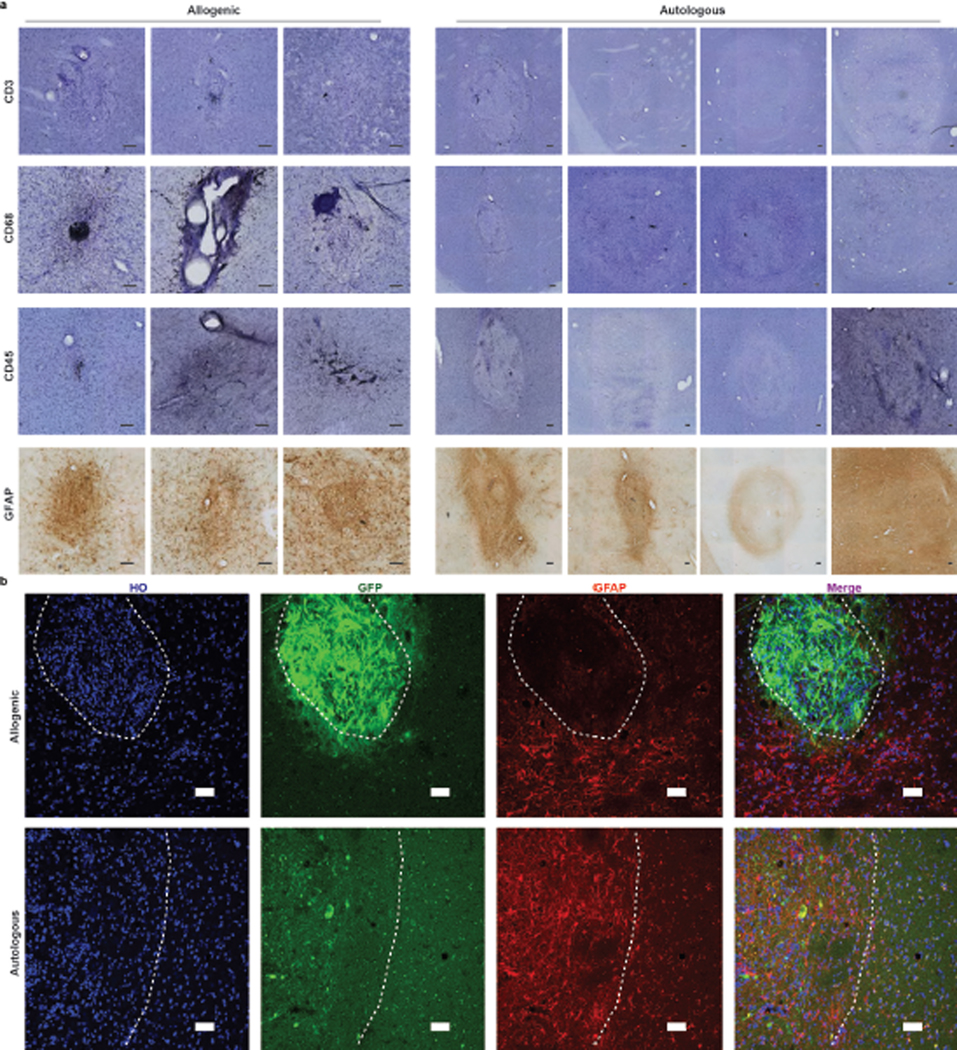
The presence of grafts in all the autologous animals but loss in some (not all) of the allogenic animals suggests immunological response to allogenic grafts. Immunostaining for markers representing T cells (CD3), leukocytes (CD45), microglia (CD68) and astrocytes (GFAP) indicated a substantially higher immunoreactivity in and around the grafts in the allogenic group than in the autologous group (Extended Data Fig. 8a). CD3+ and CD45+ positive cells were largely absent in the autologous grafts. CD68+ microglia/macrophages exhibited enlarged amoeboid-like cell bodies with shorter and thicker processes in the allogenic grafts as compared to ramified morphology in the autologous grafts. Similarly, GFAP+ astrocytes displayed a hypertrophic morphology in the allogenic group compared to ramified morphology in the autologous group. The increased intensity within the autologous grafts under the low magnification may reflect the increased density of astrocytes differentiated from the grafted cells as the GFAP-expressing cells were primarily in the grafts and they displayed a morphology similar to those in the surrounding tissues (Extended Data Fig. 8b). These results suggest an ongoing inflammatory and immunological response to the allogenic grafts that persisted up to 1.5 years post grafting.
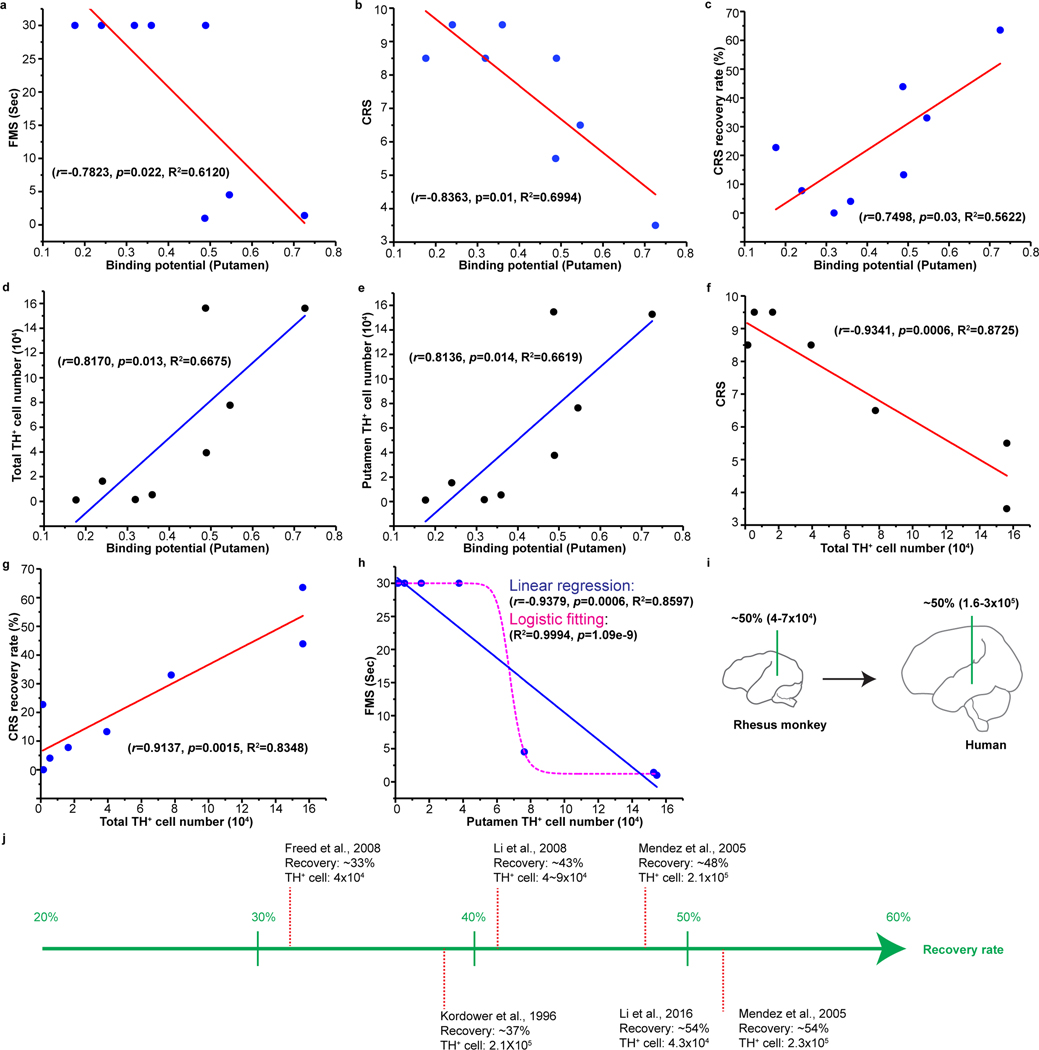
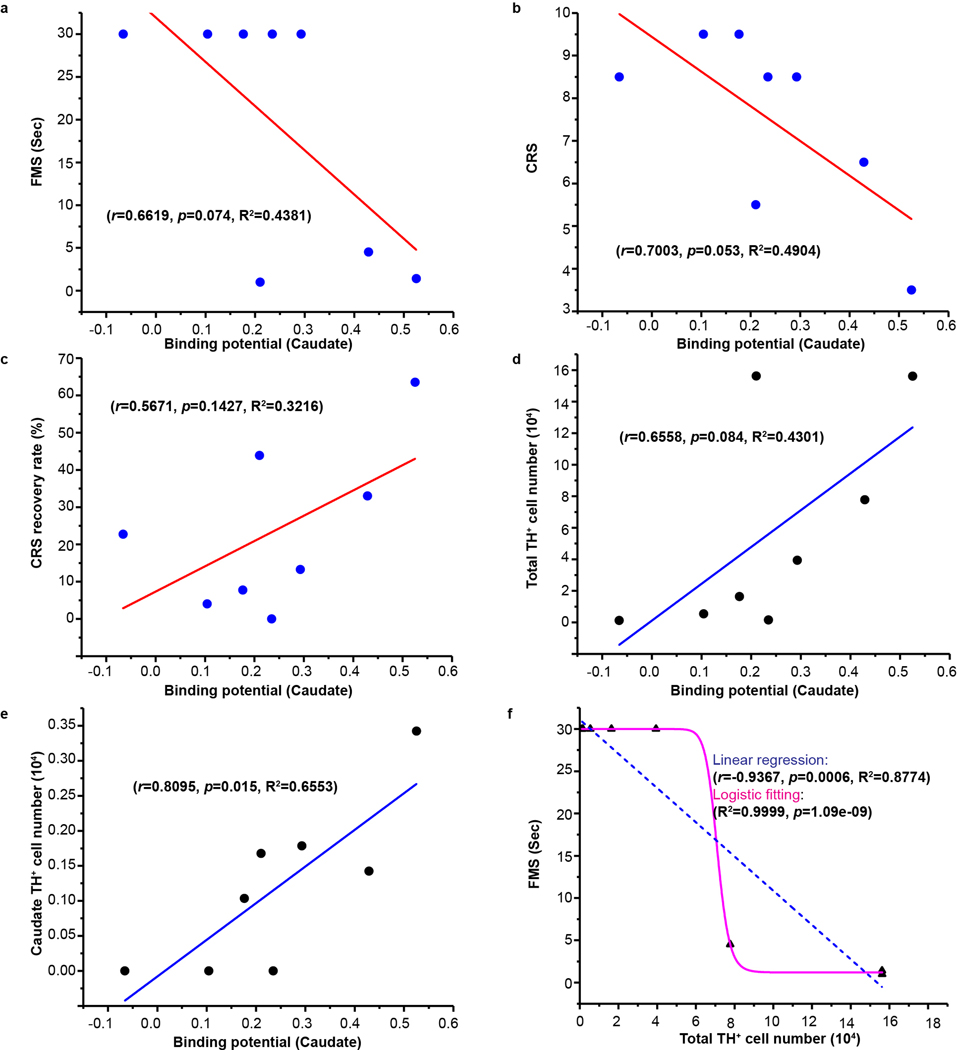
Correlation between transplanted DA neurons and outcomes of PET and motor function Linear regression revealed a significant correlation between motor behavioral scores and putamen (FMS: r=−0.7823, p=0.022; CRS: r=0.7498, p=0.03) (Fig. 4a,b) but not caudate BPND (FMS: r=−0.6619, p=0.074; CRS: r=−0.7003, p=0.053) (Extended Data Fig. 9a,b). Such a close correlation is better shown by the CRS recovery ratio in the putamen (r=0.7498, p=0.03) (Fig. 4c) but not caudate (r=0.5671, p=0.1427) BPND (Extended Data Fig. 9c). These results suggest that dopaminergic activity measured by [11C]DTBZ PET, especially in the putamen, is a reliable marker for therapeutic outcome.
Figure 4. Correlation analysis between behavior recovery, PET and DA neurons in grafts.
a,b,c, Linear regression analysis between FMS (a) or CRS (b) or CRS recovery rate (c) and putamen [11C]DTBZ binding potential.
d, Linear regression analysis between putamen [11C]DTBZ binding potential and total surviving TH+ neuron numbers.
e, Linear regression analysis between putamen [11C]DTBZ binding potential and putamen surviving TH+ neuron numbers.
f,g, Linear regression analysis between CRS (f) or CRS recovery rate (g) and total surviving TH+ neuron numbers.
h, Linear regression and logistic fitting analysis of FMS and putamen surviving TH+ neuron numbers in grafts. The Pearson’s r, significance (p value) and R2 (coefficient of determination) were assessed by two-tailed Pearson’s correlation analysis in a-h.
i, Predicted number of surviving TH+ neurons required for up to 50% motor recovery in PD humans based on the data from linear regression in panel (g) using rhesus monkey models.
j, The surviving TH+ neurons in grafts and recovery rate reported in studies using human fetal tissue transplantation.
The total surviving TH+ cells in the grafts among all the monkeys had significant correlation with the putamen (r=0.8170, p=0.013) (Fig. 4d) but not caudate BPND (r=0.6558, p=0.084) (Extended Data Fig. 9d). When the surviving TH+ cells were calculated separately per region (putamen and caudate), each region showed significant correlation with its BPND, respectively (Fig. 4e and Extended Data Fig. 9e). It suggests that the BPND can reasonably estimate the surviving DA neurons in the grafts.
Given the linear relationship between PET and motor scores and between PET and DA neuron numbers, both CRS (r=−0.9341, p<0.0001) (Fig. 4f) and CRS recovery rate (r=0.9137, p=0.0015) (Fig. 4g) significantly correlated with surviving TH+ cell numbers. For FMS, we applied the linear regression and logistic fitting to analyze its relationship with putamen or total surviving TH+ cells. Both models showed a significant correlation (Fig. 4h and Extended Data Fig. 9f), supporting the predictive function of DA neurons based on motor scores.
DISCUSSION
Our parallel allogenic and autologous transplantation studies in the monkey model of PD indicate that cell therapy is safe in both modes. Allogenic transplantation simplifies the production of large quantities of standardized cells for many recipients, thus substantially shortening the wait time and reducing the cost. The disadvantage is that the grafts were very small or not present without immunosuppression. The use of MHC matching donor cells may improve the engraftment by reducing the immune response27, but it does not appear to completely evade the immune response and immunosuppression still benefits the transplant outcomes27. Our finding, together with previous studies in NHP13,27 and patients28–30, suggests a necessity of immunosuppression for allogenic neural transplantation at least for a period, a consensus by the GForce-PD groups5. The need of immunosuppression and its potential complication may bring the healthcare cost much higher for allogenic strategy. In contrast, autologous cell therapy obviates the need of immunosuppression but increases the cost and wait time due to the need for iPSC generation, DA neuron differentiation and quality control. Ongoing technological innovation in the production of iPSCs and enriched DA neuron progenitors will likely make autologous transplantation therapy more effective and less costly.
In the present study, we attempt to mimic future clinical application by choosing older monkeys and in particular, transplanting the cells three years after PD induction. Even so, most autologous animals show substantial improvement in motor symptoms with correspondingly increased DA activity revealed by PET. It is also interesting to note that autologous grafts merge into the host tissue with extensive axonal growth/branches and do not have a clear border as allografts. Hence, autologous transplant therapy has its clinical potential, especially with regulatory approval.
Unexpectedly, autologous cell transplantation appears to substantially mitigate the development of the depression symptoms. Several factors may have contributed to this outcome, including grafted cell types and distribution. Indeed, the grafted cells comprised of both A9 and A10 types of DA neurons. More importantly, the DA neurites extend not only towards the dorsolateral putamen, but also the pre-commissural putamen and nucleus accumbens, suggesting the potential modulation of limbic system function by grafted cells and hence improvement in mood. Improvements in motor function and the monkeys’ wellbeing may also mitigate mood disorder signs, as they occurred in parallel.
Our systematic analysis reveals a linear relationship between the grafted DA neuron numbers and motor recovery and DA binding in PET imaging, which is not seen in NHP with xenografts4,18. The relatively large number of monkeys and the wide distribution of DA neuron numbers in the grafts allow us to form a predictive model. In our model, it requires 4×10⁴ to 7×10⁴ DA neurons in the putamen to achieve up to 50% recovery in motor scores (Fig. 4h). Considering the size of monkey putamen to that in human is around 1:4.3331, we expect a need of 160,000 to 300,000 DA neurons to achieve up to 50% recovery in patients (Fig. 4i). Analysis of published data using fetal ventral mesencephalic cells revealed that the number of DA neurons (40,000 – 230,000) in the postmortem brain and the corresponding improved motor behavior (from 30% to 50%)12,28,29,32,33 fall well in our projected model (Fig. 4j). Thus, our model may be useful to guide clinical design on the cell source/numbers and to predict the number of surviving DA neurons based on behavioral outcomes.
The study was aimed at mimicking future clinical application by using older rhesus monkeys and performing transplantation years after the onset of PD. We chose a unilateral, instead of bilateral PD model to enable the long-term study. It is hence possible that the behavioral recovery elicited by the grafted DA neurons may be amplified by the healthy side. Secondly, we modified the transplant procedure for some of the animals due to technological development (RT-IMRI) during the study. We decided to compare individual animals before and after transplantation rather than between the autologous and allogeneic groups. Finally, we did not use immunosuppression for any of the animals. Hence, we do not exclude that the allogenic transplantation can achieve significant behavior recovery when immunosuppression is applied.
Methods
Ethics statement
The present study was performed in strict accordance with the recommendations in the National Research Council Guide for the Care and Use of Laboratory Animals (8th edition, 2011) in an AAALAC accredited facility (Wisconsin National Primate Research Center, WNPRC, University of Wisconsin-Madison). Experimental procedures were approved by the Institutional Animal Care and Use Committee (IACUC) at the University of Wisconsin-Madison. All efforts were made to minimize the number of animals utilized and to ameliorate any distress caused by the experimental procedures outlined in this report.
Subjects
Adult male rhesus macaques (Macaca mulatta; 10–14 years old; 8–19 kg; Fig. 1c) were used in this study. The animals were individually housed in Group 3 or Group 4 enclosure (cage floor area 4.3 ft.2 or 6.0 ft.2 per animal, height 30 or 32 in.) in accordance with the Animal Welfare Act and its regulations and the Guide for the Care and Use of Laboratory Animals (8th edition, 2011) with a 12-hour light/dark cycle and room temperature of 21 ˚C. Throughout the study, the animals were monitored twice daily by an animal research or veterinary technician for evidence of disease or injury (e.g., inappetence, dehydration, diarrhea, lethargy, trauma, etc.), and body weight was monitored to ensure animals remained in properly sized cages. Animals were fed with commercial nonhuman primate chow (2050 Teklad Global 20% Protein Primate Diet, Harlan Laboratories, Madison, WI) twice daily, supplemented with fruits or vegetables and a variety of forage items and received ad libitum water. Nonhuman primate chow soaked in a protein-enriched drink (“Ensure˝, Abbott Laboratories, Abbott Park, IL) was offered to stimulate appetite as needed. Environmental enrichment opportunities were presented a minimum of 5 days per week. Enrichment toys and puzzles were provided on a rotational schedule to ensure novel stimulation and to engage animals’ species-typical curiosity and manipulatory behavior.
Generation of rhesus monkey iPSCs (RhiPSC)
Rhesus monkey primary dermal fibroblasts were isolated from skin tissue and cultured in the medium containing DMEM (Thermo Fisher Scientific, 11965–092) and 10% FBS. The RhiPSC were generated following the instructions from CytoTune-iPS 2.0 sendai reprogramming kit (Thermo Fisher Scientific, A16517). Briefly, 100,000 fibroblasts were plated per well of a 6-well plate. MOI of 5:5:3 for KOS, C-MYC and KLF-4 viruses were added to the fresh fibroblast medium when the confluency reached about 70%. 24 hours later the cultures were replaced with fresh medium (DMEM (Thermo Fisher Scientific, 11965–092) and 10% FBS) daily. On the sixth day after transduction Rock inhibitor (millporesigma, 555550) was added to the medium. Next day the fibroblasts were passaged as single cells at the density of 100,000 – 200,000 cells per 10-cm dish in the fresh medium supplemented with Rock inhibitor. 24 hours later, it was replaced with the RhiPSC culture medium (see below)34 and the cells were fed daily. At around day 12 after transduction, round shape RhiPSC colonies appeared which were manually picked up and transferred to 24-well plates for growth and characterization. Five RhiPSC lines for autologous transplantation were generated in this study. One RhiPSC line used for allogenic transplantation was generated previously6.
RhiPSC were cultured on MEFs as reported34. The culture medium consisted of DMEM/F12 (Thermo Fisher Scientific, 11330–032) and Neurobasal medium (Thermo Fisher Scientific, 21103–049) mixed at 1:1 ratio, 1× N2 supplement (Thermo Fisher Scientific, 17502–048), 1× B27 supplement (Thermo Fisher Scientific, 17504–044), 2 mM Glutamax (Thermo Fisher Scientific, 35050–061), 0.1 mM NEAA (Thermo Fisher Scientific, 11140–050), 0.1 mM β-mercaptoethanol (Sigma, M7522) and 2 mg/ml BSA (Sigma), supplemented with 20 ng/ml FGF2 (Wicell) and 2.5 μM IWR-1 (Sigma, I0161). RhiPSC are passaged every 4–5 days with TrypLE (Thermo Fisher Scientific, 12604–021). The split ratio was either 1:20 with Rock inhibitor or 1:6 without it.
Dopaminergic neuron differentiation
RhiPSC were differentiated towards midbrain DA neurons following the previous protocol10 with modifications. The monkey iPSCs were passaged by TrypLE in the RhiPSC culture medium supplemented with Rock inhibitor. On the next day, the medium was changed to DA neuron differentiation medium containing DMEM/F12, 1xN2 and 0.1 mM NEAA supplemented with 10 μM SB431542 (Stemgent, 04–0010-10), 2 μM DMH1 (Tocris Bioscience, 4126), 0.4 μM CHIR99021 (Tocris Bioscience, 4953) and 500 ng/ml SHH (R&D Systems, 464-SH) (day 1). The medium was changed every other day. On day 8, individual colonies of neuroepithelial cells were digested with 1mg/ml Dispase (Thermo Fisher Scientific, 17105–041) and gently blown off by a pipette. The aggregates were expanded in suspension with the same medium until day 16. Then the medium was switched to DMEM/F12, 1xN2 and 0.1 mM NEAA supplemented with 25 ng/ml SHH and 100 ng/ml FGF8b (PeproTech, 100–25). Cells at day 25 – 32 were used for transplantation or immunostaining. For generation of DA neurons, the neural spheres were digested into single cells by Accutase (Innovative Cell Technologies) and plated onto glass coverslips that were coated with polyornithine and Matrigel (Corning Life Sciences, 354230) in the neurobasal medium supplemented with 1xN2, 1xB27, 10 ng/ml BDNF (PeproTech, 450–02), 10 ng/ml GDNF (PeproTech, 45010), 200 μM ascorbic acid (Tocris Bioscience, 405–5), 1 μM cAMP (Sigma, D0627) and 1 ng/ml TGFβ3 (R&D Systems, 243-B3). One week before transplantation, the differentiating cells were infected with GFP lentivirus, which was described in a previous study6.
To minimize the variations among all the transplantations, we adopted specific procedures, as follows. 1) We only used low passage RhiPSC cells to ensure that their genome stability was not affected. 2) All the cell differentiation, preparation, quantification and delivery were performed by the same person using exactly the same procedures. 3) Each aliquot of cells per target site was delivered to the surgery room immediately before transplantation to maximize the cell viability and to control the time from cell preparation to transplantation. 4) In addition, the left-over cells or a small and duplicated aliquot of cells were differentiated for 7 days to validate the DA differentiation efficiency for the particular batch of grafted cells.
Parkinsonian model induction
Hemiparkinsonism was induced by unilateral (right) intracarotid artery (ICA) injection of 3–4 mg of neurotoxin MPTP-HCL (Sigma-Aldrich, St Louis, MO) in 20 mL saline solution delivered at a rate of 1.33 mL/min under sterile surgical conditions and isoflurane anesthesia, as previously described6. After MPTP administration, the animals were placed in quarantine for 72 hours, before returning to their home cages. All the 10 monkeys treated with ICA MPTP were selected for cell transplantation based on hemiparkinsonian symptom severity corresponding to a CRS total score of ≥9 points and a brain T1 MRI within normal parameters.
Clinical Rating Scale (CRS)
All behavioral training and evaluations used positive reinforcement to entice monkeys’ cooperation. Parkinsonian features were blindly assessed monthly using video recordings and a clinical rating scale (CRS) as described20. Scorers underwent reliability training and were blind to the condition of the animals. To enable the observation of different behaviors during the 15-minute recording session, an investigator familiar with the animal and blind to the condition, presented to the monkey small, desirable treats (e.g., marshmallows) on the top and bottom of the cage, to assess how the animal stood up, if the animal faltered or needed support. The investigator then presented a treat in the center of cage and moved it slowly to the right, encouraging the animal to take it. This process was repeated to the left side of the cage, with an overall aim to assess the use of each hand (motor skills) and also detect the presence of tremors. Before leaving the room, the investigator gently placed a big piece of fruit (e.g., half apple) in the animal’s cage to promote positive re-enforcement and help evaluate the animal’s manipulation of the object (e.g., use of one or both hands).
Eight parkinsonian motor signs were assessed and scored as follows: Tremor (left and right upper limbs): 0, absent; 1, slight-low amplitude; 2, moderate amplitude, present most of the time; 3, severe-high amplitude, virtually continuous, interferes with function. Posture: 0, normal erect; 1, stooped; 2, face down. Gait: 0, normal, uses all 4 limbs smoothly; 1, one-sided circling; 2, walks slowly; 3, markedly impaired, able to ambulate but very slowly and with effort; 4, severe decrease in ability to ambulate; 5, unable to ambulate. Bradykinesia: 0, normal speed and fluidity of movements; 1, one side used only; 2, mild slowing of overall movements; 3, moderate slowing of movements; 4, severe slowing of movements, slow, labored and difficult to initiate and maintain movement; 5, essentially no movement (akinetic). Balance: 0, normal balance; 1, mild loss of balance on arising or with movement, holds onto cage for support; 2, major lapses in balance. Gross motor skills (left and right upper limbs): 0, normal, uses limbs through a wide range of motion and activities; 1, noticeable decrease in capacity to use a limb, but used consistently; 2, severe decrease in capacity to use limbs, rarely used; 3, unable or refuses to use limbs (will use for walking); 4, unable to use limbs including walking. Hypokinesia: 0, normal amount of movement; 1, moderate decrease in the amount of movements; 2, essentially no movement (akinetic). Freezing: 0, absent; 1, present for up to 10 s; 2, present for over 10 s. An additional half decimal (0.5) was given for presentations in between whole number ratings. The final score was obtained as the sum of the eight scores described above. Out of a total of 32 points, 0 corresponds normal condition and 32 to extreme disability. A score between 9–12 is typical of a stable hemiparkinsonian syndrome.
During the scoring sessions, abnormal movements (orofacial dyskinesia, dystonia, and chorea axially and for upper and lower limbs), vomiting and mood-related behaviors (e.g., pacing, increased aggressiveness, lack of attention) were evaluated separately and recorded as absent (0) or present (1). Rhesus’ mood-related behaviors were classified as anxious pacing (AP), lack of motivation (LOM) and self-injury behavior (SIB). AP was identified as non-stop walking around the cage, which maybe observed as intense and intended circling, usually in one direction, mainly towards the side of ipsilateral nigral cell loss. Rhesus with LOM failed to interact with the tester to retrieve treats and remained seated or perched on a cage stand most of the time. LOM was further confirmed by bilateral lack of performance during the FMS testing sessions. SIB is a sign of severe anxiety and was diagnosed by observing the animal overgrooming or biting itself and by the presence of small lesions in arms, legs, or head.
Fine Motor Skills (FMS)
FMS were assessed once a month using a monkey movement analysis panel in a food retrieval task as described21. FMS training and evaluations used positive reinforcement to entice the cooperation of the monkeys. The animals were trained to a stable level of performance before MPTP administration.
Each test consisted of twelve total trials alternating between arms, six per side. The animals had a period of 30 seconds to complete a trial. Feeding time was delayed until after the FMS session was finalized to ensure the compliance of the animals with the test. The data collected included the time taken for the animal to move its hand into the chamber where the fruit was located (reaction time), the time taken to pick up the fruit while the hand was in the chamber (reception time) and the total time taken to move the hand into the chamber, retrieve the fruit and bring the hand back out of the panel and into the cage (total time). If after the allotted waiting period the animal did not complete the task for the given hand, the total time for that trial was considered to be 30 seconds. The total time in seconds is reported as the mean for the session.
PET imaging and analysis
Animals underwent positron emission tomography (PET) with [11C]DTBZ to assess in vivo dopaminergic activity in the basal ganglia. [11C]DTBZ was produced at the UW–Madison Medical Physics cyclotron following procedures adapted from previously validated methods35.
Scans were performed in a microPET Focus 220 scanner under isoflurane anesthesia, (1–3% in 100% O2,1 L/min); vital signs (respiration, temperature, heart rate) were monitored. The monkeys were placed in the prone position and their head secured in a stereotaxic frame. After a 15-min transmission scan, the radioligand was injected as an IV bolus (~5.2 mCi) over 30 s. Dynamic PET images were obtained for 1 h with conventionally increasing frame durations (6 × 30 s, 3 × 60 s, 2 × 120 s, 10 × 300 s).
Region of interest (ROI) analysis was performed using Asipro (Concorde Microsystems, Knoxville, TN). ROIs were drawn on the coronal image set for both putamen and caudate nucleus of the contralateral side, using the 50 percent of maximum threshold as the region boundaries. Regions were established for the ipsilateral side by applying the same regions to images that had been reflected across the sagittal midplane. Bilateral regions were drawn on three consecutive transverse planes on the brain surface of the occipital pole and combined to produce a single occipital cortical region.
All five regions were applied to the dynamic image series to produce time-activity curves (TAC). BPND values36, reflecting the availability of the VMAT2, were estimated for the four basal ganglia regions using the simplified reference tissue method 37 with the occipital cortex serving as reference tissue and parametric images of BPND were generated using MRTM238. To generate precise ROIs of the graft sites, only voxels in the ipsilateral putamen with BPND > 0.35 were used to indicate the spatial extent of the grafts. Using the AMIDE software (Crump Institute for Molecular Imaging, UCLA School of Medicine, Los Angeles, CA), the volume of the graft extent was estimated. This analysis was repeated for the contralateral putamen.
Cell transplantation
Three months after MPTP dosing, the 10 animals were matched by clinical rating scores and blindly assigned to one of two different treatment groups. Up to 36 months post intoxication the macaques received injections of allogenic (n=5) or autologous (n=5) iPSC-DA in the basal ganglia ipsilateral to the MPTP ICA injection (right) under sterile surgical conditions and isoflurane anesthesia. Cells were administered unilaterally ipsilateral to the MPTP ICA infusion.
The allogenic grafts were delivered using MRI-guided stereotaxic methods (based on a pre-surgery baseline MRI) in a surgical suite using a 10 μl Hamilton syringe and a motorized syringe pump as previously described6. The autologous cells were intracerebrally delivered using Real Time-Intraoperative Magnetic Resonance Imaging (RT-IMRI) guidance in a 3-tesla GE Discovery MR750 scanner using validated methods22. The RT-IMRI system utilized a pivot point-based MRI-compatible external trajectory guide (Medtronic Inc., Minnesota, MN) to guide a fused silica single endport cannula (Engineering Resources Group, Inc. Pembroke Pines, FL). The cannula has a 100-mm long shaft with an inner diameter of 0.490 mm and an outer diameter of 0.650 mm. A clear infusion line (FEP Fluoropolymer infusion line, IDEX Health & Science, Lake Forest, IL) with an inner diameter of 0.500 mm was used to connect the cannula to a pressure transducer fixed to a 100 μL Hamilton syringe (Hamilton, Reno, NV). A MRI-compatible syringe pump (PHD 2000, Harvard Apparatus, Inc., Holliston, MA) was used to drive the syringe. Uploading of sterile cell suspension in artificial CSF into the system was done through the cannula using the MRI-compatible syringe pump attached to the control mechanism of the standard Harvard apparatus PHD 2000. The cannula attached to the loading lines was secured in place by an MRI-compatible uploader device (Engineering Resources Group, Inc.; Pembroke Pines, FL). A pressure-monitoring and infusion pump controller (Engineering Resources Group, Inc. Pembroke Pines, FL) was used to regulate the infusion and monitor pressure in the infusion line. The real time targeting utilized RTHawk scanner interface (HeartVista, Los Altos, CA), and the VURTIGO toolkit (Visual Understanding of Real-Time Image Guided Operations, Sunnybrook Health Sciences Centre; Toronto, Canada) to allows the operator to align the trajectory guide with real-time feedback in an interactive manner22. Real-time scan control and visualization was conducted on a high-performance external workstation with two quad-core Intel Xeon E5620, 2.4 GHz CPUs, 12 GB of memory, an NVIDIA GF100 Quadro 4000 graphics card, and dual gigabit Ethernet controllers, running 64-bit Linux. Scanner interface was via an internal Ethernet switch. The operator tracked the position of the MR-visible fluid-filled alignment stem through a screen placed in the scanner room window.
The cells were delivered to the surgery room approximately 1 hour before transplantation. For allogenic transplantation, the animals received 3 injections in the caudate (rostral 5 μl, medial 10 μl, caudal 10 μl), 3 in the putamen (rostral 10 μl, medial 10 μl, caudal 5 μl), and 1 in the substantia nigra (5 μl) of a suspension containing 100,000 cells/μl; a total of 5.5–6 millions of cells. For the caudate and putamen nuclei, the cells were distributed in 1–2 deposits per needle track; the needle tracks were separated 2–3 mm in the coronal plane, with the most rostral target immediately anterior to the anterior commissure. For autologous transplantation, a total of 11–20 million autologous iPSC-DA cells were inoculated in the commissural and postcommissural putamen and caudate nuclei, distributed across 3 cannula tracts, each with 2–3 deposits of 20–30 μl per deposit. All infusions were performed at a rate of 3 μl/min. The cannula remained in place for at least 5 minutes after completion of the injection and before retrieval. After the last injection was completed and a 5-minute post-infusion period lapsed, the cannula was retracted and the incision was closed in layers.
Necropsy, tissue analysis and Immunostaining
Up to 24 months post cell transplantation the animals were deeply anesthetized with sodium pentobarbital (25 mg/kg IV) and transcardially perfused with heparinized saline, followed by 4% paraformaldehyde (PFA). The brains were retrieved and processed for immunohistochemistry as previously described6. Briefly, after the brains were post-fixated for 24–48 hs in 4% PFA and cryoprotected in graded sucrose levels, the tissue was cut frozen (40 μm sections) on a sliding microtome. Serial brain coronal sections across the nigrostriatal system from all monkeys were immunostained with antibodies and counterstained with Nissl (with exception of TH). Immunostaining of tissue sections from animals in the different treatment groups were performed in parallel and included negative and positive controls. For cell culture in vitro, the immunostaining was performed as described previously39. Antibodies used in this study were TH (Immunostar, 22941; Millipore, AB152), CD68 (DAKO, M0814), CD45 (DAKO, M0701), CD3 (DAKO, A0452), FOXA2 (R&D systems, AF2400), NANOG (Stemgent, 09–0020), OCT4 (Santa Cruz Biotechnology, sc-5279), SOX2 (R&D systems, AF2018), TRA-1–80 (Santa Cruz Biotechnology, sc-21706), EN1 (DSHB, 4G11-c), GFAP (DAKO, Z0334), GIRK2 (Alamone Labs, APC006), Calbindin (Sigma, HPA023099), COL1A1(R&D systems, AF6220), vGLUT1 (synaptic systems, 135303), 5-HT (Immunostar, 20080), GABA (Sigma, A2052) and GFP (Millipore, MAB3580).
Unbiased stereological methods were used for quantification of TH+ neurons in the right and left substantia nigra and the grafts as described40. The stereology system consists of the StereoInvestigator v10.0 software (MicroBrightField, Williston, VA), and a Zeiss Axioimager M2 microscope (Carl Zeiss, Inc.) hard-coupled to a MAC5000 high precision computer-controlled x-y-z motorized stage and a MicroFire CX9000 camera (Optronics, Goleta, CA). The substantia nigra was outlined under a low magnification (2.5x). The total number of TH+ neurons within the counting frame was counted using a 100x oil immersion objective. Six equally spaced (480μm apart) sections from each subject containing the substantia nigra were used for analysis. The grafts were outlined under low magnification (2.5x) following the boundary of the cell core. All sections (480μm apart) from each subject containing the graft were used for analysis. Only the TH+ cell bodies within the counting frame were counted using a 100x oil immersion objective.
Other body tissues collected at necropsy were stomach, duodenum, pancreas, jejunum, cecum, colon, liver, gallbladder, lung, kidneys, thyroid glands, adrenal glands, spleen, skeletal muscle, urinary bladder, diaphragm, testes, bone marrow, thymus, lymph nodes, aorta, and heart, as well as any lesions noted during gross examination. The tissue samples were fixed in 10% neutral buffered formalin (10% NBF), routinely processed, embedded in paraffin, sectioned into 5 μm slices, and stained with hematoxylin and eosin40. Tissues were histologically evaluated by a board certified veterinary pathologist blind to the treatment condition of the animals.
Statistical analysis
Data collection and analysis were performed by investigators blind to the treatment groups. Statistical analysis was performed using GraphPad Prism (version 8.0, GraphPad Software) and R v3.5.3 (R Foundation for statistical Computing, Vienna, Austria). The data are presented as mean ± SD. A p<0.05 was considered significant. The p-values for the PET comparisons were calculated by a two-tailed, Paired t-test using R v3.5.3 (R Foundation for statistical Computing, Vienna, Austria). The p-values for the CRS change and CRS improvement in autologous group were calculated by Friedman test (version 8.0, GraphPad Software).
Linear regression or logistic fitting were used to study the associations among fine motor skills, clinical rating scale, TH+ cell numbers, binding potential in putamen and caudate by using Origin 2017 software. The Pearson’s r, significance (p value) and R2 (coefficient of determination) were generated by the software (two-tailed Pearson’s correlation analysis).
Extended Data
Extended Data Fig. 1. DA neuron generation and MPTP PD model.
a, Representative images of pluripotent stem cell marker expression in iPSCs generated from rhesus macaque fibroblasts. b,c, Representative images of mDA progenitor marker (b) and DA neuron marker (c) in differentiating cells from rhesus macaque iPSCs. Scale bar: 50μm. Data are representative of at least 5 independent experiments (a-c). d, Images of TH immunostaining in the substantia nigra from allogenic and autologous rhesus monkeys. e, Stereological quantification of TH+ neurons in the substantia nigra of allogenic and autologous rhesus monkeys. f, Percentage of TH+ cell reduction in the MPTP-treated substantia nigra compared to the unlesioned side. The data are presented as mean ± SD (n = 5 biologically independent monkeys in each group) in e, f.
Extended Data Fig. 2. Mood behavior in transplanted monkeys.
a, The anxious pacing (AP) behavior observed in monkeys receiving allogenic or autologous transplantation from 12 months before transplantation to 24 months after transplantation. The transplantation happened at month 0. Lines show mean values for every 6 months from the allogenic group or the autologous group. b, The lack of motivation (LOM) behavior observed in monkeys receiving allogenic or autologous transplantation from 12 months before transplantation to 24 months after transplantation. c, The self-injury behavior (SIB) observed in monkeys receiving allogenic or autologous transplantation from 12 months before transplantation to 24 months after transplantation.
Extended Data Fig. 3. Graft evaluation in vivo.
a,b, Quantification of [11C]DTBZ graft binding potential in contralateral (untreated) putamen (a) and caudate (b) from allogenic and autologous monkeys before and after transplantation. The data is presented as mean ± SD (n=4 per group). c,d, Quantification of the volume of uptake in contralateral (untreated) putamen (c) and contralateral caudate (d) from allogenic and autologous monkeys before and after transplantation. The data is presented as mean ± SD (n=4 per group).
Extended Data Fig. 4. Overview of the graft.
a, Representative images of GFP immunostaining and Nissl staining in brain sections of allogenic and autologous animals. The red arrows point to the grafts. b, H&E staining in brain sections of allogenic and autologous animal. Enlarged images correspond to the yellow area in the respective grafts. All grafts (if present) in monkeys from both groups were examined. Data are representative of at least 3 sections having grafts from each monkey.
Extended Data Fig. 5. Histological analysis of graft.
a, Representative images of TH immunostaining in brain sections of allogenic and autologous animals. Enlarged images correspond to the grafts. b, Representative images of TH+ fiber extension area in control and MPTP brain hemisphere. c, TH immunostaining in the putamen from MPTP lesion side and unlesioned side. Scale bar: 10 μm. All grafts (if present) in monkeys from both groups were examined. Data are representative of at least 3 sections having grafts from each monkey (a-c).
Extended Data Fig. 6. Caudate graft in autologous monkeys.
Representative image of TH immunostaining in autologous monkey caudate region. The inset area is enlarged below. All grafts (if present) in monkeys from both groups were examined. Data are representative of at least 3 sections having grafts from each monkey.
Extended Data Fig. 7. Cellular composition in grafts.
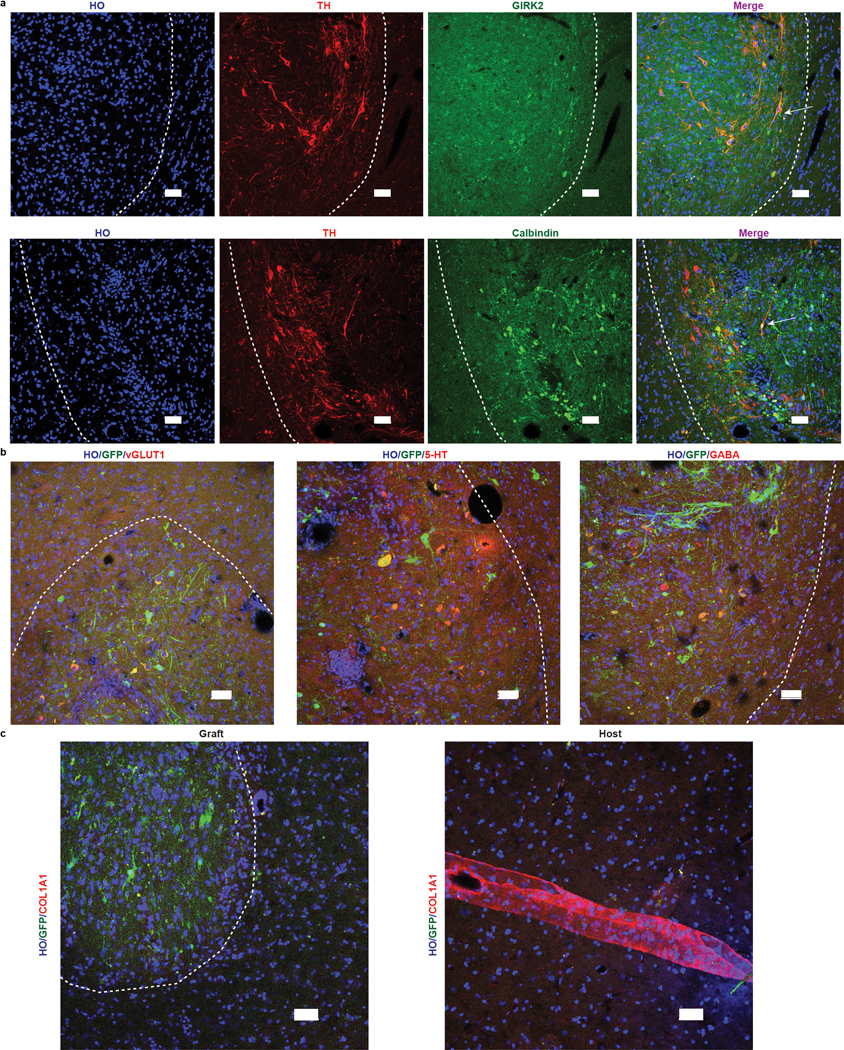
a, Representative images of TH and GIRK2 or Calbindin immunostaining in grafts. Scale bars: 50 μm. b, Representative images of vGLUT1, 5-HT and GABA immunostaining in grafts. Scale bars: 50 μm. c, Representative images of COL1A1 immunostaining in and outside of grafts. scale bars: 50 μm. The white dash lines mark the edge of the graft. All grafts (if present) in monkeys from both groups were examined. Data are representative of at least 3 sections having grafts from each monkey (a-c).
Extended Data Fig. 8. Immune response evaluation in grafts.
a, Histological analysis of T cells (CD3 and CD45), microglia (CD68) and astrocyte (GFAP) marker in grafts from allogenic and autologous animals. Scale bar: 100 μm. b, Representative images of GFP and GFAP immunostaining in allogenic and autologous monkeys. Scale bar: 50 μm. The white dash lines mark the edge of the graft. All grafts (if present) in monkeys from both groups were examined. Data are representative of at least 3 sections having grafts from each monkey (a-b).
Extended Data Fig. 9. Regression analysis on the relation between DA neuron numbers and behavioral recovery/PET.
a, Linear regression analysis between ipsilateral caudate [11C]DTBZ binding potential and FMS. b, Linear regression analysis between ipsilateral caudate [11C]DTBZ binding potential and CRS. c, Linear regression analysis between ipsilateral caudate [11C]DTBZ binding potential and CRS recovery rate. d, Linear regression analysis between ipsilateral caudate [11C]DTBZ binding potential and surviving TH+ neuron numbers. e, Linear regression analysis between ipsilateral caudate [11C]DTBZ binding potential and caudate surviving TH+ neuron numbers. f, Linear regression and logistic fitting analysis of FMS and total surviving TH+ neuron numbers in grafts. The Pearson’s r, significance (p value) and R2 (coefficient of determination) were assessed by two-tailed Pearson’s correlation analysis in a-f.
Extended Data Table 1.
Rhesus macaques’ body weight (kg) overtime
| Animal ID | Before MPTP | At Time of Cell Transplant | 6 months Post Cell Transplant | 12 months Post Cell Transplant | 18 months Post Cell Transplant | Necropsy |
|---|---|---|---|---|---|---|
| Auto-1 | 15.05 | 18.1 | 18.5 | 17.2 | 17.9 | 18.2 |
| Auto-2 | 9 | 10.77 | 11.92 | 12.25 | 12.8 | 12.9 |
| Auto-3 | 8.63 | 9.1 | 10.29 | 8.79 | 9.1 | 10.02 |
| Auto-4 | 8.24 | 12.4 | 12.25 | 12.06 | 12.57 | 14.175 |
| Auto-5 | 9.15 | 9.84 | - | - | - | 9.05 |
| Allo-1 | 12.87 | 11.1 | 10.4 | 11.67 | - | 12.54 |
| Allo-2 | 11.23 | 12.35 | 13.36 | 14.42 | - | 14.46 |
| Allo-3 | 9 | 9.53 | 11.33 | 10.85 | - | 13.02 |
| Allo-4 | 12.57 | 12.68 | 12.8 | 14.5 | - | 14.94 |
| Allo-5 | 12.24 | 11.01 | 12.39 | - | - | 12.94 |
Acknowledgements
This research was supported by grants NIH-NINDS (NS076352, NS096282, NS086604), the NICHD (U54 HD090256), P51OD011106, the National Medical Research Council of Singapore (MOH-000212, MOH-000207), Dr. Ralph & Marian Falk Medical Research Trust, the University of Wisconsin-Madison Office of Vice Chancellor for Research and Graduate Education, the Cellular and Molecular Pathology Graduate Program, the Neuroscience Training Program and the Departments of Radiology and Medical Physics at the University of Wisconsin-Madison. This project was possible due to the dedication and support of WNPRC veterinarians and animal care technicians, especially Carissa Boettcher, Kerry Fuchs and Dane Schalk. We are grateful to Patricia Perez Toro, Samuel Brady, Kathleen MacManus, Asia Payne and Lana Fox for facilitating behavioral testing procedures during their undergraduate studies.
Footnotes
Competing interests
Su-Chun Zhang is a co-founder of BrainXell, Inc.
Data availability
All requests for raw and analyzed data and materials will be promptly reviewed by the corresponding author and the University of Wisconsin-Madison to verify whether the request is subject to any intellectual property or confidentiality obligations. Any data and materials that can be shared will be released via a Material Transfer Agreement.
References
- 1.Bjorklund A & Lindvall O. Replacing Dopamine Neurons in Parkinson’s Disease: How did it happen? J Parkinsons Dis 7, S21–S31, doi: 10.3233/JPD-179002 (2017). [DOI] [PMC free article] [PubMed] [Google Scholar]
- 2.Barker RA, Barrett J, Mason SL & Bjorklund A. Fetal dopaminergic transplantation trials and the future of neural grafting in Parkinson’s disease. Lancet Neurol 12, 84–91, doi: 10.1016/S1474-4422(12)70295-8 (2013). [DOI] [PubMed] [Google Scholar]
- 3.Kriks S et al. Dopamine neurons derived from human ES cells efficiently engraft in animal models of Parkinson’s disease. Nature 480, 547–551, doi: 10.1038/nature10648 (2011). [DOI] [PMC free article] [PubMed] [Google Scholar]
- 4.Kikuchi T et al. Human iPS cell-derived dopaminergic neurons function in a primate Parkinson’s disease model. Nature 548, 592–596, doi: 10.1038/nature23664 (2017). [DOI] [PubMed] [Google Scholar]
- 5.Barker RA, Parmar M, Studer L & Takahashi J. Human Trials of Stem Cell-Derived Dopamine Neurons for Parkinson’s Disease: Dawn of a New Era. Cell Stem Cell 21, 569–573, doi: 10.1016/j.stem.2017.09.014 (2017). [DOI] [PubMed] [Google Scholar]
- 6.Emborg ME et al. Induced pluripotent stem cell-derived neural cells survive and mature in the nonhuman primate brain. Cell Rep 3, 646–650, doi: 10.1016/j.celrep.2013.02.016 (2013). [DOI] [PMC free article] [PubMed] [Google Scholar]
- 7.Hallett PJ et al. Successful function of autologous iPSC-derived dopamine neurons following transplantation in a non-human primate model of Parkinson’s disease. Cell Stem Cell 16, 269–274, doi: 10.1016/j.stem.2015.01.018 (2015). [DOI] [PMC free article] [PubMed] [Google Scholar]
- 8.Schweitzer JS et al. Personalized iPSC-Derived Dopamine Progenitor Cells for Parkinson’s Disease. N Engl J Med 382, 1926–1932, doi: 10.1056/NEJMoa1915872 (2020). [DOI] [PMC free article] [PubMed] [Google Scholar]
- 9.Fusaki N, Ban H, Nishiyama A, Saeki K & Hasegawa M. Efficient induction of transgene-free human pluripotent stem cells using a vector based on Sendai virus, an RNA virus that does not integrate into the host genome. Proc Jpn Acad Ser B Phys Biol Sci 85, 348–362, doi: 10.2183/pjab.85.348 (2009). [DOI] [PMC free article] [PubMed] [Google Scholar]
- 10.Xi J et al. Specification of midbrain dopamine neurons from primate pluripotent stem cells. Stem Cells 30, 1655–1663, doi: 10.1002/stem.1152 (2012). [DOI] [PMC free article] [PubMed] [Google Scholar]
- 11.Reeve A, Simcox E & Turnbull D. Ageing and Parkinson’s disease: why is advancing age the biggest risk factor? Ageing Res Rev 14, 19–30, doi: 10.1016/j.arr.2014.01.004 (2014). [DOI] [PMC free article] [PubMed] [Google Scholar]
- 12.Freed CR et al. Transplantation of embryonic dopamine neurons for severe Parkinson’s disease. N Engl J Med 344, 710–719, doi: 10.1056/NEJM200103083441002 (2001). [DOI] [PubMed] [Google Scholar]
- 13.Takagi Y et al. Dopaminergic neurons generated from monkey embryonic stem cells function in a Parkinson primate model. J Clin Invest 115, 102–109, doi: 10.1172/JCI21137 (2005). [DOI] [PMC free article] [PubMed] [Google Scholar]
- 14.Daadi MM, Grueter BA, Malenka RC, Redmond DE Jr. & Steinberg GK Dopaminergic neurons from midbrain-specified human embryonic stem cell-derived neural stem cells engrafted in a monkey model of Parkinson’s disease. PLoS One 7, e41120, doi: 10.1371/journal.pone.0041120 (2012). [DOI] [PMC free article] [PubMed] [Google Scholar]
- 15.Wakeman DR et al. Survival and integration of neurons derived from human embryonic stem cells in MPTP-lesioned primates. Cell Transplant 23, 981–994, doi: 10.3727/096368913X664865 (2014). [DOI] [PubMed] [Google Scholar]
- 16.Gonzalez C, Bonilla S, Flores AI, Cano E & Liste I. An Update on Human Stem Cell-Based Therapy in Parkinson’s Disease. Curr Stem Cell Res Ther 11, 561–568, doi: (2016). [DOI] [PubMed] [Google Scholar]
- 17.Kikuchi T et al. Survival of human induced pluripotent stem cell-derived midbrain dopaminergic neurons in the brain of a primate model of Parkinson’s disease. J Parkinsons Dis 1, 395–412, doi: 10.3233/JPD-2011-11070 (2011). [DOI] [PubMed] [Google Scholar]
- 18.Wang YK et al. Human Clinical-Grade Parthenogenetic ESC-Derived Dopaminergic Neurons Recover Locomotive Defects of Nonhuman Primate Models of Parkinson’s Disease. Stem Cell Reports 11, 171–182, doi: 10.1016/j.stemcr.2018.05.010 (2018). [DOI] [PMC free article] [PubMed] [Google Scholar]
- 19.Wang S et al. Autologous iPSC-derived dopamine neuron transplantation in a nonhuman primate Parkinson’s disease model. Cell Discov 1, 15012, doi: 10.1038/celldisc.2015.12 (2015). [DOI] [PMC free article] [PubMed] [Google Scholar]
- 20.Emborg-Knott ME & Domino EF MPTP-Induced hemiparkinsonism in nonhuman primates 6–8 years after a single unilateral intracarotid dose. Exp Neurol 152, 214–220, doi: 10.1006/exnr.1998.6845 (1998). [DOI] [PubMed] [Google Scholar]
- 21.Gash DM et al. An automated movement assessment panel for upper limb motor functions in rhesus monkeys and humans. J Neurosci Methods 89, 111–117, doi: 10.1016/s0165-0270(99)00051-5 (1999). [DOI] [PubMed] [Google Scholar]
- 22.Vermilyea SC et al. Real-Time Intraoperative MRI Intracerebral Delivery of Induced Pluripotent Stem Cell-Derived Neurons. Cell Transplant 26, 613–624, doi: 10.3727/096368916X692979 (2017). [DOI] [PMC free article] [PubMed] [Google Scholar]
- 23.Zhu L, Ploessl K & Kung HF PET/SPECT imaging agents for neurodegenerative diseases. Chem Soc Rev 43, 6683–6691, doi: 10.1039/c3cs60430f (2014). [DOI] [PMC free article] [PubMed] [Google Scholar]
- 24.Ahlskog JE, Maraganore DM, Uitti RJ & Uhl GR Brain imaging to assess the effects of dopamine agonists on progression of Parkinson disease. JAMA 288, 311; author reply 312–313 (2002). [PubMed] [Google Scholar]
- 25.Hsiao IT et al. Correlation of Parkinson disease severity and 18F-DTBZ positron emission tomography. JAMA Neurol 71, 758–766, doi: 10.1001/jamaneurol.2014.290 (2014). [DOI] [PubMed] [Google Scholar]
- 26.Tiklova K et al. Single cell transcriptomics identifies stem cell-derived graft composition in a model of Parkinson’s disease. Nat Commun 11, 2434, doi: 10.1038/s41467-020-16225-5 (2020). [DOI] [PMC free article] [PubMed] [Google Scholar]
- 27.Morizane A et al. MHC matching improves engraftment of iPSC-derived neurons in non-human primates. Nat Commun 8, 385, doi: 10.1038/s41467-017-00926-5 (2017). [DOI] [PMC free article] [PubMed] [Google Scholar]
- 28.Mendez I et al. Cell type analysis of functional fetal dopamine cell suspension transplants in the striatum and substantia nigra of patients with Parkinson’s disease. Brain 128, 1498–1510, doi: 10.1093/brain/awh510 (2005). [DOI] [PMC free article] [PubMed] [Google Scholar]
- 29.Li JY et al. Lewy bodies in grafted neurons in subjects with Parkinson’s disease suggest host-to-graft disease propagation. Nat Med 14, 501–503, doi: 10.1038/nm1746 (2008). [DOI] [PubMed] [Google Scholar]
- 30.Hallett PJ et al. Long-term health of dopaminergic neuron transplants in Parkinson’s disease patients. Cell Rep 7, 1755–1761, doi: 10.1016/j.celrep.2014.05.027 (2014). [DOI] [PMC free article] [PubMed] [Google Scholar]
- 31.Yin D et al. Striatal volume differences between non-human and human primates. J Neurosci Methods 176, 200–205, doi: 10.1016/j.jneumeth.2008.08.027 (2009). [DOI] [PMC free article] [PubMed] [Google Scholar]
- 32.Kordower JH et al. Functional fetal nigral grafts in a patient with Parkinson’s disease: chemoanatomic, ultrastructural, and metabolic studies. J Comp Neurol 370, 203–230, doi: (1996). [DOI] [PubMed] [Google Scholar]
- 33.Li W et al. Extensive graft-derived dopaminergic innervation is maintained 24 years after transplantation in the degenerating parkinsonian brain. Proc Natl Acad Sci U S A 113, 6544–6549, doi: 10.1073/pnas.1605245113 (2016). [DOI] [PMC free article] [PubMed] [Google Scholar]
- 34.Wu J et al. An alternative pluripotent state confers interspecies chimaeric competency. Nature 521, 316–321, doi: 10.1038/nature14413 (2015). [DOI] [PMC free article] [PubMed] [Google Scholar]
- 35.Jewett DM, Kilbourn MR & Lee LC A simple synthesis of [11C]dihydrotetrabenazine (DTBZ). Nucl Med Biol 24, 197–199, doi: 10.1016/s0969-8051(96)00213-2 (1997). [DOI] [PubMed] [Google Scholar]
- 36.Innis RB et al. Consensus nomenclature for in vivo imaging of reversibly binding radioligands. J Cereb Blood Flow Metab 27, 1533–1539, doi: 10.1038/sj.jcbfm.9600493 (2007). [DOI] [PubMed] [Google Scholar]
- 37.Lammertsma AA & Hume SP Simplified reference tissue model for PET receptor studies. Neuroimage 4, 153–158, doi: 10.1006/nimg.1996.0066 (1996). [DOI] [PubMed] [Google Scholar]
- 38.Ichise M et al. Linearized reference tissue parametric imaging methods: application to [11C]DASB positron emission tomography studies of the serotonin transporter in human brain. J Cereb Blood Flow Metab 23, 1096–1112, doi: 10.1097/01.WCB.0000085441.37552.CA (2003). [DOI] [PubMed] [Google Scholar]
- 39.Tao Y et al. PAX6D instructs neural retinal specification from human embryonic stem cell-derived neuroectoderm. EMBO Rep, e50000, doi: 10.15252/embr.202050000 (2020). [DOI] [PMC free article] [PubMed] [Google Scholar]
- 40.Ohshima-Hosoyama S et al. A monoclonal antibody-GDNF fusion protein is not neuroprotective and is associated with proliferative pancreatic lesions in parkinsonian monkeys. PLoS One 7, e39036, doi: 10.1371/journal.pone.0039036 (2012). [DOI] [PMC free article] [PubMed] [Google Scholar]


