

Abstract
Purpose
The general utility of diffusion kurtosis imaging (DKI) is challenged by its poor robustness to imaging artifacts and thermal noise that often lead to implausible kurtosis values.
Theory and Methods
A robust scalar kurtosis index can be estimated from powder‐averaged diffusion‐weighted data. We introduce a novel DKI estimator that uses this scalar kurtosis index as a proxy for the mean kurtosis to regularize the fit.
Results
The regularized DKI estimator improves the robustness and reproducibility of the kurtosis metrics and results in parameter maps with enhanced quality and contrast.
Conclusion
Our novel DKI estimator promotes the wider use of DKI in clinical research and potentially diagnostics by improving the reproducibility and precision of DKI fitting and, as such, enabling enhanced visual, quantitative, and statistical analyses of DKI parameters.
Keywords: diffusion MRI, DKI, kurtosis, parameter estimation, robustness
1. INTRODUCTION
Despite a growing interest in biophysical models of diffusion in white matter to develop specific biomarkers of microstructural changes, 1 signal representations, for example, diffusion tensor imaging (DTI) 2 or diffusion kurtosis imaging (DKI), 3 retain the potential to become invaluable tools in diagnostic and clinical research settings. Such signal representations provide metrics that are highly sensitive to microstructural changes associated with development, 4 , 5 aging 6 , 7 , disease and disorder without adopting (often contested 1 , 8 , 9 , 10 ) model assumptions. An extensive literature has demonstrated the sensitivity of DKI parameters to white and gray matter alterations in, for example, aging, 7 , 11 , 12 , stroke, 13 , 14 , 15 , 16 , 17 traumatic brain injury, 18 , 19 , 20 multiple sclerosis, 21 schizophrenia, 22 , 23 autism spectrum disorder, 24 , 25 epilepsy, 26 , 27 migraine, 28 Parkinson’s Disease, 29 and Alzheimer’s disease. 30 , 31 Despite a focus on neuroapplications, DKI also has emerging applications in body MRI. 32 , 33 However, sensitivity is not enough; diagnostics and clinical research may only adopt biomarkers that are also accurate, precise, and robust. 34
Technically, DKI forms a straightforward extension of DTI and provides, aside from the diffusion tensor, an estimate of the diffusion kurtosis tensor which quantifies the degree of directional non‐Gaussian diffusion. 3 , 35 , 36 DKI parameters, for example, the mean kurtosis (), radial kurtosis (), and axial kurtosis (), 35 , 36 , 37 have been shown to yield clinically relevant information that is not captured by a more conventional DTI representation. Moreover, DTI parameters (eg, mean diffusivity, radial diffusivity, axial diffusivity and fractional anisotropy 38 ) are themselves estimated more accurately when evaluated within the DKI framework (ie, estimating the diffusion tensor and kurtosis tensor simultaneously). 39 Compared to DTI, DKI requires a slightly more extensive scan protocol in the sense that there must be at least 3 distinct b‐values (typically one of these is set to ), which differ only in their gradient magnitude. 3 , 40 Given the widespread availability of accelerated image acquisition techniques such as simultaneous multiband imaging, 41 , 42 data compatible with whole‐brain DKI‐analysis can be acquired in a few of minutes, thereby facilitating clinical utility. Moreover, many recent large cohort studies, for example, the Human Connectome Project, 43 , 44 UK Biobank, 45 Adolescent Brain Cognitive Developement, 46 and the Cambridge Centre for Ageing Neuroscience (CamCAN), 47 , 48 provide now large‐scale multishell data that are well‐suited to DKI analyses.
Unfortunately, DKI has been challenged ever since its introduction by a poor robustness to imaging artifacts and thermal noise that often leads to non‐physical kurtosis values during the fitting, especially in voxels with very low radial diffusivity. 37 , 49 , 50 , 51 Indeed, implausible negative values are ubiquitous in many kurtosis maps, hampering visual, quantitative, and statistical analysis of the data. Advances in artifact correction, noise removal, and constrained parameter estimation have reduced, but not eliminated the problem. 37 , 49 , 52 , 53 , 54 , 55 Alternatively to the full tensor estimations, a scalar kurtosis quantity can be obtained from diffusion‐weighted signals averaged across different isotropically distributed gradient directions (and for each individual b‐value): that is, the powder kurtosis , 10 , 12 , 56 distinct from mean kurtosis. Due to the higher signal‐to‐noise ratio (SNR) of the powder signals and decreased number of estimated model parameters, can be computed with higher precision than other kurtosis tensor derived metrics. We will demonstrate in this work that can be used to provide a robust prediction of the mean kurtosis without the need to estimate the kurtosis tensor. However, the powder‐averaged signal does not allow for the estimation of directional kurtosis values, which have been shown to provide unique information in well‐aligned structures. 57 , 58 , 59 Moreover, a robust estimation of the full kurtosis tensor is required for biophysical modeling 60 , 61 , 62 and tractography. 63 , 64 , 65
Here we propose and evaluate a novel technique for more robust and precise estimation of the full kurtosis tensor and derived metrics. We introduce a regularized DKI estimator in which the estimated mean kurtosis is evaluated against a robust prediction of the mean kurtosis, which in turn is derived from the powder kurtosis. We will describe the technical details and demonstrate how they improve the reproducibility, robustness and precision of DKI parameters.
2. METHODS
2.1. Diffusion kurtosis imaging
DKI provides a representation of the diffusion‐weighted signal S in terms of the second and fourth cumulant as a function of the diffusion‐weighting strength, 3 or b‐value, b. In 1D or in the case of isotropic diffusion,
| (1) |
with and the apparent diffusion and apparent kurtosis coefficients, respectively. Since proton diffusion in biological tissue, e.g. brain white matter, is typically anisotropic, 3D diffusion and kurtosis tensors are needed to describe the orientational dependence of the diffusion‐weighted signal adequately 40 , 65 :
| (2) |
Here, is the unit vector along which the diffusion‐weighting gradient is applied, and represents the element of the fully symmetric second‐order diffusion tensor D for which a third of the trace equals the mean diffusivity . In addition, denotes the element of the fully symmetric fourth order diffusion kurtosis tensor W. Because both tensors are fully symmetric, D and W have and degrees of freedom, respectively.
From D and W, various diffusion and kurtosis parameters can be derived. 35 , 37 , 38 , 66 , 67 Fractional anisotropy (FA), mean diffusivity (), radial diffusivity (), axial diffusivity (), mean kurtosis (), radial kurtosis (), and axial kurtosis () are amongst the most widely adopted DKI parameters. 35 , 36 , 62 , 65 Without loss of generality we here limit ourselves to the original definition of mean kurtosis , computed by evaluating the apparent kurtosis from the along a large number of directions followed by averaging.
2.2. Powder kurtosis
Analogous to Equation (1), the decay of the powder‐averaged signals as a function of b can be approximated using the cumulant expansion 10 , 12 :
| (3) |
where and are the scalar diffusivity and excess‐kurtosis of powder signals, respectively. Since powder‐averaged signals are independent of the orientation distribution of microscopic components, 56 , 68 , 69 , 70 the scalar quantity extracted from these signals are decoupled from mesoscopic properties such as tissue dispersion or fiber architecture configurations.
2.3. Robust prediction of mean kurtosis
In this section, we will present 3 strategies to predict the mean kurtosis without relying on the full tensor. First, from the powder kurtosis, can be computed analytically 10 from the signal in the limit :
| (4) |
with
| (5) |
The correction term mainly depends on the anisotropy captured by the elements of the diffusion tensor . Importantly, the derivation of this expression relies on the mean kurtosis tensor definition proposed by Hansen et al, 36 , 67 which was shown to present nearly identical contrast to the original mean kurtosis definition . 36
Second, for an isotropic diffusion tensor D, the correction term is zero and yields an accurate prediction of the mean kurtosis:
| (6) |
Third, for finite b‐values, a mean kurtosis prediction can be obtained from and the diffusion tensor D using a polynomial regression model in which the thousands of non‐problematic voxels, that is, positive apparent kurtosis in each direction, serve as training data. Note that due to the strong dependence of DKI parameters on scan settings, b‐values, 71 and subject‐specific alteration of the underlying tissue microstructure, the training voxels must be sampled from the same subject or from datasets with the same acquisition parameters. In this strategy, coined voxel quality transfer, the polynomial coefficients are estimated using multivariate polynomial regression in which the parameters , , and are included up to the order. Hence,
| (7) |
with a multivariate polynomial function of order N. In this work .
To summarize, the predicted mean kurtosis can be estimated robustly from the diffusion tensor D and the powder kurtosis using 3 strategies: (a) powder kurtosis with analytical correction, (b) without analytical correction, or (c) voxel quality transfer using polynomial regression. Where deemed relevant, the strategy will be specified using the superscript index. If not specified, as motivated by our results (see below).
2.4. Regularized kurtosis fitting
After establishing a robust prediction of the mean kurtosis (using 1 of the 3 strategies described above), we will use this metric to regularize the DKI fitting. Here we propose the following regularized nonlinear least squares (NLS) estimator:
| (8) |
with the regularization weight and h the operator that computes the mean kurtosis from the tensor coefficients . 36 , 67 Note that is an alternative formulation of the DKI model in Equation (2) in which B represent the extended b‐matrix. 72 For , the estimator reduces to the ordinary NLS estimator, a widely adopted estimator for DTI and DKI. 37 , 49 , 73
We hypothesize that the prediction of the mean kurtosis from the powder‐averaged data is a much more robust and reproducible metric than estimated from the fitted kurtosis tensor and, as such, the norm of the difference between and regularizes and stabilizes the DKI fit.
The nonlinear fitting is initiated by a starting point obtained by fitting the DKI model using the ordinary NLS estimator. In the few cases where the estimator does not converge to a plausible solution, the estimation is repeated with a starting point that is the result of a constrained DKI fitting in which positivity of is imposed.
2.5. Alternative fitting strategies
We compare performance of the regularized NLS estimator to commonly used fitting strategies: (a) ordinary NLS, (b) ordinary NLS after smoothing the data with a 2D isotropic Gaussian filter with a kernel and full‐width‐half‐maximum of 1.25 times the voxel size, and (c) constrained NLS. The constrained NLS estimator solves the same objective function as the ordinary NLS estimator, but imposes one or more constraints on the estimated parameters. 37 Here, we only adopted the constraint that the apparent kurtosis coefficient must be positive in each gradient direction .
2.6. Data
2.6.1. Simulated data
Monte Carlo simulations with 2500 trials were performed to evaluate the performance of the regularized DKI estimator. For each trial, diffusion‐weighted signals were generated by evaluating the DKI signal for the diffusion encoding scheme of our study‐specific data (vide infra). The ground truth diffusion tensor and diffusion kurtosis tensor coefficients were randomly sampled from the plausible DKI estimates of the HCP data. Gaussian noise was added to the simulated data with a corresponding SNR of 30 for the non‐diffusion‐weighted signal. We opted for Gaussian noise instead of complex Gaussian noise to avoid the Rician noise bias as a confound in our interpretation. 74 The effect of Rician bias on the estimation of DKI parameters has previously been studied and documented in detail. 49 , 72 , 75
2.6.2. Study‐specific MRI data
Data were collected under the approval of the Cardiff University School of Psychology Ethics Committee. Five healthy volunteers were recruited and data were collected on 2 different scanning sessions with exactly the same imaging protocol on a Siemens Connectom 3T MR scanner using a 32‐channel receiver coil. For each volunteer, the 2 test‐retest scanning sessions were performed on the same day interleaved by a short break. In both sessions, subjects were re‐positioned by the same operator. The repeated images were analyzed individually, without data averaging.
The diffusion gradients were characterized by and maximal gradient amplitude of ; note that in this work the full power of the Connectom gradient system was not exploited to ensure translation of the findings to clinical scanners (where gradient amplitudes of 80 mT/m are prevalent). Diffusion weighting was applied along 30 isotropically‐distributed gradient directions 76 for 0.5, 1, and 2.5 , with , matrix: , and 54 slices with a spatial resolution of . Data acquisition was accelerated using simultaneous multiband (SMS = 2) and GRAPPA (R = 2), but partial Fourier encoding was turned off. In addition, 4 non‐diffusion‐weighted images were acquired with the same and reversed phase encoding to enable susceptibility‐induced geometrical correction. The total acquisition time was 6 m 15 seconds per session.
2.6.3. Additional MRI data
Additional experiments are based on arbitrarily selected data sets from various public neuroimaging repositories (eg, Openneuro) that include multi‐shell diffusion‐weighted MRI data. We selected data from a wide variety of (clinical) research projects: MGH Adult Diffusion Data from the Human Connectome Project (HCP, 43 , 44 , 77 ), the MASiVar project, 78 the Mexican substance use disorder database neuroimaging dataset (SUDMEX), 79 , 80 , 81 and Cambridge Centre for Ageing Neuroscience (CamCAN) dataset inventory. 47 , 48 Although all datasets meet the minimal requirements for DKI analysis, various scan and subject parameters vary widely. A comprehensive summary of the protocols and subjects is presented in Table 1—full protocol details can be found on each project’s resource pages.
TABLE 1.
Overview of the scan parameters
| HCP | MASiVar | SUDMEX | CamCAN | Study‐specific data | ||||||
|---|---|---|---|---|---|---|---|---|---|---|
| Scan protocol | ||||||||||
|
|
57 | 79 | 127 | 104 | 66 | |||||
| b‐values | 0, 1, 3 | 0, 1, 2 | 0, 1, 3 | 0, 1, 2 | 0, 0.5, 1, 2.5 | |||||
| # directions | 5, 64, 64 | 16, 40, 56 | 8, 32, 96 | 3, 30, 30 | 5, 30, 30, 30 | |||||
| Voxel size |
|
|
|
|
|
|||||
| Subject information | ||||||||||
| Age (years) | 40‐44 | 23 | 43 | 66 | 26 | |||||
| Gender | F | M | M | M | F | |||||
| Preprocessing | ||||||||||
| HCP 77 | PreQual 87 | Designer 52 | Designer 52 | see Section 2.6.2 | ||||||
2.7. Image processing
The study‐specific data were corrected for Gibbs ringing, 82 eddy current and susceptibility‐induced geometrical distortions, 83 , and gradient nonlinearities 84 prior to DKI analyses. As a part of the eddy current correction, signal outlier detection to identify, for example, motion‐corrupted slices was performed. 85 Seven regions of interest (ROIs) were automatically segmented in the native spaces of the images to minimize data interpolation. The ROIs included major white matter tracts, that is, genu and splenium of the corpus callosum (GCC and SCC), corticospinal tract (CST), arcuate fasciculus (AF), inferior fronto‐occipital fasciculus (IFO), superior longitudinal fasciculus (SLF), and optic radiation (OR). The automated segmentation of all white matter bundles was performed using the TractSeg algorithm. 86
If (minimally) preprocessed data were available for the cohort data, then we used those data sets without applying additional processing steps for DKI analyses. Otherwise, the DESIGNER pipeline was applied to correct for thermal noise, Gibbs ringing, and eddy current distortions. 52 This information is also listed in Table 1.
2.8. Statistics
The test‐retest reliability of the estimated ROI‐averaged was evaluated for each fitting strategy using the test‐retest variability (TRV). Note that the test and retest data were not aligned to each other, since reproducibility was only evaluated for ROIs that were segmented in the native spaces of the images to minimize data interpolation. The TRV was computed across N subjects by averaging the ratio of the absolute difference and the average of the test‐retest estimates over the subjects. A scaling factor of was applied to derive the standard deviation from the mean absolute difference for Gaussian distributed variables.
3. RESULTS
3.1. Robust prediction of mean kurtosis
In Figure 1, we show the scatter plot of predicted mean kurtosis against the corresponding in simulations and experimental data, using the 3 prediction strategies. In the simulations, is the ground truth value, whereas for the experimental data is estimated using an ordinary NLS estimator. For the experimental data, we only include all 441,271 voxels of the 5 study‐specific retest data with positive . The similarity between and (or ) is high. The voxelwise percentage error is and (mean ± standard deviation) for the simulations and all experimental data, respectively. The correction using the analytical correction term () reduces the accuracy significantly, leading to an increase of the mean percentage errors with an order of magnitude; and for the simulations and all experimental data, respectively. The third strategy, that is, correction using polynomial dictionary learning (), provides more accurate predictions of mean kurtosis than the other two. The mean percentage error is only for the simulated data and for the experimental data. Of importance, the polynomial regression model was trained on all voxels of the 5 study‐specific test data with positive . The Pearson correlation coefficients between and , , and was 0.70, 0.95, and 0.95, respectively, for the simulated data, and 0.82, 0.99, and 0.99, respectively, for the experimental data.
FIGURE 1.
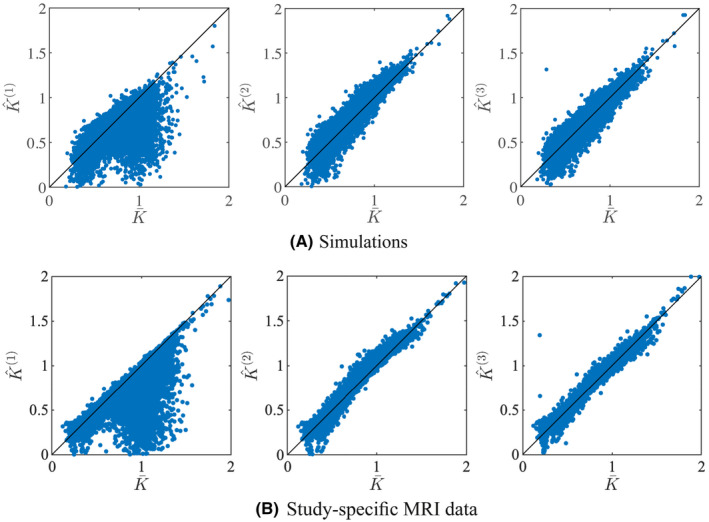
Simulations: a scatter plot shows the relationship between the actual mean and predicted mean kurtosis for the simulated and study‐specific data
In Figure 2, it is apparent that the predicted mean kurtosis is more robust than . Indeed, the prevalence of the ubiquitous “black voxels” in major white matter structures is reduced significantly, even almost nullified. The percentage of voxels in the whole brain with negative varies from 0.95 to 3.27%—with an average of 1.84%—in the ten study‐specific data sets. In contrast, for , this percentage dropped on average to 0.07%. Therefore, the quality of the maps is increased, allowing for a less confounded visual and statistical analysis. The robustness is similar for all 3 strategies to predict the mean kurtosis.
FIGURE 2.
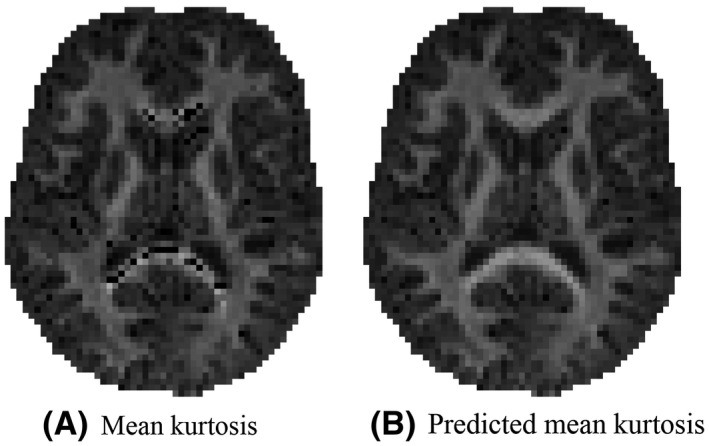
An representative map of the mean kurtosis and the predicted mean kurtosis ‐as estimated using the third strategy: voxel quality transfer using polynomial regression. The grayscale intensities are scaled between 0 and 2
Based upon the above results, we opt for the third strategy to compute the predicted mean kurtosis . Hence, for the remainder of this work, .
3.2. Accuracy of regularized tensor fitting
Figure 3 summarizes the simulation results by showing the ground truth reference of DKI parameters versus their estimates obtained using the ordinary (red) and regularized NLS (blue) estimator. The average percentage difference between the estimated and ground truth mean kurtosis is and for the ordinary and regularized NLS estimators. For the radial kurtosis, the average percentage difference decreases from to when regularizing the tensor fitting. For axial kurtosis, the percentage difference is minimally altered: and .
FIGURE 3.
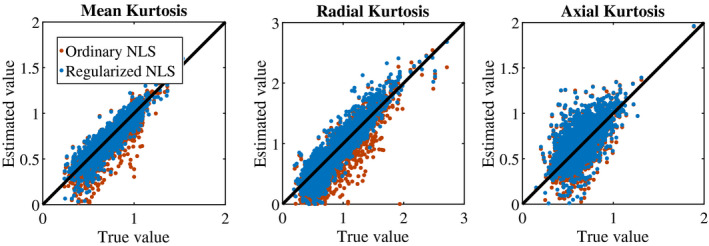
Simulations: Scatter plots show the relationship between the ground truth (“reference") and estimates of mean kurtosis (), radial kurtosis (), and axial kurtosis () when fitting the DKI model using the ordinary (red) and regularized (blue) nonlinear least squares estimator
For the study‐specific data, the ground truth kurtosis values are missing. However, for the majority of the gray and white matter voxels, the ordinary NLS estimator yields plausible and non‐problematic estimates with positive kurtosis values. In Figure 4A, we show the correspondence between estimated kurtosis parameters using the ordinary and regularized NLS estimator for those voxels. The average percentage difference between the ordinary and regularized NLS estimators for , , and is , , and , respectively. The Pearson correlation coefficients between the ordinary and regularized NLS are 0.995 0.993, and 0.995 for , , and , respectively. The effect of the regularized NLS estimator on the shape of the kurtosis tensor from voxels near the mid‐sagittal plane of the genus of the corpus callosum is highlighted in Figure 4B. The regularized NLS estimator shows to resolve the higher kurtosis values perpendicularly to the diffusion tensor main direction for both non‐problematic and problematic voxels.
FIGURE 4.
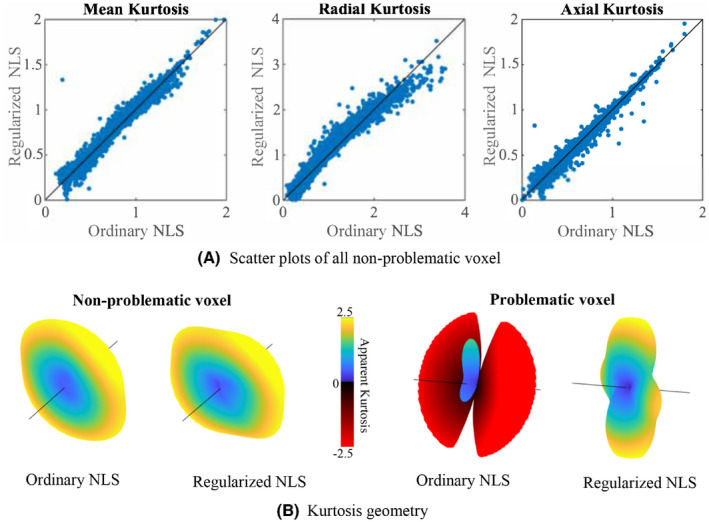
Study‐specific MRI data: A, Scatter plots show the relationship between the ordinary and regularized NLS estimates of mean kurtosis (), radial kurtosis (), and axial kurtosis () for all non‐problematic voxels in the study‐specific MRI data. Note that a “problematic voxel” has at least one negative when fitted with the ordinary NLS. B, The 3D kurtosis geometry, ie, apparent kurtosis coefficient evaluated along different directions, as estimated with the ordinary and regularized NLS for a non‐problematic and problematic voxel. These 3D kurtosis geometry were extracted from a voxels near the mid‐sagittal plane of the genus of the corpus callosum (direction marked by the black line corresponds to the principal direction of the diffusion tensor and are truncated
3.3. Reproducibility
Figure 5 shows the mean within each ROI as computed in 5 subjects using various fitting strategies for the test and retest data. In addition, we include the median within each ROI for the ordinary NLS estimator.
FIGURE 5.

The tract‐averaged using various fitting strategies and (bottom row) for the test (filled marker) and retest data (open marker) each subject (labeled by marker shape). The graphs on the right column show the same data, but windowed differently for enhanced contrast. Seven major white matter tracts were evaluated: genu and splenium of the corpus callosum (GCC and SCC), corticospinal tract (CST), arcuate fasciculus (AF), inferior fronto‐occipital fasciculus (IFO), superior longitudinal fasciculus (SLF), and optic radiation (OR)
In various tracts, that is, the SCC, GCC, and CST, the test‐retest reproducibility is poor when using ordinary NLS estimators, with and without spatial smoothing, because in at least one of the scans the negative kurtosis outliers dominate the ROI‐averaged . The median operator is robust to such outliers and can be used as a reference target for reproducibility analysis.
The test‐retest reproducibility is greatly improved by the use of the regularized fitting algorithm. The TRV of the ROI‐averaged metrics, computed over the 5 subjects, is tabulated per ROI in Table 2.
TABLE 2.
The test‐retest variability in the estimation of for various tracts and fitting strategies
| GCC | SCC | CST | AF | IFO | SLF | OR | ||
|---|---|---|---|---|---|---|---|---|
| Ordinary NLS | ‐ | ‐ | ‐ | 1.66 | 2.21 | 1.62 | 2.38 | |
| Median | 4.20 | 2.19 | 2.17 | 1.93 | 2.60 | 1.68 | 2.03 | |
| Constrained NLS | 5.30 | 2.89 | 2.16 | 1.75 | 1.75 | 1.59 | 1.99 | |
| Smoothing + ordindary NLS | ‐ | ‐ | ‐ | 1.65 | 7.51 | 1.63 | 2.37 | |
| Regularized NLS | 4.76 | 2.08 | 2.27 | 1.65 | 2.10 | 1.49 | 1.77 | |
|
|
4.73 | 2.08 | 2.28 | 1.65 | 2.10 | 1.49 | 1.76 |
Notes: If the test‐retest variability is dominated by outliers, that is, , the value is not listed. To illustrate the reproducibility of the predicted mean kurtosis , we also show those results (bottom row).
The percentage of negative estimates per tract strongly impacts the TRV. The regularized NLS estimator decimated, if not nullified, this number in comparison to the ordinary NLS estimator, with and without smoothing. Importantly, 80‐90% of the voxels with negative using the ordinary NLS estimator converged to plausible, positive, values with regularized NLS estimator if the optimization was initiated with the outcome of the ordinary NLS estimator. For the remaining 10‐20%, the regularized fit needed to be repeated with a starting point that was obtained from the constrained NLS estimator.
3.4. General applicability
In Figures 6 and 7, we show the maps of , and for a single, but representative slice of various data sets. The data quality varied highly from 1 dataset to another due to variations in SNR and number of diffusion‐weighted images. However, in each dataset, traditional kurtosis estimation suffered from low robustness and many negative in structures such as the CC. Overall, the quality of the maps improved drastically for all datasets, with a few remaining black voxels (negative kurtosis values), mostly around some GM/WM boundaries, where the kurtosis and their reference values are not well understood yet. 54 In Figure 6, we also show, for comparison, the map of the predicted mean kurtosis .
FIGURE 6.
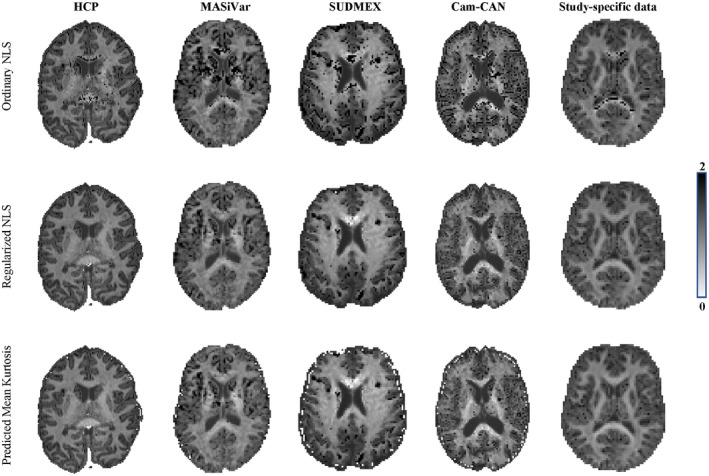
The maps for the various dataset are shown for the ordinary and regularized NLS in the top and middle row, respectively. Moreover, we show the map of the predicted mean kurtosis (bottom row) to illustrate the similarity in contrast
FIGURE 7.
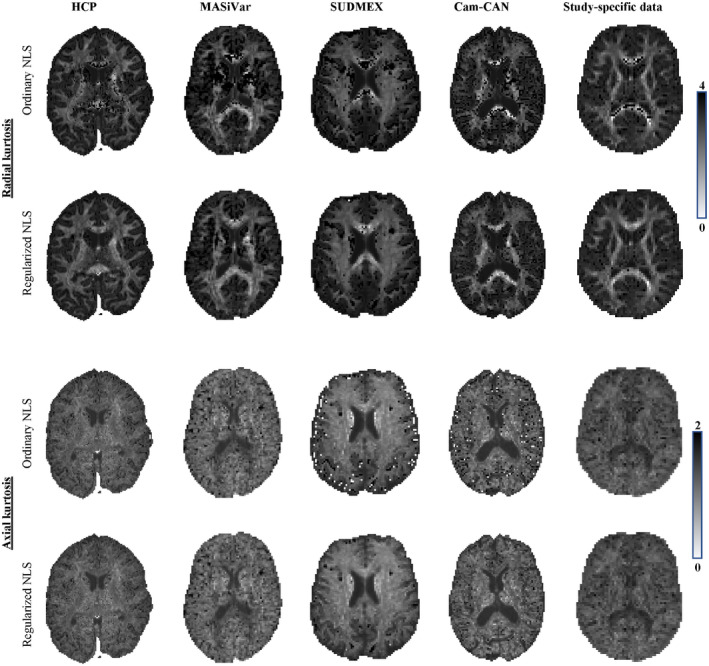
The and maps for the various dataset are shown for the ordinary and regularized NLS in the top and bottom row of each panel
4. DISCUSSION
Improving the robustness of DKI fitting has been an active topic of research since the introduction of the technique. Black voxels have been intrinsic to DKI and challenge the visual and statistical analysis of potentially clinically relevant biomarkers of tissue integrity. Despite increasing evidence of the potential value of DKI during the past decade, the lack of a robust parameter estimation prevents widespread clinical/diagnostic adoption of the kurtosis biomarkers.
It might be impossible to attribute a single cause of the vulnerability of DKI to outliers. It has been shown that thermal noise alone can result in extremely negative kurtosis values. 49 However, imaging artifacts, such as signal voids, Gibbs ringing, CSF pulsation, and/or misalignment of the diffusion‐weighted images might also contribute to the problem, even when the artifacts are largely corrected using state‐of‐the‐art image processing tools. 12 , 52 , 53 The wide variety of signal fluctuations that might cause the DKI estimator to fail motivated the use of a strong image smoothing prior to parameter fitting and/or constraining the parameter estimation by enforcing positive kurtosis estimates. 7 , 40 , 50 , 54
The biophysically implausible kurtosis estimates have previously been associated with artifactually low non‐diffusion weighted signals. Motivated by this, Zhang et al 88 recently proposed an approach in which the non‐diffusion‐weighted signal is altered in a selective data‐driven range. Although the approach yields visually appealing kurtosis maps, the alteration is strongly dependent on a user‐dependent tuning variable, while a selection criterion is missing.
However, for voxels with negative mean kurtosis in our reproducibility data, only of voxels have at least one diffusion‐weighted signal exceeding the non‐diffusion weighted signal, coined as “physically implausible signal (PIS)” 89 , 90 ; see Figure 8C. Moreover, only of all such PIS voxels resulted in a negative mean kurtosis. Hence, techniques focusing on the correction of the non‐diffusion‐weighted signal might be limited to a subset of the voxels only or bias the outcomes by forcing a correction on the non‐diffusion‐weighted signal instead of considering spurious signal fluctuations across the whole of the diffusion‐weighted data.
FIGURE 8.
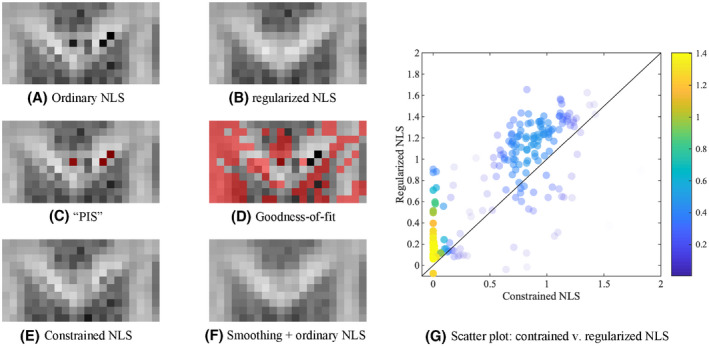
The map of the GCC of a single subject of the reproducibility data is shown for the various fitting strategies (A, B, E, F). The grayscale intensities are scaled between 0 and 2. In (C), the voxels in which at least one diffusion‐weighted signal was larger than the non‐diffusion‐weighted signal, “physically implausible signal (PIS)” are highlighted in red. In (D), the voxels that do not satisfy the Pearson’s goodness‐of‐fit criterion are indicated in red. Many problematic voxels in terms of plausibility of pass the PIS or goodness‐of‐fit criterion. G, A scatter plot shows the relationship between the as estimated using the constrained and regularized NLS, for the voxels that were characterized with a negative using the ordinary NLS estimator. The probability density estimate is color‐encoded
Moreover, when comparing the fit residuals of the ordinary and regularized NLS in the voxels of interest, that is, the voxels with negative mean kurtosis, we observed that the signal prediction of the regularized NLS estimated was significantly different for each b‐value with both positive and negative signal offsets. This observation (data not shown) also suggests that only correcting non‐diffusion‐weighted signals is likely to be insufficient for a robust and unbiased estimator.
Up to of all voxels with negative mean kurtosis within a single subject of our reproducibility data satisfied the Pearson’s goodness‐of‐fit criterion 91 (Figure 8D shows in red voxels in which signals did not satisfied the Pearson’s goodness‐of‐fit for a zoomed brain region of the subject reproducibility data). Hence, despite the implausible kurtosis estimate, the fit residuals were normally distributed and no signal outliers were detected using a residual analysis. Robust estimators, such as RESTORE 92 and related techniques, 93 , 94 would not make any difference to the outcome. Indeed, those methods are designed to improve the robustness of the fit to signal outliers, but are not necessarily tackling the problem described here.
Overall, smoothing has proven to be a very effective way to suppress the signal fluctuations that might lead to negative kurtosis. 7 , 40 , 50 , 54 However, such a brute force strategy introduces image blur and partial volume artefacts. Analogous to other artifacts, for example, Gibbs ringing, 53 , 82 , 90 there is a recent trend toward the development of image processing tools that are more specifically targeted to correct a particular artifact and to avoid smoothing. The development of a robust kurtosis estimator that does not require image smoothing prior to fitting is more in line with such a strategy and, ultimately, will result in sharper images with higher effective spatial resolution.
The constrained NLS estimator only yields positive kurtosis values by design. Hence, the constrained NLS typically appears to be more accurate and robust in the estimation of DKI parameters. However, imposing constraints is likely to bias the estimator in any single voxel. In of all voxels with negative using the ordinary NLS estimator, the constrained NLS estimator provides a solution that lies on the bounds of the search landscape. Although such estimates technically satisfy the imposed constraints, they are not necessarily closer to the most biophysically plausible solution, see Figure 8.
All of these considerations are visualized and summarized in one representative figure that shows the Genu of the CC of one the study‐specific MRI data sets, Figure 8.
In this work, we demonstrated that the mean kurtosis can be very well predicted without the need to estimate the kurtosis tensor. Indeed, the powder kurtosis is already a good approximation of the mean kurtosis, despite a significant approximation error that depends on the anisotropy of the underlying process. We showed that this approximation error can be reduced significantly by using a polynomial regression model in which the mapping between the powder kurtosis, the mean diffusivity, an anisotropy index, and the mean kurtosis can be learned from the hundreds of thousands of non‐problematic voxels in the same or similar data sets. By doing so, we transfer the excellent quality of the DKI estimation in the majority of the gray and white matter voxels to the few, but persistently problematic voxels.
The accurate and robust prediction of the mean kurtosis might be relevant and sufficient for various studies. However, the regularized fitting is a necessary additional step for all studies that have interest in directional kurtosis metrics (eg, radial or axial kurtosis), DKI‐derived biophysical modeling (ie, WMTI 60 ), or tractography. 63 , 66
Similar to the negative kurtosis, various models developed to analyze diffusion MRI data suffer from an abundance of biophysically implausible outcomes or, more subtly, a multitude of biophysically plausible solutions for which the goodness‐of‐fit is not significantly different. 95 Although beyond the scope of this work, we hypothesize that using the regularization term presented in this work might increase the stability and precision of parameter estimators of such models. Similarly, the regularization term can be added to various variations of the loss function, including the log‐linearized or maximum likelihood function.
The implementation of this regularized estimator is publicly available on https://github.com/jelleveraart/RobustDKIFitting/.
ACKNOWLEDGEMENTS
All authors thank Dr. Erika P. Raven for assistance with data acquisition and thank Dr. Els Fieremans and Dr. Noam Shemesh for insightful discussions. Research was performed as part of the Center of Advanced Imaging Innovation and Research (CAI2R, www.cai2r.net), an NIBIB Biomedical Technology Resource Center (NIH P41 EB017183) and was partially supported by the NINDS of the NIH (R01 NS088040). The Connectom data were acquired at the UK National Facility for in vivo MR Imaging of Human Tissue Microstructure funded by the EPSRC (grant EP/M029778/1), and The Wolfson Foundation. DKJ is supported by a Wellcome Trust Investigator Award (096646/Z/11/Z) and a Wellcome Trust Strategic Award (104943/Z/14/Z).
HCP: Data acquisitions from the Human Connectome Project, WU‐Minn Consortium (Principal Investigators: David Van Essen and Kamil Ugurbil; 1U54MH091657) were funded by the 16 NIH Institutes and Centers that support the NIH Blueprint for Neuroscience Research; and by the McDonnell Center for Systems Neuroscience at Washington University."
CamCAN: Data collection and sharing of Cambridge Centre for Ageing and Neuroscience (CamCAN) project was funded by the UK Biotechnology and Biological Sciences Research Council (grant number BB/H008217/1), together with support from the UK Medical Research Council and University of Cambridge, UK.
Henriques RN, Jespersen SN, Jones DK, et al. Toward more robust and reproducible diffusion kurtosis imaging. Magn Reson Med. 2021;86:1600–1613. 10.1002/mrm.28730
REFERENCES
- 1. Novikov DS, Kiselev VG, Jespersen SN. On modeling. Magn Reson Med. 2018;79:3172‐3193. [DOI] [PMC free article] [PubMed] [Google Scholar]
- 2. Basser PJ, Mattiello J, LeBihan D. MR diffusion tensor spectroscopy and imaging. Biophys J. 1994;66:259‐267. [DOI] [PMC free article] [PubMed] [Google Scholar]
- 3. Jensen JH, Helpern JA, Ramani A, Lu H, Kaczynski K. Diffusional kurtosis imaging: the quantification of non‐Gaussian water diffusion by means of magnetic resonance imaging. Magn Reson Med. 2005;53:1432‐1440. [DOI] [PubMed] [Google Scholar]
- 4. Shi J, Chang L, Wang J, et al. Initial application of diffusional kurtosis imaging in evaluating brain development of healthy preterm infants. PLOS ONE. 2016;11. [DOI] [PMC free article] [PubMed] [Google Scholar]
- 5. Ouyang M, Jeon T, Sotiras A, et al. Differential cortical microstructural maturation in the preterm human brain with diffusion kurtosis and tensor imaging. Proc Nat Acad Sci. 2019;116:4681‐4688. [DOI] [PMC free article] [PubMed] [Google Scholar]
- 6. Pfefferbaum A, Sullivan EV, Hedehus M, Lim KO, Adalsteinsson E, Moseley ME. Age‐related decline in brain white matter anisotropy measured with spatially corrected echo‐planar difftensor imaging. Magn Reson Med. 2000;44:259‐68. [DOI] [PubMed] [Google Scholar]
- 7. Falangola MF, Jensen JH, Babb JS, et al. Age‐related non‐Gaussian diffusion patterns in the prefrontal brain. J Magn Reson Imaging. 2008;28:1345‐1350. [DOI] [PMC free article] [PubMed] [Google Scholar]
- 8. Lampinen B, Szczepankiewicz F, Mårtensson J, van Westen D, Sundgren PC, Nilsson M. Neurite density imaging versus imaging of microscopic anisotropy in diffusion MRI: a model comparison using spherical tensor encoding. NeuroImage. 2017;147:517‐531. [DOI] [PubMed] [Google Scholar]
- 9. Lampinen B, Szczepankiewicz F, Novén M, et al. Searching for the neurite density with diffusion MRI: challenges for biophysical modeling. Hum Brain Mapp. 2019;40:2529‐2545. [DOI] [PMC free article] [PubMed] [Google Scholar]
- 10. Henriques RN, Jespersen SN, Shemesh N. Microscopic anisotropy misestimation in spherical‐mean single diffusion encoding MRI. Magn Reson Med. 2019;81:3245‐3261. [DOI] [PMC free article] [PubMed] [Google Scholar]
- 11. Price D, Tyler LK, Neto Henriques R, et al. Age‐related delay in visual and auditory evoked responses is mediated by white‐ and grey‐matter differences. Nat Commun. 2017;8:15671. [DOI] [PMC free article] [PubMed] [Google Scholar]
- 12. Henriques RN. Advanced Methods for Diffusion MRI Data Analysis and their Application to the Healthy Ageing Brain. University of Cambridge; 2018. [Google Scholar]
- 13. Rudrapatna SU, Wieloch T, Beirup K, et al. Can diffusion kurtosis imaging improve the sensitivity and pecificity of detecting microstructural alterations in brain tissue chronically after experimental stroke? Comparisons with diffusion tensor imaging and histology. NeuroImage. 2014;97:363‐373. [DOI] [PubMed] [Google Scholar]
- 14. Hui ES, Fieremans E, Jensen JH, et al. Stroke assessment with diffusional kurtosis imaging. Stroke. 2012;43:2968‐2973. [DOI] [PMC free article] [PubMed] [Google Scholar]
- 15. Raab P, Hattingen E, Franz K, Zanella FE, Lanfermann H. Cerebral gliomas: diffusional kurtosis imaging analysis of microstructural differences. Radiology. 2010;254:876‐881. [DOI] [PubMed] [Google Scholar]
- 16. van Cauter S, Veraart J, Sijbers J, et al. Gliomas: diffusion kurtosis MR imaging in grading. Radiology. 2012;263:492‐501. [DOI] [PubMed] [Google Scholar]
- 17. Wu D, Li G, Zhang J, Chang S, Hu J, Dai Y. Characterization of breast tumors using diffusion kurtosis imaging (DKI). PloS one. 2014;9. [DOI] [PMC free article] [PubMed] [Google Scholar]
- 18. Steven AJ, Zhuo J, Melhem ER. Diffusion kurtosis imaging: an emerging technique for evaluating the microstructural environment of the brain. Am J Roentgenol. 2014;202:W26‐W33. [DOI] [PubMed] [Google Scholar]
- 19. Grossman EJ, Ge Y, Jensen JH, et al. Thalamus and cognitive impairment in mild traumatic brain injury: a diffusional kurtosis imaging study. J Neurotrauma. 2012;29:2318‐2327. [DOI] [PMC free article] [PubMed] [Google Scholar]
- 20. Zhuo J, Xu S, Proctor JL, et al. Diffusion kurtosis as an in vivo imaging marker for reactive astrogliosis in traumatic brain injury. Neuroimage. 2012;59:467‐477. [DOI] [PMC free article] [PubMed] [Google Scholar]
- 21. de Kouchkovsky I, Fieremans E, Fleysher L, Herbert J, Grossman RI, Inglese M. Quantification of normal‐appearing white matter tract integrity in multiple sclerosis: a diffusion kurtosis imaging study. J Neurol. 2016;263:1146‐1155. [DOI] [PMC free article] [PubMed] [Google Scholar]
- 22. Zhu J, Zhuo C, Qin W, et al. Performances of diffusion kurtosis imaging and diffusion tensor imaging in detecting white matter abnormality in schizophrenia. NeuroImage. 2015;7:170‐176. [DOI] [PMC free article] [PubMed] [Google Scholar]
- 23. Docx L, Emsell L, van Hecke W, et al. White matter microstructure and volitional motor activity in schizophrenia: A diffusion kurtosis imaging study. Psychiatry Res. 2017;260:29‐36. [DOI] [PubMed] [Google Scholar]
- 24. Sui YV, Donaldson J, Miles L, Babb JS, Castellanos FX, Lazar M. Diffusional kurtosis imaging of the corpus callosum in autism. Mol Autism. 2018;9:62. [DOI] [PMC free article] [PubMed] [Google Scholar]
- 25. Hattori A, Kamagata K, Kirino E, et al. White matter alterations in adult with autism spectrum disorder evaluated using diffusion kurtosis imaging. Neuroradiology. 2019;61:1343‐1353. [DOI] [PubMed] [Google Scholar]
- 26. Bonilha L, Lee CY, Jensen J, et al. Altered microstructure in temporal lobe epilepsy: a diffusional kurtosis imaging study. Am J Neuroradiol. 2015;36:719‐724. [DOI] [PMC free article] [PubMed] [Google Scholar]
- 27. Gao J, Feng ST, Wu B, et al. Microstructural brain abnormalities of children of idiopathic generalized epilepsy with generalized tonic‐clonic seizure: a voxel‐based diffusional kurtosis imaging study. J Magn Reson Imaging. 2015;41:1088‐1095. [DOI] [PubMed] [Google Scholar]
- 28. Ito K, Kudo M, Sasaki M, et al. Detection of changes in the periaqueductal gray matter of patients with episodic migraine using quantitative diffusion kurtosis imaging: preliminary findings. Neuroradiology. 2016;58:115‐120. [DOI] [PubMed] [Google Scholar]
- 29. Wang JJ, Lin WY, Lu CS, et al. Parkinson disease: diagnostic utility of diffusion kurtosis imaging. Radiology. 2011;261:210‐217. [DOI] [PubMed] [Google Scholar]
- 30. Struyfs H, van Hecke W, Veraart J, et al. Diffusion kurtosis imaging: a possible MRI biomarker for AD diagnosis? J Alzheimer’s Disease. 2015;48:937‐948. [DOI] [PMC free article] [PubMed] [Google Scholar]
- 31. Fieremans E, Benitez A, Jensen J, et al. Novel white matter tract integrity metrics sensitive to Alzheimer disease progression. Am J Neuroradiol. 2013;34:2105‐2112. [DOI] [PMC free article] [PubMed] [Google Scholar]
- 32. Rosenkrantz AB, Padhani AR, Chenevert TL, et al. Body diffusion kurtosis imaging: basic principles, applications, and considerations for clinical practice. J Magn Reson Imaging. 2015;42:1190‐1202. [DOI] [PubMed] [Google Scholar]
- 33. Pentang G, Lanzman RS, Heusch P, et al. Diffusion kurtosis imaging of the human kidney: a feasibility study. Magn Reson Imaging. 2014;32:413‐420. [DOI] [PubMed] [Google Scholar]
- 34. Insights Imaging. European Society of Radiology (ESR) White paper on imaging biomarkers. 2010;1:42‐45.22347903 [Google Scholar]
- 35. Jensen JH, Helpern JA. MRI quantification of non‐Gaussian water diffusion by kurtosis analysis. NMR Biomed. 2010;23:698‐710. [DOI] [PMC free article] [PubMed] [Google Scholar]
- 36. Hansen B, Lund TE, Sangill R, Jespersen SN. Experimentally and computationally fast method for estimation of a mean kurtosis. Magn Reson Med. 2013;69:1754‐1760. [DOI] [PubMed] [Google Scholar]
- 37. Tabesh A, Jensen JH, Ardekani BA, Helpern JA. Estimation of tensors and tensor‐derived measures in diffusional kurtosis imaging. Magn Reson Med. 2011;65:823‐836. [DOI] [PMC free article] [PubMed] [Google Scholar]
- 38. Basser PJ, Pierpaoli C. Microstructural and physiological features of tissues elucidated by quantitative‐diffusion‐tensor MRI. J Magn Reson Ser B. 1996;111:209‐219. [DOI] [PubMed] [Google Scholar]
- 39. Veraart J, Poot DH, van Hecke W, et al. More accurate estimation of diffusion tensor parameters using diffusion kurtosis imaging. Magn Reson Med. 2011;65:138‐145. [DOI] [PubMed] [Google Scholar]
- 40. Lu H, Jensen JH, Ramani A, Helpern JA. Three‐dimensional characterization of non‐Gaussian water diffusion in humans using diffusion kurtosis imaging. NMR Biomed. 2006;19:236‐247. [DOI] [PubMed] [Google Scholar]
- 41. Larkman DJ, Hajnal JV, Herlihy AH, Coutts GA, Young IR, Ehnholm G. Use of multicoil arrays for separation of signal from multiple slices simultaneously excited. J Magn Reson Imaging. 2001;13:313‐317. [DOI] [PubMed] [Google Scholar]
- 42. Moeller S, Yacoub E, Olman CA, et al. Multiband multislice GE‐EPI at 7 tesla, with 16‐fold acceleration using partial parallel imaging with application to high spatial and temporal whole‐brain fMRI. Magn Reson Med. 2010;63:1144‐1153. [DOI] [PMC free article] [PubMed] [Google Scholar]
- 43. van Essen DC, Smith SM, Barch DM, et al. The WU‐Minn Human Connectome Project: an overview. NeuroImage. 2013;80:62‐79. [DOI] [PMC free article] [PubMed] [Google Scholar]
- 44. Setsompop K, Kimmlingen R, Eberlein E, et al. Pushing the limits of in vivo diffusion MRI for the Human Connectome Project. Neuroimage. 2013;80:220‐233. [DOI] [PMC free article] [PubMed] [Google Scholar]
- 45. Miller KL, Alfaro‐Almagro F, Bangerter NK, et al. Multimodal population brain imaging in the UK Biobank prospective epidemiological study. Nat Neurosci. 2016;19:1523‐1536. [DOI] [PMC free article] [PubMed] [Google Scholar]
- 46. Weiner MW, Veitch DP, Aisen PS, et al. The Alzheimer’s Disease Neuroimaging Initiative: a review of papers published since its inception. Alzheimers Dement. 2012;8:1‐68. [DOI] [PMC free article] [PubMed] [Google Scholar]
- 47. Taylor JR, Williams N, Cusack R, et al. The Cambridge Centre for Ageing and Neuroscience (Cam‐CAN) data repository: Structural and functional MRI, MEG, and cognitive data from a cross‐sectional adult lifespan sample. NeuroImage. 2017;144:262‐269. [DOI] [PMC free article] [PubMed] [Google Scholar]
- 48. Shafto MA, Tyler LK, Dixon M, et al. The Cambridge Centre for Ageing and Neuroscience (Cam‐CAN) study protocol: a cross‐sectional, lifespan, multidisciplinary examination of healthy cognitive ageing. BMC Neurol. 2014;14:204. [DOI] [PMC free article] [PubMed] [Google Scholar]
- 49. Veraart J, van Hecke W, Sijbers J. Constrained maximum likelihood estimation of the diffusion kurtosis tensor using a Rician noise model. Magn Reson Med. 2011;66:678‐686. [DOI] [PubMed] [Google Scholar]
- 50. Henriques RN. Diffusion kurtosis imaging of the healthy human brain (Doctoral dissertation); 2012. [Google Scholar]
- 51. Billiet T, Vandenbulcke M, Mädler B, et al. Age‐related microstructural differences quantified using myelin water imaging and advanced diffusion MRI. Neurobiol Aging. 2015;36:2107‐2121. [DOI] [PubMed] [Google Scholar]
- 52. Ades‐Aron B, Veraart J, Kochunov P, McGuire S, Sherman P, Kellner E, et al. Evaluation of the accuracy and precision of the diffusion parameter EStImation with Gibbs and NoisE removal pipeline. NeuroImage. 2018;183:532‐543. [DOI] [PMC free article] [PubMed] [Google Scholar]
- 53. Veraart J, Fieremans E, Jelescu IO, Knoll F, Novikov DS. Gibbs ringing in diffusion MRI. Magn Reson Med. 2016;76:301–314. [DOI] [PMC free article] [PubMed] [Google Scholar]
- 54. Mohammadi S, Tabelow K, Ruthotto L, Feiweier T, Polzehl J, Weiskopf N. High‐resolution diffusion kurtosis imaging at 3T enabled by advanced post‐processing. Front Neurosci. 2015;8:427. [DOI] [PMC free article] [PubMed] [Google Scholar]
- 55. Kuder TA, Stieltjes B, Bachert P, Semmler W, Laun FB. Advanced fit of the diffusion kurtosis tensor by directional weighting and regularization. Magn Reson Med. 2012;67:1401‐1411. [DOI] [PubMed] [Google Scholar]
- 56. Lasič S, Szczepankiewicz F, Eriksson S, Nilsson M, Topgaard D. Microanisotropy imaging: quantification of microscopic diffusion anisotropy and orientational order parameter by diffusion MRI with magic‐angle spinning of the q‐vector. Front Phys. 2014;2:11. [Google Scholar]
- 57. Hui ES, Cheung MM, Qi L, Wu EX. Towards better MR characterization of neural tissues using directional diffusion kurtosis analysis. NeuroImage. 2008;42:122–134. [DOI] [PubMed] [Google Scholar]
- 58. Taoka T, Fujioka M, Sakamoto M, et al. Time course of axial and radial diffusion kurtosis of white matter infarctions: period of pseudonormalization. American Journal of Neuroradiology. 2014;35:1509–1514. [DOI] [PMC free article] [PubMed] [Google Scholar]
- 59. Jespersen SN, Olesen JL, Hansen B, Shemesh N. Diffusion time dependence of microstructural parameters in fixed spinal cord. NeuroImage. 2018;182:329‐342. [DOI] [PMC free article] [PubMed] [Google Scholar]
- 60. Fieremans E, Jensen JH, Helpern JA. White matter characterization with diffusional kurtosis imaging. Neuroimage. 2011;58:177‐188. [DOI] [PMC free article] [PubMed] [Google Scholar]
- 61. Novikov DS, Veraart J, Jelescu IO, Fieremans E. Mapping orientational and microstructural metrics of neuronal integrity with in vivo diffusion MRI. NeuroImage. 2018;174:518‐538. [DOI] [PMC free article] [PubMed] [Google Scholar]
- 62. Jespersen SN. White matter biomarkers from diffusion MRI. J Magn Reson. 2018;291:127‐140. [DOI] [PubMed] [Google Scholar]
- 63. Lazar M, Jensen JH, Xuan L, Helpern JA. Estimation of the orientation distribution function from diffusional kurtosis imaging. Magn Reson Med. 2008;60:774‐781. [DOI] [PMC free article] [PubMed] [Google Scholar]
- 64. Jensen JH, Helpern JA, Tabesh A. Leading non‐Gaussian corrections for diffusion orientation distribution function. NMR Biomed. 2014;27:202‐211. [DOI] [PMC free article] [PubMed] [Google Scholar]
- 65. Henriques RN, Correia MM, Nunes RG, Ferreira HA. Exploring the 3D geometry of the diffusion kurtosis tensor‐impact on the development of robust tractography procedures and novel biomarkers. NeuroImage. 2015;111. [DOI] [PubMed] [Google Scholar]
- 66. Glenn GR, Helpern JA, Tabesh A, Jensen JH. Quantitative assessment of diffusional kurtosis anisotropy. NMR Biomed. 2015;28:448‐459. [DOI] [PMC free article] [PubMed] [Google Scholar]
- 67. Hansen B, Shemesh N, Jespersen SN. Fast imaging of mean, axial and radial diffusion kurtosis. Neuroimage. 2016;142:381‐393. [DOI] [PMC free article] [PubMed] [Google Scholar]
- 68. Jespersen SN, Lundell H, Sønderby CK, Dyrby TB. Orientationally invariant metrics of apparent compartment eccentricity from double pulsed field gradient diffusion experiments. NMR Biomed. 2013;26:647‐1662. [DOI] [PubMed] [Google Scholar]
- 69. Kaden E, Kruggel F, Alexander DC. Quantitative mapping of the per‐axon diffusion coefficients in brain white matter. Magn Reson Med. 2016;75:1752‐1763. [DOI] [PMC free article] [PubMed] [Google Scholar]
- 70. Veraart J, Nunes D, Rudrapatna U, et al. Noninvasive quantification of axon radii using diffusion MRI. eLife. 2020;9:e49855. [DOI] [PMC free article] [PubMed] [Google Scholar]
- 71. Chuhutin A, Hansen B, Jespersen SN. Precision and accuracy of diffusion kurtosis estimation and the influence of b‐value selection. NMR Biomed. 2017;30:e3777. [DOI] [PMC free article] [PubMed] [Google Scholar]
- 72. Veraart J, Sijbers J, Sunaert S, Leemans A, Jeurissen B. Weighted linear least squares estimation of diffusion MRI parameters: strengths, limitations, and pitfalls. Neuroimage. 2013;81:335‐346. [DOI] [PubMed] [Google Scholar]
- 73. Jones DK, Basser PJ. “Squashing peanuts and smashing pumpkins”: how noise distorts diffusion‐weighted MR data. Magn Reson Med. 2004;52:979‐993. [DOI] [PubMed] [Google Scholar]
- 74. Gudbjartsson H, Patz S. The Rician distribution of noisy MRI data. Magn Reson Med. 1995;34:910‐914. [DOI] [PMC free article] [PubMed] [Google Scholar]
- 75. Kristoffersen A. Estimating non‐Gaussian diffusion model parameters in the presence of physiological noise and Rician signal bias. J Magn Reson Imaging. 2012;35:181‐189. [DOI] [PubMed] [Google Scholar]
- 76. Jones DK, Horsfield MA, Simmons A. Optimal strategies for measuring diffusion in anisotropic systems by magnetic resonance imaging. Magn Reson Med. 1999;42:515‐525. [PubMed] [Google Scholar]
- 77. Glasser MF, Sotiropoulos SN, Wilson JA, et al. The minimal preprocessing pipelines for the Human Connectome Project. Neuroimage. 2013;80:105‐124. [DOI] [PMC free article] [PubMed] [Google Scholar]
- 78. Cai LY, Yang Q, Kanakaraj P, et al. MASiVar: multisite, multiscanner, and multisubject acquisitions for studying variability in diffusion weighted magnetic resonance imaging. bioRxiv. 2020. https://www.biorxiv.org/content/10.1101/2020.12.03.408567v3 [DOI] [PMC free article] [PubMed] [Google Scholar]
- 79. Garza‐Villarreal EA, Chakravarty MM, Hansen B, et al. The effect of crack cocaine addiction and age on the microstructure and morphology of the human striatum and thalamus using shape analysis and fast diffusion kurtosis imaging. Transl Psychiatry. 2017;7:e1122. [DOI] [PMC free article] [PubMed] [Google Scholar]
- 80. Toledo JR, Shah A, Ingalhalikar M, Garza‐Villarreal EA. Neurite orientation dispersion and density imaging in cocaine use disorder. medRxiv. 2020. https://www.medrxiv.org/content/10.1101/2020.10.28.20221911v1 [DOI] [PubMed] [Google Scholar]
- 81. Garza‐Villarreal EA, Olvera JJG, Balducci T, Valdez DA, Valencia A, Rasgado J. SUDMEX CONN: The Mexican dataset of cocaine use disorder patients. OpenNeuro. 2020. 10.18112/openneuro.ds003346.v1.1.0 [DOI] [Google Scholar]
- 82. Kellner E, Dhital B, Kiselev VG, Reisert M. Gibbs‐ringing artifact removal based on local subvoxel‐shifts. Magn Reson Med. 2016;76:1574‐1581. [DOI] [PubMed] [Google Scholar]
- 83. Andersson JL, Sotiropoulos SN. An integrated approach to correction for off‐resonance effects and subject movement in diffusion MR imaging. Neuroimage. 2016;125:1063‐1078. [DOI] [PMC free article] [PubMed] [Google Scholar]
- 84. Bammer R, Markl M, Barnett A, et al. Analysis and generalized correction of the effect of spatial gradient field distortions in diffusion‐weighted imaging. Magn Reson Med. 2003;50:560‐569. [DOI] [PubMed] [Google Scholar]
- 85. Andersson JL, Graham MS, Zsoldos E, Sotiropoulos SN. Incorporating outlier detection and replacement into a non‐parametric framework for movement and distortion correction of diffusion MR images. NeuroImage. 2016;141:556‐572. [DOI] [PubMed] [Google Scholar]
- 86. Wasserthal J, Neher P, Maier‐Hein KH. Tractseg‐fast and accurate white matter tract segmentation. NeuroImage. 2018;183:239‐253. [DOI] [PubMed] [Google Scholar]
- 87. Cai LY, Yang Q, Hansen CB, et al. PreQual: an automated pipeline for integrated preprocessing and quality assurance of diffusion weighted MRI images. bioRxiv. 2020. https://www.biorxiv.org/content/10.1101/2020.09.14.260240v3 [DOI] [PMC free article] [PubMed] [Google Scholar]
- 88. Zhang F, Ning L, O’Donnell LJ, Pasternak O. MK‐curve–characterizing the relation between mean kurtosis and alterations in the diffusion MRI signal. NeuroImage. 2019;196:68‐80. [DOI] [PMC free article] [PubMed] [Google Scholar]
- 89. Tournier JD, Mori S, Leemans A. Diffusion tensor imaging and beyond. Magn Reson Med. 2011;65:1532‐1556. [DOI] [PMC free article] [PubMed] [Google Scholar]
- 90. Perrone D, Aelterman J, Pižurica A, Jeurissen B, Philips W, Leemans A. The effect of Gibbs ringing artifacts on measures derived from diffusion MRI. Neuroimage. 2015;120:441‐455. [DOI] [PubMed] [Google Scholar]
- 91. Pearson KX. On the criterion that a given system of deviations from the probable in the case of a correlated system of variables is such that it can be reasonably supposed to have arisen from random sampling. London, Edinburgh, Dublin Philos Mag J Sci. 1900;50:157‐175. [Google Scholar]
- 92. Chang LC, Jones DK, Pierpaoli C. RESTORE: robust estimation of tensors by outlier rejection. Magn Reson Med. 2005;53:1088‐1095. [DOI] [PubMed] [Google Scholar]
- 93. Tax CM, Otte WM, Viergever MA, Dijkhuizen RM, Leemans A. REKINDLE: robust extraction of kurtosis INDices with linear estimation. Magn Reson Med. 2015;73:794‐808. [DOI] [PubMed] [Google Scholar]
- 94. Collier Q, Veraart J, Jeurissen B, den Dekker AJ, Sijbers J. Iterative reweighted linear least squares for accurate, fast, and robust estimation of diffusion magnetic resonance parameters. Magn Reson Med. 2015;73:2174‐2184. [DOI] [PubMed] [Google Scholar]
- 95. Jelescu IO, Veraart J, Fieremans E, Novikov DS. Degeneracy in model parameter estimation for multi‐compartmental diffusion in neuronal tissue. NMR Biomed. 2016;29:33‐47. [DOI] [PMC free article] [PubMed] [Google Scholar]