

Abstract
Binding hot spots are regions of proteins that, due to their potentially high contribution to the binding free energy, have high propensity to bind small molecules. We present benchmark sets for testing computational methods for the identification of binding hot spots with emphasis on fragment based ligand discovery. Each protein structure in the set binds a fragment, which is extended into larger ligands in other structures without substantial change in its binding mode. Structures of the same proteins without any bound ligand are also collected to form an unbound benchmark. We also discuss a set developed by Astex Pharmaceuticals for the validation of hot and warm spots for fragment binding. The set is based on the assumption that a fragment that occurs in diverse ligands in the same subpocket identifies a binding hot spot. Since this set includes only ligand-bound proteins, we added a set with unbound structures. All four sets were tested using FTMap, a computational analogue of fragment screening experiments to form a baseline for testing other prediction methods, and differences among the sets are discussed.
Table of Contents graphic
INTRODUCTION
The importance of binding hot spots is well established in the literature on protein-ligand binding and drug discovery. The concept was proposed by Clackson and Wells to describe their finding that certain small regions at the interface between two interacting proteins contribute disproportionately to the binding free energy.1 A similar notion was introduced in drug discovery to describe the specific regions of proteins that, due to their potentially high contribution to the binding free energy, have a high propensity to bind small molecules.2 In this latter context hot spots were generally associated with regions of the protein that bind low molecular weight compounds commonly called “fragments”. Ringe and coworkers introduced the method called Multiple Solvent Crystal Structures (MSCS), which involves determining X-ray structures of a target protein in aqueous solutions containing high concentrations of organic co-solvents, and then superimposing the structures to find consensus binding sites that accommodate a variety of the organic probes.3, 4 It was shown that such consensus sites identify hot spots that are the most important regions for binding. Early protein soaking experiments were also carried out by Hubbard and coworkers.5, 6 About the same time, Fesik and colleagues published the first results using their Structure-Activity Relationship by Nuclear Magnetic Resonance (SAR by NMR) method, which screens large libraries of fragment-sized organic compounds for binding to target proteins using NMR.7 They showed that the fragments cluster at ligand binding sites, and described such regions as “hot spots on protein surfaces”. 8
Both MSCS and SAR by NMR use fragment sized small molecules to identify hot spots and can be considered as early examples of fragment based ligand discovery (FBLD), which has been refined into an effective tool by several pharmaceutical companies including Astex.9–13 FBLD is based on screening libraries of low molecular weight (<300 Da) compounds, frequently using X-ray crystallography or NMR. The structures of bound fragments are then used as starting points for drug discovery. Experimental methods for finding hot spots have significant challenges, however. Fragment screening by X-ray crystallography is based on soaking of cocktails of fragments into preformed crystals of the target protein. Preparing the proteins and screening large fragment collections require considerable infrastructure, and a fairly high fraction of the experiments fail.14, 15 NMR methods provide an alternative, but to gain structural information on the location and orientation of fragment binding requires full spectral assignment using isotopically labeled proteins.16
Computational fragment mapping approaches offer somewhat less reliable but much less expensive alternatives to experimental protein mapping, and can provide useful information in the early stages of drug discovery. Such methods can be used to address three interrelated problems. First, predicting the existence and location of fragment binding sites on a protein of interest is a useful first step in rational fragment-based drug discovery. Second, it is desirable that the methods provide some estimate of the affinity of the site for fragment binding. Third, it is useful to predict the position and orientation of the bound fragment, since FBDD relies on the premise that the binding site and binding mode of the fragments are conserved as the fragment is grown into a full-sized lead. A number of computational tools have been developed to address these challenges. Examples are the classical methods GRID17 and Multiple Copy Simultaneous Search (MCSS),18 which explore the landscape of interaction energy between the protein and individual atoms or very small functional groups to generate maps of favorable positions corresponding to energy minima. As a disadvantage, it has been noted that both methods tend to generate too many local minima, resulting in identification of a large number of candidate binding sites among which are the few sites that are truly useful for ligand discovery.4 The program FTMap employs a set of slightly larger molecules to probe the target protein surface, and identifies the binding hot spots as sites where multiple probe molecules cluster, thereby reducing the occurrence of false positives.19 It has also been shown that the number of probes that make up an FTMap consensus site provides a measure of the energetic strength of the hot spot.20, 21 FTMap has also been used to address the third problem, the likely conservation of fragment binding modes, as fragments overlapping with a strong hot spots tend to retain their location in chemically distinct ligands.22 More recently, mixed molecular dynamics (MD) simulation methods have used fragments as probes among explicit water molecules, accounting for protein flexibility.23–27 Computational methods aimed at identifying and characterizing binding energy hot spots are continuously improved to provide better information for structure based drug discovery,28–31 and we expect that further efforts will be made. Method development and testing generally requires benchmark or validation sets, preferably ones that are well accepted and widely used. As an example, the publication of a protein-protein docking benchmark enabled the evaluation of different methods, and had a major impact on the protein docking field.32 Benchmark sets are also available to test the docking of small ligands to proteins.33, 34
The goal of this paper is to develop a benchmark set for testing hot spot identification methods, with emphasis on application to fragment-based drug discovery. To construct the benchmark set we selected proteins from the Protein Data Bank (PDB) that bind both fragments and larger ligands with strict conservation of the starting fragment as a substructure.35 This selection method enabled us to generate a set of 62 entries, each binding a fragment with molecular weight (MW) under 200 g/mol, and with one or more ligands with MW > 250 g/mol. This set will be referred to as the Acpharis set, since it has been developed in a collaboration between the small company Acpharis and the Vajda lab at Boston University. We note that a set of proteins binding both fragments and larger ligands was also constructed by Kellenberger and co-workers.36 However, most entries in the Kellenberger set showed no strict conservation of the starting fragment, and the goal of the paper was to study the conservation of the binding mode, defined in terms of the protein residues interacting with the ligands. In contrast, in our new Acpharis set the chemical structure of the fragments is strictly conserved upon elaboration into larger ligands. As will be shown, the positions and orientations of the fragments are also fairly well conserved in this process. In addition to the benchmark set of fragment-bound structures we also constructed a benchmark set that included the protein’s unliganded structures whenever such structures were available. The motivation for this set is that finding hot spots of proteins without known ligand binding sites is clearly a more realistic problem than considering structures with bound ligands.
The fragment binding sites in both bound and unbound benchmark sets were explored using the already mentioned FTMap program. FTMap has been developed as a close computational analogue of the X-ray crystallography or NMR based experimental fragment screening methods.19 The approach distributes small organic probe molecules of varying size, shape, and polarity on the protein surface, finds the most favorable positions for each probe type, then clusters the probes and ranks the clusters on the basis of their average energy. Binding energy hot spots are defined as regions that bind probe clusters for multiple different probes. Although this method is obviously less direct than validation by binding experiments, the exhaustive docking of fragments by FTMap is based on a physics-based scoring function and hence has some thermodynamic validity.19 It was previously shown that the hot spots predicted by FTMap agree well with pockets that bind multiple probes in X-ray soaking experiments,37–39 and that the number of probe clusters binding at a hot spot predicts the druggability of the site.20
Verdonk and co-workers of Astex has published a somewhat similar set of proteins.14 The motivation for the work was validation of hot and “warm” spots, rather than testing computational methods of identifying the hot spots. In addition, it was constructed by using an approach very different from the one we used in this paper. They searched the Protein Data Bank (PDB)35 for proteins that bind several ligands containing the same moiety as a substructure, and made the assumption that if such a moiety is placed in the same binding subpocket in multiple structures then the subpocket likely represents a hot or warm spot. The sites were categorized as either hot or warm based on the fraction of unique ligands in the PDB that occupy each position within the binding site; highly occupied regions were classified as “hot”, whereas less frequently occupied regions were classified as “warm”. The analysis resulted in a set of 52 diverse examples of fragment binding “hot” and “warm” spots.14 We will refer to this set as the Astex set. In addition to the published set of ligand-bound proteins we constructed a benchmark set of the unliganded structures of the same proteins in the Astex set, and applied FTMap to the structures in both sets. As will be discussed, considering all hot spots generated by FTMap we observed similar success rates of finding the fragment binding sites in the Acpharis and Astex sets, in spite of the very different methods of construction. However, we have found major differences when focusing on the strongest hots spots. In the case of the Acpharis set, mapping results for fragment-bound and unliganded protein structures are generally close to each other, since the weak binding of fragments introduces at most moderate conformational changes. In contrast, since the proteins in the original Astex set have been co-crystallized with larger ligands, the strongest hot spots frequently shift away from the site of the pocket that binds the selected fragment, and the FTMap success rate is lower for these structures than for the unliganded structures of the same proteins. Thus, it will be interesting to see how well other computational methods perform on these sets.
RESULTS AND DISCUSSION
Acpharis Benchmark Sets of Proteins with Fragment and Ligand Binding.
To build the benchmark set of target proteins, potential “fragment”-type ligands were found by searching the PDB for small molecules with molecular weights between 80 and 200 g/mol. Extremely common species appearing in over 20 structures were excluded. For the remaining fragments, examples of them being grown into larger compounds were then found by using the substructure search function in the PDB. We included ligands that (1) bind to the same protein as the fragment, (2) bind in a similar orientation and location as the fragment, and (3) are significantly larger than the fragment (at least one ligand must have molecular weight ≥250 g/mol). Whether a ligand was considered to bind in a similar orientation as a fragment was determined by first superimposing the PDB structures containing the ligand and fragment in PyMOL, then calculating the RMSD between the atoms of the fragment and the portion of the ligand that matched the fragment. The fragment and ligand were considered a match if the all-atom RMSD did not exceeded 2 Å. After applying these criteria, the resulting benchmark set contained 62 fragment-protein pairs, with 48 unique proteins and 52 unique fragments, the latter shown in Figure 1. We note that 25 of these 62 cases are also in the Kellenberger set that contains 359 fragment-ligand substructure pairs.36 However, only these 25 pairs satisfy the condition of strict fragment conservation and hence are included in the Acpharis benchmark set. The remaining cases in the Kellenberger set have similar but not identical substructures, and hence were excluded. In contrast, the fragments in the Acpharis set have structures that are strictly conserved when forming larger ligands. Figure 2 demonstrates this level of conservation for 1LQ, the first fragment in Figure 1.
Figure 1.
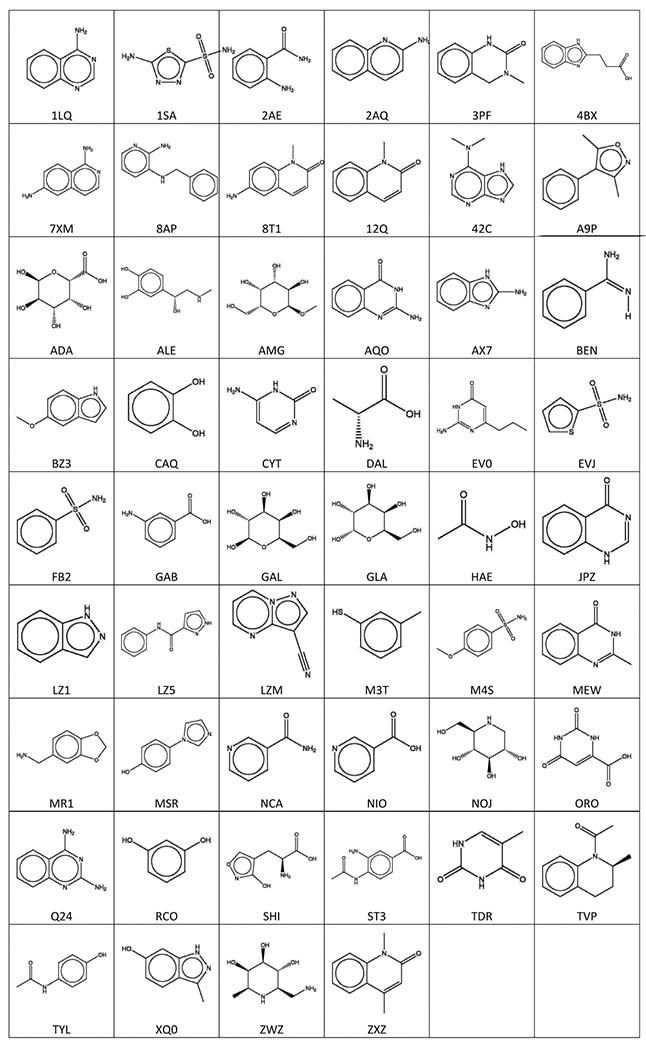
Chemical structures and PDB ligand ID codes of the fragments in the newly created Acpharis benchmark set.
Figure 2.
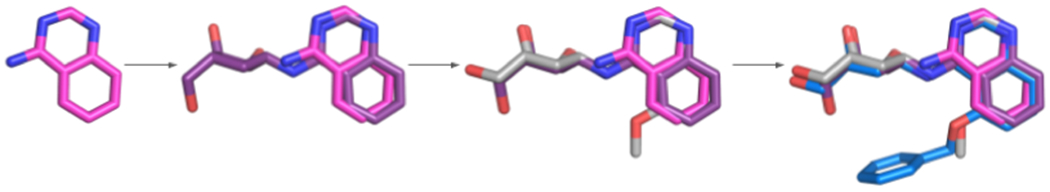
Fragment 1LQ and ligands that contain the fragment as a substructure. The fragment and the ligands, all bound to the HSP70 protein, are from the PDB structures 5AQP (chain E), 5AQT (chain A), 5AQU (chain A), and 5AQV (chain A).
For each protein in the benchmark set, in Table 1 we list the Uniprot ID of the protein, the three character PDB IDs of the fragment, the PDB ID of the fragment-bound protein with the chain ID included, the molecular weight of the fragment, the number of additional larger ligands of the protein in the benchmark set, the PDB ID of the protein with the largest bound ligand, and the molecular weight of that largest ligand. We also show the RMSD between the fragment when bound alone versus the position of the corresponding atoms in the largest bound ligand. The table has additional columns that will be discussed below. All proteins with bound ligands are listed in Table S1. As shown, 20 of the fragment-protein pairs have only a single bound ligand, in addition to the bound fragment, but for the other 42 pairs X-ray structures exist of the protein with a variety of bound compounds that contain the fragment as part of their chemical structure.
Table 1.
Fragment and ligand bound structures, fragment IDs and molecular weights in the Acpharis benchmark set, and the strongest hot spots at the fragment binding sites in both bound and unbound structures.
| No. | UniProt ID | Frag. ID | Frag. PDB IDa | Frag. MW | No. Lig.b | Max lig. PDB IDc | Max. MWd | Max RMSDe | Unbound PDB IDf | Strongest Hot Spotg | |
|---|---|---|---|---|---|---|---|---|---|---|---|
| Bound | Unbound | ||||||||||
| 1 | P55201 | 12Q | 5T4U_A | 159.19 | 1 | 5T4V | 383.42 | 0.47 | 4LC2_A | 00(19) | 00(22) |
| 2 | Q92831 | 12Q | 5FE1_A | 159.19 | 1 | 5FE9 | 266.32 | 0.27 | 5FE6_B | 00(21) | 00(24) |
| 3 | P11142 | 1LQ | 5AQP_E | 145.16 | 3 | 5AQV | 381.43 | 0.52 | 5AQM_A | 04(10) | None |
| 4 | P00918 | 1SA | 2HNC_A | 180.21 | 4 | 3MHC | 342.44 | 0.75 | 3KS3_A | 00(25) | 00(16) |
| 5 | P07900 | 2AE | 2YE6_A | 136.15 | 8 | 4AWO | 503.64 | 0.43 | 5J80_A | 01(14) | 00(22) |
| 6 | P56817 | 2AQ | 2OHL_A | 144.17 | 4 | 3RVI | 443.62 | 0.67 | 3TPJ_A | 00(16) | 01(20) |
| 7 | O60885 | 3PF | 4DON_A | 162.19 | 5 | 4E96 | 347.39 | 1.50 | 4LYI_A | 00(26) | 00(27) |
| 8 | P07900 | 42C | 3HZ1_A | 163.18 | 1 | 3HZ5 | 351.41 | 0.32 | 5J80_A | 00(22) | 00(22) |
| 9 | Q13526 | 4BX | 3KAC_A | 190.2 | 1 | 3KAH | 389.41 | 0.91 | 2ZQT_A | 00(20) | 00(17) |
| 10 | P08709 | 7XM | 5PAW_B | 159.19 | 16 | 5TQG | 681.72 | 0.58 | 1JBU_H | 00(20) | None |
| 11 | P56817 | 8AP | 2OHM_A | 199.25 | 2 | 2OHU | 421.49 | 2.26 | 3TPJ_A | 00(29) | 00(21) |
| 12 | O95696 | 8T1 | 5POE_A | 174.2 | 1 | 5POC | 283.08 | 0.54 | 5PQI_B | 03(10) | 00(24) |
| 13 | P25440 | A9P | 4ALH_A | 173.21 | 3 | 4ALG | 415.44 | 0.52 | 5IBN_A | 00(29) | 00(27) |
| 14 | B9MKT4 | ADA | 4YZ0_B | 194.14 | 1 | 4EW9 | 352.25 | 0.36 | 3T9G_A | None | None |
| 15 | P00720 | ALE | 4LDO_A | 183.2 | 2 | 4QKX | 379.47 | 0.66 | 5NDD_A | 04(09) | None |
| 16 | Q7N561 | AMG | 5ODU_C | 194.18 | 2 | 5OFI | 614.62 | 0.21 | 5OFZ_B | 01(15) | 03(13) |
| 17 | P28720 | AQO | 1S39_A | 161.16 | 43 | 4FR1 | 545.68 | 0.80 | 4Q8M A | 08(02) | 00(22) |
| 18 | P08709 | AX7 | 5PAR_C | 133.15 | 4 | 5PAI | 501.5 | 1.10 | 1JBU_H | 00(28) | None |
| 19 | P00734 | BEN | 3P70_H | 120.15 | 6 | 4BAK | 470.61 | 0.43 | 2UUF_B | 01(16) | 00(22) |
| 20 | P9WIL5 | BZ3 | 3IMC_A | 147.17 | 2 | 3IUB | 345.37 | 0.43 | 3COV_B | 01(19) | 00(26) |
| 21 | P28482 | CAQ | 4ZXT_A | 110.11 | 1 | 3SA0 | 260.2 | 0.77 | 4S31_A | 00(21) | 02(13) |
| 22 | P47228 | CAQ | 1KND_A | 110.11 | 3 | 1LKD | 255.1 | 0.25 | 1HAN_A | 00(31) | 01(15) |
| 23 | P80188 | CAQ | 3FW4_C | 110.11 | 11 | 5KID | 746.76 | 0.94 | None | 00(22) | --- |
| 24 | Q3JRA0 | CYT | 3MBM_A | 111.1 | 4 | 3K2X | 353.11 | 0.27 | None | 10(03) | --- |
| 25 | Q63T71 | CYT | 3IKE_B | 111.1 | 2 | 3IEW | 483.16 | 0.48 | None | 03(12) | --- |
| 26 | P15555 | DAL | 1IKI_A | 89.09 | 1 | 1PW1 | 429.47 | 1.61 | None | 00(22) | --- |
| 27 | P56817 | EV0 | 3HVG_A | 153.18 | 1 | 3VV8 | 331.41 | 1.96 | 3TPJ_A | 00(24) | 00(21) |
| 28 | P00918 | EVJ | 4N0X_B | 163.22 | 3 | 1I8Z | 471.57 | 0.34 | 3KS3_A | 00(26) | 00(16) |
| 29 | P00918 | FB2 | 2WEJ_A | 157.19 | 43 | 3M96 | 460.75 | 0.90 | 3KS3_A | 00(23) | 00(16) |
| 30 | P68400 | GAB | 5CSV_A | 137.14 | 2 | 5MO8 | 479.95 | 0.56 | 5CVG_A | 01(19) | 07(04) |
| 31 | P54818 | GAL | 4CCE_A | 180.16 | 1 | 4CCC | 301.25 | 0.24 | None | 00(24) | --- |
| 32 | A0A083Z | GLA | 6EQ0_B | 180.16 | 4 | 6EQ1 | 666.58 | 0.22 | None | 00(21) | --- |
| 33 | P32890 | GLA | 1DJR_G | 180.16 | 5 | 1PZI | 556.56 | 0.24 | 1LTS D | 01(18) | 02(15) |
| 34 | P42592 | GLA | 3W7U_B | 180.16 | 1 | 3W7X | 342.3 | 0.73 | 3D3I_B | 00(18) | 01(17) |
| 35 | Q57193 | GLA | 5ELB_D | 180.16 | 4 | 1PZK | 621.75 | 0.24 | 5LZJ_B | 04(11) | 03(14) |
| 36 | Q9ALJ4 | GLA | 4FNU_B | 180.16 | 1 | 4FNT | 504.44 | 0.49 | 4FNQ_A | 00(17) | 01(13) |
| 37 | P39900 | HAE | 1OS2_D | 75.07 | 5 | 1JIZ | 393.46 | 1.77 | 2MLR_A | 00(17) | None |
| 38 | Q9H2K2 | JPZ | 4PNN_B | 146.15 | 36 | 5FPG | 477.51 | 0.26 | 4PNT_D | 01(16) | None |
| 39 | P24941 | LZ1 | 2VTA_A | 118.14 | 8 | 2R64 | 453.56 | 1.28 | 4EK3_A | 00(22) | 00(29) |
| 40 | P24941 | LZ5 | 2VTL_A | 187.2 | 3 | 2VTP | 360.29 | 0.55 | 4EK3_A | 00(25) | 00(29) |
| 41 | P24941 | LZM | 2VTM_A | 144.13 | 1 | 2VTS | 313.4 | 0.92 | 4EK3_A | 00(17) | 00(29) |
| 42 | P00918 | M3T | 4Q9Y_A | 124.2 | 6 | 3M96 | 460.75 | 1.86 | 3KS3_A | 02(15) | 00(16) |
| 43 | P39900 | M4S | 3LKA_A | 187.22 | 4 | 1JIZ | 393.46 | 0.79 | 2MLR_A | 00(17) | 03(09) |
| 44 | P09874 | MEW | 4GV7_B | 160.17 | 1 | 1UK0 | 377.45 | 0.32 | 4XHU_A | 05(09) | 02(13) |
| 45 | P29477 | MR1 | 2ORQ_A | 151.16 | 2 | 1DD7 | 479.49 | 1.74 | None | None | --- |
| 46 | P29477 | MSR | 2ORQ_A | 160.17 | 3 | 2ORS | 388.38 | 0.30 | None | 01(16) | --- |
| 47 | Q10588 | NCA | 1ISM_A | 122.12 | 1 | 1ISJ | 335.23 | 0.91 | 1ISF_B | 00(25) | 00(19) |
| 48 | Q05603 | NIO | 1L4N_A | 123.11 | 1 | 1L4L | 335.2 | 0.12 | None | 04(08) | --- |
| 49 | Q08638 | NOJ | 1OIM_A | 163.17 | 1 | 2WBG | 316.39 | 0.49 | 5OSS_A | 02(18) | 01(17) |
| 50 | Q4D3W2 | ORO | 2E6A_B | 156.1 | 6 | 3W2U | 396.24 | 0.49 | None | 01(16) | --- |
| 51 | P0ABQ4 | Q24 | 3QYO_A | 160.18 | 1 | 3KFY | 302.78 | 1.03 | 1RA9_A | 00(19) | 00(32) |
| 52 | P00918 | RCO | 4E49_A | 110.11 | 2 | 4FIK | 282.33 | 0.32 | 5DSR_A | 02(16) | None |
| 53 | P19491 | SHI | 1MS7_A | 172.14 | 2 | 1N0T | 322.25 | 0.53 | None | 04(11) | --- |
| 54 | P06820 | ST3 | 1IVE_A | 194.19 | 2 | 1INH | 252.25 | 0.96 | 4H53_D | 00(29) | None |
| 55 | Q6PL18 | TDR | 4QSU_A | 126.11 | 3 | 4QSW | 258.23 | 0.33 | 4QSQ_A | 01(21) | 00(23) |
| 56 | Q6TFC6 | TDR | 3FS8_B | 126.11 | 2 | 3FSB | 547.35 | 0.48 | None | None | --- |
| 57 | Q8K4Z3 | TDR | 3RO7_A | 126.11 | 2 | 3ROG | 322.21 | 0.85 | None | 00(22) | --- |
| 58 | P25440 | TVP | 4A9H_A | 189.25 | 1 | 4UYF | 434.92 | 0.19 | 5IBN_A | 00(24) | 00(27) |
| 59 | Q92793 | TYL | 4A9K_B | 151.16 | 1 | 5I83 | 296.36 | 2.16 | 5KTU_B | 00(26) | 00(25) |
| 60 | P07900 | XQ0 | 2YEC_A | 148.16 | 7 | 5ODX | 493.56 | 0.59 | 5J80_A | 00(28) | 00(22) |
| 61 | Q9WYE2 | ZWZ | 2ZWZ_A | 176.21 | 5 | 2ZX5 | 347.41 | 0.31 | 1HL8_B | 02(13) | 00(28) |
| 62 | P16083 | ZXZ | 3NHW_A | 173.21 | 2 | 3NHK | 263.29 | 0.94 | None | None | --- |
PDB ID and chain ID of the structure with bound fragment
Number of ligands binding to the protein and containing the fragment as substructure
PDB ID of the protein in complex with the largest ligand
Molecular weight of the largest ligand
Maximum RMSD between the fragment and the corresponding atoms as substructure in any of the ligands
PDB ID and chain ID of the unbound structure. “None” indicates that no unbound structure is available in the PDB.
Strongest hot spot with at least 50% coverage of the fragment binding site. Hot spots are numbered starting at 00 as established in the FTMap server. The number of probe clusters in given in parenthesis. “None” indicates that no such hot spot is found. ”---” shows that there is no unbound structure.
FTMap Analysis of the Acpharis Set.
We applied the FTMap program to the fragment-bound structures listed in column 4 of Table 1. The fragment and all water molecules were removed prior to the calculation. FTMap was able to detect the fragment binding pocket in nearly every case, as the vast majority of such pockets contained at least one significant consensus site (see Methods). A consensus site was considered to overlap with a fragment if any atom of any probe in the consensus site was located within 2 Å of any atom of the fragment. For each entry in the benchmark set, our analysis returned five lines of results, capturing the number and strength of the hot spots (consensus sites) identified by FTMap, the degree of overlap between each consensus site and the bound fragment, and the corresponding degree of hot spot overlap for the largest ligand that contains the fragment as a substructure.
Table 2 and Figure 3 show an example of these results for the protein human carbonic anhydrase II (Uniprot ID P00918, PDB structure 2HNC) binding to the fragment 5-amino-1,3,4-thiadiazole-2-sulfonamide (PDB ligand code 1SA), which is entry 4 in Table 1. In Table 2, line 1 lists the consensus sites identified by FTMap from strongest to weakest, denoted as 00 to 06 based on the convention we use in the FTMap server.19 The number in parenthesis indicates the number of probe clusters at each consensus site; thus, 00(25) means that the strongest consensus site 00 binds 25 probe clusters. We have described previously that a hot spot with at least 13 probe clusters indicates a site capable of binding drug sized molecules with millimolar or better affinity, whereas 16 or more probe clusters predict a druggable site with the potential of low micromolar or better binding.20 Thus, the consensus cluster 00(25) in 2HNC predicts a strong binding hot spot. The protein has two additional hot spots, 03(12) and 04(09), that interact with the fragment 1SA. Line 2 in Table 2, labeled as “frag_hs”, shows the percentage of the fragment that is covered by each hot spot. This overlap measure is defined as the number of atoms of the fragment that are within 2 Å of any atom of any probe in the consensus cluster, divided by the total number of fragment atoms, and multiplied by 100 to get the percent overlap.22 Thus, 00(25), shown in cyan in Figure 3a, covers 100% of the atoms in fragment 1SA, and the consensus clusters 03(12) and 04(09), shown in salmon and white, respectively, partially overlap with 1SA. We note that FTMap generates and clusters 2000 poses for each probe type, but in the figures we show only the probe pose at the center of the clusters that define each consensus site (see Methods). Thus, the probes overlap with the fragment better than shown in the figures, but including all probes would make the fragment entirely covered and not visible. Line 3, labeled “hs_frag”, indicates the inverse relationship, i.e., what percentage of each hot spot is occupied by the fragment. Accordingly, this measure is defined as the number of probe atoms in the consensus cluster that are within 2 Å of any fragment atom, divided by the number of probe atoms in the consensus cluster. These two overlap measures usually have similar values, but may differ if the hot spot is substantially smaller or larger than the fragment. As shown in Table 2, the percent coverage of the fragment 1SA by the top hot spot 00(25) and the percent coverage of the hot spot 00(25) by the fragment 1SA are 100% and 60%, respectively, as the hot spot is larger than the fragment, leaving 40% of the probe atoms >2Å distant from any atom of the fragment.
Table 2.
Detailed mapping results for the fragment-bound protein with UniProt ID P00918 bound by fragment 1SA (PDB ID 2HNC)
| Hot Spotsc |
||||||||
|---|---|---|---|---|---|---|---|---|
| PDB IDa | Overlapb | 0 | 1 | 2 | 3 | 4 | 5 | 6 |
| 2HNC_A | map | 00(25) | 01(16) | 02(12) | 03(12) | 04(09) | 05(08) | 06(04) |
| 2HNC_A | frag_hs | 100% | - | 10% | 70% | 30% | - | - |
| 2HNC_A | hs_frag | 60% | - | 1% | 97% | 10% | - | - |
| 2HNC_A | max_hs | 68% | - | 5% | 32% | 68% | - | 14% |
| 2HNC_A | max_lig | 68% | - | 1% | 97% | 88% | - | 26% |
PDB ID and chain ID of the fragment-bound protein that was mapped by FTMap.
Mapping results: map – hot spots ranking, with the number of probe clusters in parenthesis; frag-hs - percentage of the fragment covered by the hot spot; frag – percentage of hot spot covered by the fragment; max_hs - percent coverage of the largest ligand by the hot spot; max_lig - percent coverage of the hot spot by the largest ligand.
The 7 hot spots with the highest number of probe clusters.
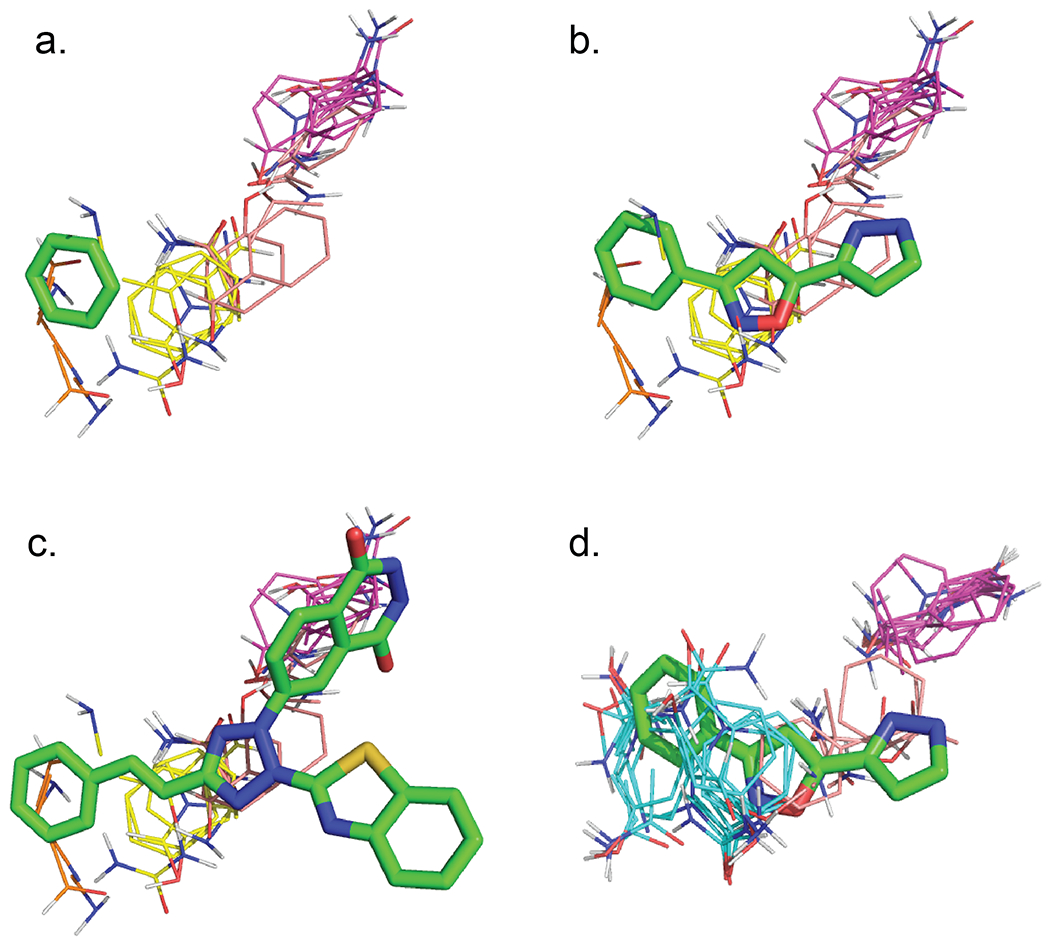
Figure 3.

Demonstration of fragment and ligand coverage by a hot spot in ligand-bound and unbound structures. (a) The fragment 1SA, bound to human carbonic anhydrase II (2HNC, chain A), is 100% encompassed by the strongest hot spot 00(25), shown in cyan. Other hot spots that interact with the fragment are 03(12) and 04(09), shown in salmon and white, respectively. The fragment covers 60% of the consensus cluster 00(25), and 97% of 03(12). (b) The hot spot 00(25) covers only 68% of the largest ligand ARZ that incorporates fragment 1SA as a substructure. However, the ligand also overlaps with the hot spot 06(04), shown in orange, that is far from the fragment. (c) Mapping the unbound structure of carbonic anhydrase II (3KS3, chain A) places the strongest hot spot, 00(16), in a similar location on the protein, but the shape and position of the hot spot are slightly altered so that now it covers only 70% of the pocket that corresponds to the fragment binding location. However, there is a new hot spot, 02(15), shown in yellow, which covers 90% of the fragment, copied into the unbound structure from the bound structure 2HNC. (d) The hot spot 00(16) covers only 36% of the largest ligand. However, the ligand also interact with the hot spot 06(08), shown in orange.
The last two lines in the data table describe the extent of the hot spot overlapping with the largest ligand that contains the fragment as a substructure. In the example shown in Table 2 we consider chain A of the liganded carbonic anhydrase protein structure 3MHC, which contains the largest ligand, (3S,5S,7S)-N-(5-sulfamoyl-1,3,4-thiadiazol-2-yl)tricyclo[3.3.1.1~3,7~]decane-1-carboxamide (PDB ligand ID ARZ), that includes 1SA as a substructure. Figure 3b shows this ligand copied into the fragment based structure. Line 4 in Table 2, labeled “max_hs”, measures the percent coverage of the largest ligand by each hot spot, calculated as the fraction of the ligand atoms within 2 Å of the probe atoms in the consensus cluster. As shown in Figure 3b, the hot spot 04(09), shown in white, and even 06(04), shown in orange, overlap with the ligand, with 68% and 14% coverage, respectively. Finally, line 5 in Table 2, labeled “max_lig”, shows the percent coverage of each hot spot by the ligand, which is at least as great as the coverage of the hot spot by the fragment, and sometimes greater. As shown in Table 2 and in Figure 3b, the ligand ARZ covers the 88% of the hot spot 04(09), whereas the fragment covers only 19% of this hot spot (Figure 3a). Mapping results for all 62 liganded structures of the Acpharis benchmark set are shown in Table S2.
Hot Spot Analysis of the Acpharis Benchmark Set Using Unbound Protein Structures.
The goal of hot spot analysis is to find ligand binding sites on proteins that in most cases have no known ligand, and hence a more realistic test of such methods requires a benchmark set of unbound protein structures. Table S3 shows all unbound structures for the proteins included in the Acpharis benchmark set. Unbound structures were found only for 44 proteins representing 48 of the protein/fragment pairs in the liganded benchmark set. Some of these proteins have many deposited unbound structures, and in such cases for the benchmark set we selected the structure with the highest resolution. If several structures had the same resolution, the one with the better coverage of the sequence was selected. The PDB IDs of structures in the resulting unbound benchmark set are shown in bold in Table S3. The fragment binding site in each unbound structure was determined by superimposing it on the fragment bound structure of the same protein shown in Table 1. Detailed results for the selected unbound structures are shown in Table S4, and as an example, the results for the unbound structure of human carbonic anhydrase II are shown in Table 3. Note that the mapping results for the fragment-bound structure of the same protein (Uniprot ID P00918) were shown in Table 2.
Table 3.
Detailed mapping results for the unbound protein with UniProt ID P00918 (PDB ID 3KS3)
| Hot Spotsc |
||||||||
|---|---|---|---|---|---|---|---|---|
| PDB IDa | Overlapb | 0 | 1 | 2 | 3 | 4 | 5 | 6 |
| 3KS3_A | map | 00(16) | 01(16) | 02(15) | 03(12) | 04(08) | 05(08) | 06(08) |
| 3KS3_A | frag_hs | 70% | - | 90% | 80% | 100% | - | - |
| 3KS3_A | hs_frag | 45% | - | 20% | 94% | 74% | - | - |
| 3KS3_A | max_hs | 36% | - | 36% | 36% | 50% | - | 50% |
| 3KS3_A | max_lig | 45% | - | 20% | 94% | 72% | - | 94% |
PDB ID and chain ID of the unbound protein that was mapped by FTMap.
Mapping results: map – hot spots ranking, with the number of probe clusters in parenthesis; frag-hs - percentage of the fragment covered by the hot spot; frag – percentage of hot spot covered by the fragment; max_hs - percent coverage of the largest ligand by the hot spot; max_lig - percent coverage of the hot spot by the largest ligand.
The 7 hot spots with the highest number of probe clusters.
As shown in Table 3, the strongest hot spot of the unbound protein with PDB ID 3KS3_A is 00(16), thus substantially weaker than the main hot spot 00(25) of the fragment-bound structure shown in Table 2, and this hot spot covers 70% of the location of the fragment 1SA (Figure 3c). Conversely, the fragment covers only 45% of this hot spot. The hot spot 02(15), shown in yellow, covers 90% of the fragment, copied into the unbound structure from the bound structure 2HNC. (d) The hot spot 00(16) covers only 36% of the largest ligand that incorporates the fragment 1SA as a substructure, but the ligand also interacts with the hot spot 06(08), shown in orange.
Analysis of the Astex Bound and Unbound Benchmark Sets.
We also used FTMap to assess the correspondence between binding energy hot spots and fragment binding sites for the proteins in the Astex set. Table S5 lists the ligand-bound PDB structures included in the Astex set by Verdonk and co-workers.14 Column 2 of the table lists the PDB ID and chain ID of the representative protein-fragment complex shown in Table 1 of the Rathi paper.14 FTMap was applied to these structures to identify the hot spots present in the bound structures, with detailed results presented in Table S6. We then looked for unbound structures in the PDB. Unbound structures were found for 39 of the 52 proteins from the original Astex set, most of which have many such structures deposited (Table S7), similarly to the Acpharis set. In Table S8 we show results for the unbound structures with the highest resolution, shown in bold in Table S7.
Comparing the Astex and Acpharis sets.
While the four coverage measures for carbonic anhydrase II in Tables 2 and 3 and for all proteins of the two benchmark sets in tables S2,S4, S6, and S8 show details of the overlap of each hot spot with the fragment as well as with the largest ligand, for the overall comparison of the benchmark sets we introduced a few simpler measures. The goal of the benchmark sets is to test hot spot identification methods, and thus we primarily want to know whether any of the strong hot spots overlaps with the fragment binding site. To assess this feature, we arbitrarily selected two thresholds, 50% and 80%, as the extent to which a hot spot must cover a fragment to count as a positive identification of the fragment binding site. The last two columns in Table 1 list, for each protein-fragment combination in the Acpharis benchmark set, the strongest hot spot that has ≥50% coverage of the fragment, as well as the number of probe clusters in the hot spot. As previously shown, a hot spot with 13 or more probe clusters predicts a site capable of ligand binding, whereas a hot spot with 16 or more cluster is predicted to be druggable 20. Therefore in Table 4 we list percentages of proteins that have hot spots with 13 or more probe clusters and at least 50% or 80% coverage, as well as the percentage of proteins in which a hot spot with 16 or more probe clusters covers at least 50% of the fragment binding site. We first show the percentage of proteins that have any hot spot with these properties, and then the percentage of proteins in which the strongest hot spot 00 satisfies these conditions.
Table 4.
Percentages of proteins that have any hot spots or the top hot spot with 13+ or 16+ probe clusters and at least 50% or 80% coverage of the fragment binding site in the Acpharis and Astex benchmark sets. Overall probe density is also shown.
| Benchmark Set | Type | N | Any hot spot,% | Top hot spot,% | Average Number of probes | Probe density | ||||
|---|---|---|---|---|---|---|---|---|---|---|
| 13+50% | 13+80% | 16+50% | 13+50% | 13+80% | 16+50% | |||||
| Acpharis | Bound | 62 | 77.4 | 69.3 | 70.9 | 56.5 | 50.0 | 56.5 | 31.1 | 0.055 |
| Unbound | 48 | 77.1 | 62.5 | 62.5 | 56.3 | 43.7 | 56.3 | 34.2 | 0.059 | |
| Astex | Bound | 52 | 78.8 | 69.2 | 62.5 | 42.3 | 36.5 | 40.4 | 27.3 | 0.062 |
| Unbound | 39 | 74.3 | 66.6 | 66.6 | 53.8 | 48.7 | 53.8 | 24.0 | 0.057 | |
Considering any hot spot and either 50% or 80% coverage with 13+ probe clusters, FTMap finds the fragment binding sites in essentially the same fraction of proteins in the Acpharis and the Astex sets. When restricting consideration to hot spots with 16+ probe clusters, the fraction of correct sites is somewhat higher for the fragment-bound structures in the Acpharis set that in the Astex set. We also note that in almost all cases the success rates are higher for the bound structures than for the unbound structures. This is in agreement with the observation that it is generally easier to dock back a ligand into the bound structure than into an unbound structure.40–42 However, according to Table 4, considering any hot spot the differences between bound and unbound structures are fairly small, in agreement with the similar recent observation concerning the identification of ligand binding sites.43
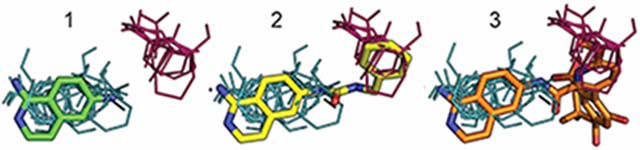
Restricting consideration to the top hot spot 00 always reduces the success rate as expected, and creates a noticeable difference between the two benchmark sets. In the Acpharis set FTMap finds the fragment binding sites in more fragment-bound structures than in their unliganded pairs. In contrast, in the Astex set the success rates are substantially higher for the unbound than for the bound structures. The explanation is that the latter structures have been co-crystallized with larger ligands rather than with fragments as in the Acpharis bound set. The binding of such ligands is likely to open up regions of the site farther away from the fragment binding pocket, which is considered the hot or the warm hot spot. As an example, in the very first protein of the Astex set (PDB ID 4PFJ), the hot spot is considered to overlap with an adenine fragment. The protein structure 4PFJ given by Rathi et al.14 is an adenosylhomocysteinase which binds an adenosine molecule. As shown in the first row of Table S6, the top hot spot 00(19), shown in cyan in Figure 4a, overlaps only with 18% of the fragment, whereas the second hot spot, 01(13), shown in purple, has 100% overlap. However, 4PFJ binds an adenosine molecule rather than only the adenine fragment, and considering the entire ligand reveals that the strongest hot spot 00(19) actually finds the sugar binding rather than the adenine binding pocket (Figure 4b).
Figure 4.

Mapping of 4PFJ, the first protein in the Astex set. The adenine fragment is shown as green sticks. (a). The second hot spot, 01(13), shown in purple, overlaps with the fragment, but the top hot spot, 00(19), shown in cyan, does not. (b) The top hot spot 00(19) is at the location binding the sugar moiety of the adenosine ligand co-crystallized with the protein in 4PFJ.
As another example we consider the mapping of the third protein in the Astex set, prostaglandin D2 synthase (PDB ID 2VCQ), because it has a ligand-free structure (PDB ID 3EE2). Table 5 shows the FTMap results extracted from tables S6 and S8. Based on Rathi et al.,14 the fragment binding at the hot spot of 2VCQ is a benzene molecule.14 However, mapping 2VCQ places only the very week hot spot 06(06), shown in orange, at the benzene binding site, and another week hot spot, 02(11), partially overlapping with the site (Figure 5a). 2VCQ is the structure of the prostaglandin D2 synthase co-crystallized with 3-phenyl-5-(1H-pyrazol-3-yl)isoxazole, and considering the ligand shows that 02(11), shown in yellow, actually overlaps with the isoxazole moiety (Figure 5b). A stronger hot spot, 01(13), shown in purple, is further away. The top hot spot, 00(15), is an entirely different pocket, and is not shown in Figures 5a–5c. We note that prostaglandin D2 synthase also binds a larger inhibitor, 3-(1,3-benzothiazol-2-yl)-2-(1,4-dioxo-1,2,3,4-tetrahydrophthalazin-6-yl)-5-[(e)-2-phenylvinyl]-3h-tetraazol-2-ium (PDB ID 1V40), and the hot spot 01(13) overlaps with this ligand (Figure 5c). While mapping the ligand-bound structure yields four relatively weak hot spots (see Table 5), mapping the unliganded prostaglandin D2 synthase (PDB ID 3EE2) finds only one very strong hot spot 00(33). Since the latter overlaps with the benzene moiety, it confirms that the benzene binding pocket is indeed the most important hot spot. However, this result was obtained only when mapping a ligand-free structure, demonstrating that such structures provide a better benchmark set fort testing hot spot identification methods. We consider it important that we have added unliganded structures for proteins in both the Acpharis and Astex sets. As shown in Table 4, the unbound structures for the two sets exhibit similar properties, both when considering any hot spot or only the strongest one. The 2VCQ example demonstrates that mapping ligand-bound structures may provide information how ligand binding affects the arrangement of hot spots, but the location of the strongest hot spot may be lost.
Table 5.
Detailed mapping results for the third protein (PDB ID 2VCQ, chain B) in the Astex set, and for the corresponding unbound structure (PDB ID 3EE2, chain B) in the unbound Astex set.
| Hot Spotsc |
||||||||
|---|---|---|---|---|---|---|---|---|
| PDB IDa | Overlapb | 0 | 1 | 2 | 3 | 4 | 5 | 6 |
| 2VCQ_B | map | 00(15) | 01(13) | 02(11) | 03(10) | 04(08) | 05(07) | 06(06) |
| 2VCQ_B | frag_hs | - | - | 67% | 17% | - | - | 100% |
| 2VCQ_B | hs_frag | - | - | 35% | 2% | - | - | 57% |
| 2VCQ_B | max_hs | - | 9% | 29% | 41% | - | - | 21% |
| 2VCQ_B | max_lig | - | 6% | 80% | 55% | - | - | 67% |
| 3EE2_B | map | 00(33) | 01(20) | 02(19) | 03(11) | 04(04) | 05(03) | 06(02) |
| 3EE2_B | frag_hs | 100% | - | - | - | - | - | - |
| 3EE2_B | hs_frag | 61% | - | - | - | - | - | - |
| 3EE2_B | max_hs | 35% | 9% | - | 21% | - | - | - |
| 3EE2_B | max_lig | 82% | 5% | - | 46% | - | - | - |
PDB ID and chain ID of the ligand-bound and unbound proteins mapped by FTMap.
Mapping results: map – hot spots ranking, with the number of probe clusters in parenthesis; frag-hs - percentage of the fragment covered by the hot spot; frag – percentage of hot spot covered by the fragment; max_hs - percent coverage of the largest ligand by the hot spot; max_lig - percent coverage of the hot spot by the largest ligand.
The 7 hot spots with the highest number of probe clusters.
Figure 5.
Mapping the third protein, prostaglandin D2 synthase, of the Astex set. The fragment is a benzene, shown as green sticks. (a) Mapping the ligand-bound structure 2VCQ in the benchmark set. The only hot spot overlapping with the benzene fragment is 06(06), shown in orange. (b) The hot spot 02(11), shown in yellow, overlaps with the isoxazole moiety of the ligand. (c) The second strongest hot spot, 01(13), from mapping 2VCQ and shown in purple, overlaps with a larger inhibitor in the structure 1V40. (d) Mapping the ligand-free structure yields the single hot spot 00(33), which 100% covers the fragment binding site.
As shown in Table 4, the differences between the proteins in the Acpharis and Astex sets are moderate if we consider the overlap of the fragment with any hot spot. Thus, the conformational changes due to ligand binding tend to affect only the location of the strongest hot spot, rather than the overall coverage of the fragment binding site. To confirm this observation, in Table 4 we show the total number of probe clusters at the fragment binding site, averaged over the proteins in each set. Table 4 also includes probe densities, obtained by dividing the average number of probe clusters in the fragment binding site by the volume of the site. Although the proteins in the Acpharis set tend to bind more probe clusters than the ones in the Astex set, the volumes of fragment binding pockets are also larger (see Table 6), and the average probe density is actually the highest in the original (ligand-bound) Astex set. Thus, many probes still cluster at the fragment binding site, but in some of the ligand-bound structures FTMap finds even stronger hot spots in other regions of the ligand binding site.
Table 6.
Pocket volumes in the benchmark sets, Å3
| Set | Unbound | Bound | ||
|---|---|---|---|---|
| Mean | STDEV | Mean | STD | |
| Astex | 428.34 | 140.83 | 433.02 | 150.77 |
| Acpharis | 577.48 | 161.46 | 566.76 | 208.43 |
| Ichihara | 660.64 | 229.77 | 599.50 | 152.17 |
| FBLD | 637.10 | 256.85 | 618.50 | 212.52 |
As shown in Table 6, the average volumes of the fragment binding pockets are larger in the Acpharis set than in the Astex set, and the differences are significant for both bound and unbound structures ( p < 0.01). The distribution of volumes is shifted to larger values for the unbound Acpharis proteins (Figure 6a), and while the two distributions become more similar for the bound structures, the distribution is wider for the Acpharis set (Figure 6b). This partly occurs due to differences in the average fragment size, 120 g/mol and 154 g/mol in the Astex and Acpharis sets, respectively. Since we calculate pocket volumes using the dpocket algorithm,44, 45 which defines the pocket by the atoms within 4Å of the fragment, larger fragments by definition result in larger pockets, even for unliganded structures. However, the difference in pocket volumes does not affect the FTMap success rates when considering the unbound structures (Table 4). In Table 6 we also show fragment pocket volumes for the drug target-fragment pairs collected by Ichihara et al.46 from FBLD campaigns. The same pairs were also studied by Radoux et al.,29 who added an unliganded structure to each protein. The fragments in the Ichihara set have the average molecular weight of 182.14 g/mol, thus are even larger than the fragments in the Acpharis set. Since the Ichihara set includes only 21 protein-fragment pairs, we added 53 fragment-bound structures, listed in Table S9, also from papers describing FBLD experiments, and identified a total of 3144 unbound structures for the 53 proteins. The average pocket volumes for both bound and unbound structures are comparable to the volumes seen for the Acpharis and Ichihara sets (Table 6), thus the FBLD screens also use larger fragments than the fragments selected by Rathi et al.14 The smaller hot spots identified for the Astex set suggest that it could be possible to use smaller fragment for FBLD screens. In fact, Astex reported good results using ultra-low-molecular-weight ligands called “minifrags” to guide drug design.47
Figure 6.

Distributions of pocket volumes and success rates of identifying hydrogen bonding residues in Astex and Acpharis benchmark sets. (a) Volumes of fragment binding pockets in the ligand-free protein structures. (b) Volumes of fragment binding pockets in the fragment-bound (Acpharis set) and ligand-bound (Astex set) protein structures. (c) F scores of predicting hydrogen bonding residues in the fragment binding pockets of unbound protein structures. (d) F scores of predicting hydrogen bonding residues in the fragment binding pockets of bound protein structures.
So far we focused only on the question how well the location of hot spots can be identified. However, several studies emphasize that the hot spots intersperse hydrophobic patches with hydrogen bonding residues.19, 28, 46 The FTMap server also provides information on hydrogen bonds between the probe molecules and protein residues.19 We extracted this information for the residues in the fragment binding pockets and compared the results to the hydrogen bonds seen in X-ray structures. To obtain the “true” hydrogen bonding residues we collected all ligands binding to each protein and identified all residues in the pocket that formed a hydrogen bond with any ligand. To describe the quality of predictions we calculated several measures, namely true positives, true negatives, false positives, false negatives, precision, recall, F scores, and Matthew correlation coefficient (MCC). Detailed results are provided in tables S10 and S11. As shown in Figures 6c and 6d, the F1 values are very similar for all sets. The average F scores for unbound and bound structures are 0.78 and 0.77 for the Astex set, and 0.80 and 0.82 for the Acpharis set, demonstrating fairly high success rates for all four sets.
CONCLUSIONS
We have selected 62 proteins to form a benchmark set, referred here as the Acpharis set, for testing hot spot identification methods. Each protein has multiple structures in the PDB. The first structure binds a fragment-size ligand, which is extended into larger ligands in other structures. For comparison we also discussed the properties of a set of protein, we call here the Astex set, that was constructed for the validation of hot and warm spots for fragment binding. Unbound protein structures were selected for the proteins in both the Acpharis and Astex sets. All four sets (Acpharis bound and unbound, and Astex bound and unbound) were tested using the FTMap server. FTMap is a computational analogue of the protein soaking experiments Indeed, it was shown for many proteins that the FTMap results agree well with the results of the experimental method by Ringe et al.3,4 called MSCS (Multiple Solvent Crystal Structures) that lead to the classical definition of hot spots.
We first considered the coverage of the fragment binding sites by any of the hot spots identified by FTMap, and found the Acpharis and Astex sets to be fairly similar, in spite of the very different methods of construction. Thus, our results confirm the assumption by Verdonk and co-workers that a fragment moiety that occurs in multiple ligands at the same position in a protein predicts a binding hot spot. Next we explored whether the strongest hot spot provided by FTMap finds the fragment binding site. The success rates fell to around 50%, and the results were similar for the ligand-free versions of the Acpharis and Astex sets, and also for the fragment-bound proteins of the Acpharis set. However, in many ligand-bound structures of the original Astex set, FTMap does not place the strongest hot spot in the pocket that accommodates the selected fragment moiety and is considered the hot or the warm hot spot by Rathi et al.14 The most likely explanation is that since the structures in the Astex set have been co-crystallized with larger ligands rather than with fragments, the binding of the ligand opens up regions of the site away from the fragment binding pocket, creating additional hot spots. Thus, while the moiety common to multiple ligands really identifies a hot spot in the proteins of the Astex set, finding such hot spots is a challenge for FTMap or similar methods that are based on fragment binding. However, this problem is eliminated when considering the sets of ligand-free proteins we have developed here for both the Acpharis and Astex sets. FTMap places the strongest hot spot at the fragment binding site only in about 50% of the proteins in any of the two benchmarks, and hence it is likely that better performing computational methods can be developed. Motivating the development of such methods has been the primary goal of this paper.
EXPERIMENTAL SECTION
Characterization of Hot Spots by FTMap.
FTMap identifies binding hot spots on the surface of a protein by finding the most favorable regions for 16 small molecular probes of various shapes and polarities.19 Given a protein structure, for each probe the algorithm places the tens of thousands of copies all over the surface on the basis of dense rotational and translational grids, retains the most favorable probe positions by energy and refines their orientations, then clusters the probe molecules by location and ranks them by their average energy. The lowest energy probe clusters of each probe type are retained, and clustering is performed once more on clusters of all probe types to form the consensus sites, which are ranked by their population of probe clusters. Consensus sites identify the locations of binding hot spots on the protein surface, and their rank corresponds to the relative strength and importance of the associated hot spot. In particular, we have shown that a consensus site containing at least 16 probe clusters has the capacity to bind appropriately selected ligands with low micromolar or higher affinity, whereas at least 13 probe clusters are required even for high micromolar or millimolar binding.
Calculation of Overlap Percentages.
The percent spatial overlap of the fragment binding site by a hot spot was defined as OF = 100%*(NF/NFT), where NFT denotes the total number of atoms of the fragment, and NF is the number of such fragment atoms that are within 2 Å from any atom of any probe in the hot spot. Conversely, the percent spatial overlap of a hot spot by a fragment was defined as OHS = 100%*(NHS/NHST), where NHST denotes the total number of \ atoms of all probes in the hot spot, and NHS is the number of such atoms that are within 2 Å from any atom of the fragment. Similar definitions were used to measure the spatial overlap of the ligand binding site by a hot spot, and the spatial overlap of the hot spot by the ligand.
Calculation of Pocket Volumes.
We have used the dpocket option of the Fpocket program for determining the volumes of fragment binding pockets.45, 48 Fpocket is based on the concept of alpha spheres. Each alpha sphere is a sphere that contacts four atoms on its boundary and contains no internal atom. For a protein, very small spheres are located within the protein, large spheres at the exterior, and clefts and cavities correspond to spheres of intermediate radii. The ensemble of alpha spheres defined from the atoms of a protein were filtered using the default minimal and maximal radii values in Fpocket. Once the alpha spheres are selected, to calculate pocket volume the dpocket algorithm defines a box containing all atoms and vertices situated within 4Å of the fragment, which is the default value. The pocket volume is calculated using a Monte Carlo algorithm. The algorithm picks a random point in the space within the box, check if it is included in any alpha sphere, and store this status. This is repeated N=2500 times, and the volume of the pocket is estimated as the number of hits divided by 2500, scaled by the size of the box. For calculating pocket volumes in an unbound structure the structure is superimposed on the bound structure co-crystallized with the fragment in order to determine the position of the fragment binding pocket.
Identification of hydrogen bonding residues.
We selected the residues of fragment binding pocket using the distance threshold of 4Å between any protein atom and any atom of the bound fragment. In the unbound structures the residues were selected after copying the fragment from the bound structure. For each protein in the benchmark sets we determined the hydrogen bonding residue in all ligand bound structures of the protein with at least 95% of sequence identity using the HBPLUs program.49 Binding site residues that formed a hydrogen bound in any of these structures were considered the “true” hydrogen bonding residues. The FTMap server determines the hydrogen bonds between all atoms of the probes and the individual protein residues also using the HBPLUS program,49 and we selected the fragment binding residues among the hydrogen bonding residues provided by the server as the predictions. To describe the quality of predicting the hydrogen bonding residues in the fragment binding site we counted the numbers of true positives (TP), true negatives (TN), false positives (FP), and false negatives (FN). These values are shown in Tables S10, S11, S12, and S13 for the bound and unbound Acpharis and the bound and unbound Astex sets. According to these tables, the number of residues that form hydrogen bonds with some ligand varies between 5 and 23. We also calculate the precision P = TP/(TP+FP), recall R = TP/(TP+FN), the F score defined by the expression F = 2 PxR/(P+R), and the Matthew ‘s correlation coefficient defined by the formula MCC = [(TPxTN) – (FPxFN)] / [(TP+FP)x(TP+FN)x(TN+FP)x(TN+FN)]1/2. These values are also shown in Tables S1 through S13. We note that TN+FN = 0, which happens for a number of proteins, implies that the denominator is 0 in the expression of MCC. Therefore we use the F scores as the overall measure of prediction quality, and show their distributions in Figures 6c and 6d.
Supplementary Material
Table S1. All bound structures for the Acpharis benchmark set by PDB ID/chain
Table S2. FTMap results for the Acpharis benchmark set of bound structures
Table S3. All unbound structures for the Acpharis benchmark set by PDB ID/chain
Table S4. FTMap results for the Acpharis benchmark set of unbound structures
Table S5. All bound structures for the Astex benchmark set by PDB ID/chain
Table S6. FTMap results for the Astex benchmark set of bound structures
Table S7. All unbound structures for the Astex set by PDB ID/chain
Table S8. FTMap results for the Astex benchmark set of unbound structures
Table S9. PDB IDs and fragment binding pocket volumes of proteins selected from the FBLD literature
Table S10. Quality measures of predicting hydrogen bonding residues in the fragment binding pocket in the bound proteins of the Acpharis set
Table S11. Quality measures of predicting hydrogen bonding residues in the fragment binding pocket in the unbound proteins of the Acpharis set
Table S12. Quality measures of predicting hydrogen bonding residues in the fragment binding pocket in the bound proteins of the Astex set
Table S13. Quality measures of predicting hydrogen bonding residues in the fragment binding pocket in the unbound proteins of the Astex set
Data S1. Supporting Information for Publication: Excel file of PDB IDs of proteins in bound and unbound Acpharis and Astex benchmark sets
ACKNOWLEDGEMENTS
This investigation was supported by grant R35-GM118078 from the National Institute of General Medical Sciences.
ABBREVIATIONS USED
- PDB
Protein Data Bank
- MSCS
multiple copy crystal structure
- SAR
structure activity relationship
- RMSD
root mean square deviation
Footnotes
Conflict of Interest Disclosure:
Acpharis Inc. offers commercial licenses to ATLAS, a software product in function similar to FTMap. Dima Kozakov and Sandor Vajda owns stock in the company. However, the FTMap program and the use of the FTMap server are free for academic and governmental use.
REFERENCES
- (1).Clackson T; Wells JA, A hot spot of binding energy in a hormone-receptor interface. Science 1995, 267, 383–386. [DOI] [PubMed] [Google Scholar]
- (2).Thanos CD; Randal M; Wells JA, Potent small-molecule binding to a dynamic hot spot on IL-2. Journal of the American Chemical Society 2003, 125, 15280–15281. [DOI] [PubMed] [Google Scholar]
- (3).Allen KN; Bellamacina CR; Ding XC; Jeffery CJ; Mattos C; Petsko GA; Ringe D, An experimental approach to mapping the binding surfaces of crystalline proteins. J. Phys. Chem 1996, 100, 2605–2611. [Google Scholar]
- (4).Mattos C; Ringe D, Locating and characterizing binding sites on proteins. Nat. Biotechnol 1996, 14, 595–599. [DOI] [PubMed] [Google Scholar]
- (5).English AC; Groom CR; Hubbard RE, Experimental and computational mapping of the binding surface of a crystalline protein. Protein Eng. 2001, 14, 47–59. [DOI] [PubMed] [Google Scholar]
- (6).English AC; Done SH; Caves LS; Groom CR; Hubbard RE, Locating interaction sites on proteins: the crystal structure of thermolysin soaked in 2% to 100% isopropanol. Proteins 1999, 37, 628–640. [PubMed] [Google Scholar]
- (7).Hajduk PJ; Meadows RP; Fesik SW, NMR-based screening in drug discovery. Q. Rev. Biophys 1999, 32, 211–240. [DOI] [PubMed] [Google Scholar]
- (8).Hajduk PJ; Huth JR; Fesik SW, Druggability indices for protein targets derived from NMR-based screening data. J. Med. Chem 2005, 48, 2518–2525. [DOI] [PubMed] [Google Scholar]
- (9).Erlanson DA; McDowell RS; O’Brien T, Fragment-based drug discovery. J. Med. Chem 2004, 47, 3463–3482. [DOI] [PubMed] [Google Scholar]
- (10).Rees DC; Congreve M; Murray CW; Carr R, Fragment-based lead discovery. Nature reviews. Drug discovery 2004, 3, 660–672. [DOI] [PubMed] [Google Scholar]
- (11).Murray CW; Verdonk ML; Rees DC, Experiences in fragment-based drug discovery. Trends Pharmacol. Sci 2012, 33, 224–232. [DOI] [PubMed] [Google Scholar]
- (12).Hubbard RE; Murray JB, Experiences in fragment-based lead discovery. Methods in enzymology 2011, 493, 509–531. [DOI] [PubMed] [Google Scholar]
- (13).Baker M, Fragment-based lead discovery grows up. Nature reviews. Drug discovery 2012, 12, 5–7. [DOI] [PubMed] [Google Scholar]
- (14).Rathi PC; Ludlow RF; Hall RJ; Murray CW; Mortenson PN; Verdonk ML, Predicting “Hot” and “Warm” Spots for Fragment Binding. J Med Chem 2017, 60, 4036–4046. [DOI] [PubMed] [Google Scholar]
- (15).Lamoree B; Hubbard RE, Current perspectives in fragment-based lead discovery (FBLD). Essays Biochem. 2017, 61, 453–464. [DOI] [PMC free article] [PubMed] [Google Scholar]
- (16).Harner MJ; Frank AO; Fesik SW, Fragment-based drug discovery using NMR spectroscopy. J Biomol NMR 2013, 56, 65–75. [DOI] [PMC free article] [PubMed] [Google Scholar]
- (17).Goodford PJ, A computational procedure for determining energetically favorable binding sites on biologically important macromolecules. J. Med. Chem 1985, 28, 849–857. [DOI] [PubMed] [Google Scholar]
- (18).Miranker A; Karplus M, Functionality Maps of Binding-Sites - a Multiple Copy Simultaneous Search Method. Proteins-Structure Function and Genetics 1991, 11, 29–34. [DOI] [PubMed] [Google Scholar]
- (19).Kozakov D; Grove LE; Hall DR; Bohnuud T; Mottarella SE; Luo L; Xia B; Beglov D; Vajda S, The FTMap family of web servers for determining and characterizing ligand-binding hot spots of proteins. Nat. Protoc 2015, 10, 733–755. [DOI] [PMC free article] [PubMed] [Google Scholar]
- (20).Kozakov D; Hall DR; Napoleon RL; Yueh C; Whitty A; Vajda S, New Frontiers in Druggability. J. Med. Chem 2015, 58, 9063–9088. [DOI] [PMC free article] [PubMed] [Google Scholar]
- (21).Golden MS; Cote SM; Sayeg M; Zerbe BS; Villar EA; Beglov D; Sazinsky SL; Georgiadis RM; Vajda S; Kozakov D; Whitty A, Comprehensive experimental and computational analysis of binding energy hot spots at the NF-kappaB essential modulator/IKKbeta protein-protein interface. J. Am. Chem. Soc 2013, 135, 6242–6256. [DOI] [PMC free article] [PubMed] [Google Scholar]
- (22).Kozakov D; Hall DR; Jehle S; Luo L; Ochiana SO; Jones EV; Pollastri M; Allen KN; Whitty A; Vajda S, Ligand deconstruction: Why some fragment binding positions are conserved and others are not. Proc. Natl. Acad. Sci. U. S. A 2015, 112, E2585–2594. [DOI] [PMC free article] [PubMed] [Google Scholar]
- (23).Yu W; Lakkaraju SK; Raman EP; Mackerell AD Jr., Site-Identification by Ligand Competitive Saturation (SILCS) assisted pharmacophore modeling. J. Comput. Aided Mol. Des 2014. [DOI] [PMC free article] [PubMed] [Google Scholar]
- (24).Raman EP; Yu W; Lakkaraju SK; MacKerell AD Jr., Inclusion of multiple fragment types in the site identification by ligand competitive saturation (SILCS) approach. J. Chem. Inf. Model 2013, 53, 3384–3398. [DOI] [PMC free article] [PubMed] [Google Scholar]
- (25).Lexa KW; Carlson HA, Improving Protocols for Protein Mapping through Proper Comparison to Crystallography Data. Journal of chemical information and modeling 2013, 53, 391–402. [DOI] [PMC free article] [PubMed] [Google Scholar]
- (26).Bakan A; Nevins N; Lakdawala AS; Bahar I, Druggability Assessment of Allosteric Proteins by Dynamics Simulations in the Presence of Probe Molecules. Journal of Chemical Theory and Computation 2012, 8, 2435–2447. [DOI] [PMC free article] [PubMed] [Google Scholar]
- (27).Kimura SR; Hu HP; Ruvinsky AM; Sherman W; Favia AD, Deciphering Cryptic Binding Sites on Proteins by Mixed-Solvent Molecular Dynamics. J Chem Inf Model 2017, 57, 1388–1401. [DOI] [PubMed] [Google Scholar]
- (28).Curran PR; Radoux CJ; Smilova MD; Sykes RA; Higueruelo AP; Bradley AR; Marsden BD; Spring DR; Blundell TL; Leach AR; Pitt WR; Cole JC, Hotspots API: A Python Package for the Detection of Small Molecule Binding Hotspots and Application to Structure-Based Drug Design. J. Chem. Inf. Model 2020, 60, 1911–1916. [DOI] [PubMed] [Google Scholar]
- (29).Radoux CJ; Olsson TS; Pitt WR; Groom CR; Blundell TL, Identifying Interactions that Determine Fragment Binding at Protein Hotspots. J. Med. Chem 2016, 59, 4314–4325. [DOI] [PubMed] [Google Scholar]
- (30).Liu X; Peng L; Zhou Y; Zhang Y; Zhang JZH, Computational Alanine Scanning with Interaction Entropy for Protein-Ligand Binding Free Energies. J. Chem. Theory Comput 2018, 14, 1772–1780. [DOI] [PubMed] [Google Scholar]
- (31).Arcon JP; Defelipe LA; Lopez ED; Burastero O; Modenutti CP; Barril X; Marti MA; Turjanski AG, Cosolvent-Based Protein Pharmacophore for Ligand Enrichment in Virtual Screening. J. Chem. Inf. Model 2019, 59, 3572–3583. [DOI] [PubMed] [Google Scholar]
- (32).Vreven T; Moal IH; Vangone A; Pierce BG; Kastritis PL; Torchala M; Chaleil R; Jimenez-Garcia B; Bates PA; Fernandez-Recio J; Bonvin AM; Weng Z, Updates to the Integrated Protein-Protein Interaction Benchmarks: Docking Benchmark Version 5 and Affinity Benchmark Version 2. J. Mol. Biol 2015, 427, 3031–3041. [DOI] [PMC free article] [PubMed] [Google Scholar]
- (33).Hartshorn MJ; Verdonk ML; Chessari G; Brewerton SC; Mooij WTM; Mortenson PN; Murray CW, Diverse, high-quality test set for the validation of protein-ligand docking performance. J. Med. Chem 2007, 50, 726–741. [DOI] [PubMed] [Google Scholar]
- (34).Verdonk ML; Mortenson PN; Hall RJ; Hartshorn MJ; Murray CW, Protein-ligand docking against non-native protein conformers. J. Chem. Inf. Model 2008, 48, 2214–2225. [DOI] [PubMed] [Google Scholar]
- (35).Berman HM; Westbrook J; Feng Z; Gilliland G; Bhat TN; Weissig H; Shindyalov IN; Bourne PE, The Protein Data Bank. Nucleic Acids Res. 2000, 28, 235–242. [DOI] [PMC free article] [PubMed] [Google Scholar]
- (36).Drwal MN; Bret G; Perez C; Jacquemard C; Desaphy J; Kellenberger E, Structural Insights on Fragment Binding Mode Conservation. J Med Chem 2018, 61, 5963–5973. [DOI] [PubMed] [Google Scholar]
- (37).Brenke R; Kozakov D; Chuang GY; Beglov D; Hall D; Landon MR; Mattos C; Vajda S, Fragment-based identification of druggable ‘hot spots’ of proteins using Fourier domain correlation techniques. Bioinformatics 2009, 25, 621–627. [DOI] [PMC free article] [PubMed] [Google Scholar]
- (38).Buhrman G; O’Connor C; Zerbe B; Kearney BM; Napoleon R; Kovrigina EA; Vajda S; Kozakov D; Kovrigin EL; Mattos C, Analysis of binding site hot spots on the surface of Ras GTPase. J. Mol. Biol 2011, 413, 773–789. [DOI] [PMC free article] [PubMed] [Google Scholar]
- (39).Kozakov D; Chuang GY; Beglov D; Vajda S, Where does amantadine bind to the influenza virus M2 proton channel? Trends Biochem. Sci 2010, 35, 471–475. [DOI] [PMC free article] [PubMed] [Google Scholar]
- (40).Lexa KW; Carlson HA, Protein flexibility in docking and surface mapping. Q. Rev. Biophys 2012, 45, 301–343. [DOI] [PMC free article] [PubMed] [Google Scholar]
- (41).Wei BQ; Weaver LH; Ferrari AM; Matthews BW; Shoichet BK, Testing a flexible-receptor docking algorithm in a model binding site. J. Mol. Biol 2004, 337, 1161–1182. [DOI] [PubMed] [Google Scholar]
- (42).Lorber DM; Shoichet BK, Flexible ligand docking using conformational ensembles. Protein Sci. 1998, 7, 938–950. [DOI] [PMC free article] [PubMed] [Google Scholar]
- (43).Clark JJ; Orban ZJ; Carlson HA, Predicting binding sites from unbound versus bound protein structures. Sci. Rep 2020, 10, 15856. [DOI] [PMC free article] [PubMed] [Google Scholar]
- (44).Schmidtke P; Barril X, Understanding and Predicting Druggability. A High-Throughput Method for Detection of Drug Binding Sites. J. Med. Chem 2010, 53, 5858–5867. [DOI] [PubMed] [Google Scholar]
- (45).Schmidtke P; Le Guilloux V; Maupetit J; Tuffery P, fpocket: online tools for protein ensemble pocket detection and tracking. Nucleic Acids Res 2010, 38, W582–589. [DOI] [PMC free article] [PubMed] [Google Scholar]
- (46).Ichihara O; Shimada Y; Yoshidome D, The importance of hydration thermodynamics in fragment-to-lead optimization. ChemMedChem 2014, 9, 2708–2717. [DOI] [PubMed] [Google Scholar]
- (47).O’Reilly M; Cleasby A; Davies TG; Hall RJ; Ludlow RF; Murray CW; Tisi D; Jhoti H, Crystallographic screening using ultra-low-molecular-weight ligands to guide drug design. Drug Discov Today 2019, 24, 1081–1086. [DOI] [PubMed] [Google Scholar]
- (48).Le Guilloux V; Schmidtke P; Tuffery P, Fpocket: an open source platform for ligand pocket detection. BMC Bioinformatics 2009, 10, 168. [DOI] [PMC free article] [PubMed] [Google Scholar]
- (49).McDonald IK; Thornton JM, Satisfying hydrogen bonding potential in proteins. J. Mol. Biol 1994, 238, 777–793. [DOI] [PubMed] [Google Scholar]
Associated Data
This section collects any data citations, data availability statements, or supplementary materials included in this article.
Supplementary Materials
Table S1. All bound structures for the Acpharis benchmark set by PDB ID/chain
Table S2. FTMap results for the Acpharis benchmark set of bound structures
Table S3. All unbound structures for the Acpharis benchmark set by PDB ID/chain
Table S4. FTMap results for the Acpharis benchmark set of unbound structures
Table S5. All bound structures for the Astex benchmark set by PDB ID/chain
Table S6. FTMap results for the Astex benchmark set of bound structures
Table S7. All unbound structures for the Astex set by PDB ID/chain
Table S8. FTMap results for the Astex benchmark set of unbound structures
Table S9. PDB IDs and fragment binding pocket volumes of proteins selected from the FBLD literature
Table S10. Quality measures of predicting hydrogen bonding residues in the fragment binding pocket in the bound proteins of the Acpharis set
Table S11. Quality measures of predicting hydrogen bonding residues in the fragment binding pocket in the unbound proteins of the Acpharis set
Table S12. Quality measures of predicting hydrogen bonding residues in the fragment binding pocket in the bound proteins of the Astex set
Table S13. Quality measures of predicting hydrogen bonding residues in the fragment binding pocket in the unbound proteins of the Astex set
Data S1. Supporting Information for Publication: Excel file of PDB IDs of proteins in bound and unbound Acpharis and Astex benchmark sets