

Abstract
Background
The overlap between cancer and cardiovascular care continues to expand, with intersections emerging before, during, and following cancer therapies. To date, emphasis has been placed on how cancer therapeutics influence downstream cardiac health. However, whether active malignancy itself influences chamber volumes, function, or overall myocardial tissue health remains uncertain. We sought to perform a comprehensive cardiovascular magnetic resonance‐based evaluation of cardiac health in patients with chemotherapy‐naïve cancer with comparison with a healthy volunteer population.
Methods and Results
Three‐hundred and eighty‐one patients with active breast cancer or lymphoma before cardiotoxic chemotherapy exposure were recruited in addition to 102 healthy volunteers. Both cohorts underwent standardized cardiovascular magnetic resonance imaging with quantification of chamber volumes, ejection fraction, and native myocardial T1. Left ventricular mechanics were incrementally assessed using three‐dimensional myocardial deformation analysis, providing global longitudinal, circumferential, radial, and principal peak‐systolic strain amplitude and systolic strain rate. The mean age of patients with cancer was 53.8±13.4 years; 79% being women. Despite similar left ventricular ejection fraction, patients with cancer showed smaller chambers, increased strain amplitude, and systolic strain rate in both conventional and principal directions, and elevated native T1 versus sex‐matched healthy volunteers. Adjusting for age, sex, hypertension, and diabetes mellitus, the presence of cancer remained associated with these cardiovascular magnetic resonance parameters.
Conclusions
The presence of cancer is independently associated with alterations in cardiac chamber size, function, and objective markers of tissue health. Dedicated research is warranted to elucidate pathophysiologic mechanisms underlying these findings and to explore their relevance to the management of patients with cancer referred for cardiotoxic therapies.
Keywords: cardiac magnetic resonance imaging, cardio‐oncology, chemotherapy‐naïve, myocardial strain, T1 mapping
Subject Categories: , Magnetic Resonance Imaging (MRI)
Nonstandard Abbreviations and Acronyms
- 3D‐MDA
three‐dimensional myocardial deformation analysis
- AHA
American Heart Association
- GLS
global longitudinal strain
- HV
healthy volunteers
- maxPS
maximum principal strain
- SSR
systolic strain rate
Clinical Perspective
What Is New?
To date, emphasis has been placed on how cancer therapeutics influence downstream cardiac health. Whether active malignancy itself influences chamber volumes, function, or overall myocardial tissue health remains uncertain.
Using multi‐component cardiovascular magnetic resonance of 381 patients with recently diagnosed breast cancer or lymphoma, we demonstrated unique distributions for a range of imaging markers, inclusive of reduced chamber volumes and elevated strain and native myocardial T1, compared with sex‐matched healthy volunteers; these associations remained significant following comprehensive adjustment inclusive of age and cardiovascular risk factors.
This is the largest and most comprehensive study of cardiovascular phenotype in patients with active (chemotherapy‐naïve) cancer.
What Are the Clinical Implications?
Our results confirm objective and measurable influences of active cancer on the cardiovascular system.
This discovery is of broad relevance to the practices of cardiology and oncology, and frames future studies aimed at exploring postulated signaling pathways and their downstream influence on subsequent cancer therapeutics‐related cardiac dysfunction and cancer‐related outcomes.
Additional consideration should be given to studying influences of de novo cancer development in patients with established cardiovascular disease, justified by its demonstrated potential to alter hemodynamic, contractile, and myocardial tissue level characteristics.
Expanding intersections between cancer and cardiovascular disease have become increasingly relevant to contemporary clinical practice. 1 In this context, strong emphasis has been placed on how cancer therapeutics may adversely influence downstream cardiovascular health. 2 , 3 , 4 , 5 However, several studies have shown strong and independent associations between oncogenesis and heart disease itself, 6 , 7 , 8 , 9 supporting that these unique disease states may interact through shared signaling pathways independent of those triggered by cancer therapeutics. 10 , 11 , 12 Preclinical animal studies have offered support for such interactions, demonstrating both structural and innervation‐related changes of cardiomyocytes in the setting of active cancer. 13 , 14 From these studies, the existence of meaningful influences of cancer on the cardiovascular system has been postulated, raising important considerations surrounding how malignancy itself influences cardiovascular health.
To date, the cardiovascular phenotype of patients with newly diagnosed cancer has nominally been considered similar to that of a healthy population. Indeed, this assumption underpins the current population‐based lower limit of normal thresholds for defining the occurrence of cancer therapeutics‐related cardiac dysfunction (CTRCD). 15 , 16 However, an understanding of how the presence of malignancy innately influences heart chamber volumes, mass, contractility, and overall myocardial tissue health is uncertain. A reference standard technique for the study of these features is cardiovascular magnetic resonance (CMR), an imaging modality providing unique versatility and accuracy in quantifying cardiac architecture, deformation, and tissue characteristics.
In this prospective cohort study, we used multi‐component CMR to examine the cardiac phenotype of patients with recently diagnosed breast cancer or lymphoma, before chemotherapy exposure. These subjects were systematically compared with recruited healthy volunteers (HV) with no history of cancer. Sex‐matched comparisons of quantitative markers were performed, inclusive of chamber volumes, left ventricular (LV) mass, bi‐ventricular ejection fraction, three‐dimensional (3D) strain analysis, and native myocardial T1.
Methods
The data that support the findings of this study are available from the corresponding author upon reasonable request.
Study Population
Patients were enrolled as part of CAPRI (Cardiotoxicity Prevention Research Initiative), a pre‐defined and independently funded sub‐study of CIROC (Cardiovascular Imaging Registry of Calgary) (NCT04367220). Enrollment was conducted between January 2015 and December 2019. At time of analysis, CAPRI had prospectively recruited 595 unique patients with cancer referred for CMR imaging. For this analysis, only patients with breast cancer or lymphoma undergoing imaging before receipt of any anthracyclines and/or trastuzumab therapy were considered eligible. Patients with known prior cardiovascular disease or conditions anticipated to confound cardiac phenotype were excluded, inclusive of: known ischemic or non‐ischemic cardiomyopathy, LV dysfunction (LV ejection fraction [EF] <50% or regional wall motion abnormality), severe valvular disease (stenosis or regurgitation), moderate/severe pulmonary hypertension, or documented extension of mediastinal cancer distorting cardiac anatomy (as determined by CMR). The final cohort included 381 patients (246 breast cancer and 135 lymphoma).
One hundred two HV were prospectively recruited to establish healthy reference values for all investigated markers of cardiac phenotype. HV were recruited from the local community and were required to have no history of cancer, cardiovascular disease, moderate or severe obesity (body mass index ≥35 kg/m2), history of hypertension, diabetes mellitus, kidney, or collagen vascular disease.
The study was approved by the Conjoint Health Research Ethics Board at the University of Calgary (REB 13‐0902) and all subjects provided written informed consent. All research activities were performed in accordance with the Declaration of Helsinki.
Cardiovascular Risk Factors
All subjects underwent baseline surveys of comorbid health and cardiovascular risk factors, with abstraction of all clinically performed laboratory testing. Subjects were coded as hypertensive if receiving anti‐hypertensive medications for known hypertension or had ≥3 blood pressure readings ≥140/90 mm Hg within 12 months before CMR imaging. Diabetes mellitus was coded as present if receiving oral hypoglycemics or insulin or had a Hemoglobin A1c ≥6.5% within 3 years before or 4 months following index CMR. Dyslipidemia was coded as follows: treated if receiving lipid‐lowering therapy and untreated for a low‐density lipoprotein cholesterol ≥3.5 mmol/L or triglycerides ≥1.7 mmol/L documented within 3 years before or 4 months following index CMR.
CMR Imaging Protocol
Subjects were scanned using 1.5‐T (Avanto; 34 patients with cancer) or 3.0‐T (Prisma or Skyra; 347 patients with cancer, all HV) systems (Siemens Healthcare, Erlangen, Germany). All underwent standardized, non‐contrast imaging protocols inclusive of routine cine imaging and native T1 mapping. Cine imaging was performed in sequential short axis (8‐mm thickness; 2‐mm gap) and conventional long‐axis views (4‐chamber, 2‐chamber, and 3‐chamber) at end‐expiration using a steady‐state free precession pulse sequence. Native T1 mapping was performed in short axis at the mid‐LV level using a Shortened Modified Look‐Locker Inversion Recovery sequence, as previously described. 17
Quantification of Cardiac Chamber Volumes and LV Mass
Quantification of LV, right ventricular (RV), and left atrial (LA) volumes was performed using commercially available software (cvi42; Circle Cardiovascular Imaging Inc., Calgary, Canada) and standard operational procedures adherent to the published Society of Cardiovascular Magnetic Resonance recommendations. 18 Semi‐automated tracing of endocardial and epicardial contours of short‐axis cine images was used to derive the LV and RV end‐diastolic volumes, end‐systolic volumes, and ejection fraction, as well as LV mass. Papillary muscles were included in the LV mass and excluded from LV cavitary volume. LA volume was measured at the LV end‐systolic phase before mitral valve opening using the bi‐plane area‐length method from temporally matched 4‐ and 2‐chamber cine views. Volumetric indices and LV mass were indexed both to body surface area (BSA; Mosteller formula) and to height, the latter to mitigate confounding effects related to cancer‐mediated cachexia.
Global and Regional Myocardial Deformation Analysis
Three‐dimensional myocardial deformation analysis (3D‐MDA) was performed using validated in‐house software for the global and regional description of conventional geometry‐dependent (radial, circumferential, and longitudinal) and geometry‐independent (maximal and minimal principal) strain. As previously described, 19 , 20 this approach generates a 3D mesh model of the LV following automated registration and alignment of short‐ and long‐axis 2‐dimensional (2D) cine data sets, accounting for inter‐slice respiratory motion. The resultant model is deformed using a virtual 4‐dimensional displacement field obtained from all available voxel data. Deformation variables were provided in both global and segmental measures, the latter provided according to the American Heart Association (AHA) 17‐segmental model, 21 excluding the apical cap. In addition to longitudinal, circumferential, and radial strain profiles, we incrementally calculated principal strain to provide an unbiased description of deformation, inclusive of shear deformation. 22 All measures were provided as peak systolic strain amplitude and peak systolic strain rate (SSR). As 3D strain amplitudes are recognized to be unique (ie, lower) versus 2D strain measures, 23 all comparisons were made to identical 3D‐MDA analyses performed in sex‐matched HV.
Native T1 Mapping Analysis
For patients imaged at 3.0‐T, native T1 was measured by region of interests applied to the LV septum (AHA segments 8 and 9) and lateral wall (AHA segments 11 and 12) on the mid‐ventricular slice. Region of interests were restricted to the mid‐myocardium to avoid partial volume effects and all raw images were assessed to account for respiratory drift or gating‐related image misregistration. Artefacts, when present, were manually excluded.
Statistical Analysis
Continuous variables were expressed as mean±SD or median (interquartile range); categorical variables as counts (percentage). Two‐group comparisons (patients with cancer versus HV) were performed using 2‐sample t‐test/Mann‐Whitney test for continuous variables, or Chi‐square/Fisher exact test for categorical variables where appropriate. For 3‐group comparisons (breast cancer/lymphoma/HV and cancer with/without cardiovascular risk factors/HV), 1‐way Welch ANOVA or Kruskal‒Wallis test were used, with post‐hoc pairwise comparisons performed using Games‒Howell test for the former and Dunn procedure with Bonferroni correction for the latter.
Multiple linear regression was used to test for association between the presence of cancer (as predictor) and each of the investigated CMR variables (such as LV end‐diastolic volumes or strain amplitude; as an outcome), adjusting for age, sex, hypertension, and diabetes mellitus.
Statistical analyses were conducted using R version 3.6.2 and SPSS version 26, with 2‐tailed P<0.05 indicating statistical significance. Bull's eye plots of American Heart Association (AHA) 17‐segment model for regional distribution of myocardial strain were produced using Python package Matplotlib version 3.1.3.
Results
Clinical Characteristics of Study Cohort
The study population consisted of 381 patients with chemotherapy‐naïve cancer and 102 HV. Baseline clinical characteristics of patients are shown in Table 1. The majority (n=246; 65%) had breast cancer with the remainder having lymphoma (n=135; 35%). The majority were female (n=300; 79%) with a mean age 53.8±13.4 years (range, 22.3–89.2 years). The HV cohort included 55 women (54%); mean age, 43.4±14.5 years (range, 19.0–80.0 years). The mean body mass index of this reference cohort was 25.2±3.7 kg/m2. In accordance with strict recruitment criteria, no HV had any cardiovascular disease, was receiving medication for a cardiovascular or cancer diagnosis, or had any other comorbidity listed in Table 1.
Table 1.
Baseline Clinical Characteristics of Study Patients (n=381)
| Characteristic | Descriptive Statistics |
|---|---|
| Age, y | 53.8±13.4 |
| Female sex | 300 (79%) |
| Cigarette smoking | |
| Never | 307 (81%) |
| Current | 40 (11%) |
| Former | 34 (9%) |
| Alcohol intake | |
| None | 106 (28%) |
| Occasional (<1 drink/d) | 214 (56%) |
| Moderate (1–2/d) | 49 (13%) |
| Heavy (>2/d) | 9 (2%) |
| QoL (rating on 0–100 scale)* | 75.0 (60.0‒90.0) |
| Hypertension | 129 (34%) |
| Diabetes mellitus | 40 (11%) |
| Dyslipidemia | 175 (46%) |
| Treated | 58 (15%) |
| Untreated | 117 (31%) |
| History of CAD | 7 (2%) |
| History of CAD‐equivalent (cerebrovascular, PVD) | 11 (3%) |
| Known kidney disease † | 16 (4%) |
| Collagen vascular disease | 11 (3%) |
| BMI, kg/m2 | 26.6 (23.3‒30.9) |
| BMI status | |
| Underweight (BMI <18.5 kg/m2) | 4 (1%) |
| Normal weight (BMI 18.5–24.9 kg/m2) | 142 (38%) |
| Overweight (BMI 25–29.9 kg/m2) | 124 (33%) |
| Mild/moderate obesity (BMI 30–39.9 kg/m2) | 89 (24%) |
| Morbid obesity (BMI ≥40 kg/m2) | 17 (5%) |
| Baseline atrial fibrillation/flutter | 4 (1%) |
| Laboratory tests | |
| Hemoglobin, g/L | 136.0 (127.0‒143.0) |
| GFR, mL/min | 96.1 (74.5‒118.2) |
| Medications | |
| Aspirin | 25 (7%) |
| Beta‐blocker | 26 (7%) |
| ACEi/ARB | 81 (21%) |
| Calcium channel blocker | 31 (8%) |
| Statin | 55 (14%) |
| Cancer characteristics | |
| Cancer type | |
| Breast cancer | 246 (65%) |
| HER2 receptor | |
| Negative | 114 (46%) |
| Positive | 128 (52%) |
| Equivocal | 4 (1%) |
| Estrogen receptor positive | 185 (75%) |
| Progesterone receptor positive | 142 (58%) |
| Lymphoma | 135 (35%) |
| Tumor AJCC stage | |
| I | 104 (27%) |
| II | 133 (35%) |
| III | 68 (18%) |
| IV | 75 (20%) |
| Duration since diagnosis, mo | 1.2 (0.8, 2.5) |
| Prior cancer ‡ | 34 (9%) |
| Prior radiotherapy to breast/mediastinum | 6 (2%) |
Values are mean±SD, median (IQR), or n (%). ACEi indicates angiotensin converting enzyme inhibitor; AJCC, American Joint Committee on Cancer; ARB, angiotensin receptor blocker; BMI, body mass index; CAD, coronary artery disease; GFR, glomerular filtration rate; HER2, human epidermal growth factor receptor‐2; PVD, peripheral vascular disease; and QoL, quality of life.
Available for 280 patients.
Defined as abnormalities of kidney function or structure present for >3 months, including GFR <60 mL/min, urinary albumin/creatinine ratio >3 mg/mmol, history of renal transplantation, or solitary kidney.
Not treated with anthracycline or trastuzumab.
Patients with cancer showed an expected prevalence of conventional cardiovascular risk factors (Table 1). Hypertension, diabetes mellitus, dyslipidemia, and current cigarette smoking were present in 34%, 11%, 46%, and 11% of patients; respectively. Approximately one‐fifth were receiving angiotensin‐converting enzyme inhibitors and 14% statin therapy. Sixty‐two percent were overweight or obese, only 1% being underweight.
As shown in Tables 2 and 3, patients with cancer showed higher heart rates (mean increase 6.8 bpm in women and 11.2 bpm in men), with similar systolic and diastolic blood pressures versus HV. Female, but not male, patients with cancer had higher body mass index compared with HV (median increase, 2.4 and 0.7 kg/m2, respectively).
Table 2.
Baseline CMR Characteristics of Female Patients With Chemotherapy‐Naïve Cancer Compared With Healthy Volunteers
| Characteristic | Healthy Volunteers (n=55) | Patients With Cancer (n=300) | P Value |
|---|---|---|---|
| Age, y | 41.9±13.8 | 52.5±12.7 | <0.001 |
| BMI, kg/m2 | 24.1 (21.0‒27.7) | 26.5 (22.9‒30.8) | <0.001 |
| Heart rate, bpm | 64.7±10.3 | 71.5±11.7 | <0.001 |
| Systolic BP, mm Hg | 110.9±12.5 | 116.7±15.7 | 0.004 |
| Diastolic BP, mm Hg | 65.8±9.2 | 69.1±11.3 | 0.023 |
| CMR characteristics | |||
| Chamber volumes and mass (indexed to BSA) | |||
| LV EDV, mL/m2 | 77.9±12.0 | 68.1±11.8 | <0.001 |
| LV ESV, mL/m2 | 27.6±6.4 | 23.9±6.4 | <0.001 |
| LV EF, % | 64.8±5.0 | 65.1±5.5 | 0.65 |
| LV mass, g/m2 | 41.3±6.6 | 44.2±8.4 | 0.006 |
| LV stroke volume, mL/m2 | 50.3±7.8 | 44.1±7.3 | <0.001 |
| LV cardiac output, mL/m2 per min | 3.3±0.6 | 3.1±0.6 | 0.18 |
| RV EDV, mL/m2 | 83.1±12.7 | 69.3±12.6 | <0.001 |
| RV ESV, mL/m2 | 34.3±7.8 | 27.3±7.2 | <0.001 |
| RV EF, % | 59.0±5.0 | 60.9±6.1 | 0.013 |
| RV stroke volume, mL/m2 | 48.8±7.0 | 42.0±7.8 | <0.001 |
| RV cardiac output, mL/m2 per min | 3.2±0.6 | 3.0±0.6 | 0.022 |
| LA volume, mL/m2 | 34.7±6.0 | 30.2±8.1 | <0.001 |
| 3D‐MDA * | |||
| Circumferential strain amplitude, % | −11.1±1.8 | −11.8±1.8 | 0.008 |
| Longitudinal strain amplitude, % | −11.6±1.7 | −11.9±1.9 | 0.28 |
| Radial strain amplitude, % | 64.3±19.1 | 71.7±26.3 | 0.015 |
| Minimum principal strain amplitude, % | −27.0±2.3 | −28.7±2.6 | <0.001 |
| Maximum principal strain amplitude (%) | 88.8 (79.3‒95.8) | 102.4 (84.9‒125.0) | <0.001 |
| Systolic circumferential strain rate (1/s) | −0.88±0.15 | −0.93±0.15 | 0.037 |
| Systolic longitudinal strain rate (1/s) | −1.05±0.16 | −1.13±0.21 | 0.002 |
| Systolic radial strain rate (1/s) | 4.38 (3.90‒5.21) | 5.19 (4.06‒6.52) | 0.003 |
| Systolic minimum principal strain rate (1/s) | −1.75±0.35 | −1.87±0.34 | 0.018 |
| Systolic maximum principal strain rate (1/s) | 5.50 (4.67‒6.25) | 6.41 (5.13‒8.09) | <0.001 |
| Native T1 | |||
| Septum, ms † | 1143.5 (1121.3‒1161.0) | 1166.5 (1142.0‒1190.3) | <0.001 |
| Lateral wall, ms ‡ | 1130.0 (1096.3‒1165.8) | 1149.0 (1120.0‒1183.0) | 0.020 |
Values are mean±SD, median (IQR), or n (%). 3D‐MDA indicates three‐dimensional myocardial deformation analysis; BMI, body mass index; BP, blood pressure; BSA, body surface area; CMR, cardiovascular magnetic resonance; EDV, end‐diastolic volume; EF, ejection fraction; ESV, end‐systolic volume; LA, left atrium; LV, left ventricle; and RV, right ventricle.
Global values; available for 285 patients with cancer and 55 healthy volunteers.
Available for 238 patients with cancer and 38 healthy volunteers imaged at 3.0‐T.
Available for 225 patients with cancer and 36 healthy volunteers imaged at 3.0‐T.
Table 3.
Baseline CMR Characteristics of Male Patients With Chemotherapy‐Naïve Cancer Compared With Healthy Volunteers
| Characteristic | Healthy Volunteers (n=47) | Patients with Cancer (n=81) | P Value |
|---|---|---|---|
| Age, y | 45.1±15.3 | 58.8±14.6 | <0.001 |
| BMI, kg/m2 | 26.2 (24.3‒29.1) | 26.9 (24.5‒31.1) | 0.21 |
| Heart rate, bpm | 61.3±9.3 | 72.5±12.9 | <0.001 |
| Systolic BP, mm Hg | 115.2±11.8 | 119.7±19.9 | 0.12 |
| Diastolic BP, mm Hg | 67.7±11.0 | 71.6±10.8 | 0.066 |
| CMR characteristics | |||
| Chamber volumes and mass (indexed to BSA) | |||
| LV EDV, mL/m2 | 84.9±11.8 | 74.6±14.8 | <0.001 |
| LV ESV, mL/m2 | 31.6±5.9 | 27.0±7.4 | <0.001 |
| LV EF, % | 62.9±3.7 | 64.0±5.9 | 0.22 |
| LV mass, g/m2 | 57.2±11.8 | 54.6±12.6 | 0.25 |
| LV stroke volume, mL/m2 | 53.3±7.3 | 47.6±9.7 | <0.001 |
| LV cardiac output, mL/m2 per min | 3.2±0.5 | 3.4±0.8 | 0.12 |
| RV EDV, mL/m2 | 96.1±12.9 | 79.7±17.1 | <0.001 |
| RV ESV, mL/m2 | 42.8±7.9 | 33.1±9.8 | <0.001 |
| RV EF, % | 55.6±4.4 | 58.8±5.8 | <0.001 |
| RV stroke volume, mL/m2 | 53.3±7.6 | 46.6±9.7 | <0.001 |
| RV cardiac output, mL/m2 per min | 3.3±0.5 | 3.3±0.8 | 0.41 |
| LA volume, mL/m2 | 35.7±8.3 | 31.8±10.4 | 0.024 |
| 3D‐MDA * | |||
| Circumferential strain amplitude, % | −10.7±1.7 | −11.7±2.4 | 0.012 |
| Longitudinal strain amplitude, % | −10.6±1.4 | −11.7±2.3 | 0.003 |
| Radial strain amplitude, % | 50.8±20.0 | 63.1±23.0 | 0.003 |
| Minimum principal strain amplitude, % | −24.9±2.9 | −26.9±3.2 | <0.001 |
| Maximum principal strain amplitude (%) | 67.5 (57.8‒86.2) | 86.9 (69.8‒103.8) | 0.002 |
| Systolic circumferential strain rate (1/s) | −0.84±0.17 | −0.98±0.17 | <0.001 |
| Systolic longitudinal strain rate (1/s) | −0.97±0.17 | −1.16±0.21 | <0.001 |
| Systolic radial strain rate (1/s) | 3.70 (2.96‒4.42) | 4.78 (3.85‒6.29) | <0.001 |
| Systolic minimum principal strain rate (1/s) | −1.66±0.33 | −1.89±0.42 | 0.001 |
| Systolic maximum principal strain rate (1/s) | 4.56 (3.50‒5.91) | 5.65 (4.62‒7.61) | <0.001 |
| Native T1 | |||
| Septum, ms † | 1104.0 (1073.0‒1140.0) | 1173.0 (1142.0‒1210.5) | <0.001 |
| Lateral wall, ms ‡ | 1096.0 (1069.5‒1122.5) | 1155.0 (1130.0‒1193.5) | <0.001 |
Values are mean±SD, median (IQR), or n (%). 3D‐MDA indicates 3‐dimensional myocardial deformation analysis; BMI, body mass index; BP, blood pressure; BSA, body surface area; CMR, cardiovascular magnetic resonance; EDV, end‐diastolic volume; EF, ejection fraction; ESV, end‐systolic volume; LA, left atrium; LV, left ventricle; and RV, right ventricle.
Global values; available for 72 patients with cancer and 45 healthy volunteers.
Available for 61 patients with cancer and 39 healthy volunteers imaged at 3.0‐T.
Available for 53 patients with cancer and 37 healthy volunteers imaged at 3.0‐T.
CMR Phenotypic Characteristics of Patients With Cancer
As shown in Tables 2 and 3, numerous CMR phenotypic characteristics were found to be altered in patients with cancer versus HV.
Cardiac Chamber Volumes and LV Mass
Compared with HV, patients with cancer had similar LV EF but statistically significant elevation in RV EF (mean absolute difference of 1.9% in women and 3.2% in men). Patients with cancer had significantly smaller LV, RV, and LA volumes compared with HV. In women with cancer, BSA‐indexed LV end‐diastolic volumes, RV end‐diastolic volumes, and LA volume were 13% lower. In men with cancer, respective reductions were 12%, 15%, and 11%. These led to significant reductions in stroke volume, these appropriately compensated for by higher heart rates to achieve similar cardiac output to HV. Female, but not male, patients with cancer showed higher LV mass (increase of 7%). Findings were similar after exclusion of those patients with cancer scanned at 1.5‐T (n=34).
Repeat indexing of chamber volumes and LV mass to height alone yielded similar results, the exception being LA volumes were no longer significantly different among men (Table S1).
Global and Regional Myocardial Deformation
Three‐dimensional‐MDA analysis was feasible in 357 patients with cancer and 100 HV following the exclusion of studies with insufficient image quality. For simplicity, only transmural strain values are described, with subendocardial and subepicardial layer strain values provided in Table S2.
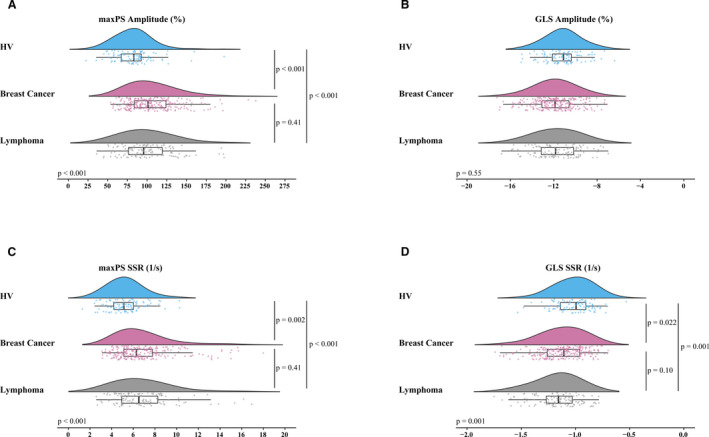
As shown in Tables 2, 3, and Figure 1, geometry‐dependent and principal global peak systolic strain amplitudes and SSR were elevated in both female and male patients with cancer versus HV. The only observed exception was global longitudinal strain (GLS) amplitude in women, which was not significantly different. Maximal principal strain (maxPS) and radial strain showed the greatest elevation in global peak systolic amplitude and SSR, with a relative increase that exceeded 10% versus HV. Findings were similar after exclusion of those patients with cancer scanned at 1.5‐T (n=34). Results for layer‐specific strain were similar except for a few markers not reaching statistical significance (Table S2).
Figure 1. Strain parameters (global maximum principal and longitudinal strain amplitude [A and B] and peak systolic strain rate [SSR; C and D]) in patients with chemotherapy‐naïve cancer vs healthy volunteers, stratified by sex.

Absolute values of all parameters, except GLS amplitude, were higher in patients with cancer vs sex‐matched healthy volunteers. GLS indicates global longitudinal strain; HV, healthy volunteers; maxPS; maximum principal strain; and SSR, systolic strain rate.
Regional alterations in myocardial mechanics were explored by segmental analysis. Here, focus was placed on maxPS as an un‐biased, geometry‐independent, and comprehensive measure of local tissue deformation. Figures 2 and 3 display bullseye plots for this marker to illustrate differences in median maxPS amplitude and SSR in patients with cancer versus HV, stratified by sex, for each of the AHA 16 segments. Significant (P<0.05) differences were observed by segmental pairwise comparisons for both sex cohorts, as indicated by asterisks. Non‐uniformity of myocardial deformation measures in healthy individuals was confirmed, with characteristically higher strain values for apical segments and relatively lower values for basal septal segments. Patients with cancer demonstrated exaggeration of this normally observed pattern of deformation, with significant elevations observed in maxPS amplitude for multiple segments (Figure 2). For example, median maxPS amplitude showed an absolute 36.6% increase for the apical septal segment in female patients with cancer (178.9% versus 142.3%, P=0.002) and 31.1% increase in men (154.5% versus 123.4%, P=0.02) versus HV. Similar findings were observed for maxPS SSR (Figure 3). Identical analyses performed for the measures of longitudinal, circumferential, radial, and minimum principal strain showed similar geographic exaggerations in strain amplitude and SSR.
Figure 2. Bullseye view of 3‐dimensional spatial analysis of median regional maximum principal strain amplitude (%) in patients with cancer vs healthy volunteers, stratified by sex.

Asterisks denote segments with P<0.05 for comparison of patients with cancer vs sex‐matched healthy volunteers. Healthy volunteers showed non‐uniformity of myocardial deformation throughout left ventricular segments, with higher strain amplitude in the apical segments and relatively lower values for basal septal segments; healthy volunteers showed amplification of this pattern. HV indicates healthy volunteers; maxPS; maximum principal strain; and SSR, systolic strain rate.
Figure 3. Bullseye view of 3‐dimensional spatial analysis of median regional maximum principal systolic strain rate (1/s) in patients with cancer vs healthy volunteers, stratified by sex.

Asterisks denote segments with P<0.05 for comparison of patients with cancer vs sex‐matched healthy volunteers. Similar patterns to those in Figure 2 were noted. HV indicates healthy volunteers; maxPS; maximum principal strain; and SSR, systolic strain rate.
Native T1 Mapping
Native T1 mapping analysis was successfully completed for 299 patients with cancer and 77 HV imaged at 3.0‐T. The mid‐septal segments were analyzable in all subjects, and for 278 patients and 73 HV for the lateral wall segments. As shown in Tables 2 and 3, both female and male patients with cancer showed higher native T1 values versus HV. The median elevation in females was 23 ms in the septum (1167 ms versus 1144 ms, P<0.001) and 19 ms in the lateral wall (1149 ms versus 1130 ms, P=0.02). The median elevation in men was 69 ms in the septum (1173 ms versus 1104 ms, P=0.001) and 59 ms in the lateral wall (1155 ms versus 1096 ms, P<0.001).
Multivariable Association of Cancer and CMR markers
To test for independent associations of cancer with each studied CMR parameter adjusting for relevant demographics and cardiovascular risk factors, we constructed multivariable models for each parameter as the outcome, adjusting for age, sex, hypertension, and diabetes mellitus. As shown in Table 4, cancer presence remained strongly predictive of global maxPS amplitude (P=0.007) with an adjusted mean absolute elevation of 10% (95% CI, 3%–17%) versus HV. Table 5 shows multivariable associations for cancer presence and all studied CMR variables. Cancer presence remained independently associated with lower chamber volumes, higher strain parameters (with exception of GLS amplitude), and higher native T1 values. Following adjustment, cancer presence was no longer associated with increased LV mass.
Table 4.
Results of Multivariable Linear Regression for Association Between Maximum Principal Strain Amplitude and Cancer Presence, Adjusting for Age, Sex, Hypertension, and Diabetes Mellitus
| Variable | B* | 95% CI for B | P Value for B | |
|---|---|---|---|---|
| Lower Limit | Upper Limit | |||
| Cancer presence | 9.98 | 2.70 | 17.25 | 0.007 |
| Age | 0.48 | 0.27 | 0.70 | <0.001 |
| Female sex | 18.68 | 12.20 | 25.16 | <0.001 |
| Hypertension | 6.43 | −0.76 | 13.63 | 0.079 |
| Diabetes mellitus | −7.46 | −18.32 | 3.40 | 0.18 |
| Constant | 33.10 | 17.70 | 48.50 | <0.001 |
Unstandardized regression coefficient.
Table 5.
Results of Multivariable Linear Regression for Association Between Each CMR Variable and Cancer Presence, Adjusting for Age, Sex, Hypertension, and Diabetes Mellitus
| CMR Variable | B* for Cancer Presence | 95% CI for B | P Value for B | |
|---|---|---|---|---|
| Lower Limit | Upper Limit | |||
| Chamber volumes and mass (indexed to BSA) | ||||
| LV EDV, mL/m2 | −6.02 | −8.91 | −3.12 | <0.001 |
| LV ESV, mL/m2 | −1.77 | −3.30 | −0.25 | 0.023 |
| LV EF, % | −0.68 | −1.97 | 0.61 | 0.30 |
| LV mass, g/m2 | −0.36 | −2.67 | 1.95 | 0.76 |
| LV stroke volume, mL/m2 | −4.24 | −6.12 | −2.37 | <0.001 |
| LV cardiac output, mL/m2 per min | 0.12 | −0.03 | 0.27 | 0.11 |
| RV EDV, mL/m2 | −9.69 | −12.81 | −6.58 | <0.001 |
| RV ESV, mL/m2 | −5.14 | −6.96 | −3.32 | <0.001 |
| RVEF, % | 1.26 | −0.15 | 2.66 | 0.080 |
| RV stroke volume, mL/m2 | −4.56 | −6.47 | −2.64 | <0.001 |
| RV cardiac output, mL/m2 per min | 0.07 | −0.08 | 0.22 | 0.38 |
| LA volume, mL/m2 | −4.40 | −6.47 | −2.34 | <0.001 |
| 3D‐MDA † | ||||
| Circumferential strain amplitude, % | −0.53 | −1.00 | −0.06 | 0.027 |
| Longitudinal strain amplitude, % | 0.47 | −0.01 | 0.94 | 0.053 |
| Radial strain amplitude, % | 6.35 | 0.27 | 12.42 | 0.041 |
| Minimum principal strain amplitude, % | −1.31 | −1.98 | −0.64 | <0.001 |
| Maximum principal strain amplitude, % | 9.98 | 2.70 | 17.25 | 0.007 |
| Systolic circumferential strain rate (1/s) | −0.07 | −0.11 | −0.03 | <0.001 |
| Systolic longitudinal strain rate (1/s) | −0.11 | −0.16 | −0.06 | <0.001 |
| Systolic radial strain rate (1/s) | 0.77 | 0.31 | 1.24 | 0.001 |
| Systolic minimum principal strain rate (1/s) | −0.16 | −0.25 | −0.07 | 0.001 |
| Systolic maximum principal strain rate (1/s) | 0.91 | 0.31 | 1.51 | 0.003 |
| Native T1 | ||||
| Septum, ms ‡ | 46.26 | 33.96 | 58.56 | <0.001 |
| Lateral wall, ms § | 41.29 | 27.29 | 55.30 | <0.001 |
3D‐MDA indicates three‐dimensional myocardial deformation analysis; BSA, body surface area; CMR, cardiovascular magnetic resonance; EDV, end‐diastolic volume; EF, ejection fraction; ESV, end‐systolic volume; LA, left atrium; LV, left ventricle; and RV, right ventricle.
Unstandardized regression coefficient for association between cardiovascular magnetic resonance variable and cancer presence, adjusting for age, sex, hypertension, and diabetes mellitus.
Global values; available for 457 subjects (357 patients with cancer and 100 healthy volunteers).
Available for 376 subjects (299 patients with cancer and 77 healthy volunteers) imaged at 3.0‐T.
Available for 351 subjects (278 patients with cancer and 73 healthy volunteers) imaged at 3.0‐T.
Sensitivity Analyses
To confirm independence of the observed phenotypic changes from cancer type and cardiovascular risk factors, we performed targeted sensitivity analyses.
Effect of Cancer Type
A priori sensitivity analysis was performed to assess confounding effects of cancer type. As shown in Figure 4 and Table S3 for female subjects, no significant differences in CMR characteristics were seen between the 2 cancer types. Overall, both cancer types showed similar differences in CMR characteristics versus HV. Patients with breast cancer (n=242), but not lymphoma (n=58), showed higher LV mass. The reduced population sizes resulted in a loss of significance for several 3D‐MDA measures; however, similar trends were maintained. Native T1 values of the septum remained significantly elevated in both cancer subtypes compared with HV. Since only 4 male patients had breast cancer, subgroup analysis for male subjects was only performed in patients with lymphoma, demonstrating similar results to the overall male cancer cohort (Table S4).
Figure 4. Effect of cancer type on global maximum principal and global longitudinal strain amplitude (A and B) and peak systolic strain rate (C and D) in female patients with cancer vs healthy volunteers.
Absolute values of all parameters were similar in breast cancer and lymphoma subtypes; all except global longitudinal strain amplitude, were higher in each cancer subgroup vs healthy volunteers. GLS indicates global longitudinal strain; HV, healthy volunteers; maxPS; maximum principal strain; and SSR, systolic strain rate.
Effect of Cardiovascular Risk Factors
To explore potential influences of cardiac risk factors on patient phenotype, we assessed associations between cancer presence and CMR characteristics among subgroups with and without hypertension and diabetes mellitus. These results are summarized in Tables 6, 7, and Figure 5. In patients with cancer with hypertension, an anticipated elevation in LV mass with reduced ventricular volumes was observed versus those without hypertension. The previously observed chamber volumes', strain, and native T1 associations with cancer presence were maintained irrespective of hypertension. In patients with cancer with diabetes mellitus, we observed similar LV mass but smaller biventricular volumes and higher septal native T1 versus those without diabetes mellitus. All chamber volumes', strain and native T1 associations with cancer presence were maintained irrespective of diabetes mellitus, except for GLS and global radial strain amplitude which lost significance among those with diabetes.
Table 6.
Baseline Characteristics of Patients With Chemotherapy‐Naïve Cancer, Stratified by Hypertension, Compared With Healthy Volunteers
| Characteristic | Healthy Volunteers (n=102) | Cancer, No Hypertension (n=252) | Cancer, Hypertension (n=129) | P Value |
|---|---|---|---|---|
| Age, y | 43.4±14.5 | 50.2±13.0* | 60.8±11.2* , † | <0.001 |
| BMI, kg/m2 | 24.9 (22.0‒28.4) | 25.7 (22.5‒29.1) | 27.6 (24.6‒33.0)* , † | <0.001 |
| Heart rate, bpm | 63.1±9.9 | 70.7±10.9* | 73.6±13.5* | <0.001 |
| Systolic BP, mm Hg | 112.8±12.3 | 112.2±12.9 | 127.5±18.6* , † | <0.001 |
| Diastolic BP, mm Hg | 66.6±10.0 | 67.2±10.0 | 74.5±12.0* , † | <0.001 |
| CMR characteristics | ||||
| Chamber volumes and mass (indexed to BSA) | ||||
| LV EDV, mL/m2 | 81.1±12.3 | 70.6±11.7* | 67.3±14.4* | <0.001 |
| LV ESV, mL/m2 | 29.4±6.5 | 25.3±6.2* | 23.2±7.3* , † | <0.001 |
| LV EF, % | 63.9±4.5 | 64.3±5.2 | 66.0±6.2* , † | 0.007 |
| LV mass, g/m2 | 48.6±12.2 | 44.3±8.8* | 50.5±11.8 † | <0.001 |
| LV stroke volume, mL/m2 | 51.7±7.7 | 45.2±7.4* | 44.1±9.0* | <0.001 |
| LV cardiac output, mL/m2 per min | 3.25±0.57 | 3.18±0.63 | 3.20±0.71 | 0.65 |
| RV EDV, mL/m2 | 89.1±14.3 | 73.0±13.5* | 68.5±15.5* , † | <0.001 |
| RV ESV, mL/m2 | 38.2±8.9 | 29.4±7.9* | 26.8±8.5* , † | <0.001 |
| RV EF, % | 57.4±5.0 | 60.1±6.1* | 61.2±6.1* | <0.001 |
| RV stroke volume, mL/m2 | 50.9±7.6 | 43.7±8.0* | 41.7±9.2* | <0.001 |
| RV cardiac output, mL/m2 per min | 3.2±0.6 | 3.1±0.7 | 3.0±0.7 | 0.053 |
| LA volume, mL/m2 | 35.2±7.1 | 30.6±8.2* | 30.6±9.4* | <0.001 |
| 3D‐MDA ‡ | ||||
| Circumferential strain amplitude, % | −10.9±1.7 | −11.7±1.9* | −11.9±2.0* | <0.001 |
| Longitudinal strain amplitude, % | −11.2±1.7 | −11.8±1.9* | −12.0±2.1* | 0.002 |
| Radial strain amplitude, % | 58.2±20.6 | 70.0±25.7* | 69.9±26.2* | <0.001 |
| Minimum principal strain amplitude, % | −26.1±2.8 | −28.2±2.6* | −28.4±3.3* | <0.001 |
| Maximum principal strain amplitude (%) | 83.2 (67.0‒92.8) | 98.7 (81.5‒119.0)* | 99.5 (79.6‒134.4)* | <0.001 |
| Systolic circumferential strain rate (1/s) | −0.86±0.16 | −0.92±0.14* | −0.97±0.17* , † | <0.001 |
| Systolic longitudinal strain rate (1/s) | −1.01±0.17 | −1.12±0.19* | −1.17±0.24* | <0.001 |
| Systolic radial strain rate (1/s) | 4.18 (3.44‒5.15) | 5.07 (4.03‒6.39)* | 5.36 (3.87‒6.65)* | <0.001 |
| Systolic minimum principal strain rate (1/s) | −1.71±0.34 | −1.86±0.32* | −1.91±0.43* | <0.001 |
| Systolic maximum principal strain rate (1/s) | 5.13 (4.18‒6.03) | 6.24 (5.01‒7.72)* | 6.49 (4.99‒8.96)* | <0.001 |
| Native T1 | ||||
| Septum, ms § | 1130.0 (1099.0‒1157.0) | 1164.5 (1142.0‒1194.0)* | 1174.0 (1142.0‒1198.5)* | <0.001 |
| Lateral wall, ms ‖ | 1108.0 (1084.5‒1142.5) | 1151.0 (1121.0‒1189.0)* | 1149.0 (1120.0‒1176.0)* | <0.001 |
Values are mean±SD, median (interquartile range), or n (%). 3D‐MDA indicates 3‐dimensional myocardial deformation analysis; BMI, body mass index; BP, blood pressure; BSA, body surface area; CMR, cardiovascular magnetic resonance; EDV, end‐diastolic volume; EF, ejection fraction; ESV, end‐systolic volume; LA, left atrium; LV, left ventricle; and RV, right ventricle.
P<0.05 for post‐hoc pairwise comparison of patients with cancer with/without hypertension against healthy volunteers.
P<0.05 for post‐hoc comparison against patients with cancer with no hypertension.
Global values; available for 242 patients with non‐hypertensive cancer, 115 patients with hypertension and cancer, and 100 healthy volunteers.
Available for 198 patients with non‐hypertensive cancer, 101 patients with hypertensive cancer, and 77 healthy volunteers imaged at 3.0‐T.
Available for 187 patients with non‐hypertensive cancer, 91 patients with hypertensive cancer, and 73 healthy volunteers imaged at 3.0‐T.
Table 7.
Baseline Characteristics of Patients With Chemotherapy‐Naïve Cancer, Stratified by Diabetes Mellitus, Compared With Healthy Volunteers
| Characteristic | Healthy Volunteers (n=102) | Cancer, No DM (n=341) | Cancer, DM (n=40) | P Value |
|---|---|---|---|---|
| Age, y | 43.4±14.5 | 52.8±13.4* | 62.4±10.0* , † | <0.001 |
| BMI, kg/m2 | 24.9 (22.0, 28.4) | 26.3 (23.3, 30.1)* | 28.9 (23.2, 36.9)* | 0.001 |
| Heart rate, bpm | 63.1±9.9 | 71.2±11.8* | 75.5±12.2* | <0.001 |
| Systolic BP, mm Hg | 112.8±12.3 | 116.6±16.1* | 122.1±18.9* | 0.005 |
| Diastolic BP, mm Hg | 66.6±10.0 | 69.9±11.3* | 66.7±9.9 | 0.010 |
| CMR characteristics | ||||
| Chamber volumes and mass (indexed to BSA) | ||||
| LV EDV, mL/m2 | 81.1±12.3 | 70.1±12.5* | 64.1±14.0* , † | <0.001 |
| LV ESV, mL/m2 | 29.4±6.5 | 24.8±6.5* | 22.7±8.0* | <0.001 |
| LV EF, % | 63.9±4.5 | 64.8±5.4 | 65.3±6.7 | 0.19 |
| LV mass, g/m2 | 48.6±12.2 | 46.1±10.1 | 49.5±11.9 | 0.055 |
| LV stroke volume, mL/m2 | 51.7±7.7 | 45.3±7.9* | 41.4±7.8* , † | <0.001 |
| LV cardiac output, mL/m2 per min | 3.3±0.6 | 3.2±0.7 | 3.1±0.6 | 0.34 |
| RV EDV, mL/m2 | 89.1±14.3 | 72.4±14.1* | 64.4±14.1* , † | <0.001 |
| RV ESV, mL/m2 | 38.2±8.9 | 28.8±8.2* | 25.7±7.3* , † | <0.001 |
| RV EF, % | 57.4±5.0 | 60.5±6.1* | 60.4±6.2* | <0.001 |
| RV stroke volume, mL/m2 | 50.9±7.6 | 43.5±8.3* | 38.7±8.6* , † | <0.001 |
| RV cardiac output, mL/m2 per min | 3.2±0.6 | 3.1±0.7 | 2.9±0.6* | 0.013 |
| LA volume, mL/m2 | 35.2±7.1 | 30.7±8.6* | 29.4±9.2* | <0.001 |
| 3D‐MDA ‡ | ||||
| Circumferential strain amplitude, % | −10.9±1.7 | −11.7±1.9* | −11.9±2.1* | <0.001 |
| Longitudinal strain amplitude, % | −11.2±1.7 | −11.8±1.9* | −12.0±2.2 | 0.004 |
| Radial strain amplitude, % | 58.2±20.6 | 70.2±26.0* | 68.2±24.2 | <0.001 |
| Minimum principal strain amplitude, % | −26.1±2.8 | −28.3±2.8* | −28.1±3.3* | <0.001 |
| Maximum principal strain amplitude (%) | 83.2 (67.0‒92.8) | 99.3 (82.4‒121.8)* | 88.2 (76.0‒124.5)* | <0.001 |
| Systolic circumferential strain rate (1/s) | −0.86±0.16 | −0.93±0.15* | −1.00±0.19* | <0.001 |
| Systolic longitudinal strain rate (1/s) | −1.01±0.17 | −1.13±0.20* | −1.18±0.27* | <0.001 |
| Systolic radial strain rate (1/s) | 4.18 (3.44‒5.15) | 5.19 (3.96‒6.49)* | 4.97 (4.32‒6.34)* | <0.001 |
| Systolic minimum principal strain rate (1/s) | −1.71±0.34 | −1.87±0.35* | −1.93±0.44* | <0.001 |
| Systolic maximum principal strain rate (1/s) | 5.13 (4.18‒6.03) | 6.36 (4.97‒8.01)* | 6.35 (5.27‒8.27)* | <0.001 |
| Native T1 | ||||
| Septum, ms § | 1130.0 (1099.0‒1157.0) | 1165.0 (1142.0‒1192.0)* | 1190.0 (1166.0‒1222.0)* , † | <0.001 |
| Lateral wall, ms ‖ | 1108.0 (1084.5‒1142.5) | 1149.0 (1120.0‒1180.5)* | 1175.5 (1127.8‒1200.0)* | <0.001 |
Values are mean±SD, median (interquartile range), or n (%). 3D‐MDA indicates 3‐dimensional myocardial deformation analysis; BMI, body mass index; BP, blood pressure; BSA, body surface area; DM indicates diabetes mellitus; EDV, end‐diastolic volume; EF, ejection fraction; ESV, end‐systolic volume; LA, left atrium; LV, left ventricle; and RV, right ventricle.
P<0.05 for post‐hoc pairwise comparison of patients with cancer with/without diabetes mellitus against healthy volunteers.
P<0.05 for post‐hoc comparison against patients with cancer with no diabetes mellitus.
Global values; available for 322 patients with cancer without diabetes mellitus, 35 patients with cancer and diabetes mellitus, and 100 healthy volunteers.
Available for 268 patients with cancer and without diabetes mellitus, 31 patients with diabetes mellitus and cancer, and 77 healthy volunteers imaged at 3.0‐T.
Available for 248 patients with cancer and without diabetes mellitus, 30 patients with diabetes mellitus and cancer, and 73 healthy volunteers imaged at 3.0‐T.
Figure 5. Effect of baseline cardiovascular risk factors on global maximum principal strain amplitude and peak systolic strain rate in patients with cancer vs healthy volunteers.

Strain parameters were similar in patients with cancer with and without hypertension (A and B) or diabetes mellitus (C and D) but higher in each cancer subgroup compared with healthy volunteers. DM indicates diabetes mellitus; HV, healthy volunteers; maxPS; maximum principal strain; and SSR, systolic strain rate.
Finally, we repeated comparisons of patients with cancer versus sex‐matched HV following the exclusion of patients with either diabetes mellitus or hypertension (n=137). Repeat subgroup analyses for female patients with cancer showed maintained significance for all parameters except LV mass and global circumferential SSR. Repeat subgroup analysis in male patients with cancer was limited by small sample size (n=34). Despite this, maintained statistical significance was observed for native T1, GLS amplitude and SSR, stroke volumes, and RV volumes; the remaining parameters all showing trends in the same direction as the full study population.
Discussion
To our knowledge, this is the largest and most comprehensive study of cardiovascular phenotype in patients with active (chemotherapy‐naïve) cancer. Using multi‐component CMR of patients with recently diagnosed breast cancer or lymphoma, we demonstrated unique distributions for a range of markers, inclusive of reduced cardiac chamber volumes, reduced stroke volume, elevated global and regional strain, and elevated native myocardial T1 compared with sex‐matched HV. These findings were independent of age, hypertension, and diabetes mellitus. A summary of the main findings of our study is provided in Figure 6.
Figure 6. Graphical summary of cancer's effect on the cardiac phenotype.

Compared with a state of health, patients with cancer show reduced cardiac chamber volumes (black arrows) and stroke volumes (white arrows), this compensated for by higher resting heart rate (top panel). Contractility is augmented, with elevation in strain amplitude and systolic strain rate across multiple directions of deformation, as shown by 3‐dimensional myocardial deformation analyses in healthy volunteers and a patient with active cancer (maximal principal strain amplitude shown for female healthy volunteers [average values] and an example female patient with cancer; middle panel). This is not reflected through the global measure of left ventricular ejection fraction. Native myocardial T1 is globally elevated (black arrows), as shown by respective short‐axis T1 mapping images with both septal (sep) and lateral wall (lat) regions of interest (bottom panel).
While unified explanations for the observed cancer phenotype will be discussed, independent explanation of the observed architectural, deformation, and tissue‐related features is justified.
Cardiac Chamber Remodelling
We observed that patients with cancer have smaller chamber volumes versus sex‐matched HV, this consistently observed following indexing to either BSA or height alone. The latter approach was incrementally performed to address potential confounding effects from cancer‐related cachexia, this disproportionally reducing BSA, and recognized to be accompanied by cardiac muscle atrophy. 24 That no differences were observed by the indexing technique is reflective of a lack of significant weight loss appreciated in the study cohort. This is explained by the recent timing of cancer diagnosis (median time from diagnosis 1.2 months), allowing for less confounding effects of cancer‐related cachexia on our study findings. All cardiac chambers' volumes were reduced by a similar proportion without a significant reduction in LV mass, supporting the presence of globally reduced loading conditions. Lower resultant stroke volumes were compensated for by higher resting heart rates.
To date, 3 prior CMR‐based studies have been performed in patients with chemotherapy‐naïve cancer. Two studies indirectly reported data on LV volumes and mass versus cancer‐free controls; however, statistical group comparisons were not performed. 2 , 25 LV volumes, stroke volume, and LV EF appeared similar in these small studies. A third, recently reported study focused on comparison of LV mass between 28 patients with chemotherapy‐naïve breast cancer and 17 age‐matched healthy females. 12 This was accompanied by an exploratory in‐vitro experiment exposing cultured human cardiomyocytes to a conditioned medium of human breast cancer cells known to be rich in cancer secreting factors. In this study, a higher LV mass was observed in patients with breast cancer, this postulated to be related to tumor‐derived endothelin‐1. We confirm this elevation in LV mass among our patients with breast cancer.
Several studies using 2D echocardiographic techniques have been performed in both adult 26 , 27 , 28 , 29 and pediatric 30 , 31 populations with chemotherapy naïve cancer but have yielded conflicting results on LV volumes and mass, largely because of heterogeneous durations of cancer, broad collections of cancer types, 26 , 27 , 31 or cancer types different to breast cancer or lymphoma. 28 , 29 , 30 In contrast, our study focused on patients with breast cancer and lymphoma, a population selected for their high referral rate for cardiotoxic therapeutic regimens.
Myocardial Deformation
Patients with cancer demonstrated higher global strain amplitudes and SSR compared with HV, being observed for both geometry‐dependent and principal directions of deformation. Segmental analyses identified generalized amplification of the normally encountered geographic pattern of deformation.
Only 1 prior study has directly evaluated myocardial strain profiles of patients with chemotherapy‐naïve cancer, in this case matched to patients without cancer from a local clinical service. 26 This was a retrospective study of 122 patients with mixed cancer referred for 2D speckle‐tracking echocardiography. The population predominantly had gastrointestinal cancers with some gynecologic, breast and lung cancers, as well as sarcoma, and the duration of cancer was not reported. GLS and global circumferential strain amplitude were found to be lower compared with 45 patients without cancer. However, given the heterogeneity of the population, unknown duration of disease, and lack of a healthy control group, it is challenging to compare this study's results to our own.
It is important to acknowledge technique‐specific dependencies of strain evaluations, particularly relevant to 3D versus 2D techniques. In the current study, we used custom, in‐house software 19 , 20 to provide comprehensive 3D evaluations of geometry‐dependent and geometry‐independent strain, transmurally and for both endocardial and epicardial layers. Strain amplitudes derived from 3D‐based techniques are recognized to have lower absolute values compared with 2D analyses, 23 this believed to be attributable to inherent overestimation of in‐plane displacements from 2D analyses from through‐plane motion. 32 Versus the reference of CMR tagging, 2D speckle‐tracking echocardiography shows positive bias for absolute GLS (+5.5%) whereas 3D speckle‐tracking echocardiography shows similar values (−0.5%). 23 Similar bias exists for 2D‐feature tracking based strain analysis from CMR cine images, with a bias of +8.4% for GLS. 33 These studies support that 3D strain analyses, as used in the current study, may more accurately reflect true tissue deformation versus 2D techniques.
T1 Mapping
Both septal and lateral wall native T1 values were significantly elevated among patients with cancer compared with HV. This finding is in agreement with a prior study reported by Jordan et al that showed a similar degree of T1 elevation in 37 patients with cancer before first chemotherapy exposure. 25 A separate small cohort study of 20 female patients with breast cancer did not observe significant differences; however, it was not designed nor powered to undertake this analysis. 3
Elevations in native T1, in the absence of concurrent amyloid protein deposition, can be attributed to elevations in tissue water content or collagen‐mediated expansion of the interstitium. The latter, while not excluded by our study, appears of lower likelihood for 2 reasons. First, biological plausibility of recently diagnosed cancer (median time from diagnosis 1.2 months) to mediate collagen‐based remodelling in this time frame is lower than that of tissue water expansion. Second, collagen‐mediated expansion of the interstitium is typically associated with adverse chamber remodelling and reductions in contractile performance, which is opposite to our study findings.
Explaining Influence of Cancer on Cardiovascular Health
The currently described cancer phenotype of reduced chamber volumes (and stroke volume), compensatory tachycardia, elevated myocardial strain, and elevated myocardial T1 can be collectively explained through acknowledgment of known inflammatory pathway activation in active cancer. 29 , 34 , 35 , 36 Cancer presents a persistent, oncogene‐derived cellular stress that establishes a feed‐forward loop of inflammatory signaling, 37 this commonly evidenced by elevations in serum inflammatory markers at time of diagnosis. 38 Sustained activation of inflammatory pathways may be anticipated to result in reduction of systemic vascular resistance, reduced chamber volumes, hyper‐dynamic contractile state, and elevation in capillary permeability (resulting in increased tissue water). That LV mass was incrementally elevated among patients with breast cancer may represent a unique phenomenon as supported by prior experimental work suggesting a potential role of endothelin‐1. 12 Future correlative studies investigating systemic inflammatory and non‐inflammatory pathway activation in this population are required to explore such mechanisms.
Relevance to Clinical Practice
A central aspect of cancer care is surveillance of CTRCD following chemotherapy induction. To date, this has been primarily studied in the context of interval changes of LV EF or GLS versus baseline assessments, these interpreted in the context of healthy cohort reference ranges. 5 , 16 Fortuitously, these currently recommended global markers of contractile health (LV EF and GLS) showed least sensitivity towards our observed differences in baseline phenotype and therefore appear most appropriate in this role. However, the future consideration of strain‐based markers, volumetric markers, or serial monitoring of myocardial T1 signal must recognize and carefully weigh these influences.
Whether this observed cancer‐mediated state identifies patients at altered risk of subsequent CTRCD or provides value towards the prediction of cancer‐related outcomes remains unknown. This will be studied through longitudinal follow‐up of the described cohort. However, additional consideration should be given to studying influences of de‐novo cancer development in patients with established cardiovascular disease, justified by its demonstrated potential to alter hemodynamic, contractile, and myocardial tissue level characteristics.
Limitations
This study has several important limitations. This was a single‐center cohort study; therefore, our results would benefit from external validation in other institutional settings. Despite efforts to recruit healthy volunteers of similar age, a maintained difference versus patients with cancer was observed given greater challenges in identifying qualifying healthy subjects aged >60 years. To address this, we performed multivariable analyses adjusted for age and demonstrated cancer presence remained strongly associated with each CMR parameter. We acknowledge that, while subgroup analysis suggested similar associations between cancer presence and cardiovascular phenotype, the relative number of males represented by this study was modest. Accordingly, future studies aimed at expanding representation for, and evaluating influence in this sex are desirable. Our study was purposely restricted to patients with breast cancer or lymphoma; therefore, our findings are not generalizable to other cancer types. These 2 cancer types were recently identified to be responsible for the majority of heart disease deaths in patients with cancer diagnosed at age <40 years, with breast cancer being 1 of 4 subtypes among those diagnosed at age ≥40 years. 1 While justifying inaugural focus on these cancers, future studies inclusive of other cancer states are of interest and should be pursued. Such studies may assist in elucidating common versus cancer‐specific pathways contributing to alterations in cardiovascular phenotype. As intravenous contrast was not administered in this study protocol, late gadolinium enhancement imaging and post‐contrast extracellular volume fraction quantification were not performed. Finally, only clinically ordered laboratory testing was available, limiting our capacity to provide incremental comparison to serum‐based markers of tissue injury or systemic inflammation.
Conclusions
Patients with recently diagnosed breast cancer or lymphoma demonstrate a unique cardiovascular phenotype consisting of reduced chamber volumes, elevated strain amplitude and SSR, and elevated myocardial T1. These findings, independent of age, sex, and cardiovascular risk factors, support a meaningful influence of active cancer on the cardiovascular system. Future research is warranted to identify underlying pathophysiologic mechanisms and explore their relevance to clinical outcomes in this population.
Sources of Funding
This study was funded by an Alberta Precision Health Initiative Development Grant supported by Alberta Innovates and Genome Alberta.
Disclosures
Dr White is funded by the Canadian Institute of Health Research, receives research support from Siemens Healthineers and Circle Cardiovascular Inc., and is a shareholder of Cohesic Inc. The remaining authors have no disclosures to report.
Supporting information
Tables S1–S4
(J Am Heart Assoc. 2021;10:e019811. DOI: 10.1161/JAHA.120.019811.)
Supplementary Material for this article is available at https://www.ahajournals.org/doi/suppl/10.1161/JAHA.120.019811
For Sources of Funding and Disclosures, see page 17.
See Editorial by Chen and Ghosh
References
- 1. Stoltzfus KC, Zhang Y, Sturgeon K, Sinoway LI, Trifiletti DM, Chinchilli VM, Zaorsky NG. Fatal heart disease among cancer patients. Nat Commun. 2020;11:2011. DOI: 10.1038/s41467-020-15639-5. [DOI] [PMC free article] [PubMed] [Google Scholar]
- 2. Jordan JH, Castellino SM, Meléndez GC, Klepin HD, Ellis LR, Lamar Z, Vasu S, Kitzman DW, Ntim WO, Brubaker PH, et al. Left ventricular mass change after anthracycline chemotherapy. Circ Hear Fail. 2018;11:1–10. DOI: 10.1161/CIRCHEARTFAILURE.117.004560. [DOI] [PMC free article] [PubMed] [Google Scholar]
- 3. Altaha MA, Nolan M, Marwick TH, Somerset E, Houbois C, Amir E, Yip P, Connelly KA, Michalowska M, Sussman MS, et al. Can quantitative CMR tissue characterization adequately identify cardiotoxicity during chemotherapy? JACC Cardiovasc Imaging. 2020;13:951–962. DOI: 10.1016/j.jcmg.2019.10.016. [DOI] [PubMed] [Google Scholar]
- 4. Negishi T, Thavendiranathan P, Negishi K, Marwick TH, Aakhus S, Murbræch K, Massey R, Bansal M, Fukuda N, Hristova K, et al. Rationale and design of the strain surveillance of chemotherapy for improving cardiovascular outcomes. JACC Cardiovasc Imaging. 2018;11:1098–1105. DOI: 10.1016/j.jcmg.2018.03.019. [DOI] [PubMed] [Google Scholar]
- 5. Plana JC, Thavendiranathan P, Bucciarelli‐Ducci C, Lancellotti P. Multi‐modality imaging in the assessment of cardiovascular toxicity in the cancer patient. JACC Cardiovasc Imaging. 2018;11:1173–1186. DOI: 10.1016/j.jcmg.2018.06.003. [DOI] [PubMed] [Google Scholar]
- 6. Banke A, Schou M, Videbaek L, Møller JE, Torp‐Pedersen C, Gustafsson F, Dahl JS, Køber L, Hildebrandt PR, Gislason GH. Incidence of cancer in patients with chronic heart failure: a long‐term follow‐up study. Eur J Heart Fail. 2016;18:260–266. DOI: 10.1002/ejhf.472. [DOI] [PubMed] [Google Scholar]
- 7. Hasin T, Gerber Y, Weston SA, Jiang R, Killian JM, Manemann SM, Cerhan JR, Roger VL. Heart failure after myocardial infarction is associated with increased risk of cancer. J Am Coll Cardiol. 2016;68:265–271. DOI: 10.1016/j.jacc.2016.04.053. [DOI] [PMC free article] [PubMed] [Google Scholar]
- 8. Hasin T, Gerber Y, McNallan SM, Weston SA, Kushwaha SS, Nelson TJ, Cerhan JR, Roger VL. Patients with heart failure have an increased risk of incident cancer. J Am Coll Cardiol. 2013;62:881–886. DOI: 10.1016/j.jacc.2013.04.088. [DOI] [PMC free article] [PubMed] [Google Scholar]
- 9. Sakamoto M, Hasegawa T, Asakura M, Kanzaki H, Takahama H, Amaki M, Mochizuki N, Anzai T, Hamasaki T, Kitakaze M. Does the pathophysiology of heart failure prime the incidence of cancer? Hypertens Res. 2017;40:831–836. DOI: 10.1038/hr.2017.45. [DOI] [PubMed] [Google Scholar]
- 10. Bertero E, Canepa M, Maack C, Ameri P. Linking heart failure to cancer. Circulation. 2018;138:735–742. DOI: 10.1161/CIRCULATIONAHA.118.033603. [DOI] [PubMed] [Google Scholar]
- 11. Koelwyn GJ, Newman AAC, Afonso MS, van Solingen C, Corr EM, Brown EJ, Albers KB, Yamaguchi N, Narke D, Schlegel M, et al. Myocardial infarction accelerates breast cancer via innate immune reprogramming. Nat Med. 2020;26:1452–1458. DOI: 10.1038/s41591-020-0964-7. [DOI] [PMC free article] [PubMed] [Google Scholar]
- 12. Maayah ZH, Takahara S, Alam AS, Ferdaoussi M, Sutendra G, El‐Kadi AOS, Mackey JR, Pituskin E, Paterson DI, Dyck JRB. Breast cancer diagnosis is associated with relative left ventricular hypertrophy and elevated endothelin‐1 signaling. BMC Cancer. 2020;20:751. DOI: 10.1186/s12885-020-07217-1. [DOI] [PMC free article] [PubMed] [Google Scholar]
- 13. Tian M, Nishijima Y, Asp ML, Stout MB, Reiser PJ, Belury MA. Cardiac alterations in cancer‐induced cachexia in mice. Int J Oncol. 2010;37:347–353. DOI: 10.3892/ijo_00000683. [DOI] [PubMed] [Google Scholar]
- 14. Mühlfeld C, Das SK, Heinzel FR, Schmidt A, Post H, Schauer S, Papadakis T, Kummer W, Hoefler G. Cancer induces cardiomyocyte remodeling and hypoinnervation in the left ventricle of the mouse heart. PLoS One. 2011;6:e20424. DOI: 10.1371/journal.pone.0020424. [DOI] [PMC free article] [PubMed] [Google Scholar]
- 15. Seidman A, Hudis C, Pierri MK, Shak S, Paton V, Ashby M, Murphy M, Stewart SJ, Keefe D. Cardiac dysfunction in the trastuzumab clinical trials experience. J Clin Oncol. 2002;20:1215–1221. DOI: 10.1200/JCO.2002.20.5.1215. [DOI] [PubMed] [Google Scholar]
- 16. Plana JC, Galderisi M, Barac A, Ewer MS, Ky B, Scherrer‐Crosbie M, Ganame J, Sebag IA, Agler DA, Badano LP, et al. Expert consensus for multimodality imaging evaluation of adult patients during and after cancer therapy: a report from the American Society of Echocardiography and the European Association of Cardiovascular Imaging. J Am Soc Echocardiogr. 2014;27:911–939. DOI: 10.1016/j.echo.2014.07.012. [DOI] [PubMed] [Google Scholar]
- 17. Piechnik SK, Ferreira VM, Dall'Armellina E, Cochlin LE, Greiser A, Neubauer S, Robson MD. Shortened Modified Look‐Locker Inversion recovery (ShMOLLI) for clinical myocardial T1‐mapping at 1.5 and 3 T within a 9 heartbeat breathhold. J Cardiovasc Magn Reson. 2010;12:69. DOI: 10.1186/1532-429X-12-69. [DOI] [PMC free article] [PubMed] [Google Scholar]
- 18. Schulz‐Menger J, Bluemke DA, Bremerich J, Flamm SD, Fogel MA, Friedrich MG, Kim RJ, von Knobelsdorff‐Brenkenhoff F, Kramer CM, Pennell DJ, et al. Standardized image interpretation and post processing in cardiovascular magnetic resonance: Society for Cardiovascular Magnetic Resonance (SCMR) Board of Trustees Task Force on Standardized Post Processing. J Cardiovasc Magn Reson. 2013;15:35. DOI: 10.1186/1532-429X-15-35. [DOI] [PMC free article] [PubMed] [Google Scholar]
- 19. Satriano A, Heydari B, Narous M, Exner DV, Mikami Y, Attwood MM, Tyberg JV, Lydell CP, Howarth AG, Fine NM, et al. Clinical feasibility and validation of 3D principal strain analysis from cine MRI: comparison to 2D strain by MRI and 3D speckle tracking echocardiography. Int J Cardiovasc Imaging. 2017;33:1979–1992. DOI: 10.1007/s10554-017-1199-7. [DOI] [PMC free article] [PubMed] [Google Scholar]
- 20. Satriano A, Heydari B, Guron N, Fenwick K, Cheung M, Mikami Y, Merchant N, Lydell CP, Howarth AG, Fine NM, et al. 3‐Dimensional regional and global strain abnormalities in hypertrophic cardiomyopathy. Int J Cardiovasc Imaging. 2019;35:1913–1924. DOI: 10.1007/s10554-019-01631-8. [DOI] [PubMed] [Google Scholar]
- 21. Cerqueira MD, Weissman NJ, Dilsizian V, Jacobs AK, Kaul S, Laskey WK, Pennell DJ, Rumberger JA, Ryan T, Verani MS. Standardized myocardial segmentation and nomenclature for tomographic imaging of the heart. Circulation. 2002;105:539–542. DOI: 10.1161/hc0402.102975. [DOI] [PubMed] [Google Scholar]
- 22. Pedrizzetti G, Sengupta S, Caracciolo G, Park CS, Amaki M, Goliasch G, Narula J, Sengupta PP. Three‐dimensional principal strain analysis for characterizing subclinical changes in left ventricular function. J Am Soc Echocardiogr. 2014;27:1041–1050.e1. DOI: 10.1016/j.echo.2014.05.014. [DOI] [PubMed] [Google Scholar]
- 23. Amzulescu MS, Langet H, Saloux E, Manrique A, Slimani A, Allain P, Roy C, de Meester C, Pasquet A, Somphone O, et al. Improvements of myocardial deformation assessment by three‐dimensional speckle‐tracking versus two‐dimensional speckle‐tracking revealed by cardiac magnetic resonance tagging. J Am Soc Echocardiogr. 2018;31:1021–1033.e1. DOI: 10.1016/j.echo.2018.04.009. [DOI] [PubMed] [Google Scholar]
- 24. Murphy KT. The pathogenesis and treatment of cardiac atrophy in cancer cachexia. Am J Physiol Heart Circ Physiol. 2016;310:H466–H477. DOI: 10.1152/ajpheart.00720.2015. [DOI] [PubMed] [Google Scholar]
- 25. Jordan JH, Vasu S, Morgan TM, D’Agostino RB, Meléndez GC, Hamilton CA, Arai AE, Liu S, Liu C‐Y, Lima JAC, et al. Anthracycline‐associated T1 mapping characteristics are elevated independent of the presence of cardiovascular comorbidities in cancer Survivors. Circ Cardiovasc Imaging. 2016;9:1–19. DOI: 10.1161/CIRCIMAGING.115.004325. [DOI] [PMC free article] [PubMed] [Google Scholar]
- 26. Tadic M, Genger M, Baudisch A, Kelle S, Cuspidi C, Belyavskiy E, Burkhardt F, Venneri L, Attanasio P, Pieske B. Left ventricular strain in chemotherapy‐naive and radiotherapy‐naive patients with cancer. Can J Cardiol. 2018;34:281–287. DOI: 10.1016/j.cjca.2017.11.018. [DOI] [PubMed] [Google Scholar]
- 27. Tadic M, Baudisch A, Haßfeld S, Heinzel F, Cuspidi C, Burkhardt F, Escher F, Attanasio P, Pieske B, Genger M. Right ventricular function and mechanics in chemotherapy‐ and radiotherapy‐naïve cancer patients. Int J Cardiovasc Imaging. 2018;34:1581–1587. DOI: 10.1007/s10554-018-1379-0. [DOI] [PubMed] [Google Scholar]
- 28. Assuncao BMBL, Handschumacher MD, Brunner AM, Yucel E, Bartko PE, Cheng K‐H, Campos O, Fathi AT, Tan TC, Scherrer‐Crosbie M. Acute leukemia is associated with cardiac alterations before chemotherapy. J Am Soc Echocardiogr. 2017;30:1111–1118. DOI: 10.1016/j.echo.2017.07.016. [DOI] [PubMed] [Google Scholar]
- 29. Cramer L, Hildebrandt B, Kung T, Wichmann K, Springer J, Doehner W, Sandek A, Valentova M, Stojakovic T, Scharnagl H, et al. Cardiovascular function and predictors of exercise capacity in patients with colorectal cancer. J Am Coll Cardiol. 2014;64:1310–1319. DOI: 10.1016/j.jacc.2014.07.948. [DOI] [PubMed] [Google Scholar]
- 30. Mavinkurve‐Groothuis AMC, Marcus KA, Pourier M, Loonen J, Feuth T, Hoogerbrugge PM, de Korte CL, Kapusta L. Myocardial 2D strain echocardiography and cardiac biomarkers in children during and shortly after anthracycline therapy for acute lymphoblastic leukaemia (ALL): a prospective study. Eur Heart J Cardiovasc Imaging. 2013;14:562–569. DOI: 10.1093/ehjci/jes217. [DOI] [PubMed] [Google Scholar]
- 31. Akam‐Venkata J, Kadiu G, Galas J, Aggarwal S. Pediatric malignancies: Is the prechemotherapy left ventricular function normal? Echocardiography. 2019;36:1727–1735. DOI: 10.1111/echo.14461. [DOI] [PubMed] [Google Scholar]
- 32. Pedrizzetti G, Claus P, Kilner PJ, Nagel E. Principles of cardiovascular magnetic resonance feature tracking and echocardiographic speckle tracking for informed clinical use. J Cardiovasc Magn Reson. 2016;18:51. DOI: 10.1186/s12968-016-0269-7. [DOI] [PMC free article] [PubMed] [Google Scholar]
- 33. Bucius P, Erley J, Tanacli R, Zieschang V, Giusca S, Korosoglou G, Steen H, Stehning C, Pieske B, Pieske‐Kraigher E, et al. Comparison of feature tracking, fast‐SENC, and myocardial tagging for global and segmental left ventricular strain. ESC Hear Fail. 2020;7:523–532. DOI: 10.1002/ehf2.12576. [DOI] [PMC free article] [PubMed] [Google Scholar]
- 34. Łukaszewicz‐Zając M, Mroczko B, Gryko M, Kędra B, Szmitkowski M. Comparison between clinical significance of serum proinflammatory proteins (IL‐6 and CRP) and classic tumor markers (CEA and CA 19–9) in gastric cancer. Clin Exp Med. 2011;11:89–96. DOI: 10.1007/s10238-010-0114-5. [DOI] [PMC free article] [PubMed] [Google Scholar]
- 35. Weinstein PS, Skinner M, Sipe JD, Lokich JJ, Zamcheck N, Cohen AS. Acute‐phase proteins or tumour markers: the role of SAA, SAP, CRP and CEA as indicators of metastasis in a broad spectrum of neoplastic diseases. Scand J Immunol. 1984;19:193–198. DOI: 10.1111/j.1365-3083.1984.tb00919.x. [DOI] [PubMed] [Google Scholar]
- 36. Ausoni S, Calamelli S, Saccà S, Azzarello G. How progressive cancer endangers the heart: an intriguing and underestimated problem. Cancer Metastasis Rev. 2020;39:535–552. DOI: 10.1007/s10555-020-09869-8. [DOI] [PubMed] [Google Scholar]
- 37. Greten FR, Grivennikov SI. Inflammation and cancer: triggers, mechanisms, and consequences. Immunity. 2019;51:27–41. DOI: 10.1016/j.immuni.2019.06.025. [DOI] [PMC free article] [PubMed] [Google Scholar]
- 38. Asegaonkar SB, Asegaonkar BN, Takalkar UV, Advani S, Thorat AP. C‐reactive protein and breast cancer: new insights from old molecule. Int J Breast Cancer. 2015;2015:1–6. DOI: 10.1155/2015/145647. [DOI] [PMC free article] [PubMed] [Google Scholar]
Associated Data
This section collects any data citations, data availability statements, or supplementary materials included in this article.
Supplementary Materials
Tables S1–S4