Abstract
Background
Phenotypic switching in vascular smooth muscle cells (VSMCs) is involved in the pathogenesis of aortic dissection (AD). This study aims to explore the potential mechanisms of linc01278 during VSMC phenotypic switching.
Methods and Results
Twelve samples (6 AD and 6 control) were used for lncRNA, microRNA, and mRNA microarray analysis. We integrated the mRNA microarray data set with GSE52093 to determine the differentially expressed genes. Bioinformatic analysis, including Gene Expression Omnibus 2R, Venn diagram analysis, gene ontology, pathway enrichment, and protein–protein interaction networks were used to identify the target lncRNA, microRNA, and mRNA involved in AD. Subsequently, we validated the bioinformatics data using techniques in molecular biology in human tissues and VSMCs. Linc01278, microRNA‐500b‐5p, and ACTG2 played an important role in the vascular smooth muscle contraction pathway. Linc01278 and ACTG2 were downregulated and miR‐500b‐5p was upregulated in AD tissues. Molecular markers of VSMC phenotypic switching, including SM22α, SMA, calponin, and MYH11, were downregulated in AD tissues. Plasmid‐based overexpression and RNA interference‐mediated downregulation of linc01278 weakened and enhanced VSMC proliferation and phenotypic switching, respectively. Dual‐luciferase reporter assays confirmed that linc01278 regulated miR‐500b‐5p that directly targeted ACTG2 in HEK293T cells.
Conclusions
These data demonstrate that linc01278 regulates ACTG2 to control the phenotypic switch in VSMCs by sponging miR‐500b‐5p. This linc01278‐miR‐500b‐5p‐ACTG2 axis has a potential role in developing diagnostic markers and therapeutic targets for AD.
Keywords: ACTG2, aortic dissection, gene profiling, linc01278, miR‐500b‐5p, vascular smooth muscle cells
Subject Categories: Aneurysm, Aortic Dissection, Biomarkers, Basic Science Research
Nonstandard Abbreviations and Acronyms
- AD
aortic dissection
- DEGs
the differentially expressed genes
- GO
gene ontology
- KEGG
kyoto encyclopedia of genes and genomes
- lncRNAs
long noncoding RNAs
- PPI
protein–protein interaction
- qRT‐PCR
quantitative reverse transcription‐PCR
- VSMCs
vascular smooth muscle cells
Clinical Perspective
What Is New?
We have confirmed that linc01278 regulates ACTG2 to control the phenotypic switch in vascular smooth muscle cells by sponging miR‐500b‐5p.
What Are the Clinical Implications?
linc01278 could be used as a diagnostic marker and therapeutic target for aortic dissection.
Aortic dissection (AD) is a cardiovascular disease that is associated with high morbidity and mortality worldwide. 1 The current surgical treatments for AD are complex 2 and ineffective in controlling the bleeding in patients. Interventional treatments simplify the operation, 3 but long‐term follow‐up for these patients remains to be conducted. Therefore, it is imperative to devise novel therapeutic strategies for AD, especially based on molecule targeting. Vascular smooth muscle cells (VSMCs) are the main components of the middle aortic layer. The phenotypic switch in VSMCs is crucial for the pathogenesis of AD, 4 , 5 , 6 thereby highlighting the importance of research on phenotypic plasticity of VSMCs.
Long noncoding RNAs (lncRNAs) are noncoding RNAs longer than 200 base pairs. 7 LncRNAs rarely encode proteins but bind to and regulate the translation of target mRNAs. Recent studies have shown that lncRNAs can regulate multiple cellular functions, including proliferation, migration, and apoptosis, by sponging microRNAs (miRNAs). 8 Emerging evidence also shows that lncRNAs participate in the phenotypic switch of VSMCs. 9 , 10 However, the specific involvement of lncRNAs during the crucial steps in the pathogenesis of AD remains unclear. Therefore, studying specific lncRNA and target RNA pairs during the phenotypic switch of VSMCs in AD may help identify biomarkers and therapeutic targets.
High‐throughput sequencing is commonly used to detect the differentially expressed genes (DEGs) between injured and normal tissues. 11 Although the number of DEGs correlated with AD, the key pathogenic genes have not been identified. Because of base parameters, such as age, race, and sex, patients with the same disease exhibit different gene profiles and even contain junk information. Therefore, more advanced analysis of the bioinformatics‐based data may help exclude unimportant information.
In this study, we combined advanced tools in bioinformatics, including R software with Gene Expression Omnibus 2R analysis, target gene prediction tools, gene ontology (GO) and pathway analysis, and protein–protein interaction (PPI) networks to identify the involvement of linc01278 in AD. Techniques in molecular biology validated the role of linc01278/miR‐500b‐5p/ACTG2 upon phenotype switching in VSMCs during the progression of AD.
Methods
The data that support the findings of this study are available from the corresponding author upon reasonable request.
Human Aortic Samples
This study was conducted in accordance with the Declaration of Helsinki and was approved by the Ethical Committee of Jilin University (IRB:2018066). All patients provided written informed consent before agreeing to participate in this study. Human ascending aorta specimens were collected from patients with Stanford A acute AD or ischemic heart disease (normal control) without aortic diseases during surgery (Table 1). All patients with AD were diagnosed based on computed tomography angiography and the absence of hereditary disease.
Table 1.
Primers of All Genes
| Gene Name | Forward Primer | Reverse Primer |
|---|---|---|
| ACTG2 | GCGTGTAGCACCTGAAGAG | GAATGGCGACGTACATGGCA |
| SMA | GCGTGGCTATTCCTTCGTTA | ATGAAGGATGGCTGGAACAG |
| Calponin | AGCTAAGAGAAGGGCGGAAC | CATCTGCAGGCTGACATTGA |
| SM22a | AACAGCCTGTACCCTGATGG | CGGTAGTGCCCATCATTCTT |
| MYH11 | TGGAACTTCATCGACTTTGGG | ACAGCTTCTCCACGAAAGAC |
| MMP‐2 | ACCCATTTACACCTACACCAAG | TGTTTGCAGATCTCAGGAGTG |
| MMP‐9 | CGAACTTTGACAGCGACAAG | CACTGAGGAATGATCTAAGCCC |
| miR‐193a‐3p | ATGCTCAAACTGGCCTACAAG | TATGGTTGTTCTGCTCTCTGTCTC |
| miR‐183a‐3p | AAACCCAAAGTGAATTACCGAAG | CAGAGCAGGGTCCGAGGTA |
| miR‐223‐5p | TGACGGCGTGTATTTGACAAG | TATGGTTGTTCTCGACTCCTTCAC |
| miR‐367‐3p | CCAGATTGGAATTGCACTTTAGC | TATGGTTGTTCACGACTCCTTCAC |
| miR‐1299 | CCCTAACGGTTCTGGAATTCTGT | TATGGTTGTTCACGACTCCTTCAC |
| miR‐3607‐3p | CCCTTGGGACTGTAAACGCT | TATGGTTGTTCACGACTCCTTCAC |
| miR‐500b‐5p | ACAGTGCTCAATCCTTGCTACC | TATGGTTGTTCACGACTCCTTCAC |
| NR‐024330 | AGCTATCCCAGTGCAAGTTAGG | GGTGTTGCTCTTTCTGGTAGGA |
| NR‐027242 | GAGATAAGTGGGTGTGTGGAGG | TGGATAAAACCCGAGTGGAGTG |
| NR104609 | CAGGACCATGCAGGATTTTCAC | TGTCTCCCATACCCACCATTTC |
| NR125419 | AGCTGAAATGAGAAGGGTGAGG | CCAGCCTTGAATGAGTGTTGTG |
| NR126334 | TTGTGATTTGCATCTGGCTGTG | GAACAGGGACAAGGTTGATTGC |
| NR002798 | CTTCTTTACCCTTCTCCCCAGG | GGTGTTCTAGCGTCAGACATCA |
| NR027484 | ACGCAGTTGCCAGTAAAGATTG | TACAGTGGAGGAGGTACAAGGA |
| NR038304 | CCCATCTCGTGGTTTCCTAACA | GCCAGGGTTCAGGTCAGAAATA |
| NR038974 | TGACGCTAGAACACCACGTAAA | ACTTGGTGTGGTCTTGAGTTGT |
| NR104098 | GTGAGGGAGGCTTAGCCAGAG | GTGGATTCCCTGGAACCATCTC |
| LINC01278 | TAAGAATGTTAGCCCAAACTGC | AGGTCTGGGATTGTTGTGAAA |
| U6 | GCGCGTCGTGAAGCGTTC | GTGCAGGGTCCGAGGT |
| GAPDH | CGGACCAATACGACCAAATCCG | AGCCACATCGCTCAGACACC |
ACTG2 indicates actin gamma 2; miR, microRNA; MMP, matrix metalloproteinase; MYH11, smooth muscle myosin heavy chain; SM22, smooth muscle 22; and SMA, smooth muscle‐actin.
Microarray Data and DEGs
We downloaded the human mRNA microarray profile GSE52093 (GPL10558) from the Gene Expression Omnibus (GEO) database. GSE52093 included 12 human aorta samples, including 7 and 5 patients who had AD or were normal, respectively. These data were analyzed using Gene Expression Omnibus 2R with R software and limma package. The DEGs were selected and used to compare with our mRNA gene profile 11 to obtain the up‐ and downregulated genes. P<0.05 and fold change ≥3.0 were the cut‐off values in these 2 mRNA gene profiles. We have represented the DEGs using a volcano map. All data were normalized using the R software before further bioinformatic analysis.
Bioinformatic Enrichment Analysis
The DEGs were analyzed using DAVID for GO and Kyoto Encyclopedia for Genes and Genomes (KEGG) pathway involvement. GO was analyzed based on cellular component, biological process, and molecular function. The DEGs were fed into the STRING database to generate the PPI network. Interaction data were acquired and typed into Cytoscape for cytoHubba analysis. The top 10 hub genes were analyzed using GeneMANIA (https://genemania.org) to obtain their enrichments in the cellular component and relevant pathway.
RNA Extraction and Microarray Analysis
All the RNAs (6 AD and normal control samples) were extracted using TRIzol, quantified (for integrity and concentration) using NanoDrop ND‐1000, and analyzed using the Arraystar Human miRNA and lncRNA microarray. We performed the above processes as per the Agilent Technology protocol. The differentially expressed miRNAs and lncRNAs were statistically significant with a change of >2.0 or <2.0‐fold with P<0.05.
Quantitative Real‐Time Polymerase Chain Reaction
Ten differentially expressed lncRNAs, including 5 upregulated and 5 downregulated, and 6 upregulated miRNAs were randomly selected and validated using quantitative reverse transcription–polymerase chain reaction (qRT‐PCR). Total RNA was reverse transcribed to cDNA. Table 2 lists the primers used in qRT‐PCR. LncRNA and miRNA expression was normalized to that of GAPDH and U6, respectively. Relative expression was calculated using the 2−ΔΔCt method.
Table 2.
General Information on Aortic Dissection and Patients With Ischemic Heart Disease
| AD Group | Normal Group | P Value | |
|---|---|---|---|
| (n=6) | (n=6) | ||
| Age (y) | 55.61±9.23 | 57.53±10.61 | 0.7450 |
| Male | 3 (50.00%) | 3 (50.00%) | … |
| Obesity (BMI >25 kg/m2) | 2 (33.33%) | 3 (50.00%) | 0.5582 |
| Hypercholesterolemia | 1 (16.67%) | 2 (33.33%) | 0.5055 |
| Smoking | 2 (33.33%) | 4 (66.67%) | 0.2482 |
| NYHA class III‐IV | 1 (16.67%) | 2 (33.33%) | 0.5055 |
| Hypertension | 4 (66.67%) | 3 (50.00%) | 0.5582 |
| Diabetes mellitus | 1 (16.67%) | 3 (50.00%) | 0.2207 |
| Chronic renal dysfunction | 0 | 0 | … |
AD indicates aortic dissection; BMI, body mass index; and NYHA, New York Heart Association.
Differentially Expressed miRNAs and lncRNA and Venn Diagram Analysis
The top 5 hub genes (ACTG2, BDNF, DMD, CNN1, and MYOCD) were selected and used to predict the involvement of miRNAs using TargetScan (www.targetscan.org). The differentially expressed miRNAs in our gene profile and predicted miRNAs were imported into the functional enrichment analysis tool (FunRich) to obtain the list of differentially expressed miRNAs to predict the relevant lncRNAs using DIANA (carolina.imis.athena‐innovation.gr). Venn diagram analysis was used to detect the differentially expressed lncRNAs. Finally, we used Cytoscape to construct the lncRNA‐miRNAs‐mRNAs interaction networks.
Immunohistochemistry
We fixed 10 samples, including 5 each of the AD and normal control human tissues, in 4% formaldehyde, embedded in paraffin, sliced into 2‐μm sections, dewaxed, hydrated, antigen‐repaired, and placed in repair solution at 90°C for 30 minutes followed by incubation at 70°C. Subsequently, the sections were incubated with hydrogen peroxide (10 minutes) followed by the primary (30 minutes) and secondary antibodies (20 minutes), diaminobenzidine staining solution, and washes using phosphate‐buffered saline. Finally, the samples were counterstained with hematoxylin, routinely dehydrated, transparentized, and sealed.
Cell Culture
Human aortic VSMCs were cultured in Smooth Muscle Cell Medium (America Sciencell) containing 2% fetal bovine serum at 37°C in a humidified 5% CO2 incubator. All cells used in this study were between passages 5 and 7. VSMCs were serum starved (0.5% fetal bovine serum) for 24 hours and subjected to stimulation with platelet‐derived growth factor‐BB.
VSMC Transfection
Short interfering RNA (siRNA) targeting linc01278 (5′‐CCUCUUCACCCAUAAGAAATT‐3′) was purchased from GenePharma (Shanghai, China). A scrambled sequence (5′‐UUCUCCGAACGUGUCACGUTT‐3′) was used as the control (siRNA‐scr). VSMCs were transfected with the siRNAs or miR‐500b‐5p inhibitor (5′‐ACCAGGUAGCAAGGAUU‐3′) using Lipofectamine 2000 (Life Technologies, Shanghai, China). To overexpress linc01278, the lncRNA was cloned into the pcDNA3.1 vector. The plasmids or miR‐500b‐5p mimics (5′‐AAUCCUUGCUACCUGGGU‐3′) were transfected into VSMCs using Lipofectamine 2000 (Invitrogen, Shanghai, China). Transfection medium was replaced after 5 hours. All transfected VSMCs were harvested after 48 hours.
Western Blotting
Total cell proteins were separated using sodium dodecyl sulfate–polyacrylamide gel electrophoresis and transferred to a nitrocellulose membrane. Blots were blocked with 5% nonfat milk with 0.1% Tween 20. The blots were incubated with the following primary antibodies: ACTG2 (1:500, bioss), SM22a (1:500, bioss), SMA (1:800, bioss), calponin (1:2000, bioss), MYH (1:1000, Proteintech), β‐actin (1:5000, bioss), and ki‐67 (1:500 dilution, bioss). The blots were then incubated with secondary antibodies and visualized.
Fluorescence In Situ Hybridization
Fluorescence in situ hybridization was performed using the protocol provided by GenePharma (Shanghai, China). Fluorescence in situ hybridization probes for linc01278 were designed by GenePharma (Shanghai, China). The cells were washed with phosphate‐buffered saline for 5 minutes and fixed with 4% formaldehyde for 15 minutes. Ten cells were treated with 0.1% Buffer A for 15 minutes, 0.5% bovine serum albumin for 30 minutes, and 2× Buffer C for 30 minutes at 37°C. The samples were dehydrated using an ethanol gradient (70%, 95%, and 100%) and air dried. The linc01278 probes were diluted to 1 µmol/L using 1 µm SA‐CY3, which was added to the samples for 16 hours at 37°C in a 5% CO2 incubator. After treatment with 0.1% Buffer F for 3 minutes, the samples were incubated with 2× Buffer C for 8 minutes at 60°C followed by 4',6‐diamidino‐2‐phenylindole dye. Finally, the cells were subjected to confocal microscopy.
Dual‐Luciferase Reporter Assay
We seeded 2×10⁴ HEK293T cells into each well of 6‐well plates 24 hours before transfection. HEK293T cells were co‐transfected with pGL6‐ACTG2‐wt, pGL6‐ACTG2‐mut, pGL6‐linc01278‐wt, and pGL6‐linc01278‐mut and miR‐500b‐5p mimics or control using Lipofectamine 2000 (Invitrogen, Life Technologies). Firefly and Renilla luciferase activities were measured at 560 nm. Renilla luciferase intensity was normalized to that of firefly luciferase.
Proliferation
Approximately 3×10⁴ cells were seeded in each well of 96‐well plates for 15 to 20 hours. siRNA‐scr, siRNA‐linc01278, linc01278‐overexpressing plasmids, miR‐500b‐5p mimic, and inhibitor were transfected into the cells. Cell Counting Kit Solution (TransDetect, Beijing, China) was added and incubated with the cultures for 48 hours following which absorbance at 450 nm was measured.
Migration (Scrape Assay)
VSMC cells (2.5×10⁵ cells/well) were seeded and transfected with siRNA‐linc01278, linc01278‐overexpressing constructs, miR‐500b‐5p mimic, and inhibitor. A linear wound was introduced using a 200‐µL tip after 48 hours. After starvation (VSMC) for 72 hours, we counted the number of cells that migrated into the scraped area.
Statistical Analysis
Continuous data are expressed as the mean±SD. One‐way ANOVA followed by post hoc Tukey's test were performed to assess differences between multiple groups. All statistical analysis was performed using SPSS 22.0 software (IBM Corp.). P<0.05 was considered to indicate a statistically significant difference.
Results
Differentially Expressed mRNAs
We analyzed 12 human aortic tissues (7 AD versus 5 normal) in the GSE52093 database, which included 829 upregulated and 737 downregulated mRNAs, using Gene Expression Omnibus 2R (Figure 1A). Our mRNA profiles included 6 AD and control aortic tissues each that revealed the presence of 750 upregulated and 415 downregulated mRNAs (Figure 1B). We found 240 DEGs, including 144 upregulated and 96 downregulated genes, after integrating the database and profiling (Figure 1C). The data were normalized using the R software for further analysis (Figure 1D and 1E).
Figure 1. mRNA microarray profile.
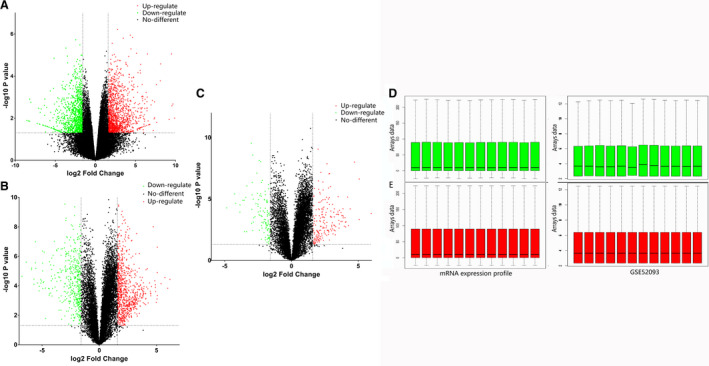
A, mRNA expression profile of GSE 52093. B, Our mRNA expression profile. C, Co‐expression genes after integration of the 2 mRNA gene profiles. The green plots are downregulated and red plots are upregulated differentially expressed genes. D, The green box plots represent the raw data before normalization. Left: our mRNA expression profile; right: GSE 52093 mRNA expression profile. E, The red box plots represent the normalized data. Left: our mRNA expression profile; right: GSE 52093 mRNA expression profile.
Enrichment Analysis of DEGs
Functional enrichment was analyzed by DAVID for all the DEGs. Downregulated genes were enriched in the negative regulation of muscle contraction and cell growth in AD, highlighting the importance of DEGs in the muscle of the aortic media. Upregulated genes focused on the initiation of DNA replication, suggesting that DNA replication initiation might be central to AD (Table 3, Figure 2A).
Table 3.
Enriched Analysis of Co‐Expression of Differentially Expressed Genes
| Expression | Category | Term | Description | Gene Count | P Value |
|---|---|---|---|---|---|
| UP‐DEGs | BP | DNA replication initiation | GO:0006270 | 5 | 2.57E‐05 |
| BP | Chromosome segregation | GO:0007059 | 5 | 5.02E‐04 | |
| BP | Cerebral cortex development | GO:0021987 | 4 | 0.003142638 | |
| BP | Mitotic nuclear division | GO:0007067 | 4 | 0.004282494 | |
| BP | Activation of protein kinase activity | GO:0032147 | 3 | 0.006897187 | |
| CC | Membrane | GO:0016020 | 20 | 7.50E‐05 | |
| CC | Nucleus | GO:0005634 | 36 | 4.50E‐04 | |
| CC | Mitotic spindle | GO:0072686 | 4 | 0.00224541 | |
| CC | Spindle microtubule | GO:0005876 | 4 | 0.002462495 | |
| CC | Cytoplasm | GO:0005737 | 35 | 0.003611931 | |
| MF | Adenosine triphosphate binding | GO:0005524 | 18 | 0.009867326 | |
| MF | Carnitine transmembrane transporter activity | GO:0015226 | 2 | 0.024078878 | |
| MF | DNA polymerase binding | GO:0070182 | 2 | 0.024078878 | |
| MF | Signaling pattern recognition receptor activity | GO:0008329 | 2 | 0.024078878 | |
| MF | Chromatin binding | GO:0003682 | 7 | 0.030938733 | |
| DOWN‐DEGs | BP | Negative regulation of cell growth | GO:0030308 | 6 | 3.70E‐04 |
| BP | Muscle contraction | GO:0006936 | 5 | 0.002123639 | |
| BP | Negative regulation of myotube differentiation | GO:0010832 | 3 | 0.00290187 | |
| BP | Regulation of release of sequestered calcium ion into cytosol by sarcoplasmic reticulum | GO:0010880 | 3 | 0.003675669 | |
| BP | Regulation of cardiac muscle contraction by regulation of the release of sequestered calcium ion | GO:0010881 | 3 | 0.004094642 | |
| CC | Z disc | GO:0030018 | 8 | 2.22E‐06 | |
| CC | Extracellular space | GO:0005615 | 20 | 3.56E‐05 | |
| CC | Proteinaceous extracellular matrix | GO:0005578 | 8 | 4.16E‐04 | |
| CC | Extracellular matrix | GO:0031012 | 7 | 0.003871833 | |
| CC | Calcium channel complex | GO:0034704 | 3 | 0.007012586 | |
| MF | Cytoskeletal protein binding | GO:0008092 | 4 | 0.001632222 | |
| MF | Calcium ion binding | GO:0005509 | 10 | 0.007884453 | |
| MF | Structural constituent of muscle | GO:0008307 | 3 | 0.017698497 | |
| MF | Calcium‐induced calcium release activity | GO:0048763 | 2 | 0.019290714 | |
| MF | Heparin binding | GO:0008201 | 4 | 0.042979033 |
BP indicates biological processes; CC, cellular component; DEGs, differentially expressed genes; and MF, molecular function.
Figure 2. Bioinformatics enrichment analysis including gene ontology and kyoto encyclopedia of genes.
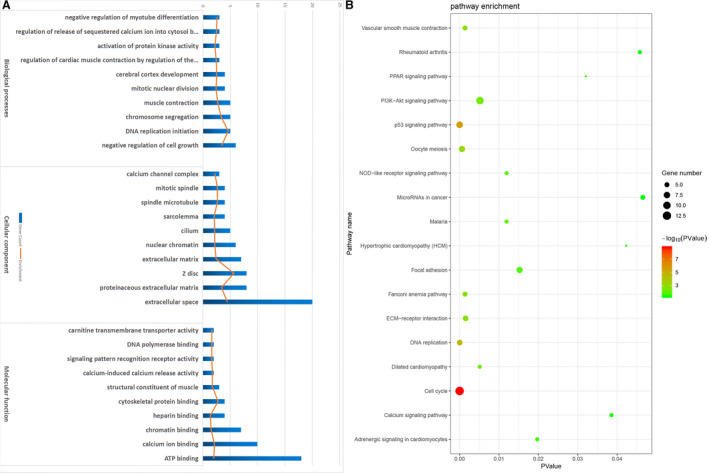
A, Gene Ontology analysis. B, Kyoto Encyclopedia of Genes and Genomes enrichment analysis. Gradual color and size changes represent P value and gene number, respectively. ECM indicates extracellular matrix; and PPAR, peroxisome proliferators‐activated receptors.
KEGG analysis suggested that the downregulated genes primarily focused on vascular smooth muscle contraction (Figure 2B). Upregulated genes were involved with the cell cycle. Therefore, GO and KEGG analyses showed the importance of vascular smooth muscle contraction of the aortic media during AD.
STRING (Figure 3A) suggested that muscle structure development was the biological process involved with the downregulated genes. Vascular smooth muscle contraction and reactome pathway muscle contraction were the pathways associated with these DEGs.
Figure 3. Bio‐information analysis of co‐expression the differentially expressed genes.
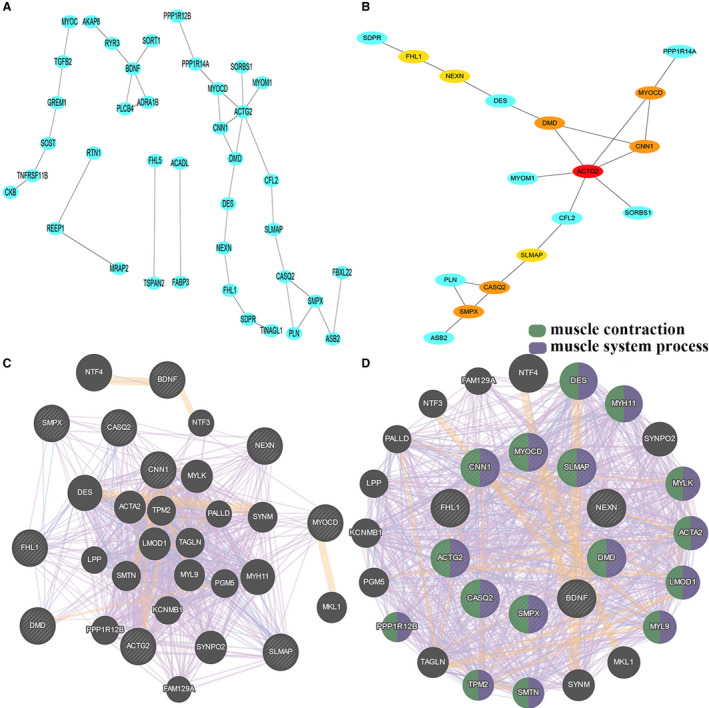
A, Protein–protein interaction networks of string database. B, Cytohubba analysis predicts the hub genes by degree calculation. C, Protein–protein interaction networks of the 10 hub genes of GeneMANIA database. D, Enrich function of 10 hub genes of GeneMANIA database.
Interaction data were subjected to cytoHubba analysis using Cytoscape. Degree calculation suggested that the top 10 hub genes were ACTG2, BDNF, DMD, CNN1, MYOCD, CASQ2, SMPX, NEXN, FHL1, and SLMAP. ACTG2 had the highest score (degree=6; Figure 3B).
PPI networks of all the hub genes were analyzed using GeneMANIA (Figure 3C). These hub genes were mainly enriched in muscle contraction (false discovery rate: 8.23e‐21, 16 gene count of 190 predicted genes) and muscle system process (false discovery rate: 2.71e‐20, 16 gene count of 213 predicted genes; Figure 3D).
Therefore, combining GO, GeneMANIA, and STRING showed that the muscle of the middle layer of the aortic media might play an important role in AD. KEGG and STRING revealed that vascular smooth muscle contraction signaling may be crucial during AD. Finally, cytoHubba analysis found ACTG2 to be the hub gene of AD. Therefore, we investigated the function of ACTG2 in vascular smooth muscle contraction signaling of AD.
Differential Expression Profiles of lncRNAs and miRNAs in the AD and Normal Tissues
A total of 1603 miRNAs were detected that included 177 upregulated and 17 downregulated miRNAs between the AD and control groups, as shown by the volcano plots (Figure 4A and 4B). We detected 10 054 lncRNAs, including 730 upregulated and 1354 downregulated lncRNAs between the AD and control groups (Figure 4D and 4E).
Figure 4. Comparison of miRNA and lncRNA expression profile between the aortic dissection samples and normal control samples.
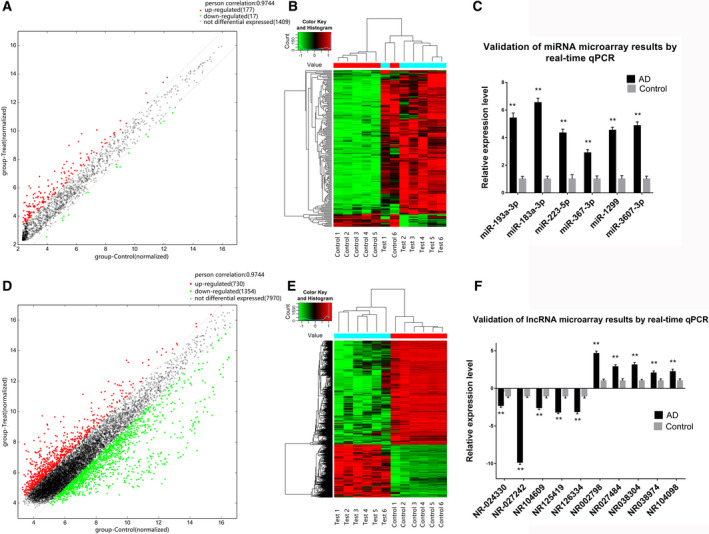
A, miRNA expression profile. The green plots are decreased and red plots are upregulated differentially expressed genes. B, Heat map of miRNA profile. C, Quantitative reverse transcription‐PCR validation of miRNA microarray. D, lncRNA expression profile. E, Heat map of lncRNA profile. F, Quantitative reverse transcription‐PCR validation of lncRNA microarray. AD indicates aortic dissection; and qPCR, quantitative reverse transcription–polymerase chain reaction. **P<0.01.
To validate the miRNA and lncRNA microarray data, we determined the expression of 10 lncRNAs and 6 miRNAs in the tissues using qRT‐PCR. NR002798, NR027484, NR038304, NR038974, NR104098, miR‐193a‐3p, miR‐183a‐3p, miR‐223‐5p, miR‐367‐3p, miR‐1299, and miR‐3607‐3p were upregulated in AD tissues, whereas NR‐024330, NR‐027242, NR104609, NR125419, and NR126334 were downregulated in AD tissues (P<0.05; Figure 4C and 4F). The qRT‐PCR data were in accordance with that from the microarray.
Target Gene Prediction and Validation of Candidates
TargetScan predicted 2003 miRNAs to have binding sites on ACTG2, BDNF, DMD, CNN1, and MYOCD. The predicted 214 miRNAs (score ≥95, conserved branch length >0) were compared with 185 miRNAs from our profile to identify differentially expressed miRNAs. The Venn diagram analysis showed 13 differentially expressed miRNAs (Figure 5A). All the lncRNAs (score ≥95) predicted using the 13 miRNAs were compared with the differentially expressed lncRNAs in our profile to determine true differentially expressed lncRNAs. The Venn diagram analysis showed 6 differentially expressed lncRNAs (Figure 5B). The lncRNA‐miRNA‐mRNA networks were constructed using Cytoscape (Figure 5C). The network included 164 lncRNAs, 13 miRNAs, and 5 mRNAs. We selected linc01278 since it was downregulated and could control ACTG2 via miRNA‐500b‐5p.
Figure 5. The Venn analysis and lnc‐miRNA–mRNA interaction network.
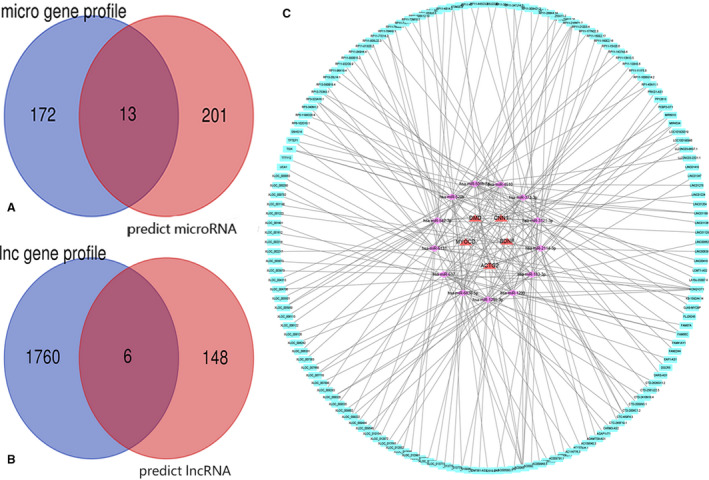
A, miRNA profile and miRNA predicts by TargetScan online tool. B, lncRNA profile and lncRNA predictions by DIANA online tool. C, The interactive network of lncRNA‐miRNA‐mRNA. There were 13 co‐expressed miRNAs and 5 mRNAs and 6 lncRNAs related in the vascular smooth muscle contraction pathway in the network. The red triangle represents mRNAs, purple diamond represents miRNAs, and blue circle represents lncRNAs. Solid lines represent relationship between 2 nodes.
Decreased linc01278 in Human AD Correlates With Proliferating VSMCs
Tissues near the intimal tear derived from patients with AD presented with enhanced proliferation compared with that in normal controls as evidenced by the decline in differentiation markers, including SMA, SM22, calponin, and MYH11 (Figure 6A). AD tissues also exhibited decreased levels of linc01278 and ACTG2 and increased expression of miR‐500b‐5p (Figure 6B). Western blotting also confirmed the downregulation of SMA, SM22, calponin, and MYH11 in AD tissues (Figure 6C). Immunostaining for Ki‐67 showed increased proliferation in the AD samples (Figure 6D). Fluorescence in situ hybridization revealed the cytoplasmic localization of linc01278 (Figure 6E). Therefore, the aberrant expression of linc01278 might regulate VSMC proliferation.
Figure 6. linc01278 was decreased in proliferative capabilities of vascular smooth muscle cells.
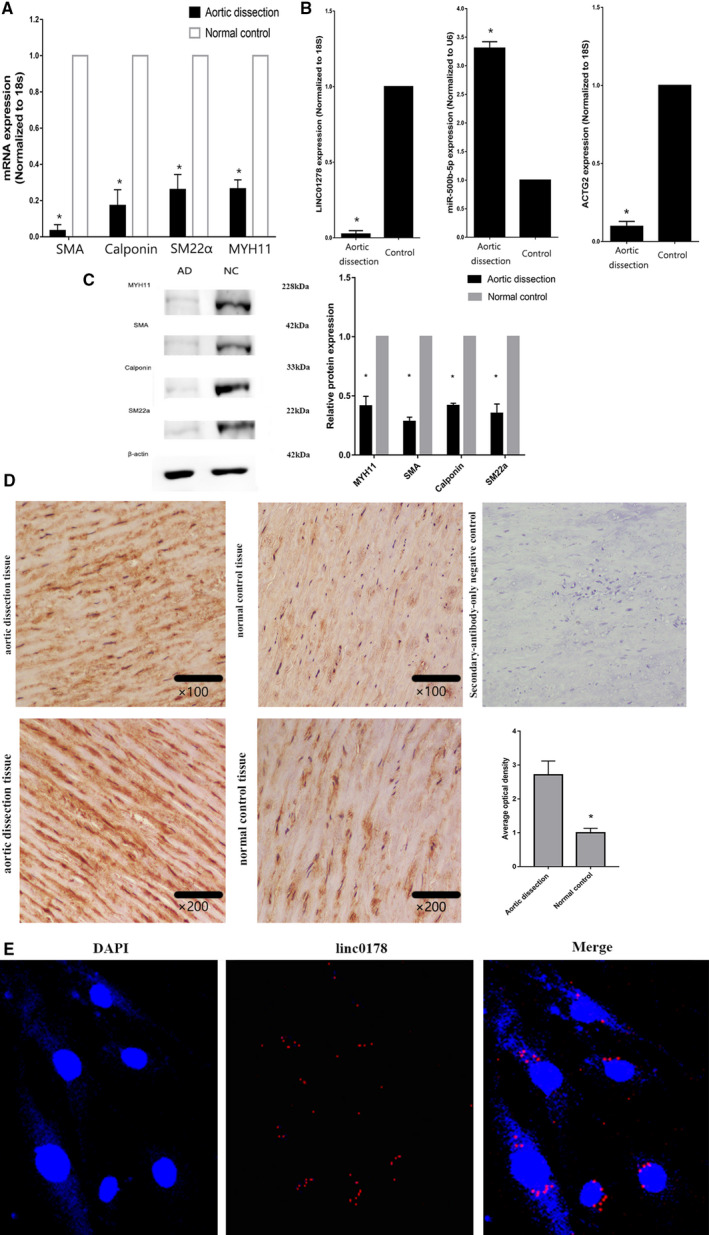
A, Quantitative reverse transcription‐PCR showed the decreased of differentiation marker genes. n=10. *P<0.05. B, Quantitative reverse transcription‐PCR showed the decreased of linc01278 and ACTG2, but miR‐500b‐5p presented with increase. n=10. *P<0.05. C, Decreased differentiation marker genes by Western blot analysis. n=3. *P<0.05. D, Immunostaining showed high expression of Ki‐67 in aortic dissection tissues. n=3. *P<0.05. E, RNA fluorescent in situ hybridization and nucleocytoplasmic separation showed that lnc01278 was mainly expressed in the cytoplasm. AD indicates aortic dissection; DAPI, 4',6‐diamidino‐2‐phenylindole; NC, normal control; and PCR, polymerase chain reaction.
Downregulation of linc01278 in Proliferative VSMCs
After 6 hours of seeding the cells, most VSMCs were adherent and stimulated with PDGF‐BB. We measured the expression of linc01278, miR‐500b‐5p, and ACTG2 in VSMCs at 6, 8, 10, 12, 24, and 36 hours to identify the role of linc01278 in the regulation of VSMC proliferation. qRT‐PCR showed downregulation of linc01278 and ACTG2 but upregulation of miR‐500b‐5p with increasing incubation times of the VSMCs (Figure 7).
Figure 7. linc01278 and ACTG2 were significantly downregulated in proliferating vascular smooth muscle cells but miR‐500b‐5p was upregulated during prolongation of vascular smooth muscle cells proliferation time.

qRT‐PCR results showed time‐dependent decrease in linc01278 (A) and ACTG2 (C) while there was an increase in miR‐500b‐5p (B) expression in human vascular smooth muscle cells (n=10). *P<0.05 compared with the first 6 hours. qRT‐PCR indicates quantitative reverse transcription–polymerase chain reaction.
Linc01278 Regulates VSMC Marker Genes In Vitro
VSMCs were transfected with siRNA‐linc01278, siRNA‐scr, mature miR‐500b‐5p inhibitor, inhibitor control, linc01278‐overexpressing plasmids, empty vector control, miR‐500b‐5p mimics, or mimic control. We confirmed the expression of linc01278 and miR‐500b‐5p using qRT‐PCR. Figure 8A and 8B show that siRNA‐linc01278 decreased linc01278 levels but increased the expression of miR‐500b‐5p. qRT‐PCR (Figure 8C) and Western blotting (Figure 8D and 8E) showed that downregulation of linc01278 reduced the expression of SMA, SM22a, calponin, and MYH11. However, downregulation of miR‐500b‐5p upregulated the marker genes in human VSMCs. qRT‐PCR showed low expression of miR‐500b‐5p in VSMCs cotransfected with siRNA‐linc01278 and miR‐500b‐5p inhibitor. The expression of the marker genes was restored in these VSMCs as compared with VSMCs transfected with siRNA‐linc01278. Lin01278‐overexpressing plasmids successfully increased the expression of linc01278 and the differentiation marker genes in the VSMCs (Figure 9A and 9C through 9E) and downregulated miR‐500b‐5p (Figure 9B). The miR‐500b‐5p mimic showed the opposite trend from that in linc01278‐overexpressing cells.
Figure 8. siRNA of linc01278 regulates vascular smooth muscle cells marker genes in vitro.
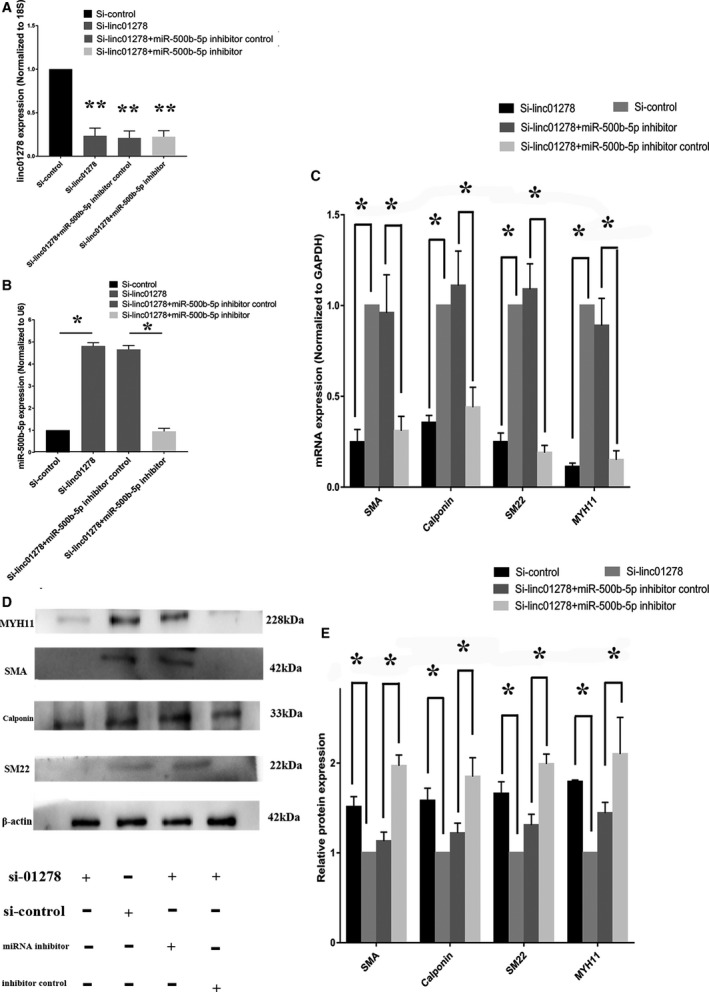
A, Quantitative reverse transcription‐PCR showed linc01278 depression by siRNA of linc01278. n=3. **: P<0.01; B, miR‐500b‐5p inhibitor decreased the expression of miR‐500b‐5p. n=3. *: P<0.05. C, siRNA of linc01278 significantly decreased vascular smooth muscle cells differentiation marker genes, whereas the effect of siRNA of linc01278 could be remedied by transfection with miR‐500b‐5p inhibitor. n=3. *: P<0.05. D and E, siRNA of linc01278 significantly decreased differentiation marker genes as determined by Western blot analysis, whereas miR‐500b‐5p inhibitor reversed the vascular smooth muscle cells switching state by decreasing expression of linc01278. n=3. *P<0.05. PCR indicates polymerase chain reaction.
Figure 9. Vectors of linc01278 regulated the vascular smooth muscle cells marker genes in vitro.
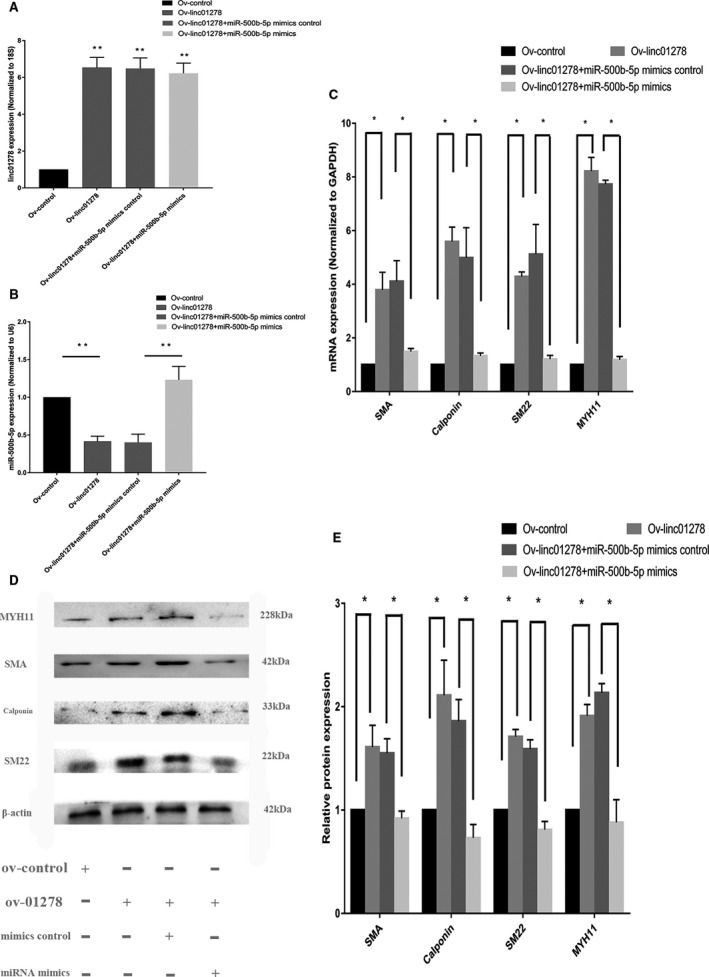
A, Quantitative reverse transcription‐PCR showed linc01278 upexpression by vectors of linc01278. n=3. **: P<0.01; B, miR‐500b‐5p mimics increased miR‐500b‐5p. n=3. **: P<0.01. C, Vectors of linc01278 significantly increased vascular smooth muscle cells differentiation marker genes, whereas the effect of vectors of linc01278 could be remedied by transfection with miR‐500b‐5p mimics. n=3. *: P<0.05. D and E, Vectors of linc01278 significantly increased vascular smooth muscle cells differentiation marker genes as determined by Western blot analysis, whereas miR‐500b‐5p mimics reverse the vascular smooth muscle cells switching state by increasing expression of linc01278. n=3. *: P<0.05. PCR indicates polymerase chain reaction.
Linc01278 Is a Novel Regulator of VSMC Proliferation and Migration
Migration of VSMCs was evaluated using the scrape assay to understand the role of linc01278. Transfection with siRNA‐linc01278 and siRNA‐linc01278+miR‐500b‐5p inhibitor control increased the migration of VSMCs (Figure 10A and 10B). qRT‐PCR also showed high mRNA levels of MMP‐2 and MMP‐9 along with the downregulation of linc01278, which is implicated in increased migration of VSMCs (Figure 10C). Figure 10D shows the high expression of Ki‐67 in VSMCs transfected with siRNA‐linc01278. Figure 10E shows the effect of linc01278 on the proliferation of VSMCs using the cell counting kit 8 assay. The cell proliferation of linc01278‐overexpressing VSMCs showed lower proliferation at 12, 24, 36, and 48 hours. VSMCs transfected with siRNA‐linc01278 and siRNA‐linc01278+miR‐500b‐5p inhibitor control showed higher proliferation. However, VSMCs transfected with siRNA‐scr or siRNA‐linc01278+mature miR‐500b‐5p inhibitor showed lower proliferation as compared with that of VSMCs transfected with siRNA‐linc01278. Figure 11A and 11B shows the decreased migration of VSMCs transfected with linc01278‐overexpressing plasmids and linc01278‐overexpressing plasmids+miR‐500b‐5p mimic control. These VSMCs showed reduced migration, downregulation of MMP‐2 and MMP‐9, and overexpression of linc01278 (Figure 11C). Figure 11D shows the reduced expression of Ki‐67 in VSMCs transfected with ov‐linc01278. The cell counting kit 8 assay showed decreased proliferation of VSMCs transfected with linc01278‐overexpressing plasmids and linc01278‐overexpressing plasmids+miR‐500b‐5p mimic control (Figure 11E). The reduction in proliferation was restored upon transfection with linc01278‐overexpressing plasmids+miR‐500b‐5p mimics. These results suggest that linc01278 inhibits the proliferation and migrations of VSMCs.
Figure 10. Role of si‐linc01278 in vascular smooth muscle cells proliferation and migration.

A and B, Scrape assay showed that the increased migration of human aortic vascular smooth muscle cells was stimulated by transfection with Si‐linc01278 and Si‐linc01278+miR‐500b‐5p inhibitor control, but the increased state was reversed by transfection with Si‐linc01278+miR‐500b‐5p inhibitor. C, Matrix metalloproteinase‐2 and matrix metalloproteinase‐9 were increased by quantitative reverse transcription‐PCR as transfection with Si‐linc01278. D, Western blot showed high expression of ki‐67 in vascular smooth muscle cells transfected with Si‐linc01278. E, The decreased linc01278 promoted vascular smooth muscle cells proliferation as measured by cell counting kit‐8 assay (n=10). *,# P<0.05 vs 12 hours. PCR indicates polymerase chain reaction.
Figure 11. Role of Ov‐linc01278 in vascular smooth muscle cells proliferation and migration.
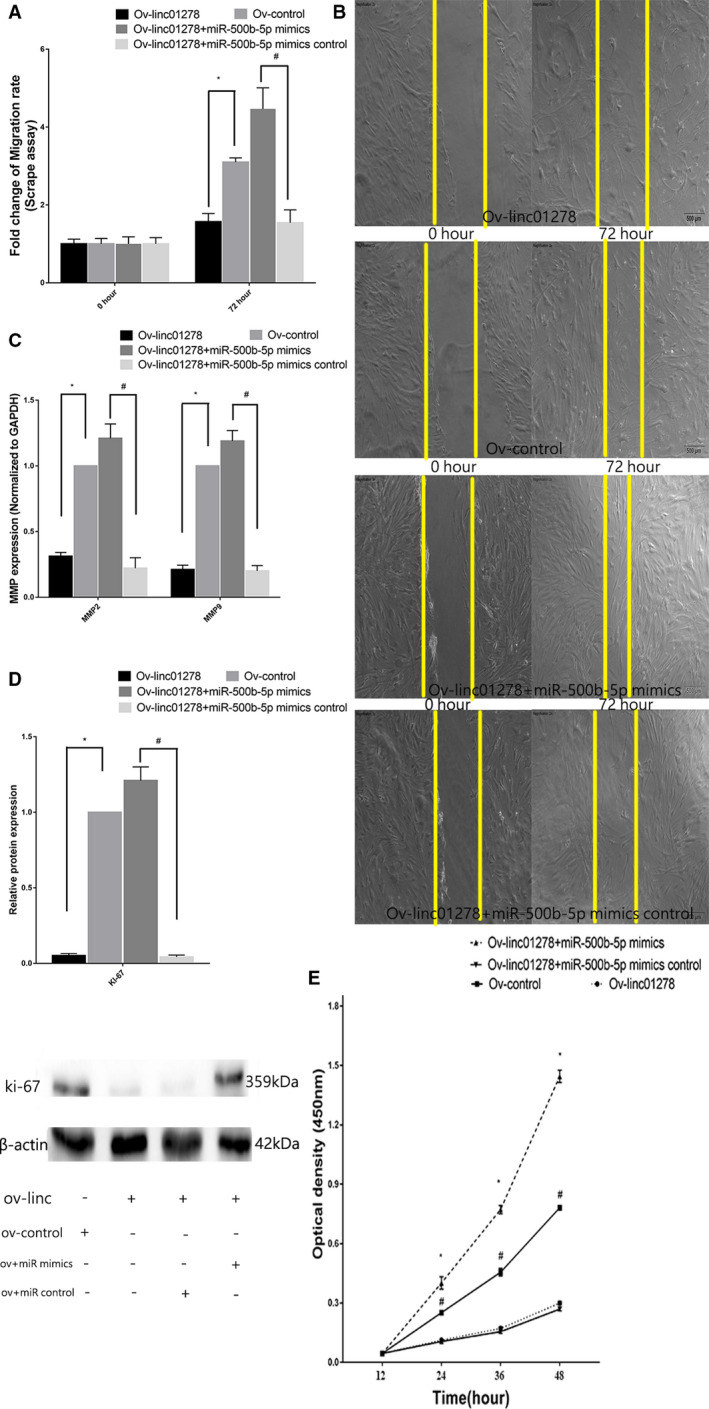
A and B, Scrape assay showed that decreased migration of vascular smooth muscle cells stimulated by transfection with Ov‐linc01278 and Ov‐linc01278+miR‐500b‐5p mimics control but the decreased state was reversed by transfection with Ov‐linc01278+miR‐500b‐5p inhibitor. C, Matrix metalloproteinase‐2 and matrix metalloproteinase‐9 were decreased by quantitative reverse transcription‐PCR as transfection with Ov‐linc01278. D, Western blot showed low expression of ki‐67 in vascular smooth muscle cells transfected with Ov‐linc01278. E, The increase linc01278 inhibited vascular smooth muscle cells proliferation as measured by cell counting kit‐8 assay (n=10). *,# P<0.05 vs 12 hours. PCR indicates polymerase chain reaction.
Linc01278 Regulates the Expression of ACTG2 by Sponging miR‐500b‐5p
Figure 12A and 12B shows the predicted binding sites of miR‐500b‐5p on ACTG2. To determine the correlation between linc01278 and miR‐500b‐5p, we constructed a dual‐luciferase reporter construct including the wild‐type and mutant 3′ untranslated region of ACTG2 for miR‐500b‐5p. HEK293T cells transfected with miR‐500b‐5p mimic showed reduced activity of wild‐type linc01278 compared with that in normal, mimic control, or mutant reporter (Figure 12C). We observed a similar trend with ACTG2 and miR‐500b‐5p (Figure 12D). Moreover, we detected ACTG2 in the AD tissues and transfected VSMCs. qRT‐PCR revealed reduced mRNA levels of ACTG2 in AD tissues and VSMCs transfected with siRNA‐linc01278 and siRNA‐linc01278+miR‐500b‐5p inhibitor control. The mRNA levels of ACTG2 increased in normal control tissues and VSMCs transfected with linc01278‐overexpressing plasmid and linc01278‐overexpressing plasmid+miR‐500b‐5p mimic control (Figure 12E and 12F). Taken together, linc01278 regulated ACTG2 by sponging miR‐500b‐5p.
Figure 12. Relationship among linc01278 and miR‐500b‐5p as well as ACTG2 in vascular smooth muscle cells activation in vitro.
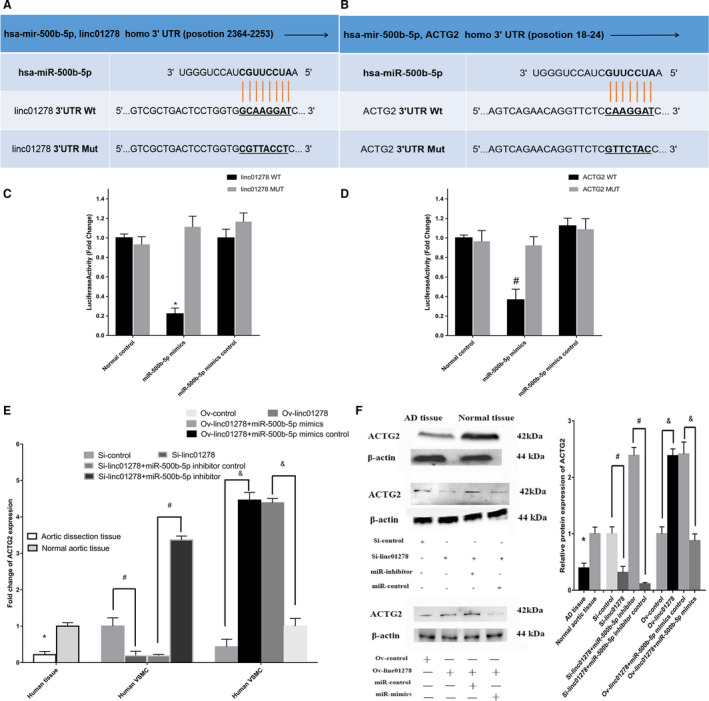
A, linc01278 probable targeted binding site of 3'‐untranslated region of miR‐500b‐5p. B, miR‐500b‐5p probable targeted binding site of 3'‐untranslated region of ACTG2. The vertical lines represented binding sites. C and D, Luciferase assay of wild‐type and mutant linc01278 and ACTG2 3' untranslated region in miR‐500b‐5p mimics and miR‐500b‐5p mimics control into 293T cells. (n=6). *,# P<0.05. E, ACTG2 downexpression in aortic dissection tissue, Si‐linc01278 and Si‐linc01278+miR‐500b‐5p inhibitor control, Ov‐linc01278 control, and Ov‐linc01278+miR‐500b‐5p mimic transfected vascular smooth muscle cells as determined by quantitative reverse transcription‐PCR. *,#,& P<0.05. F, Western blot analysis of ACTG2 in tissues and vascular smooth muscle cells. AD indicates aortic dissection; and PCR, polymerase chain reaction.
Discussion
Type A AD is a lethal disease that originates from a tear in the ascending aortic intima, thereby exposing the medial layer to the pulsatile blood flow. The progressive separation of the aortic wall layers results in the formation of a false lumen and subsequent propagation followed by aortic rupture in the case of adventitial disruption or reentry into the true lumen through another intimal tear. LncRNAs participate in the pathogenesis of many diseases, including type A AD. 12 , 13 , 14 With the rapid development of techniques in sequencing, identifying DEGs between normal and diseased tissues has become faster and more convenient. Therefore, we used mRNA, miRNA, and lncRNA microarrays to identify the DEGs. We cannot exclude the factors that influence atherosclerosis/vascular remodeling during the selection of ascending tissues. The patients were matched between the groups to the best of our capacity. The basic parameters of patients between the 2 groups were not significantly different. Moreover, we selected tissues near the intimal tear in patients with AD for the microarray and validation experiments. The tissues near the intimal tear may reflect the pathology of AD and DEGs.
However, because of the various baseline parameters, such as race, age, sex, and weight, different gene profiles of the same disease resulted in varying data. Therefore, reliable data on the gene expression and key players during the pathogenesis of AD remain to be identified. Bioinformatics will help analyze such volumes of data in a short time and exclude irrelevant information by integrating and validating data. 15 Subsequently, analyzing differential gene expression would help obtain accurate data and pave the way for future research.
In this study, we used the limma packet of the R software to analyze the GSE53094 data set downloaded from Gene Expression Omnibus. The true DEGs from GSE53094 were compared with our mRNA profiles to determine the DEGs and exclude factors, such as baseline parameters and operational error. Before further analysis, we randomly selected genes from the miRNA and lncRNA microarrays and used qRT‐PCR to validate the microarray data. GO showed that the majority of the downregulated genes were associated with regulating cell growth as the biological process. Therefore, we identified the downregulated genes and performed KEGG pathway analysis, which showed that vascular smooth muscle contraction was the most relevant pathway. VSMCs predominantly constitute the aortic wall and maintain its biomechanical properties. 16 , 17 The proliferation and migration of VSMCs is relevant to the initial steps in the development of AD. 18 , 19 , 20 NLRP3, galectin ‐3, and ETS‐1 regulate VSMCs and cause vascular‐related diseases, including AD.
We also used PPI, GeneMANIA, and Cytoscape to analyze the downregulated genes. PPI analysis identified the downregulated genes that were used with the cytoHubba function of Cytoscape to perform hub gene analysis; ACTG2 was selected as the key gene involved with AD.
Subsequently, TargetScan and DIANA were used to predict the miRNAs and lncRNAs involved with AD. All the predicted miRNAs and lncRNAs were compared with our miRNA and lncRNA profiles using Venn diagram analysis to determine the differentially expressed miRNAs and lincRNAs. The linc01278‐miR‐500b‐5p‐ACTG2 axis was found to be the most relevant target genes and was used to understand vascular smooth muscle contraction in AD.
The phenotypic switch in VSMCs regulates cell proliferation and migration. In this study, bioinformatics suggested that linc01278 is a novel modulator of phenotypic switching in VSMCs. Linc01278 was first reported to inhibit the development of papillary thyroid carcinoma in 2019. 21 However, the importance of this lncRNA during phenotypic switching in VSMCs and pathogenesis of AD remains to be elucidated. In this study, we found that linc01278 and ACTG2 were downregulated and miR‐500b‐5p was upregulated in AD tissues. We observed similar trends in VSMCs that showed increased and prolonged proliferation. We performed experiments using 6 hours since most VSMCs were adherent 6 hours after seeding in 6‐well plates. Transfection of siRNA‐linc01278 or linc01278‐overexpressing plasmids decreased and increased the expression of differentiation marker genes in VSMCs, respectively. Moreover, cell counting kit 8 and scrape assays revealed similar trends for the proliferation and migration of VSMCs. These trends could be reversed by transfecting VSMCs with miR‐500b‐5p. Therefore, we inferred that linc01278 sponged miR‐500b‐5p to regulate ACTG2 and control the VSMC phenotypic switch. The binding sites on ACTG2 were verified using dual‐luciferase reporter assays.
However, this study has some limitations. First, we could not address the function of endothelial cells and adventitial fibroblasts as related to the pathology of AD. The adventitia and adventitial fibroblasts received minor attention as a potential contributor to the biology of the aortic wall. Phenotypic differentiation involves adventitial fibroblasts and is a response to stress that is essential for vascular remodeling. Second, miR‐500b‐5p was associated with 185 predicted target genes. Integrating these 185 genes with the DEGs revealed that PRELP and THSD4 were downregulated and had binding sites for miR‐500b‐5p in our gene profiles. However, these 2 genes seemed to be unrelated to AD. Therefore, we did not use these genes in subsequent research.
In conclusion, the downregulation of linc01278 was detected in highly proliferating VSMCs from patients with AD. Furthermore, we identified that linc01278 may be an important regulator of phenotypic switching, proliferation, and migration of human aortic VSMCs by targeting the 3′ untranslated region of miR‐500b‐5p and ACTG2. Thus, the linc01278/miR‐500b‐5p/ACTG2 axis might provide novel molecular mechanisms of AD and have a potential role in diagnostic markers and therapeutic targets for AD.
Sources of Funding
This work was supported by the project of National Natural Science Foundation of China, China (grant no. 81970399), the project of special health project of Jilin Provincial Department of Finance, China (grant no. 20180101), the project of Jilin Key Laboratory Construction Project, China (grant no. 20190901008JC) and Jilin Provincial Department of Science and Technology.
Disclosures
None.
Acknowledgments
Author contribution: W. Wang and Q. Liu designed and supervised the study; T. Wang, K. Liu, Hulin Piao, and Y. Wang performed the analysis work; Zhicheng Zhu and Dan Li contributed to the data analysis; W. Wang and K. Liu organized, designed, and wrote the article. All authors reviewed the final manuscript.
(J Am Heart Assoc. 2021;10:e018062. DOI: 10.1161/JAHA.120.018062.)
For Sources of Funding and Disclosures, see page 18.
References
- 1. Dib B, Seppelt PC, Arif R, Weymann A, Veres G, Schmack B, Beller CJ, Ruhparwar A, Karck M, Kallenbach K. Extensive aortic surgery in acute aortic dissection type A on outcome—insights from 25 years single center experience. J Cardiothorac Surg. 2019;14:187. DOI: 10.1186/s13019-019-1007-7. [DOI] [PMC free article] [PubMed] [Google Scholar]
- 2. Shelstad RC, Reeves JG, Yamanaka K, Reece TB. Total aortic arch replacement: advantages of varied techniques. Semin Cardiothorac Vasc Anesth. 2016;20:307–313. DOI: 10.1177/1089253216672849. [DOI] [PubMed] [Google Scholar]
- 3. Silaschi M, Byrne J, Wendler O. Aortic dissection: medical, interventional and surgical management. Heart. 2017;103:78–87. [DOI] [PubMed] [Google Scholar]
- 4. Zhang P, Hou S, Chen J, Zhang J, Lin F, Ju R, Cheng X, Ma X, Song Y, Zhang Y, et al. Smad4 deficiency in smooth muscle cells initiates the formation of aortic aneurysm. Circ Res. 2016;118:388–399. DOI: 10.1161/CIRCRESAHA.115.308040. [DOI] [PubMed] [Google Scholar]
- 5. Fardoun M, Iratni R, Dehaini H, Eid A, Ghaddar T, El‐Elimat T, Alali F, Badran A, Eid AH, Baydoun E. 7‐O‐methylpunctatin, a novel homoisoflavonoid, inhibits phenotypic switch of human arteriolar smooth muscle cells. Biomolecules. 2019;9:716. DOI: 10.3390/biom9110716. [DOI] [PMC free article] [PubMed] [Google Scholar]
- 6. Wang X, Li D, Chen H, Wei X, Xu X. Expression of long noncoding RNA LIPCAR promotes cell proliferation, cell migration, and change in phenotype of vascular smooth muscle cells. Med Sci Monit. 2019;25:7645–7651. [DOI] [PMC free article] [PubMed] [Google Scholar]
- 7. Mathy NW, Chen XM. Long non‐coding RNAs (lncRNAs) and their transcriptional control of inflammatory responses. J Biol Chem. 2017;292:12375–12382. [DOI] [PMC free article] [PubMed] [Google Scholar]
- 8. Kondo Y, Shinjo K, Katsushima K. Long non‐coding RNAs as an epigenetic regulator in human cancers. Cancer Sci. 2017;108:1927–1933. [DOI] [PMC free article] [PubMed] [Google Scholar]
- 9. Wang M, Li C, Zhang Y, Zhou X, Liu Y, Lu C. LncRNA MEG3‐derived miR‐361‐5p regulate vascular smooth muscle cells proliferation and apoptosis by targeting ABCA1. Am J Transl Res. 2019;11:3600–3609. [PMC free article] [PubMed] [Google Scholar]
- 10. Xu J, Zhang Y, Chu L, Chen W, Du Y, Gu J. Long non‐coding RNA HIF1A‐AS1 is upregulated in intracranial aneurysms and participates in the regulation of proliferation of vascular smooth muscle cells by upregulating TGF‐β1. Exp Ther Med. 2019;17:1797–1801. [DOI] [PMC free article] [PubMed] [Google Scholar]
- 11. Wang W, Wang T, Wang Y, Piao H, Li B, Zhu Z, Xu R, Li D, Liu K. Integration of gene expression profile data to verify hub genes of patients with Stanford a aortic dissection. Biomed Res Int. 2019;2019:3629751. [DOI] [PMC free article] [PubMed] [Google Scholar]
- 12. Shan G, Tang T, Xia Y, Qian HJ. Long non‐coding RNA NEAT1 promotes bladder progression through regulating miR‐410 mediated HMGB1. Biomed Pharmacother. 2019;121:109248. [DOI] [PubMed] [Google Scholar]
- 13. Liu M, Yang P, Mao G, Deng J, Peng G, Ning X, Yang H, Sun H. Long non‐coding RNA MALAT1 as a valuable biomarker for prognosis in osteosarcoma: a systematic review and meta‐analysis. Int J Surg. 2019;72:206–213. [DOI] [PubMed] [Google Scholar]
- 14. Zhao L, Ma Z, Guo Z, Zheng M, Li K, Yang X. Analysis of long non‐coding RNA and mRNA profiles in epicardial adipose tissue of patients with atrial fibrillation. Biomed Pharmacother. 2019;121:109634. [DOI] [PubMed] [Google Scholar]
- 15. Li Z, Zhong L, Du Z, Chen G, Shang J, Yang Q, Wang Q, Song Y, Zhang G. Network analyses of differentially expressed genes in osteoarthritis to identify hub genes. Biomed Res Int. 2019;2019:8340573. DOI: 10.1155/2019/8340573. [DOI] [PMC free article] [PubMed] [Google Scholar]
- 16. Rzucidlo EM, Martin KA, Powell RJ. Regulation of vascular smooth muscle cell differentiation. J Vasc Surg. 2007;45:25–32. DOI: 10.1016/j.jvs.2007.03.001. [DOI] [PubMed] [Google Scholar]
- 17. Ren XS, Tong Y, Ling L, Chen D, Sun HJ, Zhou H, Qi XH, Chen Q, Li YH, Kang YM, et al. NLRP3 gene deletion attenuates angiotensin II‐induced phenotypic transformation of vascular smooth muscle cells and vascular remodeling. Cell Physiol Biochem. 2017;44:2269–2280. [DOI] [PubMed] [Google Scholar]
- 18. Li R, Yi X, Wei X, Huo B, Guo X, Cheng C, Fang ZM, Wang J, Feng X, Zheng P, et al. EZH2 inhibits autophagic cell death of aortic vascular smooth muscle cells to affect aortic dissection. Cell Death Dis. 2018;9:180. [DOI] [PMC free article] [PubMed] [Google Scholar]
- 19. An Z, Qiao F, Lu Q, Ma Y, Liu Y, Lu F, Xu Z. Interleukin‐6 downregulated vascular smooth muscle cell contractile proteins via ATG4B‐mediated autophagy in thoracic aortic dissection. Heart Vessels. 2017;32:1523–1535. [DOI] [PubMed] [Google Scholar]
- 20. An Z, Liu Y, Song ZG, Tang H, Yuan Y, Xu ZY. Mechanisms of aortic dissection smooth muscle cell phenotype switch. J Thorac Cardiovasc Surg. 2017;154:1511–1521. [DOI] [PubMed] [Google Scholar]
- 21. Lin S, Tan L, Luo D, Peng X, Zhu Y, Li H. Linc01278 inhibits the development of papillary thyroid carcinoma by regulating miR‐376c‐3p/DNM3 axis. Cancer Manag Res. 2019;11:8557–8569. [DOI] [PMC free article] [PubMed] [Google Scholar]


