

Abstract
Nickel oxide nanoparticles (Nano NiO) evoke hepatotoxicity, while whether it affects the hepatic metabolism remains unclear. The aim of this study was to explore the differential metabolites and their metabolic pathways in rat serum and to further verify the potential mechanism of bile acids’ (BAs) metabolism dysregulation after Nano NiO exposure. Sixteen male Wistar rats were intratracheally instilled with Nano NiO (0.24 mg/kg body weight) twice a week for 9 weeks. Liquid chromatography/mass spectrometry was applied to filter the differentially expressed metabolites in rat serum. Western blot was employed to detect the protein contents. Twenty-one differential metabolites that associated with BAs, lipid and phospholipid metabolism pathways were identified in rat serum after Nano NiO exposure. Decreased cholic acid and deoxycholic acid implied that the BAs metabolism was disturbed. The nickel content increased in liver after Nano NiO exposure. The protein expression of cholesterol 7α-hydroxylase (CYP7A1) was down-regulated, and the bile salt export pump was up-regulated after Nano NiO administration in rat liver. Moreover, dehydroepiandrosterone sulphotransferase (SULT2A1) and cytochrome P450 (CYP) 3A4 were elevated in the exposure group. In conclusion, Nano NiO might trigger the disturbances of BAs, lipid and phospholipid metabolism pathways in rats. The diminished serum BAs induced by Nano NiO might be related to the down-regulation of synthetase and to the overexpression of transmembrane protein and detoxification enzymes in BAs metabolism.
Keywords: nickel oxide nanoparticles, metabolomics, metabolic pathway, bile acids
Introduction
Nickel oxide nanoparticles (Nano NiO) are extensively used in many aspects, including sensors, magnetic materials, energy storage devices, catalysts, and food industries, for their excellent properties [1–3]. In these years, considerable attention has been paid to its toxic actions. Shinohara et al. [4] held that a single administration of Nano NiO to rats could elevate the Nano NiO burden in lung, thoracic lymph nodes, and liver after 3, 28, and 90 days by intratracheal instillation. Sutunkova et al. [5] reported that the nickel content raised in lung, brain, liver, and kidney after Nano NiO inhalation at 0.23 ± 0.01 mg/m3 for 4 h per day, five times per week for 10 months in rats. Dumala and Mangalampalli [6] found that the burden of nickel increased in liver, kidney, spleen, blood, brain, heart, and stomatic after Nano NiO exposure by oral gavage for 28 days in rats. Another study showed that nickel accumulated in liver, kidneys, spleen, lung, heart, and brain after Nano NiO oral exposure in rats [7]. Shinohara et al. found that ~11 and 0.70% of spherical NiO nanoparticles and irregular-shaped NiO nanoparticles had dissolved in artificial lysosomal solution after 216 h, respectively. While 2.3–3.7% and 0.14–0.51% of spherical NiO nanoparticles and irregular-shaped NiO nanoparticles had dissolved in saline, hydrogen peroxide, artificial interstitium solution, and pure water at 216 h, respectively [4]. Nano NiO results in oxidative stress, transcriptome alterations, DNA damages, and apoptosis in HepG2 cells [8, 9]. Our previous studies demonstrated that 0.015, 0.06, and 0.24 mg/kg Nano NiO could led to liver damage and apoptosis of hepatic cells via NF-κB, oxidative stress, as well as endoplasmic reticulum stress pathways in rats [10–12]. Nano NiO also evoked epithelial–mesenchymal transition (EMT), and excessive collagen formation occurred in rat liver and in HepG2 cells [13]. Liver is a critical hub for multitudinous bioprocesses, including lipid metabolism, macronutrient metabolism, immune system support, blood volume regulation, and the degradation of exogenous compounds, and dysregulation of lipid metabolism occurs simultaneously with liver injury [14–16]. Taken together, we hypothesized that 0.24 mg/kg Nano NiO-induced hepatic lesions may lead to dysregulation of bile acids (BAs), lipid and phospholipid metabolism.
Metabolomics is routinely applied as an efficient tool for investigating the biomarkers and metabolic pathways. Owing to the inherent sensitivity of metabolomics, subtle transformations in biological pathways can be assayed to provide insights into the mechanisms those which regulate disease processes and physiological conditions [17]. Liquid chromatography (LC)/mass spectrometry (MS) is wildly used in medical science because it can simultaneously monitor abundant and various metabolites in tissues and bio-fluid [18]. Thus, LC/MS was employed to perform metabolites’ identification of the rat serum in this work.
BAs, a major component of bile, are synthesized from cholesterol in the liver. Most of BAs are secreted by hepatocytes responding to fat intake, conjugate with glycine or taurine, and form mixed micelles with phospholipids and cholesterol in the bile [19]. BAs can facilitate the digestion of cholesterol and triglyceride and the efficient absorption of fat-soluble vitamins [20, 21]. Insufficient BAs can lead to cholestasis, failure to thrive, steatorrhea, hepatosplenomegaly, malabsorption of fats and fat-soluble vitamins, and other liver diseases [22].
The main approach of cholesterol elimination is degrading to BAs in liver [23]. As a liver-specific enzyme, cholesterol 7α-hydroxylase (CYP7A1) exists in the endoplasmic reticulum exclusively [24]. It is the rate-limiting enzyme of the BAs synthesis classic pathway [23, 25]. BA pool is composed of ~40% cholic acid (CA), 40% chenodeoxycholic acid (CDCA), 20% deoxycholic acid (DCA), and trace amount of lithocholic acid (LCA). CYP7A1 overexpression in liver enlarges the BA pool of mice [26, 27]. Knockout of prostaglandin E receptor subtype 4 decreases the protein level of Sterol 12α-hydroxylase (CYP8B1) in mice significantly and hence reduces the total bile acid (TBA) in liver [23]. CYP8B1 is required for the synthesis of CA and its metabolites [28], and disruption of CYP8B1 can inhibit the synthesis of cholate in mice [29].
BAs and bile salts have to be eliminated efficiently since they can damage mitochondria and incur hepatic injury [30, 31]. Bile salt export pump (BSEP) is the primary transporter for extruding the bile salts into the bile canaliculi [32]. Multidrug resistance-associated protein 2 (MRP2) is responsible for the transport of bile salts, bilirubin, glucuronide, estrogens, glutathione conjugates, and drugs [30]. BSEP and MRP2 can secrete taurine and glycine conjugated-BAs through the bile canalicular membrane [30, 33]. Since there is no backup transporter for the canalicular export of bile salts, the BSEP inactivation can lead to the intracellular accumulation of bile salts, hence liver damage [34]. MRP3 and MRP4 are basolateral efflux transporters; they transport bile salts and their glucuronides to the bloodstream and this is a salvage mechanism in the inactivation BSEP [33].
CYP3A4 is the most abundant CYP in liver [30, 35]. It can catalyze xenobiotics and endogenous compounds like BAs. BAs and bile salts have to be removed efficiently from hepatocytes due to their cytotoxicity and hepatotoxicity [33]. Sulfation of BAs increases their solubility, decreases their intestinal absorption, and enhances their fecal and urinary excretion. In addition, BA-sulfates are less toxic than their unsulfated counterparts [36]. Therefore, sulfation is an important detoxification pathway of BAs. Dehydroepiandrosterone sulphotransferase (SULT2A1) is highly expressed in the liver, and it can catalyze BAs sulfonation exclusively [37].
In the present work, we hypothesized that 0.24 mg/kg b.w. Nano NiO could lead to metabolic disturbances. LC/MS was used to investigate and screen the differential metabolites of rat serum in order to find some metabolic pathways in the liver after Nano NiO exposure. Afterward, we measured the contents of CYP7A1, CYP8B1, BSEP, MRP2, MRP3, MRP4, CYP3A4, and SULT2A1 in the liver to confirm the underlying mechanism of BAs metabolism dysregulation that was induced by Nano NiO.
Materials and Methods
Preparation of Nano NiO suspension
Nano NiO was obtained from ST-Nano Science and Technology Co, Ltd (Shanghai, China). We autoclaved Nano NiO particles and used an ultrasonic homogenizer (ColeParmer, CP750, Vernon Hills, Illinois) to make Nano NiO suspension. Characters of Nano NiO, including sizes (20 nm), specific surface area (60 m2/g), hydrodynamic sizes (244.5 nm) and endotoxin (negative), crystal structure, and chemical composition, were tested in our previous study [10].
Animals and treatment
Sixteen healthy male Wistar rats (190–230 g b.w.) were obtained from the Experimental Animal Center of Lanzhou University (SCXK 2018-0002, Lanzhou, China). The rats were housed in a room with a lighting schedule of 12 h alternate light–dark cycles, relative humidity (60%), and set temperature (20 ± 2°C) to adapt to the new feeding environment for 1 week before the Nano NiO exposure. All rats received humane care according to the Lanzhou University Ethical Committee rules.
The rats were divided into two groups. We chose instillation method for the experiment.
Rats were anesthetized and fixed to keep the neck be vertical. Rat mouth was opened with a tongue depressor, and the neck was illuminated with a flashlight through skin. At this time, the rat’s throat could be seen through the mouth, and the trachea goes dark and light with breathing. Then, the Nano NiO suspension (a volume of 1 ml/kg) was injected into the trachea slowly with a syringe. Finally, the rats were put in a warm and ventilated place to wake up.
Rats of control group were intratracheally instilled with normal saline, and Nano NiO group was intratracheally instilled with Nano NiO (0.24 mg/kg b.w.) twice a week for 9 weeks. Afterward, the rats were sacrificed with cervical dislocation, the blood was drawn from heart, and then the serum was isolated for LC/MS-based metabolomics analysis.
Untargeted metabolomics analysis by LC/MS
Metabolites extraction
Twenty microliters of sample was extracted by using 120 μl of precooled 50% methanol, vortexed for 1 min, and incubated at 25°C for 10 min, and the extracted mixtures were then stored at −20°C for 12 h. After centrifugation at 4000 g for 20 min, the supernatant was transferred into 96-well plates and was stored at −80°C before the LC/MS analysis. In addition, pooled quality control (QC) samples were prepared by blending 10 μl of each extracted mixture.
LC/MS parameter
All samples were prepared using the LC/MS system followed by machine orders. An ultraperformance liquid chromatography (UPLC) system (SCIEX, UK) was utilized to perform chromatographic separations. The reversed phase separation was completed by using an ACQUITY UPLC T3 column (100 × 2.1 mm, 1.8 μm, Waters, UK). The column oven was kept at 35°C, and the flow rate was 0.4 ml/min. The mobile phase formatted by Solvent A (0.1% formic acid, deionized water) and Solvent B (0.1% formic acid, acetonitrile). Gradient elution conditions were set as follows: 5% B, 0~0.5 min; 5–100% B, 0.5~7 min; 100% B, 7~8 min; 100–5% B, 8~8.1 min; 5% B, 8.1~10 min. Four microliters injection volume was chosen for each sample.
The metabolites eluted from the column were detected by employing a high-resolution tandem mass spectrometer TripleTOF5600plus (SCIEX, UK). The Q-TOF was handled in both positive and negative ion modes. The curtain gas was set at 30 PSI, Ion source gas 1 was set at 60 PSI, Ion source gas 2 was set at 60 PSI, and an interface heater temperature was 650°C. In the positive ion mode, the ionspray voltage floating was set at 5000 V. In the negative ion mode, the ionspray voltage floating was set at −4500 V. The MS data were collected in the information dependent acquisition (IDA) mode. The TOF mass range was from 60 to 1200 Da. The survey scans completed in 150 ms, and as many as 12 product ion scans were acquired if exceeding the threshold of 100 counts per second and with a 1 + charge-state. Total cycle time was 0.56 s. Four times bins were summed for each scan at a pulser frequency value of 11 kHz through monitoring of the 40-GHz multichannel TDC detector with four-anode/-channel detection. Dynamic exclusion was fixed to 4 s. During the collection, the mass accuracy was operated every 20 samples. Besides, a QC sample (pool of all samples) was acquired after every 10 samples to evaluate the stability of the LC/MS during the whole collection.
Data analysis
The collected MS data pretreatments, including peak grouping peak, picking, second peak grouping, retention time (RT) correction, and annotation of isotopes and adducts, were operated using XCMS software. The raw data files of LC/MS were converted into mzXML format, then operated by the XCMS, CAMERA, and metaX toolbox implemented by using a R software. RT and mass-to-charge rate m/z data were used to identify each ion. We recorded intensities of each peaks and generated a 3D matrix containing arbitrarily assigned peak indices (RT–m/z pairs), sample names, and ion intensity information.
We used the online KEGG (https://www.genome.jp/kegg/pathway.html) and HMDB (http://www.hmdb.ca/metabolites/) databases to annotate the metabolites by matching the m/z of samples with those from the database. The metabolites whose mass difference between the observed and database value was less than 10 ppm would be annotated, and the molecular formula of the metabolites would be identified and validated by the isotopic distribution measurements furtherly. An in-house fragment spectrum library of metabolites was utilized to validate the metabolite identification.
We applied metaX to preprocess the intensity data. In order to further improve the data quality, those features that were tested in less than 50% of QC samples or 80% of biological samples were excluded. The remaining peaks with missing values were imputed with the k-nearest neighbor algorithm. Pre-processed dataset was used to perform principal component analysis (PCA) for outlier detection and batch effects evaluation. Robust LOESS signal correction based on QC was fitted to the QC data with respect to the order of injection to minimize signal intensity drift over time. Additionally, we calculated the relative standard deviations (SDs) of the metabolic features of all QC samples and then removed those which were >30%.
Student’s t-test was employed to detect the differences in metabolite concentrations between the two groups. The FDR (Benjamini–Hochberg) was used to adjust the P value of multiple tests. Supervised partial least squares-discriminant analysis (PLS-DA) was conducted through metaX to distinguish the different variables between the two groups. We also calculated the VIP value and utilized a VIP cut-off value of 1.5 to select important features.
Determination of nickel concentration in liver
The assay of nickel was performed by the Analysis and Testing Center, Lanzhou University, China. Liver tissues (2.0 g) were accumulated for the quantitative measurement of nickel concentration. Briefly, the samples were incubated in 0.5 ml of sulfuric acid at 200°C for carbonization. Two microliters of perchloric acid were added to cooled samples, and then the samples were heated to 200°C again until the liquid became transparent. After being dissolved with 5 ml of aqua regia, the final volume of the suspension was adjusted to 10 ml, then the nickel concentration was analyzed by using a Graphite Furnace Atomic Absorption Spectrophotometer (Varian, USA).
Western blot
Approximately, 95 mg liver tissue was separated from the middle lobe and was homogenized in 1 ml of RIPA buffer (Sloarbio Life Science, China) containing 10 μl of protease inhibitor and 10 μl of phosphatase inhibitors. Then, the supernatant was collected by centrifugation at 14 000 g and 4°C for 10 min. After proteins were extracted from the liver tissues, the concentrations were tested using a bicinchoninic acid total protein quantification kit (Nanjing Jiancheng, China). Target proteins (34–220 kDa) were separated by using 6–10% of SDS-polyacrylamide gel and were transferred to the polyvinylidene difluoride (PVDF) membranes (Millipore, USA), which were then blocked with 5% skimmed milk diluted by Tris Buffered Saline Tween (TBST). The membranes were incubated overnight at 4°C with primary antibodies, respectively, including CYP7A1 (1:1000 dilution), CYP8B1 (1:1000 dilution), BSEP (1:500 dilution), MRP2 (1:1000 dilution) (Abcam, UK), MRP3 (1:500 dilution), CYP3A4 (1:500 dilution) (Cell Signaling Technology, USA), MRP4 (1:500 dilution), SULT2A1 (1:500 dilution), and β-actin (1:500 dilution) (Signalway Antibody, USA), and were subsequently incubated with goat anti-rabbit secondary antibodies (1:4000 dilution) (Signalway Antibody, USA). Membranes were washed with TBST 5 min for five times. Afterward, the protein bands were visualized in a Molecular Imager ChemiDoc XRS System (Bio-Rad, USA) with super Electro-Chemi-Luminescence (ECL) plus kits (Beyotime, China). The semi-quantitative analysis of target proteins was operated with an Image-Pro Plus 6.0 software (Media Cybernetics, USA). Relative protein level was expressed as the ratio of the band intensity of the target protein compared with β-actins.
Statistical analysis
The data of nickel content and western blot were expressed by mean ± SD, and SPSS 20.0 was employed to perform the comparison between the two groups by Student’s t-test. P < 0.05 indicated significant difference.
Results
The metabolic effects of Nano NiO on rat serum
In the PCA and PLS-DA maps, each spot represents a sample and each assembly of samples indicates a particular metabolic pattern of the two groups. An additional PLS-DA scores plot was generated for PCA from the LC/MS data. The PCA scores plot of the two groups showed that there is a clear separation between the control group and Nano NiO group in the plot regarding serum samples (Fig. 1). These findings implied that the changes of serum metabolites could be caused by Nano NiO.
Figure 1.
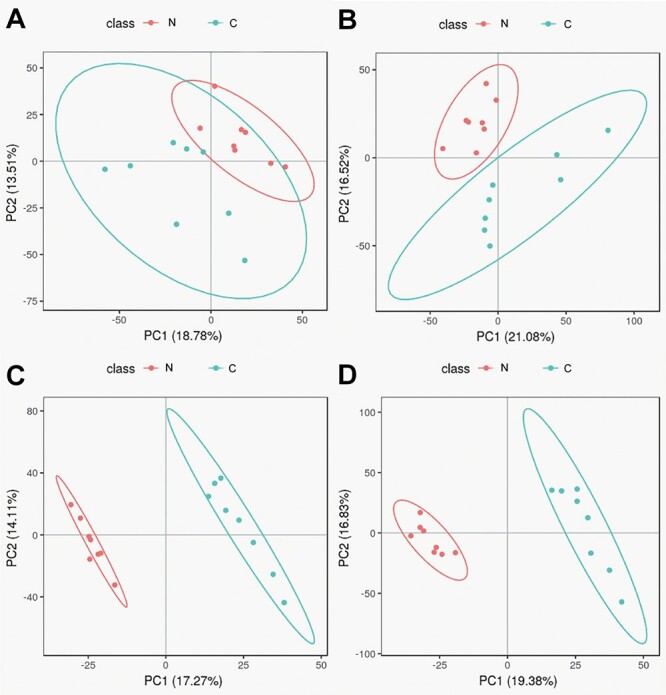
PCA scores and PLS-DA scores in negative and positive modes; (A) PCA score in negative mode; (B) PCA score in positive mode; (C) PLS-DA score in negative mode; and (D) PLS-DA score in positive mode; N, Nano NiO group; C, control group.
Metabolomics data were used to evaluate the difference of metabolism spectrum between the control group and Nano NiO group. The metabolites (fold change ≥ 2 or ≤0.5, VIP > 1.5, and P value ≤ 0.05) were identified by matching RT and m/s with KEGG or HMDB databases. Altogether, 21 differential metabolites, including 16 in negative mode and 5 in positive mode, were discovered (Table 1 and Fig. 2).
Table 1.
Identification results of potential biomarkers relate to Nano NiO exposure in negative and positive modes
| Mode | Name | m/z | RT (s) | VIP | P |
|---|---|---|---|---|---|
| neg | 3,7-Dihydroxy-12-oxocholanoic acid | 405.261 | 2.947 | 3.488 | 0.021 |
| neg | CA | 407.277 | 2.882 | 2.627 | 0.022 |
| neg | DCA | 437.288 | 3.151 | 2.675 | 0.047 |
| neg | LysoPI 16:0 | 571.285 | 4.226 | 3.050 | 0.000 |
| neg | LysoPI 18:2 | 595.286 | 3.884 | 2.740 | 0.000 |
| neg | LysoPI 18:1 | 597.301 | 4.527 | 2.480 | 0.000 |
| neg | LysoPI 18:0 | 599.318 | 8.148 | 2.611 | 0.000 |
| neg | LysoPI 20:4 | 619.286 | 3.875 | 3.521 | 0.000 |
| neg | LysoPI 20:3 | 621.300 | 4.212 | 3.601 | 0.000 |
| neg | LysoPI 22:6 | 643.285 | 3.830 | 3.986 | 0.000 |
| neg | LysoPI 22:5 | 645.300 | 4.041 | 4.153 | 0.000 |
| neg | Allochenodeoxycholic acid | 437.288 | 3.607 | 3.246 | 0.011 |
| neg | Ursocholic acid | 453.283 | 2.905 | 3.078 | 0.024 |
| neg | Isoleptospermone | 265.146 | 3.900 | 2.306 | 0.000 |
| neg | 2-Hydroxyethinylestradiol | 311.166 | 4.436 | 3.367 | 0.000 |
| pos | 6,10,14-Trimethyl-5,9,13-pentadecatrien-2-one | 263.237 | 6.948 | 2.553 | 0.000 |
| pos | Methyl arachidonate | 319.264 | 6.743 | 3.151 | 0.000 |
| pos | Anileridine | 353.230 | 2.986 | 1.962 | 0.001 |
| pos | 1,1′-[1,12-Dodecanediylbis(oxy)] bisbenzene | 355.263 | 3.106 | 2.330 | 0.026 |
| neg | Cardanoldiene | 345.241 | 4.401 | 1.989 | 0.006 |
| pos | 2-Acetoxy-4-pentadecylbenzoic acid | 413.266 | 7.137 | 2.171 | 0.000 |
Note: neg, negative; pos, positive.
Figure 2.
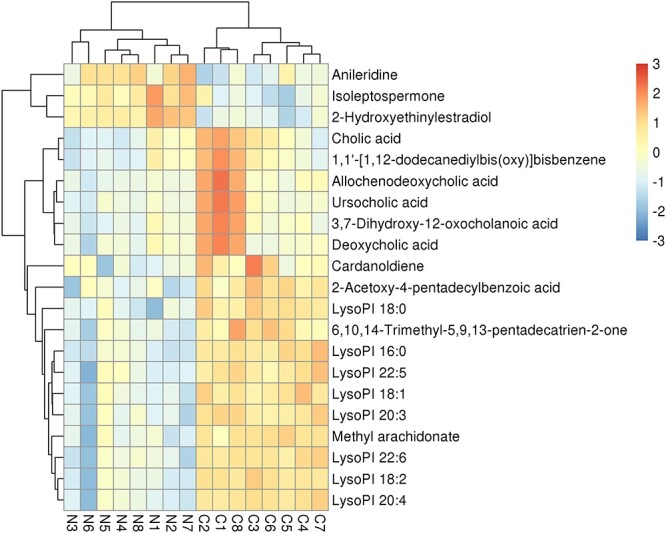
Heatmap plot presented Nano NiO-induced differential metabolites between the control group and Nano NiO group in rat serum; N, Nano NiO group; C, control group.
Total ion flow chromotogram (TIC) is the total ion flow diagram, which takes the time point as the abscissa and the sum of the intensities of all ions in the mass spectrum at each time point as the ordinate. TIC reflected that the metabolites separated well in LC (Figs 3 and 4).
Figure 3.
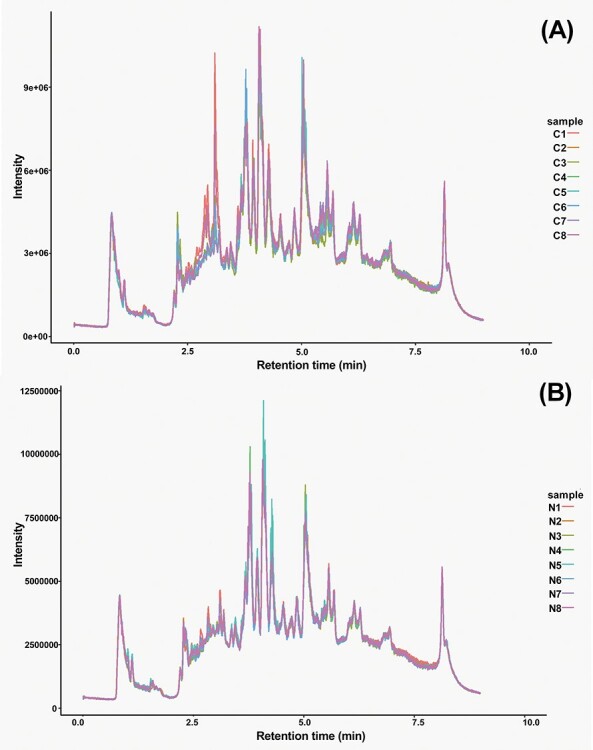
TIC of rat serum metabolites in Nano NiO group and control group in negative model; (A) TIC of control group in negative model, C1–C8 means sample of control group; (B) TIC of Nano NiO group in negative model, N1–N8 means sample of Nano NiO group.
Figure 4.
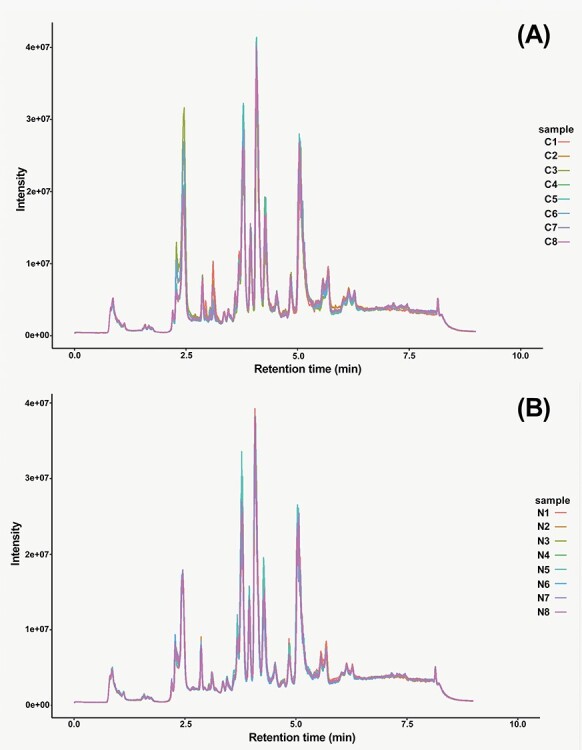
TIC picture of rat serum metabolites in Nano NiO group and control group in positive model; (A) TIC of control group in positive model, C1–C8 means sample of control group; (B) TIC of Nano NiO group in positive model, N1–N8 means sample of Nano NiO group.
Figure 5 shows that 21 differentially expressed serum metabolites were pertained to the pathways of BAs, lipid and phospholipid metabolism. The Student’s t-test was performed with a significance threshold at P = 0.05. Fold changes of intensity that were obtained from the ratio of arithmetic mean values for the metabolites in Nano NiO group were calculated and compared to those in the control group.
Figure 5.
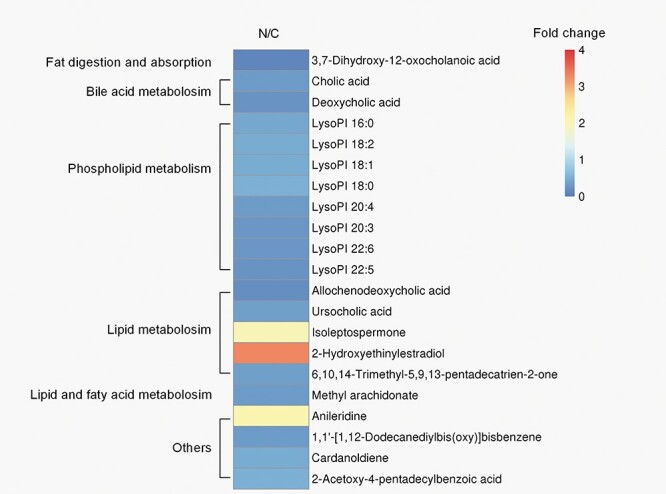
the metabolic pathways associated with the 21 differentially expressed metabolites in rat serum; the fold changes of the arithmetic mean value (P < 0.05) of Nano NiO-induced changes of metabolites in serum; N, Nano NiO group; C, control group.
The content of nickel in rat liver
As depicted in Fig. 6, the results of Graphite Furnace Atomic Absorption Spectrophotometer show that the content of nickel of Nano NiO group (0.134 ± 0.084 mg/kg) in the liver was higher than that of the control group (0.061 ± 0.025 mg/kg) (P < 0.05).
Figure 6.
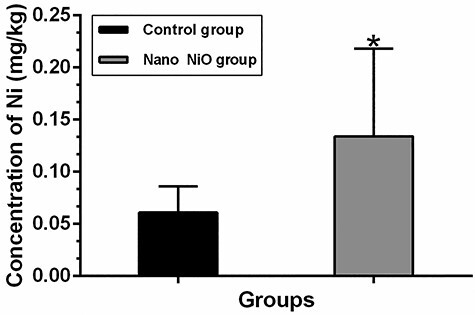
the content of nickel in rat liver; values were expressed with mean ± SD (n = 8); *P < 0.05 indicates significant differences compared with the control.
Effects of Nano NiO on proteins of BAs metabolism pathway in rat liver
The contents of CYP7A1 and CYP8B1 were detected by western blot to confirm whether Nano NiO could affect the BAs synthesis in rat liver. As shown in Fig. 7A, the protein expression of CYP7A1 was down-regulated in the Nano NiO group (P < 0.05). However, Nano NiO has no significant effect on the CYP8B1 content (P > 0.05; Fig. 7B).
Figure 7.
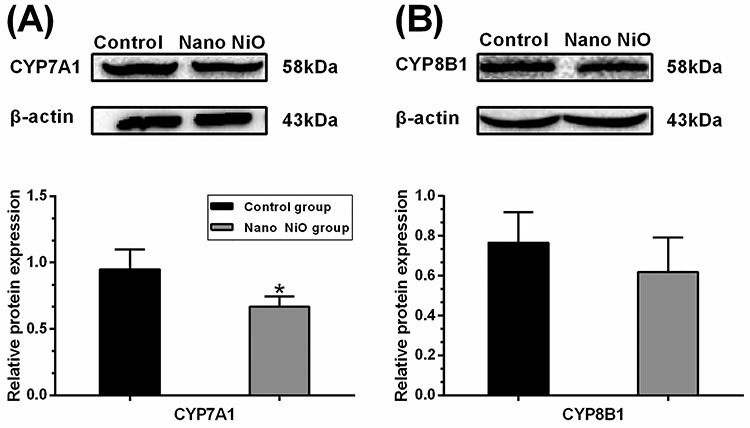
Nano NiO-induced abnormal expression of BAs synthesis proteins in rat liver; rats were treated with Nano NiO (0.24 mg/kg) twice a week for 9 weeks; (A) protein bands and semi-quantitative analysis of CYP7A1; (B) protein bands and semi-quantitative analysis of CYP8B1; values were expressed with mean ± SD (n = 5); *P < 0.05 indicates significant difference compared with the control.
As shown in Fig. 8A, protein expression of BSEP in the Nano NiO group was higher than that of the control group (P < 0.05). However, Nano NiO had no obvious effect on the protein level of MRP2 (P > 0.05; Fig. 8A). The protein contents of MRP3 and MRP4 had no significant change in the Nano NiO group when compared with the control group (P > 0.05; Fig. 8B), and this hinted that Nano NiO had no significant effect on the transport of BAs into the blood stream.
Figure 8.
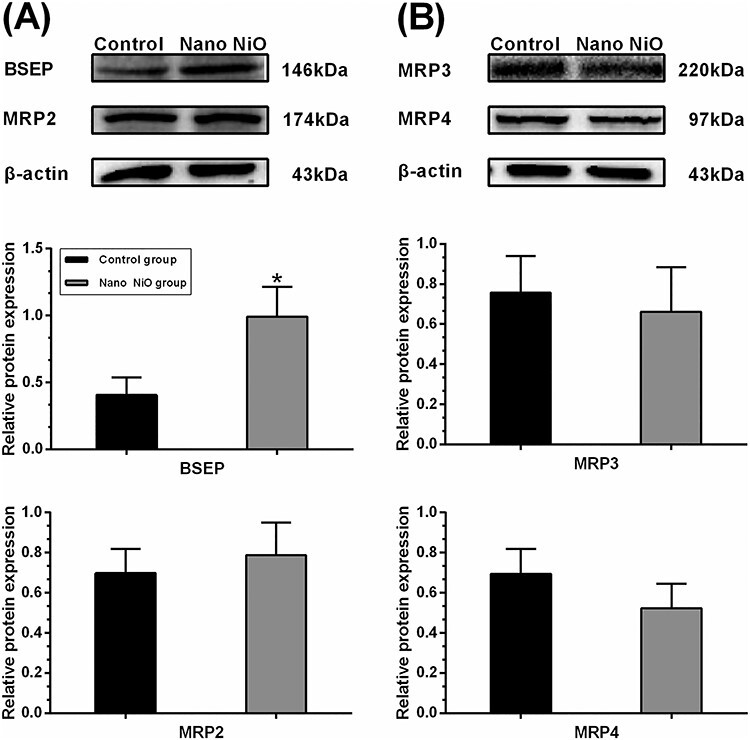
effects of Nano NiO on transporters of BAs in rat liver; rats were administrated with Nano NiO (0.24 mg/kg) twice a week for 9 weeks; (A) protein bands and semi-quantitative analysis of BESP and MRP2; (B) protein bands and semi-quantitative analysis of MRP3 and MRP4; values were expressed with mean ± SD (n = 5); *P < 0.05 indicates significant difference compared with the control.
CYP3A4 and SULT2A1, the two important enzymes which contribute to the detoxification of BAs, were detected to verify whether Nano NiO could interfere with the process of BAs detoxification. The contents of CYP3A4 and SULT2A1 in the Nano NiO group were higher than that of the control (P < 0.05; Fig. 9), which suggested that Nano NiO led to the dysregulation of BAs metabolism via activating its detoxification enzymes.
Figure 9.
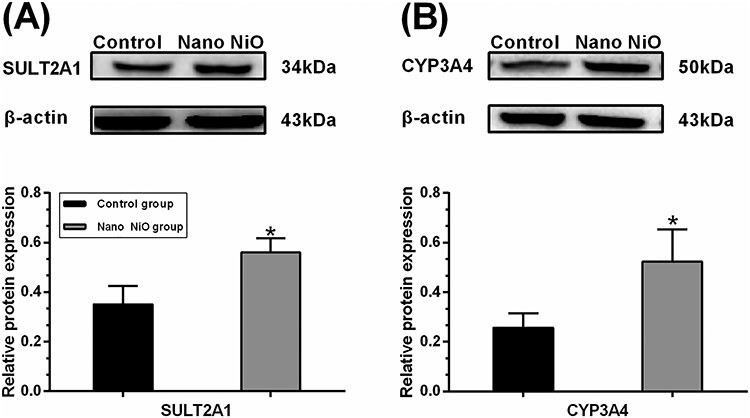
Nano NiO affected the detoxification enzymes of BAs in rat liver; rats were exposed to Nano NiO (0.24 mg/kg) twice a week for 9 weeks; (A) protein bands and semi-quantitative analysis of CYP3A4; (B) protein bands and semi-quantitative analysis of SULT2A1; values were expressed with mean ± SD (n = 5); *P < 0.05 indicates significant differences compared with the control.
Discussion
Nano NiO can deposit to lung, liver, kidney, spleen, thoracic lymph nodes, heart, and brain through the blood circulatory system, after the rats were exposed to Nano NiO by oral gavage, inhalation and intratracheal instillation, hence induced organ injury [4–7]. Our previous studies found that hepatic toxicity exerts through oxidative stress and NF-κB signaling pathway after the Nano NiO intratracheal instillation [10, 12]. As shown in this study, the nickel content of liver was elevated in the Nano NiO group, implying that the accumulated Nano NiO could be contributed to the hepatic lesion in rats.
As a hub of lipid metabolism, the liver plays a pivotal role in fatty acid synthesis and lipid circulation [38]. Lipid metabolism, including BAs, lipid, fatty acid, phospholipid metabolism, etc., is incurred simultaneously with liver injury generally [14, 15]. In the present study, the metabolomics results pointed out that 21 metabolites linked to BAs, lipid, fatty acid, and phospholipid metabolism pathways were changed in rat serum after the Nano NiO exposure. It suggested that Nano NiO-induced hepatic injury could be involved in the dysregulation of lipid, fatty acid, and phospholipid metabolisms. In this study, we focused on the decreases of serum CA and DCA in the Nano NiO group. CA is a main component of primary BAs, and DCA is a major secondary BAs [39, 40]. Therefore, we supposed that Nano NiO could disturb the BAs metabolism pathway. The proteins in the synthesis, transport, and detoxification process of BAs were chosen to verify the potential mechanisms underlying the disturbance of BAs induced by Nano NiO.
Serum BAs level reflects their synthesis process generally [41]. CYP7A1 is the rate-limiting enzyme in the BAs biosynthetic pathway in the liver, and it plays a critical role in mediating lipid, glucose, and energy metabolisms [28]. CYP8B1 is an essential catalytic enzyme in CA synthesis. CYP8B1 disruption in mice prevents the synthesis of cholate [29]. Gerbod-Giannone et al. [42] hold that C-36 peptide reduced the BAs biosynthesis rate by lowering the CYP7A1 mRNA level in rat hepatocytes. Another study demonstrated that geniposide (GE) inhibited the biosynthesis of BAs by down-regulating the protein expression of CYP7A1 and CYP8B1 in rats [43]. Additionally, the GW4064-induced farnesoid X receptor (FXR) activation can lead to the decrease of BAs through suppressing the protein contents of CYP7A1 and CYP8B1 in rats [44]. In our present study, the contents of CA and DCA were decreased in rat serum; meanwhile, the protein level of CYP7A1 was diminished after Nano NiO administration, which suggested that CYP7A1 contributed to the Nano NiO-induced the disorder of BAs. However, Nano NiO had no significant effect on the content of CYP8B1 in liver, hinting that CYP8B1 would be not associated with the disorder of BAs synthesis.
BSEP is the primary transporter protein which extrudes the bile salts from hepatocytes into the bile canaliculi, and it is considered to be a rate-limiting step for hepatobiliary BAs excretion [30, 45]. Absence of BSEP in human can result in the progressive familial intrahepatic cholestasis type 2. In the case of BSEP deficiency, BAs hydroxylation, biliary cholesterol, and phospholipid output can increase to adapt its transformation in mice [46]. Yinzhihuang (a Chinese patent medicine) reverses the α-naphthylisothiocyanate (ANIT)-induced down-regulation of MRP2 and BSEP, hence reduces the serum TBA significantly in rats [47]. Salvianolic acid B alleviates the serum TBA by up-regulating the BSEP in rats and in human cell lines, and this attenuates the ANIT-induced cholestatic [48]. In our study, the content of BESP was increased by Nano NiO in rat liver, which could be a possible reason for BAs metabolism disorder.
MRP2 is responsible for transporting bilirubin, glucuronide, estrogens, glutathione conjugates, bile salts, and drugs [14]. Notably, MRP2 transports the hepatic BAs into bile duct [49]. Deficiency and inactivity of MRP2 result in intrahepatic cholestasis, which can be reversed by Yinzhihuang [47]. As shown in Fig. 8A, Nano NiO had no significant effect on the MRP2 expression, which suggested that MRP2 may not be correlated to BAs reduction in the rat serum.
As the important efflux pumps of the basolateral hepatocyte membrane, MRP3 and MRP4 are considered as the prominent BAs efflux transporters, when the biliary excretion mediated by BSEP is impaired [26, 50]. MRP3 and MRP4 are involved in ATP-dependent BAs export and they keep low liver expression in normal physiologic conditions those which can be up-regulated under cholestatic conditions [51, 52]. In the present study, the protein levels of MRP3 and MRP4 had no obvious change in the Nano NiO group, which implied that MRP3 and MRP4 may be not involved in the Nano NiO-induced BAs metabolic disorder.
Detoxification of BAs can be catalyzed by CYP3A4 and SULT2A1 [50]. As a key enzyme of BAs detoxification, CYP3A4 hydrolyzes BAs to facilitate its subsequent glucuronidation by UDP-glucuronosyltransferases [53]. CYP3A4 can be activated by ursodeoxycholic acid and rifampicin through nuclear pregnane X receptor, and this can effectively reduce the BAs levels in liver and blood [35, 53]. In our present study, CA and DCA decreased in the rat serum of the Nano NiO group, while CYP3A4 protein was up-regulated in liver, which indicated that the overexpressed CYP3A4 could be closely related to the BAs reduction induced by Nano NiO.
SULT2A1 is a sulfo-conjugating phase II enzyme and plays a significant role in the detoxification of BAs by catalyzing its sulfonation [37]. Alisol B 23-acetate results in the up-regulation of SULT2A1 in liver by activating FXR, which further alleviates the ANIT-induced increase of serum TBA [54]. Our results found that the protein level of SULT2A1 was elevated by Nano NiO with attenuation of serum CA and DCA, which reminded that the reduction of serum BAs could be related to the up-regulation of SULT2A1 after the Nano NiO exposure.
Though many signaling pathways contribute to BAs metabolism, FXR and G protein BA receptor-1 are most concerned receptors [27]. The further study should focus on the signaling pathways that relate to the abovementioned receptors. Moreover, the relations between Nano NiO and lipid, fatty acid, as well as phospholipid metabolism pathways should be investigated thoroughly.
In summary, the results indicated that Nano NiO could induce the disorders of BAs, lipid, fatty acid, and phospholipid metabolism pathways. Intratracheally instilled Nano NiO could increase Nano NiO burden in the liver. The protein level of CYP7A1 was up-regulated, while BSEP, CYP3A4, and SULT2A1 were decreased by Nano NiO. The possible mechanism underlying the disorder of BAs induced by Nano NiO was associated with the synthesis, transport, and detoxification of BAs in rat liver. This study could provide some clues for discovering the biomarkers of hepatic lesion and could shed light on the safety evaluation of Nano NiO.
Acknowledgements
The authors would like to thank LC-Bio Technologies (Hang Zhou) Co, Ltd (Hangzhou, China) for performing the metabolomics experiments and preliminary data analysis. This work was supported by the National Natural Science Foundation of China (number 31872757), the Innovation Project for the Talents of Lanzhou city (number 2107-RC-79), and the Fundamental Research Funds for the Central Universities, China (number lzujbky-2019-47).
Contributor Information
Qiong Zhang, Department of Toxicology, School of Public Health, Lanzhou University, 199 Donggang West Road, Chengguan District, Lanzhou 730000, China.
Xuhong Chang, Department of Toxicology, School of Public Health, Lanzhou University, 199 Donggang West Road, Chengguan District, Lanzhou 730000, China.
Xiaoxia Wang, Department of Toxicology, School of Public Health, Lanzhou University, 199 Donggang West Road, Chengguan District, Lanzhou 730000, China.
Haibing Zhan, Department of Toxicology, School of Public Health, Lanzhou University, 199 Donggang West Road, Chengguan District, Lanzhou 730000, China.
Qing Gao, Department of Toxicology, School of Public Health, Lanzhou University, 199 Donggang West Road, Chengguan District, Lanzhou 730000, China.
Mengmeng Yang, Department of Toxicology, School of Public Health, Lanzhou University, 199 Donggang West Road, Chengguan District, Lanzhou 730000, China.
Han Liu, Department of Toxicology, School of Public Health, Lanzhou University, 199 Donggang West Road, Chengguan District, Lanzhou 730000, China.
Sheng Li, The First People’s Hospital of Lanzhou City, Lanzhou 730050, China.
Yingbiao Sun, Department of Toxicology, School of Public Health, Lanzhou University, 199 Donggang West Road, Chengguan District, Lanzhou 730000, China.
Conflict of interest statement
The author declared that there is no conflict of interest.
References
- 1. Chen CC, Chang FC, Peng CY et al. Conducting glasses recovered from thin film transistor liquid crystal display wastes for dye-sensitized solar cell cathodes. Environ Technol 2015;36:3008–12. [DOI] [PubMed] [Google Scholar]
- 2. He H, Yang S, Yu K et al. Microwave induced catalytic degradation of crystal violet in nano-nickel dioxide suspensions. J Hazard Mater 2010;173:393–400. [DOI] [PubMed] [Google Scholar]
- 3. Mu Y, Jia D, He Y et al. Nano nickel oxide modified non-enzymatic glucose sensors with enhanced sensitivity through an electrochemical process strategy at high potential. Biosens Bioelectron 2011;26:2948–52. [DOI] [PubMed] [Google Scholar]
- 4. Shinohara N, Zhang G, Oshima Y et al. Kinetics and dissolution of intratracheally administered nickel oxide nanomaterials in rats. Part Fibre Toxicol 2017;14:48–61. [DOI] [PMC free article] [PubMed] [Google Scholar]
- 5. Sutunkova MP, Solovyeva SN, Minigalieva IA et al. Toxic effects of low-level long-term inhalation exposures of rats to nickel oxide nanoparticles. Int J Mol Sci 2019;20:1778–91. [DOI] [PMC free article] [PubMed] [Google Scholar]
- 6. Dumala N, Mangalampalli B. Repeated oral dose toxicity study of nickel oxide nanoparticles in Wistar rats: a histological and biochemical perspective. J Appl Toxicol 2019;39:1012–29. [DOI] [PubMed] [Google Scholar]
- 7. Dumala N, Mangalampalli B, Chinde S et al. Genotoxicity study of nickel oxide nanoparticles in female Wistar rats after acute oral exposure. Mutagenesis 2017;32:417–27. [DOI] [PubMed] [Google Scholar]
- 8. Ahamed M, Ali D, Alhadlaq HA et al. Nickel oxide nanoparticles exert cytotoxicity via oxidative stress and induce apoptotic response in human liver cells (HepG2). Chemosphere 2013;93:2514–22. [DOI] [PubMed] [Google Scholar]
- 9. Saquib Q, Siddiqui MA, Ahmad J et al. Nickel oxide nanoparticles induced transcriptomic alterations in HEPG2 cells. Adv Exp Med Biol 2018;1048:163–74. [DOI] [PubMed] [Google Scholar]
- 10. Liu F, Chang X, Tian M et al. Nano NiO induced liver toxicity via activating the NF-kappaB signaling pathway in rats. Toxicol Res 2017;6:242–50. [DOI] [PMC free article] [PubMed] [Google Scholar]
- 11. Chang X, Liu F, Tian M et al. Nickel oxide nanoparticles induce hepatocyte apoptosis via activating endoplasmic reticulum stress pathways in rats. Environ Toxicol 2017;32:2492–9. [DOI] [PubMed] [Google Scholar]
- 12. Yu S, Liu F, Wang C et al. Role of oxidative stress in liver toxicity induced by nickel oxide nanoparticles in rats. Mol Med Rep 2018;17:3133–9. [DOI] [PubMed] [Google Scholar]
- 13. Zhang Q, Chang X, Wang H et al. TGF-beta1 mediated Smad signaling pathway and EMT in hepatic fibrosis induced by Nano NiO in vivo and in vitro. Environ Toxicol 2020;35:419–29. doi: 10.1002/tox.22878. [DOI] [PubMed] [Google Scholar]
- 14. Nagappan A, Jung DY, Kim JH et al. Gomisin N alleviates ethanol-induced liver injury through ameliorating lipid metabolism and oxidative stress. Int J Mol Sci 2018;19:2601. doi: 10.3390/ijms19092601. [DOI] [PMC free article] [PubMed] [Google Scholar]
- 15. Li W, Lu Y. Hepatoprotective effects of sophoricoside against fructose-induced liver injury via regulating lipid metabolism, oxidation, and inflammation in mice. J Food Sci 2018;83:552–8. [DOI] [PubMed] [Google Scholar]
- 16. Trefts E, Gannon M, Wasserman DH. The liver. Curr Biol 2017;27:R1147–51. [DOI] [PMC free article] [PubMed] [Google Scholar]
- 17. Johnson CH, Ivanisevic J, Siuzdak G. Metabolomics: beyond biomarkers and towards mechanisms. Nat Rev Mol Cell Biol 2016;17:451–9. [DOI] [PMC free article] [PubMed] [Google Scholar]
- 18. Li B, Tang J, Yang Q et al. Performance evaluation and online realization of data-driven normalization methods used in LC/MS based untargeted metabolomics analysis. Sci Rep 2016;6:38881. doi: 10.1038/srep38881. [DOI] [PMC free article] [PubMed] [Google Scholar]
- 19. Li M, Cai SY, Boyer JL. Mechanisms of bile acid mediated inflammation in the liver. Mol Aspects Med 2017;56:45–53. [DOI] [PMC free article] [PubMed] [Google Scholar]
- 20. Di Ciaula A, Garruti G, Lunardi Baccetto R et al. Bile acid physiology. Ann Hepatol 2017;16:s4–14. [DOI] [PubMed] [Google Scholar]
- 21. Saeed A, Hoekstra M, Hoeke MO et al. The interrelationship between bile acid and vitamin A homeostasis. Biochim Biophys Acta Mol Cell Biol Lipids 2017;1862:496–512. [DOI] [PubMed] [Google Scholar]
- 22. Ahmad O, Nogueira J, Heubi JE et al. Bile acid synthesis disorder masquerading as intractable vitamin D-deficiency rickets. J Endocr Soc 2019;3:397–402. [DOI] [PMC free article] [PubMed] [Google Scholar]
- 23. Ying F, Cai Y, Wong HK et al. EP4 emerges as a novel regulator of bile acid synthesis and its activation protects against hypercholesterolemia. Biochim Biophys Acta Mol Cell Biol Lipids 2018;1863:1029–40. [DOI] [PubMed] [Google Scholar]
- 24. Wang Y, Ding Y, Li J et al. Targeting the enterohepatic bile acid signaling induces hepatic autophagy via a CYP7A1-AKT-mTOR axis in mice. Cell Mol Gastroenterol Hepatol 2017;3:245–60. [DOI] [PMC free article] [PubMed] [Google Scholar]
- 25. Pikuleva IA. Cytochrome P450s and cholesterol homeostasis. Pharmacol Ther 2006;112:761–73. [DOI] [PubMed] [Google Scholar]
- 26. Donepudi AC, Ferrell JM, Boehme S et al. Deficiency of cholesterol 7 alpha-hydroxylase in bile acid synthesis exacerbates alcohol-induced liver injury in mice. Hepatol Commun 2018;2:99–112. [DOI] [PMC free article] [PubMed] [Google Scholar]
- 27. Chiang JY. Bile acid metabolism and signaling [M]. In: Comprehensive Physiology. John Wiley & Sons, Inc., 2013;3:1191–212. [DOI] [PMC free article] [PubMed] [Google Scholar]
- 28. Sayin SI, Wahlstrom A, Felin J et al. Gut microbiota regulates bile acid metabolism by reducing the levels of tauro-beta-muricholic acid, a naturally occurring FXR antagonist. Cell Metab 2013;17:225–35. [DOI] [PubMed] [Google Scholar]
- 29. Li-Hawkins J, Gafvels M, Olin M et al. Cholic acid mediates negative feedback regulation of bile acid synthesis in mice. J Clin Invest 2002;110:1191–200. [DOI] [PMC free article] [PubMed] [Google Scholar]
- 30. Urquhart BL, Tirona RG, Kim RB. Nuclear receptors and the regulation of drug-metabolizing enzymes and drug transporters: implications for interindividual variability in response to drugs. J Clin Pharmacol 2007;47:566–78. [DOI] [PubMed] [Google Scholar]
- 31. Li T, Apte U. Bile acid metabolism and signaling in cholestasis, inflammation, and cancer. Adv Pharmacol (San Diego, Calif) 2015;74:263–302. [DOI] [PMC free article] [PubMed] [Google Scholar]
- 32. Hryca E, Forrest D, Liu L et al. Hepatic bile acid metabolism and expression of cytochrome P450 and related enzymes are altered in Bsep (−/−) mice. Mol Cell Biochem 2014;389:119–32. [DOI] [PubMed] [Google Scholar]
- 33. Ding L, Yang L, Wang Z et al. Bile acid nuclear receptor FXR and digestive system diseases. Acta Pharm Sin B 2015;5:135–44. [DOI] [PMC free article] [PubMed] [Google Scholar]
- 34. Jacquemin E. Progressive familial intrahepatic cholestasis. Clin Res Hepatol Gastroenterol 2012;36:S26–35. [DOI] [PubMed] [Google Scholar]
- 35. Kliewer SA, Willson TM. Regulation of xenobiotic and bile acid metabolism by the nuclear pregnane X receptor. J Lipid Res 2002;43:359–64. [PubMed] [Google Scholar]
- 36. Alnouti Y. Bile acid sulfation: a pathway of bile acid elimination and detoxification. Toxicol Sci 2009;108:225–46. [DOI] [PubMed] [Google Scholar]
- 37. Chatterjee B, Echchgadda I, Song CS. Vitamin D receptor regulation of the steroid/bile acid sulfotransferase SULT2A1. Methods Enzymol 2005;400:165–91. [DOI] [PubMed] [Google Scholar]
- 38. Nguyen P, Leray V, Diez M et al. Liver lipid metabolism. J Anim Physiol Anim Nutr 2008;92:272–83. [DOI] [PubMed] [Google Scholar]
- 39. Vaz FM, Ferdinandusse S. Bile acid analysis in human disorders of bile acid biosynthesis. Mol Aspects Med 2017;56:10–24. [DOI] [PubMed] [Google Scholar]
- 40. Yu Y, Villalobos-Hernandez EC, Pradhananga S et al. Deoxycholic acid activates colonic afferent nerves via 5-HT3 receptor-dependent and -independent mechanisms. Am J Physiol-Gastroint Liver Physiol 2019;317:G275–84. [DOI] [PubMed] [Google Scholar]
- 41. Wu Q, Zhang X, Zhong M et al. Effects of bariatric surgery on serum bile acid composition and conjugation in a diabetic rat model. Obes Surg 2016;26:2384–92. [DOI] [PubMed] [Google Scholar]
- 42. Gerbod-Giannone MC, Del Castillo-Olivares A, Janciauskiene S et al. Suppression of cholesterol 7alpha-hydroxylase transcription and bile acid synthesis by an alpha1-antitrypsin peptide via interaction with alpha1-fetoprotein transcription factor. J Biol Chem 2002;277:42973–80. [DOI] [PubMed] [Google Scholar]
- 43. Wang L, Wu G, Wu F et al. Geniposide attenuates ANIT-induced cholestasis through regulation of transporters and enzymes involved in bile acids homeostasis in rats. J Ethnopharmacol 2017;196:178–85. [DOI] [PubMed] [Google Scholar]
- 44. Cao Y, Xiao Y, Zhou K et al. FXR agonist GW4064 improves liver and intestinal pathology and alters bile acid metabolism in rats undergoing small intestinal resection. Am J Physiol Gastrointest Liver Physiol 2019;317:G108–15. [DOI] [PubMed] [Google Scholar]
- 45. Wang XC, Zheng R, Yao Q et al. Effects of fluoride on the histology, lipid metabolism, and bile acid secretion in liver of Bufo gargarizans larvae. Environ Pollut 2019;254:1–9. [DOI] [PubMed] [Google Scholar]
- 46. Fuchs CD, Paumgartner G, Wahlstrom A et al. Metabolic preconditioning protects BSEP/ABCB11(−/−) mice against cholestatic liver injury. J Hepatol 2017;66:95–101. [DOI] [PubMed] [Google Scholar]
- 47. Ou QQ, Qian XH, Li DY et al. Yinzhihuang attenuates ANIT-induced intrahepatic cholestasis in rats through upregulation of Mrp2 and Bsep expressions. Pediatr Res 2016;79:589–95. [DOI] [PubMed] [Google Scholar]
- 48. Li SN, Wang R, Wu B et al. Salvianolic acid B protects against ANIT-induced cholestatic liver injury through regulating bile acid transporters and enzymes, and NF-kappa B/I kappa B and MAPK pathways. Naunyn Schmiedebergs Arch Pharmacol 2019;392:1169–80. [DOI] [PubMed] [Google Scholar]
- 49. Kawase A, Yamada A, Gamou Y et al. Effects of ginsenosides on the expression of cytochrome P450s and transporters involved in cholesterol metabolism. J Nat Med 2014;68:395–401. [DOI] [PubMed] [Google Scholar]
- 50. Boyer JL. Bile formation and secretion. Compr Physiol 2013;3:1035–78. [DOI] [PMC free article] [PubMed] [Google Scholar]
- 51. Kock K, Ferslew BC, Netterberg I et al. Risk factors for development of cholestatic drug-induced liver injury: inhibition of hepatic basolateral bile acid transporters multidrug resistance-associated proteins 3 and 4. Drug Metab Dispos 2014;42:665–74. [DOI] [PMC free article] [PubMed] [Google Scholar]
- 52. Keppler D. Cholestasis and the role of basolateral efflux pumps. Z Gastroenterol 2011;49:1553–7. [DOI] [PubMed] [Google Scholar]
- 53. Chen J, Zhao KN, Chen C. The role of CYP3A4 in the biotransformation of bile acids and therapeutic implication for cholestasis. Ann Transl Med 2014;2:7–16. [DOI] [PMC free article] [PubMed] [Google Scholar]
- 54. Yao JH, Liu KX. Alisol B 23-acetate protects against ANIT-induced hepatotoxity and cholestasis, due to FXR-mediated regulation of transporters and enzymes involved in bile acid homeostasis. Toxicol Appl Pharmacol 2015;283:178–86. [DOI] [PubMed] [Google Scholar]