Abstract
Mono-2-ethyhexyl phthalate (MEHP), an environmental xenoestrogen, is widely used in the production of polyvinyl chloride materials and can be easily accumulated in human body. MBP is the active monoester metabolite of di butyl phthalate that is widely used as plasticizer in many products such as plastic toys, food packaging, personal care products, as well as an additive in lubricants, eliminating foams, and lotions. The presented in-vitro cytotoxicity study focused on time-dependent and combinatory exposure scenarios. We chose these phthalates because they are posed a considerable interest because of their contribution to insulin resistance, type-2 diabetes and obesity. All experiments performed in INS-1 pancreatic beta cells show moderate cytotoxicity with a time-dependent increase in effectiveness. INS-1 cells were treated with 0.001, 0.01, 0.1, 1, or 10-μM MEHP and MBP for 24, 48, and 72 h. Our results showed that cell viability was decreased and total oxidant levels were increased. Also, mRNA expression levels with asscociated beta cells were measured and for MBP dose groups, all mRNA expression levels were decreased. In conclusion, these findings suggest that, MEHP and MBP are have a negative and distruptor role on pancreatic beta cells and it will be linked with insulin resistance and type 2 diabetes.
Keywords: mono butyl phthalate, mono (2-ethylhexyl) phthalate, INS-1 pancreatic beta cells, cytotoxicity
Graphical abstract
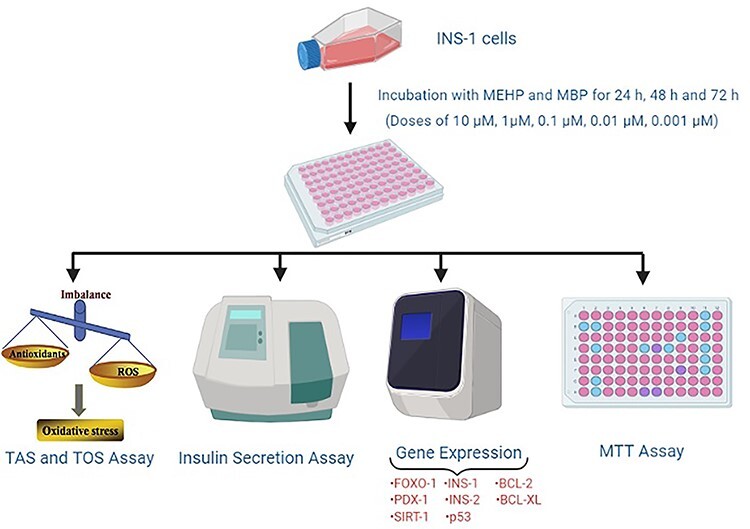
Introduction
The use of plastics is widespread in our modern world and simultaneously exposure too many chemicals that may leak from the plastics is also very common [1, 2]. The daily exposure of various types of chemicals from plastics involves ingestion by contaminated food, absorption through skin and inhalation [3, 4].
Two important types of chemicals leaking from plastics are phthalates and they are used as plasticizers in polyvinylchloride products. The other one is bisphenol A (BPA) and it is used in polycarbonate plastic. These chemicals are produced in several millions of tons per year [5, 6] and they have also been detected in blood and urine samples from the population as well [6]. There have been an increasing concern about these environmentally hazardous chemicals and their adverse health effects, based on knowledge gained from animal studies [4, 7–10]. Therefore, regulations have been put into force in the European Union (EU) on product content as well as production of phthalates and BPA, but they still exist in a lot of consumer products [11]. With regards to this, it is not surprising to find out numerous studies trying to reveal the effects of exposure but distinctively the most crucial is that exposure to BPA and phthalates has been linked to several metabolic effects in both epidemiological and experimental studies, including diabetes [12–17].
Despite the fact that diabetes is a common metabolic disorder worldwide, the reason for its increasing incidence in 30 years is still unknown [17]. The increase has been suggested in part to be a result of unhealthy lifestyle changes related with industrialization and economic development, but it also concurrences with an increase in exposure to chemicals [18] including endocrine disruptors [13].
The significant economic and social costs associated with the raising case rate of diabetes describe a public health problem not only in local levels but also worldwide [19]. Even though several environmental chemicals have been associated with type 2 diabetes (T2D), potential role in the development of the autoimmune disease type 1 diabetes (T1D) has not received much attention. However, these environmental chemicals are thought to act as endocrine disruptors and may affect the immune system which can further promote and to contribute autoimmunity [2].
Phthalates constitute a diverse group of industrial compounds that share basic chemical similarities. Notably they are used as plasticizers in the production of soft polyvinyl chloride and other plastics in numerous consumer items, such as plastic gloves, paint, toys, and several personal care products [3, 11]. Similar to BPA, phthalates does not chemically bound to the plastic, and may leak into the environment as aforementioned. Considering this fact, it is not surprising to come across with different phthalates in a wide range of food items such as milk, meat, fish, seafood, and vegetables [20]. Thus, phthalate occurrence is mostly associated with imported products, contamination in production, or cooking at home. In addition to these, consumer products such as shampoos, cosmetics, and skin creams contain various phthalates [6, 11]. As regards to take a precaution on this issue, EU legislation on phthalates in materials in contact with food entered into force in 2008 [21]. Although ingestion is suggested to be the major exposure route, inhalation and skin contact with clothing, toys, or other products containing phthalates can also result in absorption through the skin [3, 11].
Another important point is that, infants and toddlers mouthing of plastic objects have received particular attention recently. The infants are constantly in contact with plastic products directly through the mouth or through licking on fingers after contact with the products [11]. Due to the fact that children are in their development phase, they are highly vulnerable to exposure [22, 23]. Therefore, the use of phthalates in toys for children under 3 years was prohibited in the EU in 1999 [11].
In addition to these, metabolism and elimination of phthalates is also a very complex process. In general, phthalates are diesters which are cleaved into their respective hydrolytic monoesters which can be further modified by another oxidation reactions. Both the hydrolytic monoesters and the oxidized metabolites conjugate with glucuronic acid, and then they are secreted through the urine. Hence, biological half-life and the metabolite concentrations in urine diverse between the phthalates and their metabolites in view differences in phthalate structure and chain length. For instance, although ~70% of di-n-butyl phthalate (DnBP) is excreted as the primary metabolite mono-n-butyl phthalate (MnBP), only 7% of di (2-ethylhexyl) phthalate (DEHP) is excreted as the primary metabolite mono (2-ethylhexyl) phthalate (MEHP; [23]). Individual phthalates are used in different products, thus exposure way and burden differs between the several phthalates, as well as between age and gender groups [6]. The highest phthalate exposure through ingestion is seen for DnBP, diisobutyl phthalate (DiBP), benzyl butyl phthalate (BBzP), and DEHP [11]. The concentrations of phthalate metabolites in serum vary between different metabolites as well as individuals [24–27], consequently reflecting differences in exposure within the population. Some phthalate metabolites, like mono butyl phthalate (MBP), and MEHP, may be detected in almost all subjects [26, 27]. Furthermore, phthalates have also been detected in urine [24] and breast milk [10].
In the scope of animal studies as mentioned above, exposure of rodents to phthalates has been associated with adverse effects in liver and kidney beyond the reproductive system, indeed the induced effects differ between the phthalates [3]. In epidemiological studies, several diseases like obesity, diabetes, and asthma have been associated with increased levels of phthalate metabolites [28, 29]. Phthalate metabolites may intensify the peroxisome proliferator-activated receptor family of nuclear receptors (PPAR’s), which play an important role in the regulation of insulin sensitivity and inflammation [30], thus PPAR’s are often suggested as a mechanism for phthalate-induced effects.
Given these points, the aim of this study is to investigate the role of two ubiquitous environmental contaminants; MEHP and MBP, on pancreatic β-cells in vitro, a cell type that has a central role in the development of diabetes [31] and identify the related molecular pathways. So, the relationship between these endocrine disruptor metabolites and pancreatic β-cells will be showed and accordingly, a new approach can be introduced to the use rates of phthalates.
Materials and Methods
Chemicals
MEHP and MBP (CAS No.117-81-7) was obtained from Sigmae Aldrich (Germany: purity > 99.4%) and dissolved in dimethyl sulfoxide (DMSO). Culture plates were obtained from BD Biosciences Labware, Franklin Lakes, NJ, USA. RPMI 1640 culture medium and fetal bovine serum (FBS) were obtained from Gibco. HEPES, glutamine, sodium pyruvate, penicillin and streptomycin were purchased from Invitrogen. The antibodies against FOXO-1, PDX-1, SIRT-, INS-1, INS-2, p53, BCL-2, and BCL-XL were purchased from Santa Cruz Biotechnology (Santa Cruz, CA, USA). Glucose, HEPES, β-mercaptoethanol and the protease inhibitor were obtained from Sigma. The catalog number of rat insulin secretion kit was 62INSPEB and obtained from Cisbio. Each analysis was repeated three times.
Dose levels, cell culture and treatment
Daily human exposure to DEHP in general population is estimated to be in the range from 5.8 to 19 μg kg−1 per day whereas exposure through medical settings may exceed up to 167.9 mg/day [32]. MEHP is high in the plasma of infant (15.1 μg ml−1 which is equal to 54.25 μM) and in maternal and umbilical cord blood samples (11.87 and 9.94 μg ml−1) [33].
Silva et al. [34] reported that a median concentration of total monobutyl phthalate in serum of 14.4 μg l−1 of which ~25–30% is free monobutyl phthalate and the remainder is monobutyl phthalate glucuronide. Also, Silva et al. [35] reported that a median concentration of total monobutyl phthalate in human amniotic fluid of 5.8 μg l−1, a 95th percentile of 15.9 μg l−1, and a maximum value of 263.9 μg l−1 (n = 54 with detection in 50 of the samples). Calafat et al. [36] reported a mean concentration of total monobutyl phthalate in human breast milk of 1.3 ± 1.5 (n = 3 with detection in 2 of the samples) μg/l. Silva et al. [37] reported a median concentration of total monobutyl phthalate in human saliva of 5.0 μg l−1 and a 95th percentile of 57.9 μg l−1 (n = 39 with detection in 33 of the samples).
According to this literature, we have selected five doses for two phthalates and in experiment, we adjusted the doses like low dose, median dose, and high dose in themselves. Generally, these all concentrations were low because endocrine-disrupting chemicals (EDCs) simulate hormones and these chemicals can have adverse effects at low doses.
The INS-1 cell line (ATCC, HB-8065) was cultured in MEM containing 10% fetal bovine serum, in 5% CO2 at 37°C. The cells were passaged after being in culture for two or three days, and the logarithmic phase cells were used for experiments. In each experiment, the INS-1 cells were treated with 0.001, 0.01, 0.1, 1, or 10-μM MEHP and MBP (diluted with cell culture medium with a final concentration of DMSO < 0.1% (v/v)).
Cell viability assay
Cellular viability was evaluated with a MTT (Sigma) colorimetric assay. INS-1 cells were plated in a 96-well microtiter plate at a density of 2 × 10⁵ cells per well in a final volume of 100-μl MEM medium containing 10% fetal bovine serum for 24 h. Then the cells were treated with 0.001, 0.01, 0.1, 1, or 10 μM MEHP and MBP for 24, 48, and 72 h. After treatment, the cells were incubated with 100-ml MTT solution (0.5 mg ml−1) for 2 h at 37°C. The formazan crystals formed were dissolved in DMSO at 37°C for 1 h in the dark, and the absorbance was read at 595 nm in a microplate reader (BIO-RAD Model 3550).
Insulin secretion assay
After the 5-day culture in 24-well plates (400.000 cells/well in 500-μl medium), insulin release was measured in the confluent INS-1 cells. In brief, after the pre-incubation of cells in KRBH buffer (KRBB, 129 mM of NaCl, 4.8 mM of KCl, 1.2 mM of MgSO4, 1.2 mM of KH2PO4, 2.5 mM of CaCl2, 5 mM of NaHCO3, 0.1% BSA, and 10 mM of HEPES, pH 7.4) for 2 h, the KRBH buffer was replaced by the same buffer supplemented with either 5.5 and 16.7 mM of glucose. Then the cells were incubated for another hour at 37°C. The supernatants were collected and analyzed for insulin concentrations.
Measurement of total antioxidant/oxidant status
Total oxidant status (TOS), total antioxidant status (TAS), and oxidative stress index were analyzed by using The Rel Assay kits (#RL0024, #RL0017, Rel Assay, Gaziantep, Turkey) according to manufacturer instructions. The method used for measurement of TOS is based on the principle that oxidants that are present in the sample can oxidize the ferrous ions to ferric ions which make a colored complex with a chromogen in an acidic medium. TAS analysis is based on the principle that antioxidants in the sample reduce dark blue-green colored 2.20-azino-bis (3-ethylbenzotiazoline-6-sulphonic acid; ABST) radical to colorless reduced ABTS form. The absorbance was measured at 530 and 660 nm.
Quantitative real-time polymerase chain reaction analysis
mRNA and miRNA expressions were examined using real-time PCR. Total RNA was extracted from islets using Trizol reagent. The yield of RNA was expressed in mg. cDNA was synthesized from 2 mg of total RNA using M-MuLV Reverse Transcriptase according to the manufacturer’s protocol. Real time-PCR was carried out in a CFX96 TouchTM realtime PCR detection system (Bio Rad, USA). Reaction was performed using MESA Green PCR master mix. From Raw Ct Value to fold change result of each mRNA represented by Clustergram data analyses were done with web-based RT2 PCR Data Analysis Software (SA Biosciences, Qiagen). A common method of visualizing gene expression data is to display it as a heatmap. The heatmap may also be combined with clustering methods which group genes and/or samples together based on the similarity of their gene expression pattern. This can be useful for identifying genes that are commonly regulated, or biological signatures associated with a particular condition. In heat maps, the data are displayed in a grid where each row represents a gene and each column represents a sample. The color and intensity of the boxes is used to represent changes of gene expression. In our heat maps, red represents up-regulated genes and green represents downregulated genes. The color scale changing from red to green indicated the decrease in gene expressions. The heat maps were drawn with using TBtools program.
Statistical analysis
All values are expressed as means ± standard deviation (SD). Statistical analyses were performed by using a SPSS 18 program for Windows. Data were analyzed using one-way ANOVA. After for differences between treatments, Tukey’s post-hoc test was done. P < 0.05 was considered statistically significant.
Results
Effects of MEHP and MBP on INS-1 cell viability
As Fig. 1 shows, INS-1 cell viability declined after exposed to MEHP and MBP during 24, 48, and 72 h. For all MEHP concentrations, it was clearly seen that there was a significant decrease in cell viability compared with control and DMSO groups. Similar to MEHP results, for all MBP concentrations, the cell viability was decreased compared with the control and DMSO groups.
Figure 1.
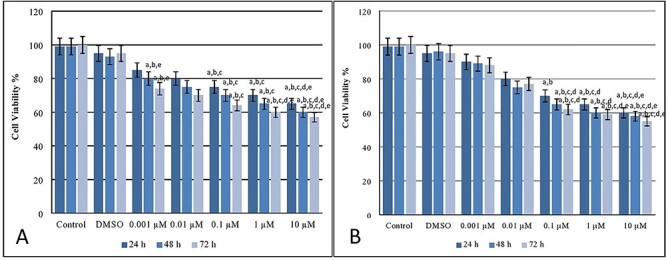
Cell viability (%) levels after MEHP (A) and MBP (B) exposure on INS-1 beta cells. a Different from control group (P < 0.05), b different from DMSO group (P < 0.05), c different from 0.001 μM of MEHP dose group (P < 0.05), d different from 0.01 μM of MEHP dose group (P < 0.05), e different from 0.1 μM of MEHP dose group (P < 0.05) (A). a Different from control group (P < 0.05), b different from DMSO group (P < 0.05), c different from 0.001 μM of MBP dose group (P < 0.05), d different from 0.01 μM of MBP dose group (P < 0.05), e different from 0.1 μM of MBP dose group (P < 0.05) (B).
Measurement of total antioxidant/oxidant status
The results of TOS and TAS analysis after 24, 48, and 72 h exposure MEHP and MBP exposure to INS-1 cells were presented in Fig. 2.
Figure 2.
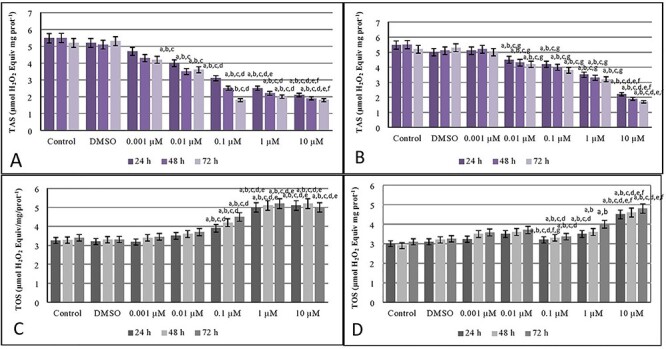
Total antioxidant levels after exposure MEHP (A) and MBP (B) and total oxidant levels after exposure MEHP (C) and MBP (D) on INS-1 beta cells. a Different from control group (P < 0.05), b different from DMSO group (P < 0.05), c different from 0.001 μM of MEHP dose group (P < 0.05), d different from 0.01 μM of MEHP dose group (P < 0.05), e different from 0.1 μM of MEHP dose group (P < 0.05), f different from 1 μM of MEHP dose group (P < 0.05) (A). a Different from control group (P < 0.05), b different from DMSO group (P < 0.05), c different from 0.001 μM of MBP dose group (P < 0.05), d different from 0.01 μM of MBP dose group (P < 0.05), e different from 0.1 μM of MBP dose group (P < 0.05), f different from 1 μM of MBP dose group (P < 0.05), g different from 10 μM of MBP dose group (P < 0.05) (B). a Different from control group (P < 0.05), b different from DMSO group (P < 0.05), c different from 0.001 μM of MEHP dose group (P < 0.05), d different from 0.01 μM of MEHP dose group (P < 0.05), e different from 0.1 μM of MEHP dose group (P < 0.05) (C). a Different from control group (P < 0.05), b different from DMSO group (P < 0.05), c different from 0.001 μM of MBP dose group (P < 0.05), d different from 0.01 μM of MBP dose group (P < 0.05), e different from 0.1 μM of MBP dose group (P < 0.05), f different from 1 μM of MBP dose group (P < 0.05), g different from 1 μM of MBP dose group (P < 0.05) (D).
When we examined the results for 24, 48, and 72 h exposure, it was realized that, for MEHP concentrations in Fig. 2A, 0.1, 1, and 10-μM MEHP doses showed a decrease for TAS. Likewise, For TAS levels, 1 and 10-μM MBP doses also showed a decrease statistically significant after 24, 48, and 72 h cultivation which can be seen in Fig. 2B.
For MEHP concentrations in Fig. 2C, 0.1, 1, and 10-μM MEHP doses showed an increase for TOS for all in three times. For TOS levels, 0.1, 1, and 10-μM MBP doses showed an increase for TOS in Fig. 2D.
Insulin secretion assay results
Results of insulin secretion measurement in a medium containing 5.5-mmol l−1 glucose at the end of MEHP application in INS-1 cells were presented in Fig. 3A. After MEHP treatment for 24, 48, and 72 h, insulin release of INS-1 cells decreased in 0.1, 1, and 10-μM doses of MEHP compared with control. Also, in 10-μM dose group of MEHP showed a decrease in insulin release compared with 1-μM dose group of MEHP dose group.
Figure 3.
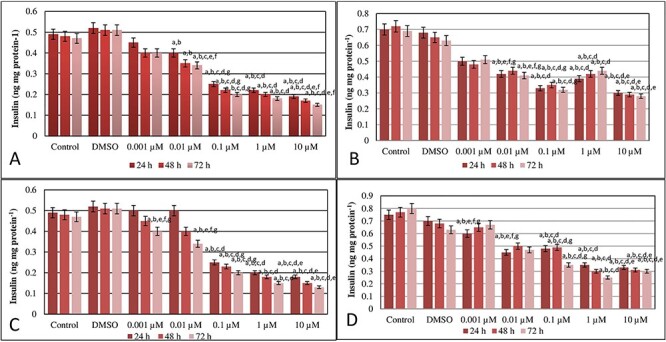
Results of insulin secretion measurement in a medium containing 5.5 mmol l−1 glucose at the end of MEHP (A) and MBP (C) application and results of insulin secretion measurement in a medium containing 16.7 mmol l−1 glucose at the end of MEHP (B) and MBP (D) application in INS-1 cells. a Different from control group (P ≤ 0.05), b different from DMSO group (P ≤ 0.05), c different from 0.001 μM of MEHP dose group (P ≤ 0.05), d different from 0.01 μM of MEHP dose group (P ≤ 0.05), e different from 0.1 μM of MEHP dose group (P ≤ 0.05), f different from 1 μM of MEHP dose group (P ≤ 0.05), g different from 1 μM of MEHP dose group (P ≤ 0.05) (A). a Different from control group (P < 0.05), b different from DMSO group (P < 0.05), c different from 0.001 μM of MEHP dose group (P < 0.05), d different from 0.01 μM of MEHP dose group (P < 0.05), e different from 0.1 μM of MEHP dose group (P < 0.05), f different from 1 μM of MEHP dose group (P < 0.05), g different from 1 μM of MEHP dose group (P < 0.05) (B). Results of insulin secretion measurement in a medium containing 5.5 mmol l−1 glucose at the end of MBP application in INS-1 cells. a Different from control group (P < 0.05), b different from DMSO group (P < 0.05), c different from 0.001 μM of MBP dose group (P < 0.05), d different from 0.01 μM of MBP dose group (P < 0.05), e different from 0.1 μM of MBP dose group (P < 0.05), f different from 1 μM of MBP dose group (P < 0.05), g different from 1 μM of MBP dose group (P < 0.05) (C). Results of insulin secretion measurement in a medium containing 16.7 mmol l−1 glucose at the end of MBP application in INS-1 cells. a Different from control group (P < 0.05), b different from DMSO group (P < 0.05), c different from 0.001 μM of MBP dose group (P < 0.05), d different from 0.01 μM of MBP dose group (P < 0.05), e different from 0.1 μM of MBP dose group (P < 0.05), f different from 1 μM of MBP dose group (P < 0.05), g different from 1 μM of MBP dose group (P < 0.05) (D).
Results of insulin secretion measurement in a medium containing 16.7-mmol l−1 glucose at the end of MEHP application in INS-1 cells were presented in Fig. 3B. 0.1, 1, and 10-μM doses of MEHPP had a decreased insulin release compared with 0.01, and 0.001-μM dose groups of MEHPP for 48 and 72 h treatments.
Results of insulin secretion measurement in a medium containing 5.5-mmol l−1 glucose at the end of MBP application in INS-1 cells were presented in Fig. 3C. 0.1, 1, and 10-μM doses of MBP after 24, 48, and 72 h showed a decrease in insulin secretion of INS-1 cells compared with the control and DMSO group. Also, after 72 h, in 0.001 and 0.01-μM dose groups, there was a decreased insulin secretion beside the control and DMSO groups.
Results of insulin secretion measurement in a medium containing 16.7 mmol l−1 glucose at the end of MBP application in INS-1 cells were presented in Fig. 3D. After 24 h, 0.001, 0.01, 0.1, 1, and 10-μM dose groups showed a decrease compared with the control group. After 48 and 72 h, in 0.01, 0.1, 1, and 10-μM dose groups, insulin secretion was decreased statistically.
qPCR analysis results
mRNA expression levels after 24 h with associated beta cells and insulin were analyzed and the results were shown in Table 1 (MEHP) and Table 2 (MBP). All analyses were repeated three times. The results showed 2-fold decrease in INS-1 and INS-2 expression levels in the highest dose group, which was 10 μM for MEHP and MBP. Also, the heat maps of mRNA expression levels after exposure at the end of 24 h were shown in Fig. 4 (MEHP) and Fig. 5 (MBP). For 10-μM dose group of MEHP, FOXO-1, PDX-1, SIRT-, INS-1, INS-2, BCL-2, and BCL-XL levels were decreased compared with control and DMSO groups. Only p53 levels were increased for all groups. For 0.001-μM dose group of MEHP, all mRNA levels were decreased but only INS-1 levels were different statistically. The other groups, 0.01, 0.1, and 1-μM MEHP dose groups had decreased levels for all mRNAs different significantly. For MBP dose groups, FOXO-1, PDX-1, SIRT-, INS-1, INS-2, BCL-2, and BCL-XL mRNA expression levels were decreased in 10 and 1-μM MBP dose groups and these were statistically different from the other groups. For p53 mRNA levels, 0.01, 0.1, 1, and 10-μM dose groups of MBP showed a decrease compared with the control group.
Table 1.
mRNA expression levels of genes after MEHP exposure at the end of 24 h
| Control | DMSO | 0.001 μM | 0.01 μM | 0.1 μM | 1 μM | 10 μM | |
|---|---|---|---|---|---|---|---|
| FOXO-1 | +0.10 | +0.01 | –0.16 | –0.29 | −0.43 | –1.21 | –1.25a,b,c,d |
| PDX-1 | +0.21 | +0.19 | –0.17 | –0.32 | −0.98 | –1.19 | –1.52a,b,c,d,e |
| SIRT-1 | +0.11 | +0.12 | –0.54 | –0.77 | −1.14a,b,c,f,g | –1.65a,b,c,g | –1.90a,b,c,d,e |
| INS-1 | +0.50 | +0.48 | –0.20a,b | –0.70 | −1.10 | –1.50 | –2.10a,b,c,d,e |
| INS-2 | +0.49 | +0.47 | –0.10 | –0.48 | −1.52 | –1.73a,b,c | –2.01 |
| P53 | +0.10 | +0.18 | +0.56 | +0.76 | +0.98 | +0.99 | +1.56a,b,c |
| BCL-2 | +0.43 | +0.39 | –0.16 | –0.17 | −0.32 | –1.32 | –1.33a,b,c,d,e |
| BCL-XL | +0.21 | +0.24 | –0.26 | –0.38 | −0.59 | –0.94a,b,c,d,g | –1.55 |
aDifferent from control group (P < 0.05).
bDifferent from DMSO group (P < 0.05).
cDifferent from 0.001 μM of MEHP dose group (P < 0.05).
dDifferent from 0.01 μM of MEHP dose group (P < 0.05).
eDifferent from 0.1 μM of MEHP dose group (P < 0.05).
fDifferent from 1 μM of MEHP dose group (P < 0.05).
gDifferent from 1 μM of MEHP dose group (P < 0.05). [(+) increase of mRNA levels, (−) decrease of mRNA levels].
Table 2.
mRNA expression levels of genes after MBP exposure at the end of 24 h
| Control | DMSO | 0.001 μM | 0.01 μM | 0.1 μM | 1 μM | 10 μM | |
|---|---|---|---|---|---|---|---|
| FOXO-1 | +0.11 | +0.05 | –0.12a,b,e,f,g | –0.19 | −0.33 | –0.87 | –0.99a,b,c,d,e |
| PDX-1 | +0.12 | +0.17 | –0.35 | –0.54 | −0.78 | –1.99a,b,c,d,e | –2.50 |
| SIRT-1 | +0.11 | +0.12 | –0.34 | –0.67 | −0.54a,b,c,d,f,g | –0.80 | –1.01 |
| INS-1 | +0.29 | +0.28 | –1.22 | –1.56 | −1.78 | –2.59 | –3.20a,b,c,d,e,f |
| INS-2 | +0.21 | +0.32 | –1.01 | –1.38a,b,g | −1.52 | –1.63 | –2.20 |
| P53 | +0.18 | +0.17 | +0.26 | +0.56a,b,f,g | +0.99 | +1.57 | +1.98 |
| BCL-2 | +0.23 | +0.39 | –0.69 | –0.68 | −0.92 | –1.52 | –2.34a,b,c,d,e,f |
| BCL-XL | +0.21 | +0.25 | –0.79a,b,f,g | –0.89 | −0.99 | –1.50 | –2.75 |
aDifferent from control group (P < 0.05).
bDifferent from DMSO group (P < 0.05).
cDifferent from 0.001 μM of MBP dose group (P < 0.05).
dDifferent from 0.01 μM of MBP dose group (P < 0.05).
eDifferent from 0.1 μM of MBP dose group (P < 0.05).
fDifferent from 1 μM of MBP dose group (P < 0.05).
gDifferent from 10 μM of MBP dose group (P < 0.05). [(+) increase of mRNA levels, (−) decrease of mRNA levels].
Figure 4.
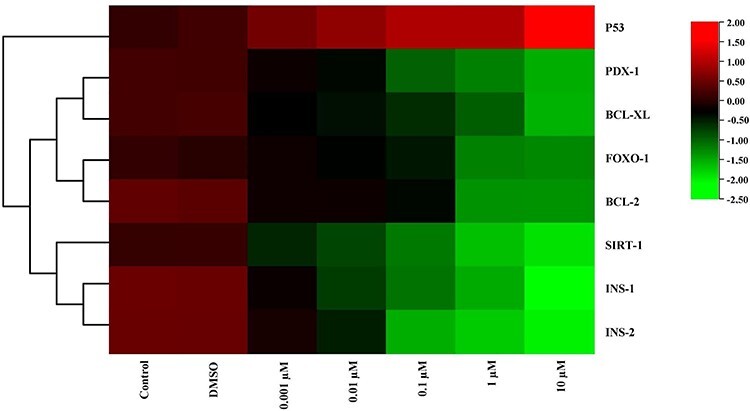
The heat map of mRNA expression levels of genes after MEHP exposure at the end of 24 h. While red color indicates increase in gene expression, green color indicates decrease. Colors changing from red to green indicate decreased gene expression. According to this, expression of p53 was increased for all dose groups compared with the control group.
Figure 5.
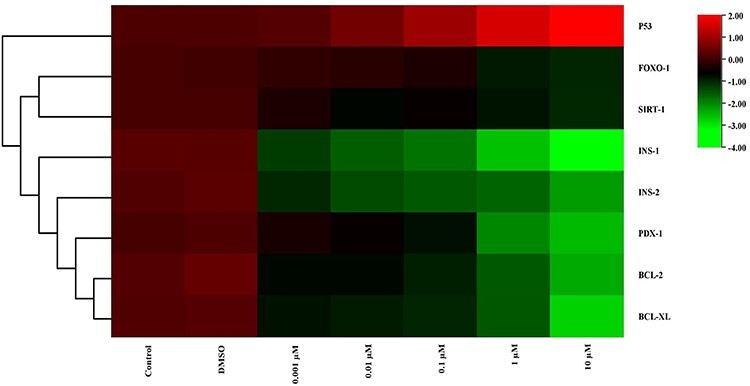
The heat map of mRNA expression levels of genes after MBP exposure at the end of 24 h. While red color indicates increase in gene expression, green color indicates decrease. Colors changing from red to green indicate decreased gene expression. According to this, expression of p53 was increased but expression of INS-1 and INS-2 was decreased statistically significant compared with the control group in 10 μM dose group.
mRNA expression levels after 48 h with associated beta cells and insulin were analyzed and the results were shown in Tables 3 (MEHP) and 4 (MBP). In addition, the heat maps of mRNA expression levels after exposure at the end of 48 h were shown in Figs 6 (MEHP) and 7 (MBP). Like results of after 24 h, not only MEHP but also MBP dose groups, except p53 gene, showed the decreased mRNA levels compared the control and DMSO group.
Table 3.
mRNA expression levels of genes after MEHP exposure at the end of 48 h
| Control | DMSO | 0.001 μM | 0.01 μM | 0.1 μM | 1 μM | 10 μM | |
|---|---|---|---|---|---|---|---|
| FOXO-1 | +0.10 | +0.01 | –0.11 | –0.21 | −0.63 | –1.03 | −1.25a,b.c.d |
| PDX-1 | +0.21 | +0.22 | –0.17 | –0.22 | −0.58 | –0.79 | −1.62a,b,c,d,e |
| SIRT-1 | +0.12 | +0.14 | –0.43 | –0.67 | −1.10a,b,c,f,g | –1.21a,b,c,g | −1.80a,b,c,d,e |
| INS-1 | +0.50 | +0.51 | –0.20a,b | –0.87 | −1.15 | –1.40 | −1.10a,b,c,d,e |
| INS-2 | +0.39 | +0.45 | –0.15 | –0.42 | −1.13 | –1.33a,b,c | −1,55 |
| P53 | +0.10 | +0.17 | +0.66 | +0.65 | +0.70 | +1.33 | +2.56a,b,c |
| BCL-2 | +0.53 | +0.59 | –0.36 | –0.44 | −0.78 | –1.36 | −1.89a,b,c,d,e |
| BCL-XL | +0.31 | +0.34 | –0.21 | –0.55 | −0.57 | –0.84a,b,c,d,g | −1.87 |
aDifferent from control group (P < 0.05).
bDifferent from DMSO group (P < 0.05).
cDifferent from 0.001 μM of MEHP dose group (P < 0.05).
dDifferent from 0.01 μM of MEHP dose group (P < 0.05).
eDifferent from 0.1 μM of MEHP dose group (P < 0.05).
fDifferent from 1 μM of MEHP dose group (P < 0.05).
gDifferent from 10 μM of MEHP dose group (P < 0.05). [(+) increase of mRNA levels, (−) decrease of mRNA levels].
Table 4.
mRNA expression levels of genes after MBP exposure at the end of 48 h
| Control | DMSO | 0.001 μM | 0.01 μM | 0.1 μM | 1 μM | 10 μM | |
|---|---|---|---|---|---|---|---|
| FOXO-1 | +0.10 | +0.01 | –0.26 | –0.29 | −0.55 | –1.11 | −1.25a,b,c,d |
| PDX-1 | +0.11 | +0.10 | –0.20 | –0.31 | −0.39 | –0.67 | −0.52.a,b,c,d,e |
| SIRT-1 | +0.11 | +0.11 | –0.68 | –0.55 | −1.04a,b,c,f,g | –1.88a,b,c,g | −2.01a,b,c,d,e |
| INS-1 | +0.42 | +0.24 | –0.24a,b | –0.52 | −1.22 | –1.18 | −1.10a,b,c.d,e |
| INS-2 | +0.22 | +0.27 | –0.43 | –0.44 | −1.34 | –1.31a,b,c | −1.89 |
| P53 | +0.09 | +0.11 | +0.16 | +0.27 | +0.65 | +0.76 | +1.44a,b,c |
| BCL-2 | +0.43 | +0.39 | –0.16 | –0.17 | −0.32 | –1.32 | −1.33a,b,c,d,e |
| BCL-XL | +0.21 | +0.24 | –0.26 | –0.38 | −0.59 | –0.94a,b,c,d,g | −1.55 |
aDifferent from control group (P < 0.05).
bDifferent from DMSO group (P < 0.05).
cDifferent from 0.001 μM of MBP dose group (P < 0.05).
dDifferent from 0.01 μM of MBP dose group (P < 0.05).
eDifferent from 0.1 μM of MBP dose group (P < 0.05).
fDifferent from 1 μM of MBP dose group (P < 0.05).
gDifferent from 10 μM of MBP dose group (P < 0.05). [(+) increase of mRNA levels (−) decrease of mRNA levels].
Figure 6.
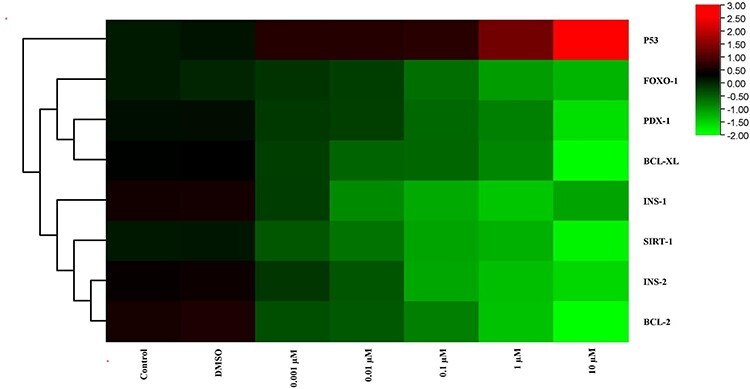
The heat map of mRNA expression levels of genes after MEHP exposure at the end of 48 h. While red color indicates increase in gene expression, green color indicates decrease. Colors changing from red to green indicate decreased gene expression. According to this, expression of p53, which is showed by red, was increased and expressions of other genes, which are showed by green, were decreased.
Figure 7.
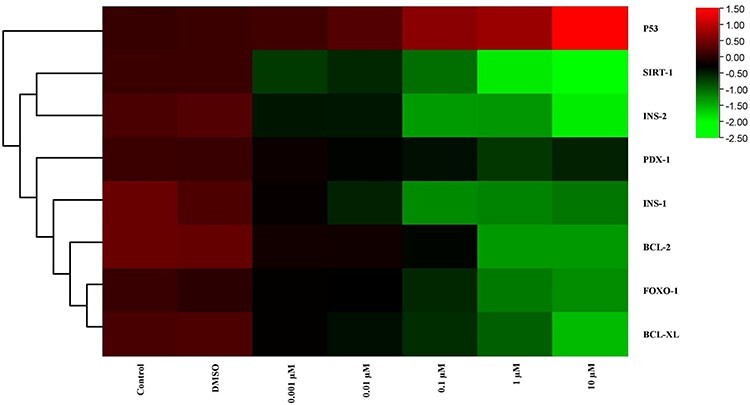
The heat map of mRNA expression levels of genes after MBP exposure at the end of 48 h. While red color indicates increase in gene expression, green color indicates decrease. Colors changing from red to green indicate decreased gene expression. According to this, in 10-μM dose group, maximum decrease of gene expression was showed in SIRT-1 and INS-2.
mRNA expression levels after 72 h with associated beta cell and insulin were analyzed and the results were shown in Tables 5 (MEHP) and 6 (MBP). The heat maps of mRNA expression levels after exposure at the end of 72 h were shown in Figs 8 (MEHP) and 9 (MBP). For all dose groups, there was a decrease for mRNA expression levels except p53.
Table 5.
mRNA expression levels of genes after MEHP exposure at the end of 72 h
| Control | DMSO | 0.001 μM | 0.01 μM | 0.1 μM | 1 μM | 10 μM | |
|---|---|---|---|---|---|---|---|
| FOXO-1 | +010 | +0.11 | –0.19 | –0.71 | −1.24 | –1.49 | –2.15a,b,c,d |
| PDX-1 | +0.11 | +0.15 | –0.27 | –0.67 | −1.12 | –1.99 | –2.52a,b,c,d,e |
| SIRT-1 | +0.14 | +0.13 | –0.59 | –0.98 | −1.65a,b,c,f,g | –2.10a,b,c,g | –2.87a,b,c,d,e |
| INS-1 | +0.40 | +0.38 | –0.28a,b | –0.90 | −1.55 | –1.98 | –2.54a,b,c,d,e |
| INS-2 | +0.48 | +0.45 | –0.15 | –0.66 | −1.66 | –1.84a,b,c | –2.05 |
| P53 | +0.12 | +0.15 | +0.87 | +0.97 | +1.04 | +1.92 | +2.56a,b,c |
| BCL-2 | +0.39 | +0.37 | –0.16 | –0.17 | −0.32 | –1.32 | –1.33a,b.c,d,e |
| BCL-XL | +0.23 | +0.28 | –0.37 | –0.45 | −0.88 | –1.67a,b,c.d,g | –2.22 |
aDifferent from control group (P < 0.05).
bDifferent from DMSO group (P < 0.05).
cDifferent from 0.001 μM of MEHP dose group (P < 0.05).
dDifferent from 0.01 μM of MEHP dose group (P < 0.05).
eDifferent from 0.1 μM of MEHP dose group (P < 0.05).
fDifferent from 1 μM of MEHP dose group (P < 0.05).
gDifferent from 10 μM of MEHP dose group (P < 0.05). [(+) increase of mRNA levels (−) decrease of mRNA levels].
Table 6.
mRNA expression levels of genes after MBP exposure at the end of 72 h
| Control | DMSO | 0.001 μM | 0.01 μM | 0.1 μM | 1 μM | 10 μM | |
|---|---|---|---|---|---|---|---|
| FOXO-1 | +0.15 | +0.11 | –0.24 | –0.51 | –0.89 | –1.56 | –1.99a,b,c,d |
| PDX-1 | +0.20 | +0.18 | –0.25 | –0.46 | –0.56 | –0.89 | –1.45a,b,c,d,e |
| SIRT-1 | +0.11 | +0.13 | –0.66 | –0.78 | –1.08a,b,c,f,g | –1.45a,b,c,g | –2.10a,b,c,d,e |
| INS-1 | +0.49 | +0.47 | –0.19a,b | –0.45 | –0.98 | –1.12 | –2.56a,b,c,d,e |
| INS-2 | +0.47 | +0.45 | –0.21 | –0.76 | –1.67 | –2.23a,b,c | –2.98 |
| P53 | +0.14 | +0.17 | +0.87 | +0.99 | +1.98 | +2.46 | +3.56a,b,c |
| BCL-2 | +0.33 | +0.35 | –0.46 | –0.67 | –1.232 | –1.87 | –2.45a,c,d,e |
| BCL-XL | +0.20 | +0.26 | –0.34 | –0.42 | –1.33 | –1.94a,b,c,d,g | –2.61 |
aDifferent from control group (P < 0.05).
bDifferent from DMSO group (P < 0.05).
cDifferent from 0.001 μM of MBP dose group (P < 0.05).
dDifferent from 0.01 μM of MBP dose group (P < 0.05).
eDifferent from 0.1 μM of MBP dose group (P < 0.05).
fDifferent from 1 μM of MBP dose group (P < 0.05).
gDifferent from 10 μM of MBP dose group (P < 0.05). [(+) increase of mRNA levels. (−) decrease of mRNA levels].
Figure 8.
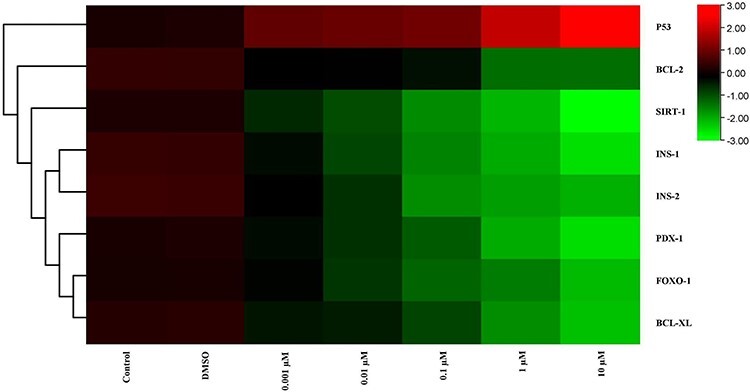
The heat map of mRNA expression levels of genes after MEHP exposure at the end of 72 h. While red color indicates increase in gene expression, green color indicates decrease. Colors changing from red to green indicate decreased gene expression. According to this, from 0.001 μM to 10 μM dose groups, gene expression levels were decreased expect p53. However, the expression of p53 was increased.
Figure 9.
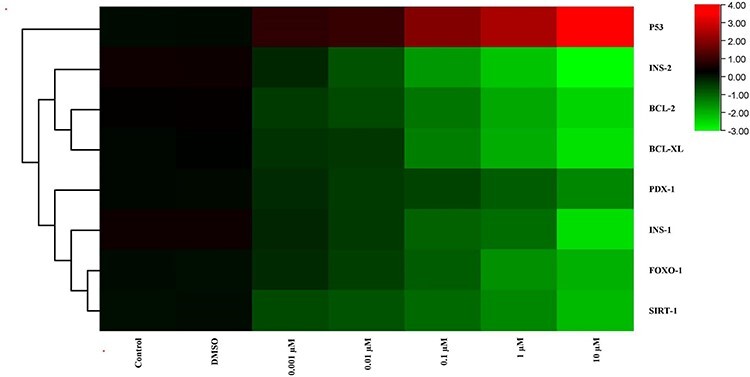
The heat map of mRNA expression levels of genes after MBP exposure at the end of 72 h. While red color indicates increase in gene expression, green color indicates decrease. Colors changing from red to green indicate decreased gene expression. Accordingly, as the dose increased, there was a decrease in the expression of the genes but for the expression of p53, which is showed by red, there was an increase.
Discussion
To begin with as it is well known that MBP and MEHP are the primary metabolites of dibutyl phthalate (DBP) and DEHP, respectively [6]. The two phthalate metabolites were selected due to the fact that they have been shown as the major metabolites due to oral exposure (ingestion of food and beverages), which is the major environmental exposure route [6, 11].
The main objective of this study was to investigate whether phthalate metabolites could influence cellular functions of pancreatic β-cells that may be linked to an accelerated development of diabetes type 1 and type 2.
According to that, three different exposure scenarios were used to study the effects of the chemicals alone with nondiabetic model. This model system reflects a normal non-diabetic situation, and is used to study if the chemicals can affect the β-cells viability, independently of other factors characterizing T1D and T2D. After 24, 48, and 72-h exposure to environmental chemicals (MBP and MEHP) the β-cell viability was measured by the methyl thiazylol tetraolium (MTT) assay.
Also, oxidative stress is involved as a toxigenic mechanism of MEHP. A lot of studies have confirmed that MEHP induces reproductive toxicity by inducing ROS production and disrupting the activity of antioxidant enzymes [38, 39]. In hepatocytes, MBP has also been reported to induce apoptosis via the activation of the ERK/NF-jB signaling pathway, in which intracellular Ca2+ and ROS act as key mediators [40]. Compatible with these studies, our study revealed that ROS generation was significantly increased in INS-1 cells exposed to 0.1, 1 or 10-μM MEHP.
To investigate the effect of MEHP and MBP on insulin secretion, insulin secretion by INS-1 cells were examined, of which is a rat islet cell line. MEHP and MBP decreased insulin secretion in a dose-dependent manner and significant effects were observed at 0.1, 1, or 10-μM doses. Also, INS-1 and INS-2 mRNA expression levels were decreased in all MEHP and MBP dose levels. This accordingly showed that the insulin secretion results were compatible with INS-1 and INS-2 mRNA expression levels.
Most importantly controlling expression of pancreatic β-cell function (insulin gene transcription) is Pdx1 through transcription factor which is FOXO1. Phosphorylation of FOXO1 promotes FOXO1 cytoplasmic retention and ubiquitination, which serves as a central mechanism for controlling FOXO1 stability and prevents its transcriptional activity [41, 42]. Moreover, FOXO1 has different effects on beta cell. First of all, FOXO1 recovers β-cell mass and inhibits diabetes in Insulin receptor substrate 2 (Irs2) knockout mice [43] and overexpression of nuclear FOXO1 in β-cells prevents β-cell hyperplasia in insulin-resistant mice [44]. In addition to that, FOXO1 activates gene expression in response to oxidative stress to preserve insulin secretion and promote cell survival [45]. This in turn, provides a molecular link by which FOXO1 integrates cell surface receptor signaling into gene transcriptional profiling. Furthermore, the effects of SIRT1 on FOXO function are complex and range depending on the FOXO target genes. Several reports showed that SIRT1 promoted transcription of FOXO target genes involved in stress resistance and decreased transcription of genes involved in apoptosis [46, 47]. In the same manner similar results were achieved in INS cells. In the present study, it was also found decreased FOXO1 levels in MEHP and MBP exposures. This can mean that Pdx1 is downregulated in the in-vitro MEHP-exposed groups in conjunction with its predicted negative modulator. It has been shown that FOXO1 and Pdx1 exhibit mutually exclusive patterns of nuclear localization in β-cells, and constitutive nuclear expression of a mutant FOXO1 is associated with lack of Pdx1 expression. In addition, FOXO1 acts as a repressor of Foxa2-dependent expression of Pdx1 gene [43, 48]. Accordingly, Pdx1 plays an important role in pancreas development, β cell differentiation, and maintenance of mature b-cell function [49]. Hence, FOXO1 negatively regulates Pdx1 gene transcription. Besides Pdx1 down regulation has also been reported to impair mitochondrial function, resulting in impaired insulin secretion [50].
As a matter of fact the bcl-2 family is very important in the regulation of apoptosis and is contained of both pro-apoptotic and anti-apoptotic members but in our study like the others, bcl-2 and bcl-x levels were decreased for MEHP and MBP dose levels. In current study, cell cycle regulators p53 levels were also investigated [51]. The mRNA levels of p53 were decreased in high dose MEHP and MBP after 24, 48, and 72 h treatments. DNA damage resulting from cell cycle arrest activates p53 leads to induction of DNA repair. If repair fails, p53 induces apoptosis via Bax gene [52].
To the best of our knowledge, no other in-vivo or in-vitro studies have investigated whether phthalate metabolites affect β-cell function. One recent study has however investigated the acute effect of MEHP, but only in order to get a first indication of the relevance of their model system [53]. They reported limited effect of acute exposure, but only three concentrations were included [53]. However, in rats exposed to DEHP in utero, the glucose homeostasis was disrupted, suggesting that this phthalate may induce a β- cell dysfunction [15]. Interestingly, DEHP reduced the pancreatic insulin content, and the authors suggested that defects in insulin action early in life could be compensated by higher insulin sensitivity in offspring. Then, β-cell failure may occur with age and decreased pancreatic insulin content and reduced β-cell mass were occurred because the production of new β-cells in adulthood is low [15]. On the other hand, MEHP has also been reported to alter glucose tolerance in rats, due to abnormal glucose content in liver and skeletal muscle [15]. These results suggest that MEHP, which is a metabolite of DEHP might be involved in altered glucose metabolism, and may impact on T2D development through other pathways than a direct effect on the insulin secretion from pancreatic β-cells.
In summary, it is concluded that oxidative stress is a toxigenic mechanism of MEHP and MBP toxicity on INS-1 cells. As a result, phthalate metabolites caused changes in gene expression at the molecular level by increasing oxidative stress in pancreatic beta cells, resulting in a decrease in insulin synthesis. The doses we have selected and used here are higher than current biomonitoring levels so this is a hazard characterization and mechanistic study. Many studies suggest that mitochondrial dysfunction is vital in the pathogenesis of IR [54, 55]. Therefore, it is assumed that MEHP and MBP-mediated beta cell dysfunctions are an important factor in insulin resistance or type 2 diabetes.
Contributor Information
Gözde Karabulut, Dumlupınar University, Faculty of Science, Department of Biology, 43100, Evliya Çelebi Campus, Andız Mahallesi, Kütahya, Turkey.
Nurhayat Barlas, Hacettepe University, Science Faculty, Department of Bİology, 06800, Beytepe Campus, Beytepe Mahallesi, Ankara, Turkey.
Funding
This study was carried out by using the facilities in research laboratories of Kütahya Dumlupınar University, Faculty of Science and Department of Biology.
Conflict of interest
The authors declare that they have no known competing financial interests or personal relationships that could have appeared to influence the work reported in this paper.
References
- 1. Alonso-Magdalena P, Morimoto S, Ripoll C et al. The estrogenic effect of bisphenol A disrupts pancreatic beta-cell function in vivo and induces insulin resistance. Environ Health Perspect 2006;114:106–112. [DOI] [PMC free article] [PubMed] [Google Scholar]
- 2. Howard SG, Lee DH. What is the role of human contamination by environmental chemicals in the development of type 1diabetes? J Epidemiol Community Health 2012;66:479–81. [DOI] [PubMed] [Google Scholar]
- 3. Kamrin MA. Phthalate risks, phthalate regulation, and public health: a review. J Toxicol Environ Health B Crit Rev 2009;12:157–74. [DOI] [PubMed] [Google Scholar]
- 4. Rubin BS. Bisphenol A: An endocrine disruptor with widespread exposure and multiple effects. J Steroid Biochem Mol Biol 2011;127:27–34. [DOI] [PubMed] [Google Scholar]
- 5. Grün F., Blumberg B. Perturbed nuclear receptor signaling by environmental obesogens as emerging factors in the obesity crisis. Rev Endoc Metab Disord 2007;8:161–71. [DOI] [PubMed] [Google Scholar]
- 6. Koch HM, Calafat AM. Human body burdens of chemicals used in plastic manufacture. Philos Trans R Soc Lond B Biol Sci 2009;364 : 2063–78. [DOI] [PMC free article] [PubMed] [Google Scholar]
- 7. Alonso-Magdalena P, Ropero AB, Soriano S et al. Bisphenol-A acts as a potent estrogen via nonclassical estrogen triggered pathways. Mol Cell Endocrinol 2012;355:201–7. [DOI] [PubMed] [Google Scholar]
- 8. Heudorf U, Mersch-Sundermann V, Angerer J. Phthalates: toxicology and exposure. Int J Hyg Environ Health 2007;210: 623–634. [DOI] [PubMed] [Google Scholar]
- 9. Kang JH, Kondo F, Katayama Y. Human exposure to bisphenol A. Toxicol 2006;226:79–89. [DOI] [PubMed] [Google Scholar]
- 10. Meeker JD, Sathyanarayana S, Swan SH. Phthalates and other additives in plastics: human exposure and associated health outcomes. Philos Trans R Soc Lond B Biol. Sci 2009;364:2097–113. [DOI] [PMC free article] [PubMed] [Google Scholar]
- 11. Wormuth M, Scheringer M, Vollenweider M. What are the sources of exposure to eight frequently used phthalic acid esters in Europeans? Risk Anal 2006;26: 803–824. [DOI] [PubMed] [Google Scholar]
- 12. Alonso-Magdalena P, Quesada I, Nadal A. Endocrine disruptors in the etiology of type 2 diabetes mellitus. Nat Rev Endocrinol 2011;7: 346–353. [DOI] [PubMed] [Google Scholar]
- 13. Bodin J, Bølling AK, Samuelsen M. Long-term bisphenol A exposure accelerates insulitis development in diabetes-prone NOD mice. Immunopharmacol Immunotoxicol 2013;35: 349–358. [DOI] [PubMed] [Google Scholar]
- 14. Lang IA, Galloway TS, Scarlett A et al. Association of urinary bisphenol A concentration with medical disorders and laboratory abnormalities in adults. JAMA 2008;300:1303–1310. [DOI] [PubMed] [Google Scholar]
- 15. Lin Y, Wei J, Li Y et al. Developmental exposure to di(2-ethylhexyl) phthalate impairs endocrine pancreas and leads to long-term adverse effects on glucose homeostasis in the rat. Am J Physiol Endocrinol Metab 2011;301: E527-E538. [DOI] [PubMed] [Google Scholar]
- 16. Nadal A, Alonso-Magdalena P, Soriano S et al. The pancreatic beta-cell as a target of estrogens and xenoestrogens: implications for blood glucose homeostasis and diabetes. Mol Cell Endocrinol 2009;304: 63–68. [DOI] [PubMed] [Google Scholar]
- 17. Vehik K, Dabelea, D. The changing epidemiology of type 1 diabetes: why is it going through the roof? Diabetes Metab Res Rev 2011;27 : 3–13. [DOI] [PubMed] [Google Scholar]
- 18. Makaji E. Effect of environmental contaminants on Beta cell function. Int J Toxicol 2011;30 : 410–8. [DOI] [PubMed] [Google Scholar]
- 19. The World Health Organization . Fact sheets, Diabetes: the Cost of Diabetes. 2012b. Available at: http://www.who.int/mediacentre/factsheets/fs236/en/ (16 June 2020, date last accessed).
- 20. Kappenstein O, Vieth B, Luch A et al. Toxicologically relevant phthalates in food. Mol Clin Environ Toxicol 2012;101:87–106. [DOI] [PubMed] [Google Scholar]
- 21. Petersen JH, Jensen LK. Phthalates and food-contact materials: enforcing the 2008 European Union plastics legislation. Food Addit Contam Part A Chem Anal Control Expo Risk Assess 2010;27 : 1608–16. [DOI] [PubMed] [Google Scholar]
- 22. The Norwegian Institute of Public Health . B.7.08 Plasticizers - Phthalates. 2008. Available at: http://www.fhi.no/eway/default.aspx?pid=233&trg=MainLeft_6039&MainArea_5661 (01 July 2020, date last accessed).
- 23. Wittassek M, Angerer J. Phthalates: metabolism and exposure. Int J Androl 2008;31 : 131–8. [DOI] [PubMed] [Google Scholar]
- 24. Frederiksen H, Jørgensen N, Andersson AM. Correlations between phthalate metabolites in urine, serum, and seminal plasma from young Danish men determined by isotope dilution liquid chromatography tandem mass spectrometry. J Anal Toxicol 2010;34: 400–410. [DOI] [PubMed] [Google Scholar]
- 25. Högberg J, Hanberg A, Berglund M et al. Phthalate diesters and their metabolites in human breast milk, blood or serum, and urine as biomarkers of exposure in vulnerable populations. Environ Health Perspect 2008;116: 334–339. [DOI] [PMC free article] [PubMed] [Google Scholar]
- 26. Lind PM, Roos V, Rönn M et al. Serum concentrations of phthalate metabolites are related to abdominal fat distribution two years later in elderly women. Environ Health 2012;11:21. [DOI] [PMC free article] [PubMed] [Google Scholar]
- 27. Olsén L, Lampa E, Birkholz DA et al. Circulating levels of bisphenol A (BPA) and phthalates in an elderly population in Sweden, based on the Prospective Investigation of the Vasculature in Uppsala Seniors (PIVUS). Ecotox Environ Safety 2012;75 : 242–248. [DOI] [PubMed] [Google Scholar]
- 28. Bornehag CG, Nanberg E. Phthalate exposure and asthma in children. Int. J. Androl 2010;33 : 333–45. [DOI] [PubMed] [Google Scholar]
- 29. Svensson K, Hernández-Ramírez RU, Burguete-García A et al. Phthalate exposure associated with self-reported diabetes among Mexican women. Environment Resear 2011;111 : 792–796. [DOI] [PMC free article] [PubMed] [Google Scholar]
- 30. Yessoufou A, Wahli W. Multifaceted roles of peroxisome proliferator-activated receptors (PPARs) at the cellular and whole organism levels. Swiss Med Wkly 2010;15 : 13071. [DOI] [PubMed] [Google Scholar]
- 31. Song L, Xia W, Zhou Z et al. Low-level phenolic estrogen pollutants impair islet morphology and beta-cell function in isolated rat islets. J Endocrinol 2012;215 : 303–11. [DOI] [PubMed] [Google Scholar]
- 32. Kavlock R, Boekelheide K, Chapin R et al. NTP Center for the evaluation of risks to human reproduction: phthalate expert panel report on the reproductive and developmental toxicity of di-n-butyl phthalate. Repro Toxicol 2002;16:489–527. [DOI] [PubMed] [Google Scholar]
- 33. Lin H, Ge RS, Chen GR et al. Involvement of testicular growth factors in fetal Leydig cell aggregation after exposure to phthalate in utero. Proc Natl Acad Sci USA. 2008;105: 7218–7222. [DOI] [PMC free article] [PubMed] [Google Scholar]
- 34. Silva MJ, Barr DB, Reidy JA et al. Glucuronidation patterns of common urinary and serum monoester phthalate metabolites. Arch Toxicol 2003;77:561–7. [DOI] [PubMed] [Google Scholar]
- 35. Silva MJ, Slakman AR, Reidy JA et al. Analysis of human urine for fifteen phthalate metabolites using automated solid-phase extraction. J Chromatogr B Analyt Technol Biomed Life Sci 2004;805:161–7. [DOI] [PubMed] [Google Scholar]
- 36. Calafat AM, Slakman AR, Silva MJ et al. Automated solid phase extraction and quantitative analysis of human milk for 13 phthalate metabolites. J Chromatogr B Analyt Technol Biomed Life Sci 2004;805:49–56. [DOI] [PubMed] [Google Scholar]
- 37. Silva MJ, Kato K, Gray EL et al. Urinary metabolites of di-n-octyl phthalate in rats. Toxicol 2005;210:123–33. [DOI] [PubMed] [Google Scholar]
- 38. Erkekoglu P, Rachidi W, Yuzugullu O et al. Evaluation of cytotoxicity and oxidative DNA damaging effects of di (2-ethylhexyl)- phthalate (DEHP) and mono (2-ethylhexyl)-phthalate (MEHP) on MA-10 Leydig cells and protection by selenium. Toxicol Appl Pharmacol 2010;248:52–62. [DOI] [PubMed] [Google Scholar]
- 39. Ambruosi B, Uranio MF, Sardanelli AM et al. In vitro acute exposure to DEHP affects oocyte meiotic maturation, energy and oxidative stress parameters in a large animal model published correction appears in PLoS One 2011;6(11):e27452. [DOI] [PMC free article] [PubMed] [Google Scholar]
- 40. Ghosh J, Das J, Manna P et al. Hepatotoxicity of di-(2-ethylhexyl) phthalate is attributed to calcium aggravation, ROS-mediated mitochondrial depolarization, and ERK/NFjB pathway activation. Free Radical Biol Med 2010;49:1779–91. [DOI] [PubMed] [Google Scholar]
- 41. Butler AE, Janson J, Bonner-Weir S et al. Betacell deficit and increased beta-cell apoptosis in humans with type 2 diabetes. Diabetes 2003;52:102–10. [DOI] [PubMed] [Google Scholar]
- 42. Lacy PE, Kostianovsky M. Method for the isolation of intact islets of Langerhans from the rat pancreas. Diabetes 1967;16:35–9. [DOI] [PubMed] [Google Scholar]
- 43. Kitamura T. The forkhead transcription factor Foxo1 links insulin signaling to Pdx1 regulation of pancreatic beta cell growth. J Clin Invest 2002;110:1839–47. [DOI] [PMC free article] [PubMed] [Google Scholar]
- 44. Nakae J, Biggs WH 3rd, Kitamura T et al. Regulation of insulin action and pancreatic beta-cell function by mutated alleles of the gene encoding forkhead transcription factor Foxo1. Nat Genet 2002;32:245–53. [DOI] [PubMed] [Google Scholar]
- 45. Wang W, Craig ZR, Basavarajappa MS et al. Di (2-ethylhexyl) phthalate inhibits growth of mouse ovarian antral follicles through an oxidative stress pathway. Toxicol Appl Pharmacol 2012;258:288–95. [DOI] [PMC free article] [PubMed] [Google Scholar]
- 46. Brunet A, Sweeney LB, Sturgill JF et al. Stress-dependent regulation of FOXO transcription factors by the SIRT1 deacetylase. Science 2004;26; : 2011–5. [DOI] [PubMed] [Google Scholar]
- 47. van der Horst A, Tertoolen LG, de Vries-Smits LM et al. FOXO4 is acetylated upon peroxide stress and deacetylated by the longevity protein hSir2 (SIRT1). J Biol Chem 2004;279:28873–9. [DOI] [PubMed] [Google Scholar]
- 48. Kitamura T, Ido Kitamura Y. Role of FoxO proteins in pancreatic beta cells. Endoc J 2007;54:507–15. [DOI] [PubMed] [Google Scholar]
- 49. Kaneto H, Miyatsuka T, Kawamori D et al. PDX-1 and MafA play a crucial role in pancreatic beta-cell differentiation and maintenance of mature beta-cell function. Endocr J 2008;55:235–52. [DOI] [PubMed] [Google Scholar]
- 50. Brissova M, Shiota M, Nicholson WE et al. Reduction in pancreatic transcription factor PDX-1 impairs glucose-stimulated insulin secretion. J Biol Chem 2002;277:11225–32. [DOI] [PubMed] [Google Scholar]
- 51. Paunesku T, Mittal S, Protić M et al. Proliferating cell nuclear antigen (PCNA): ringmaster of the genome. Int J Radiat Biol 2001;77 : 1007–1021. [DOI] [PubMed] [Google Scholar]
- 52. Miyashita T, Krajewski S, Krajewska M et al. Tumor suppressor p53 is a regulator of bcl-2 and bax gene expression in vitro and in vivo. Oncogen 1994;9:1799–805. [PubMed] [Google Scholar]
- 53. Hectors TLM, Vanparys C, Anna Pereira-Fernandes A et al. Evaluation of the INS-1 832/13 cell line as a beta-cell based screening system to assess pollutant effects on beta-cell function. PloS one 2013;8:600–30. [DOI] [PMC free article] [PubMed] [Google Scholar]
- 54. Fröjdö S, Vidal H, Pirola L. Alterations of insulin signaling in type 2 diabetes: a review of the current evidence from humans. Biochim Biophys Acta 2009;1792:83–92 [DOI] [PubMed] [Google Scholar]
- 55. Lim S, Cho YM, Park KS et al. Persistent organic pollutants, mitochondrial dysfunction, and metabolic syndrome. Ann N Y Acad Sci 2010;1201:166–76. [DOI] [PubMed] [Google Scholar]


