

Abstract
The thermo-mechanical behavior and texture evolution of two overaged Al 7056 alloy plates, in T761 and T721 tempers, are measured over a wide range of strain rates (10‒4 – 3 × 10³ s‒1) and temperatures (22–300 °C) under uniaxial tension and compression along the thickness direction, i.e. normal to the plate surface. A detailed study of the initial microstructure reveals an increase in precipitate size and decrease in density of precipitates, as the alloy is aged from the T761 to T721 temper; which in turn affects the flow stress and strain hardening behavior. Differences in flow strength and strain hardening rate, as well as tension-compression asymmetry in the two tempers, are apparent at the lower temperatures (22 °C & 100 °C) and decrease significantly at the higher temperatures (200 °C & 300 °C). Furthermore, initial texture measurements show a strong texture gradient along the normal direction (ND) of the plate. This texture gradient affects the ultimate stress insignificantly. However, it does have a considerable effect on the failure strains of specimens taken from different locations through the thickness. A transition from shear fracture at and below 200 °C to cup and cone fracture mode above 200 °C is observed in tension. Both tempers exhibit a positive strain rate sensitivity (SRS) that is dependent on temperature and strain rate. A sharp decrease in flow stress is found at 300 °C. The Khan-Liu (KL) model is modified to correlate with the measured thermo-mechanical responses of the two tempers over the studied, wide range of strain rates and temperatures. There is a close correlation between simulated and observed results.
Keywords: 7XXX series aluminum alloys, Precipitation hardening, Strain rate sensitivity, Texture evolution, Constitutive modeling
1. Introduction
Aluminum alloys have been of interest to the military, aerospace, and automobile industries for many years due to their high strength to weight ratio, excellent corrosion and fatigue resistance, formability and low cost (Doherty et al., 2012; Miller et al., 2000; Warner, 2006). The desire for lightweight structural applications has been in high demand in order to deliver better fuel efficiency and agility in transportation. In the defense organizations, aluminum alloys are used in numerous weight-critical armor applications such as aircrafts, body armor and vehicles. These alloys serve as a potential replacement to heavier metals such as steel, whenever possible. Recently, Army Research Laboratory (ARL) evaluated the ballistic and blast properties of AA7056 (Gallardy, 2017). This potentially next generation aluminum use in armor may be available in two different tempers, both in the overaged condition (T7). The T761 temper is a higher strength variant with possible applications in direct fire threats. The T721 temper is a lower strength and higher ductility variant that may have applications in underbody blast protection. The ballistic evaluations showed that AA7056 performed similarly to another existing aluminum armor material, AA7085. Even though AA7056 and AA7085 have similar chemical compositions, the two alloys are different in that AA7056 contains 20% more zinc and 25% more magnesium when compared to AA7085 (Gallardy, 2017). In addition, AA7056 is free of chromium and contains a higher amount of manganese, while AA7085 contains equal amounts of chromium and manganese (Gallardy, 2017). Therefore, it is of interest to characterize and understand the mechanical behavior of AA7056 under different stress states, and over a wide range of strain rates and temperatures.
The 7XXX series alloys have a face centered cubic (FCC) crystal structure and utilizes zinc and magnesium solutes that form plate-shaped MgZn2 precipitates in the aluminum matrix to strengthen and alter the material behavior through various heat treatments (Gjonnes et al., 1970; Park and Ardell, 1983; Srivatsan et al., 1997). The amount of shearable and non-shearable precipitates, as well as solutes, formed in the grains are dependent on the aging process, and are critical to the strength, ductility, toughness, and fracture mode of the alloy (Cheng et al., 2003; Dumont et al., 2003; Gracio et al., 2004; Pedersen et al., 2008; Poole et al., 2005). The alloy is most ductile when a large number of solute clusters are present due to natural aging; and at peak strength when the density of shearable precipitates is at a maximum as a result of artificial aging. As aging continues, the precipitates increase in size and become non-shearable or incoherent to the matrix (Park and Ardell, 1983), thereby reducing the overall strength. The formation of plate-shaped precipitates during the precipitation process along with the addition of copper solutes and increase in zinc to magnesium ratio have allowed for 7XXX series alloys to achieve very high strengths at ambient temperatures, in addition to an excellent balance between strength and toughness (Deschamps et al., 1999; Hatch, 1984; Nie et al., 1996; Warner, 2006). While zinc and magnesium additions provide high strength, they also decrease the material’s resistance to corrosion. Exfoliation corrosion and stress corrosion cracking initiate at grain boundaries which results in intergranular cracks and fracture. This is commonly observed in 7XXX series alloys due to a lack of stable solute clusters or Guinier Preston (GP) zones formed during the precipitation process, which results in inhomogeneous precipitation and the development of precipitate free zones (PFZ) near grain boundaries (Hatch, 1984). PFZs are generally softer than the matrix and is an area that when populated with a fine dispersion of precipitates, promotes strain localization in the form of planar slip during deformation (Hahn and Rosenfield, 1975).
The development of planar slip band results from the repeated shearing of precipitates by dislocation motion and is a mechanism that leads to premature tensile fracture due to the formation of intergranular cracks. Embury and Nes (1973, 1974) investigated the tensile behavior and fracture characteristics of an Al–Zn–Mg alloy in T4 and T6 conditions. They found that the amount of grain boundary precipitates, and width of the PFZ, had a critical role in controlling ductility. Ductility increased when grain boundary precipitates occupied low areal fractions, thus increasing the width of the PFZ and allowing for the planar slip bands to spread. This in turn reduces the amount of strain localization in the region. Moreover, fracture by intergranular cracking decreased when deformation occurred at elevated temperatures. Similar observations were noticed by Chen et al. (2009) and by Srivatsan et al. (1992, 2008, 1997) in 7XXX series alloys. Several improvements have been made to the microstructure over the years to minimize the tendency toward intergranular fracture. This includes the addition of copper solutes (Deschamps et al., 1999) and dispersoids (Embury and Nes, 1974) to aid the growth of stable GP zones and to promote spread of slip, respectively. Furthermore, increasing aging time allows for more non-shearable precipitates to form (Puiggali et al., 1998; Zhao and Frankel, 2007). However, the latter process is performed at the expense of decreasing strength since the alloy is past peak strength. Stress corrosion cracking (SCC) is most susceptible when tensile stress is applied in the normal or through thickness direction due to the elongated grain structure and presence of large inclusions (Hatch, 1984; Jordon et al., 2009). Through-thickness properties are important for ballistic and blast armor applications.
Precipitate hardened aluminum alloys have a unique set of mechanisms that resist plastic deformation. FCC metals deform by dislocation glide along the {111}<110> octahedral slip system at ambient temperature. Dislocation forests as well as precipitates and solutes formed during the precipitation process are short-range barriers that can be overcome with the aid of thermal energy. When plastic deformation occurs at quasi-static strain rates, the activation volume decreases with increasing plastic strain due to the increase in dislocation density and dislocation multiplication rate. This confirms the fact that dislocation forest hardening are the rate controlling mechanism for thermal activation (Nemat-Nasser and Li, 1998; Voyiadjis and Abed, 2005; Zerilli and Armstrong, 1987). Changes in strain rate in the quasi-static regime, along with small variations in temperature result in a substantial change in strain hardening rate and a marginal change in yield stress. This results in a stress-strain curve that “fans out” (Khan and Liang, 1999). The effects of thermal energy become more prominent at higher temperatures and is highlighted by an increase in strain rate sensitivity (SRS) that largely affects both yield stress and strain hardening rate (Khan and Liu, 2012; Khan and Meredith, 2010). The mechanisms governing dislocation motion change from thermal activation in the quasi-static regime to dislocation drag in the dynamic region, as indicated by an increase in flow stress. This is because the available time and the effectiveness for thermal energy to overcome the short-range barriers diminishes tremendously, which introduces viscous flow (Djapic Oosterkamp et al., 2000). Dislocations are moving at a faster rate, gain strength from the associated dissipation of energy, and are overcome by thermal vibrations, otherwise known as phonon drag (Gurrutxaga-Lerma et al., 2015; Meyers, 1994; Regazzoni et al., 1987). Furthermore, dispersion hardening is a strengthening mechanism for overaged aluminum alloys due to the increased population of non-shearable precipitates. Non-shearable precipitates are strong particles that have increased to a size and strength, such that they are no longer penetrable by dislocation glide. This in turn forces the dislocations to bypass or bow between the particles and form Orowan loops (Cheng et al., 2003; Poole et al., 2005). The accumulation of Orowan loops introduces an elastic back stress when the matrix enters the plastic region, thus increasing the local shear stresses and strains around the particle as well as the strain hardening rate. These local shear stresses cannot be maintained at large strains and elevated temperatures, resulting in stress saturation, particle shearing, and plastic relaxation (Ashby, 1972; Embury, 1985; Moan and Embury, 1979).
Extensive studies have been conducted on a both precipitate and solid solution strengthened aluminum alloys in order to phenomenologically model and characterize the strain rate sensitivity over a wide range of strain rates, temperatures, and stress states. A large number of models have been proposed over the years and can be divided into three categories: empirical phenomenological models (Johnson and Cook, 1983; Kabirian et al., 2014; Khan and Liang, 1999; Khan and Liu, 2012), microstructure based physical models (Nemat-Nasser and Li, 1998; Voyiadjis and Abed, 2005; Zerilli and Armstrong, 1987) and crystal plasticity models (Bhattacharyya et al., 2017, 2019; Han et al., 2004; Lebensohn and Tome, 1993). Each type of model is unique in its complexity and accuracy in capturing an available set of experimental data. Empirical phenomenological models are simple and require the least amount of computation time. On the other hand, crystal plasticity models are more complex, but can relate to intrinsic properties such as texture and interaction of precipitates to the material properties such as strain hardening rate, flow strength, and thermal softening.
Significant differences in mechanical behavior are observed when aluminum alloys are deformed at different strain rates, temperatures, and stress states (tension vs. compression). El-Magd and Abouridouane (2006) investigated the behavior of AA7075 and noticed that increasing strain rate resulted in an increase in failure strain for compression and decrease in failure strain for tension. A study by Clausen et al. (2004) on the temperature effect of an AA5083-H116 plate in the rolling direction under tension over a temperature range of 20 °C–500 °C, showed that a transition from shear fracture to cup and cone fracture occurred after 200 °C; and a considerable increase in fracture strain was present at 400 °C. Khan and Meredith (2010) and Khan and Liu (2012) investigated the mechanical response of AA6061-T651 and AA2024-T351, respectively, in the form of bar stock under compression loads at both quasi-static and dynamic strain rates, over a temperature range of ‒40 °C–315 °C. A transition from zero to positive SRS was observed between 85 °C and 100 °C for quasi-static strain rates. In addition, strain hardening rate decreased as temperature and strain rate increased. Negative strain hardening due to thermal softening was observed for AA6061-T651 at 10‒4 s‒1 strain rate and 230 °C, and for all strain rates at 315 °C. Furthermore, Seidt and Gilat (2013) studied the mechanical response of AA2024-T351 plate under compression, tension, and torsion stress states at a strain rate of 1 s‒1 and over a temperature range of 50 °C–450 °C. Significant strain hardening was observed between 50 °C and 150 °C; and a substantial drop in flow stress was observed at 300 °C and 450 °C for all loading conditions. Moreover, they noticed a difference of 4% in flow stress between tension and compression stress states. Likewise, tension-compression asymmetry was found in studies by Fourmeau et al. (2013, 2011), Holmen et al. (2017), and Tucker et al. (2010) in AA7075-T761, AA6070, and AA6061-T651, respectively. Holmen et al. (2017) analyzed and measured the strength differential (SD) effect between tension and compression for AA6070 in different tempering conditions (O, T4, T6, T7) and detected no SD effect for the O-temper and a positive dependence on yield strength for T4, T6 and T7 tempers. Similarly, no asymmetric behavior was observed for AA5754-O and AA5182-O by Pandey et al. (2013) and Kabirian et al. (2014), respectively.
Thus, the literature search and review reveal that no comprehensive study has been performed on AA7056 material over a wide range of strain rates and temperatures. Hence, the objective of the current work is to characterize the thermo-mechanical behavior of two overaged AA7056 plates, in T761 and T721 tempers, over a wide range of strain rates (10‒4 s‒1 to 3 × 10³ s‒1) and temperatures (22 °C–300 °C) under uniaxial (tension and compression) stress state in the thickness direction (normal to the plate). A detailed microstructural study is performed to further understand the differences in material behaviors such as yield stress, strain hardening, and tension-compression asymmetry. This comprehensive set of experimental results is used to develop a model that is able to capture the temperature and strain rate dependent SRS and predict the mechanical behavior of the alloy over a wide range of strain rates and temperatures under tension and compression loading conditions.
2. Experimental details
2.1. Material
Two tempers of AA7056 in the overaged condition (T7) were investigated in this study. The chemical composition for the alloy is listed in Table 1. The T761 temper is slightly overaged for improved ballistic protection (Gallardy, 2017), while the T721 temper is massively overaged for improved blast protection (Gallardy, 2017). Fig. 1 is a schematic strength vs. aging time curve that shows the effects of aging time on the strength of the alloy. All compression and tension specimens were obtained in ND from the same 63.5 mm (2.5 in) thick plates obtained from Constellium. The sample geometries and location from which the specimens are machined along the ND for the two tempers are shown in Figs. 2 and 3.
Table 1.
Reported chemical composition of AA 7056 plate (%wt).
| Zn | Mg | Cu | Zr | Mn | Fe | Si | Ti | Al |
|---|---|---|---|---|---|---|---|---|
| 8.5–9.7 | 1.5–2.3 | 1.2–1.9 | 0.05–0.15 | ≤0.20 | ≤0.12 | ≤0.10 | ≤0.08 | Remainder |
Fig. 1.

Schematic strength vs. aging time curve.
Fig. 2.

Sample geometries for (a) quasi-static compression (b) dynamic compression and (c) quasi-static tension. All dimensions are in mm.
Fig. 3.

Location of the compression and tension specimens along the ND of the AA7056-T761 and AA7056-T721 plates. All dimensions are in mm.
2.2. Microstructure
An initial microstructural analysis of AA7056 was performed to measure the size of the grains and precipitates for the two tempers. The grain structure was revealed using Keller’s reagent (1.0 mL hydrofluoric acid, 1.5 mL hydrochloric acid, 2.5 mL nitric acid, and 95 mL distilled water). Transmission electron microscopy (TEM) characterization was performed for the two tempers in order to analyze the size and distribution of the precipitates. The samples were cut into 3 mm discs and mechanically thinned to approximately 100 μm. Further thinning and electron transparency were achieved by dimple grinding using a final polish of 0.05 μm Al2O3, followed by ion milling.
Texture measurements were performed on the initial and deformed specimens using the neutron diffraction technique at the Center for Neutron Research, National Institute of Standards and Technology (NIST). The raw data for the {111}, {200}, and {220} poles was processed using the MTEX algorithm developed by Hielscher and Schaeben (2008) to obtain the orientation distribution function (ODF), which was subsequently used to recalculate the pole figures. Rotation corrections were made to ensure the angles φ = 0° and φ = 90° aligned with RD and TD, respectively.
2.3. Uniaxial quasi-static compression and tension experiments
Quasi-static compression and tension experiments were performed at different strain rates (10‒4 s‒1, 10‒2 s‒1 & 100 s‒1), and at different temperatures (22 °C, 100 °C, 200 °C & 300 °C) on a MTS axial/torsional servo-hydraulic 809 system, with an axial load capacity of 250 kN. A Kyowa high elongation strain gage (KFEL-2–120-C1) was attached to the specimen to measure the strain at 22 °C. The displacement data at elevated temperatures for compression was corrected using a “blank test”. The “blank test” provided compliance of the machine, platens, and lubrication. Convection heating was used for high temperature experiments and a thermocouple was directly cemented to the surface of the specimen to measure the temperature. The specimen was held at the desired temperature for 15 min before loading to ensure uniform and through heating.
Quasi-static compression specimens were machined from the middle section of the thickness and approximately 3.5 mm from the surface (Fig. 3); and will be referred to as middle and near surface specimens, respectively. The specimens had a diameter of 9.5 mm and length of 14.2 mm for a L/D ratio of 1.5. Tungsten disulfide grease from MK Impex Canada, was used to lubricate the platens and ends of the specimens in order to minimize friction and maintain a uniaxial stress state. Dimensions for the tension specimens were limited to the thickness of the plate and had a diameter of 6.4 mm and gage length of 38.1 mm. Square flanges were machined at both ends of the sample to fit the T-shaped groove MTS loading grips (Khan and Yu, 2012).
2.4. Uniaxial dynamic compression experiments
The split-Hopkinson pressure bar (SHPB) testing apparatus was used to perform uniaxial dynamic compression experiments at a nominal strain rate of 3 × 10³ s‒1 and at the same temperatures given in Section 2.3. The sample geometry for compression experiments had a diameter of 8.9 mm and length of 4.5 mm for a L/D ratio of 0.5. This is to ensure uniform deformation and to reduce the longitudinal and radial inertia effects on the deformation behavior. An annealed aluminum 1100 alloy “pulse shaper” with a diameter of 6.4 mm and thickness of 1.0 mm was placed on the impact side of the incident bar to reduce the high frequency Pochhammer-Chree oscillations and to increase the rise time for the incident pulse. Similar to the quasi-static compression samples, specimens were machined from the middle and approximately 8.3 mm from the surface of the plate (Fig. 3). A detailed description of the compression SHPB technique is provided in Khan and Liang (1999).
It should be noted that deformation under dynamic loading is adiabatic, and a significant amount of heat is entrapped in the specimen during plastic deformation. This causes an increase in the specimen temperature, which results in an artificial decrease in strain hardening in the material behavior. The temperature increase in the specimen can be estimated using the following equation:
| (1) |
where β, ρ, and Cp are the fraction of heat dissipation caused by plastic deformation, mass density, and specific heat at constant pressure, respectively. The amount of plastic work converted to heat, β, is usually assumed to be 0.9 for metals (Sung et al., 2010).
3. Results and discussion
3.1. Initial microstructure
3.1.1. Optical analysis
The as-received plates were divided into five sections (6.35 × 6.35 × 6.35 mm3) from surface to mid-plane to evaluate the changes in grain size through the thickness. Using the linear intercept method, the grain size was measured over a 1 mm2 area of material for each of the planes (i.e. ND-RD, ND-TD, RD-TD) on on each of the five sections. Fig. 4 shows the initial grain structure along the 1/10th and 1/2 ND-TD cross sections for the two tempers. The microstructure consists of large, pancake shaped grains and smaller recrystallized grains. Furthermore, the size of the grains increases steadily from the surface to mid-plane, which is due to the frictional forces between the surface of the plate and rolls during the rolling process. The average grain size for the grains near the surface (1/10th, 1/ 5th, 3/10th sections) are 78, 51 & 26 μm for the T761 temper and 92, 61 & 30 μm for the T721 temper in RD, TD, and ND, respectively; while the average grain size for grains at mid-section (2/5th and 1/2-sections) are 158, 94 & 32 μm for the T761 temper and 173, 107 & 35 μm for the T721 temper. Both tempers have an aspect ratio of 3:2:1 (RD:TD:ND) for grains near the surface and 5:3:1 for grains near the mid-section.
Fig. 4.

Optical micrograph of (a) AA7056-T761 at 1/10th section, (b) AA7056-T721 at 1/10th section, (c) AA7056-T761 at 1/2 section and (d) AA7056-T721 at 1/2 sections.
3.1.2. TEM analysis
Fig. 5 shows the precipitate morphology of AA7056 using a high angle annular dark field (HAADF) detector in STEM mode. The precipitates are in the form of hexagonally shaped plates and composed of zinc and magnesium elements (MgZn2). They are represented by bright spots due to the higher atomic number (Z) elements when compared to the aluminum matrix. There is a high number density of precipitates that are finely dispersed within the matrix for the T761 temper (Fig. 5a), while the T721 temper contains larger precipitates (Fig. 5b). The diameters of the plate-shaped precipitates are aligned with different matrix directions (i.e. [100], [110], [111]) and can be viewed face-on and edge-on. Moreover, the precipitate density is significantly reduced, and the distribution of precipitates becomes more inhomogeneous as the alloy is aged from the T761 to T721 temper. Fig. 6 shows the precipitate size distribution of the two tempers. The majority of the measured precipitates have a diameter between 10 and 25 nm for the T761 temper, and a diameter between 40 and 65 nm for the T721 temper. This suggests the precipitates for the T761 temper are shearable and in the transition η’ phase while the precipitates in the T721 temper are non-shearable and in the equilibrium η (MgZn2) phase (Srivatsan et al., 1997; Zhao and Frankel, 2007).
Fig. 5.

HAADF-STEM micrographs showing precipitate size and distribution for (a) T761 temper and (b) T721 temper.
Fig. 6.

Histograms showing the (a) diameter and (b) thickness distributions of the precipitates.
3.1.3. Crystallographic texture
The φ2 sections of the orientation density function (ODF) for the initial texture of AA7056-T761 are shown in Fig. 7. The as-received sample was divided into five sections (6.35 × 6.35 × 6.35 mm3) from surface to midplane to evaluate the through-thickness gradients. Triclinic sample symmetry was imposed for the orientation distribution function (ODF) analysis and it is clear that the initial texture exhibits orthorhombic sample symmetry. Therefore, orthorhombic sample symmetry was imposed for the ODFs in Fig. 7, which confines the subspace to 0 ≤ φ1, Φ, φ2 ≤ 90°. The texture near the surface (1/10th and 1/5th sections) is weak and shows an increase in shear texture <110>//RD, while the texture at the interior of the plate is consistent with rolling texture (Copper, S, Brass) components. This texture gradient is a result of the frictional forces between the surface of the plate and rolls during the rolling process. In addition, the recrystallization texture (Goss, Cube) components are present and mostly consistent throughout the thickness of the plate.
Fig. 7.
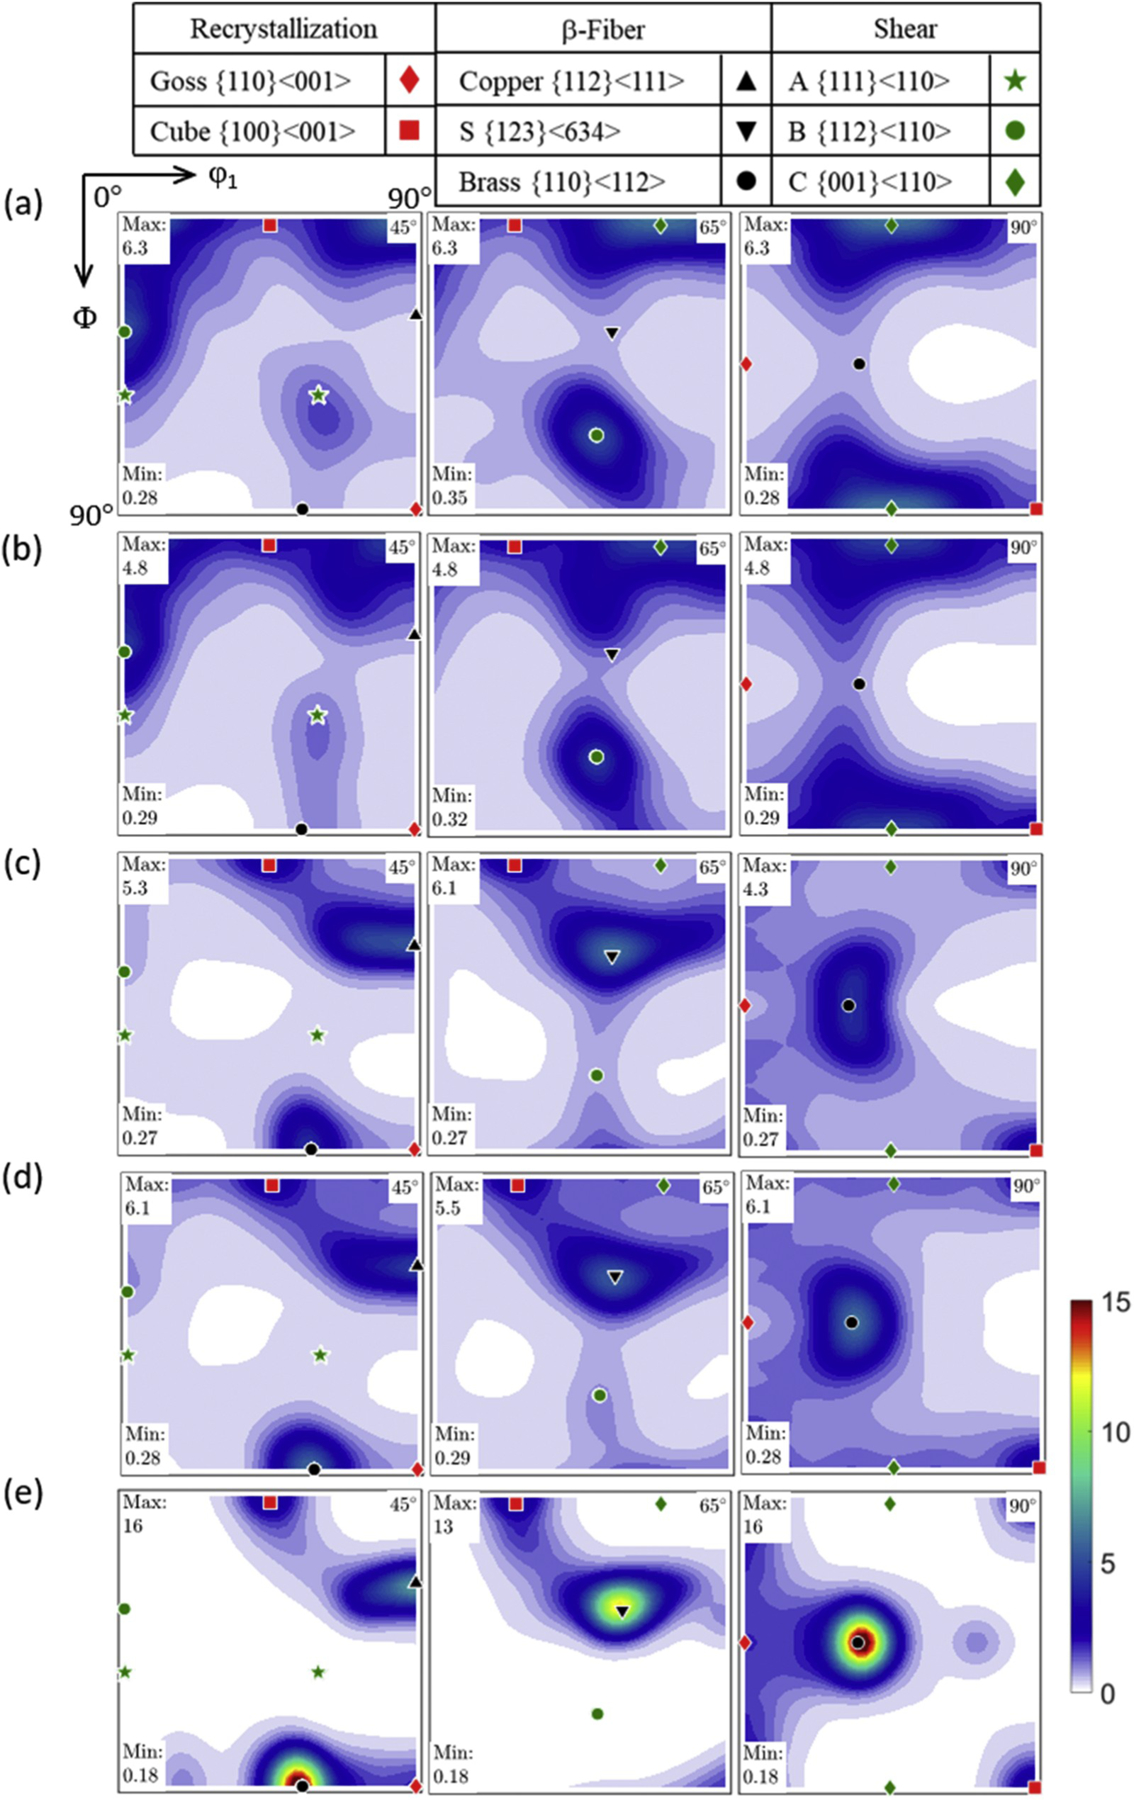
φ2 = 45°, 65°, 90° sections of the ODF showing the through-thickness texture gradient of as-received AA7056-T761 at various sections in ND (a) 1/10th section (0–6.35 mm), (b) 1/5th section (6.35–12.70 mm), (c) 3/10th section (12.70–19.05 mm), (d) 2/5th section (19.05–25.4 mm), and (e) 1/2 section (25.4–31.75 mm).
Fig. 8 shows the changes in β-fiber intensity from the surface to midplane. A nearly homogeneous variation in intensity along the fiber is present for the 1/10th and 1/5th sections. The β-fiber increases in intensity but remains somewhat homogeneous at the 3/10th and 2/5th sections. Overall, there is a 3-fold increase in S and brass orientations and a 2-fold increase for the copper orientation. The volume fraction for each of the orientations is calculated using the MTEX software by integrating their respective intensity values of the orientation distribution within 20° of the central location (Table 2). Similar variations in β-fiber intensity along the ND were also observed by Bhattacharyya et al. (2017) for AA7085-T711.
Fig. 8.

Variation in β-fiber intensity along the thickness of AA7056-T761 plate.
Table 2.
Volume fraction of texture components for AA7056-T761.
| Name | Indices | Bunge (φ1,Φ, φ2) | 1/10th | 1/5th | 3/10th | 2/5th | 1/2 |
|---|---|---|---|---|---|---|---|
| Copper | {112}<111> | 90° 35° 45° | 4 | 5 | 10 | 11 | 10 |
| S | {123}<634> | 59° 37° 63° | 5 | 7 | 12 | 13 | 16 |
| Brass | {110}<112> | 35° 45 0°/90° | 6 | 7 | 12 | 14 | 21 |
| Goss | {110}<001> | 0° 45° 0/90° | 4 | 4 | 5 | 5 | 5 |
| Cube | {100}<001> | 0° 0° 0/90° | 8 | 9 | 7 | 8 | 6 |
For purposes of comparison with the deformation texture, the 1/10th, 1/5th, and 3/10th sections (0–19.05 mm) were averaged to represent the initial texture of specimens extracted from near surface, while the 2/5th and 1/2-sections (19.05–31.75 mm) were averaged to represent the initial texture of specimens extracted from the middle of plate (Fig. 9). Fig. 10 shows the as-received φ2 sections of the ODF for AA7056-T721 at near surface and middle of the plate. Overall, the initial textures for the two tempers show similar changes between the near surface and mid-sections. However, the T721 temper has a slightly weaker β-fiber, but somewhat stronger recrystallization texture when compared to the T761 temper.
Fig. 9.

φ2 = 45°, 65°, 90°sections of the ODF for as-received AA7056-T761 at the (a) surface (1/10th, 1/5th, 3/10th sections) and (b) middle (2/5th and 1/2 sections).
Fig. 10.

φ2 = 45°, 65°, 90° sections of the ODF for as-received AA7056-T721 at the (a) surface (1/10th, 1/5th, 3/10th sections) and (b) middle (2/5th and 1/2 sections).
3.2. Uniaxial compression response of AA7056-T761 and AA7056-T721
Fig. 11 shows the effect of strain rate at different temperatures for the compression response of AA7056-T761 and AA7056-T721. For purposes of comparison with tension data, stress-strain results of compression specimens extracted from approximately mid-plane are reported in Fig. 11. At 22 °C, strain rate sensitivity for the quasi-static strain rates is marginal and a significant increase in positive SRS is observed between the quasi-static to dynamic loading regions. A representative curve at 22 °C in the quasi-static loading region is shown in Fig. A.1 to show the difference in strain hardening behavior between the two tempers. The strain hardening rate can be defined using a power law relationship (Hollomon, 1945):
| (2) |
where K is the strength coefficient, εp is the true plastic strain, and n is the strain hardening exponent. The strain hardening exponent, up to about ~8% strain, for the T761 and T721 tempers are 0.046 and 0.060, respectively. The initial strain hardening rate for the T721 temper is higher than the T761 temper by a factor of 1.25x. A similar increase in initial strain hardening rate from a slightly overaged to severely overaged state was noticed by Poole et al. (2005) and Cheng et al. (2003) for Al 6111 and Al 7039 alloys that have been aged to different times past peak strength. After 8% strain, the flow stress for the T761 temper is continuously increasing, while stress saturation is observed for the T721 temper. The low continuous strain hardening rate (n = 0.046) for the T761 temper is due to the fact that the majority of precipitates in the T761 temper are shearable. The repeated shearing of precipitates during slip reduces their resistance to dislocation motion and the amount of dislocations formed (Dumont et al., 2003; Pedersen et al., 2008; Poole et al., 2005). While this effect is more pronounced for underaged and peak aged alloys than for overaged alloys, Cheng et al. (2003) has shown that the transition point between shearable and non-shearable precipitates occurs during overaging. Since the T761 temper is slightly overaged, it is likely that the shearable/nonshearable transition point for AA7056 occurs sometime after the T761 aging time. Meanwhile, the precipitates in the T721 temper are nonshearable as they have increased to a critical size such that they are no longer shearable by dislocations (Cheng et al., 2003). This increases the initial strain hardening rate (n = 0.06), which is due to the storage of geometrically necessary dislocations and development of long-range internal stresses around the nonshearable precipitates. However, the stresses cannot be maintained, and the strain hardening exponent is reduced to 0.004 after 8% strain.
Fig. 11.

Compression behavior of AA7056-T761 and AA7056-T721 in normal direction at various strain rates and temperatures of (a) 22 °C, (b) 100 °C, (c) 200 °C, and (d) 300 °C.
Furthermore, there is a marginal difference in flow stress between compression specimens obtained from the mid-plane and near surface of the plate. At least two specimens were tested at each experimental condition, and a slightly higher flow stress is observed for specimens extracted from the mid-plane for both tempers. The average flow stress obtained from the two locations is shown in Fig. 12 at 22 °C and 30% strain for all strain rates. The error bars represent the range of values obtained from both locations, which is less than 4% from the average flow stress. Although the failure behavior of AA7056 is not the main focus of this paper, it is of interest to note that the specimens obtained at mid-plane for the T761 temper failed along 45° shear planes after 30% strain, while none of the near surface compression specimens failed. The T761 near surface specimens were subjected to further loading and showed no visible signs of failure even after 70% strain. The large difference in failure strain between the midplane and near surface specimens suggests that the texture gradient along ND may have a role in the fracture behavior of AA7056 and this will be further discussed in Section 3.5. None of the specimens failed at 30% strain for the T721 temper. Fig. 13 shows the deformed state of the specimens from the compression experiments. It is evident that the material behavior of the plate is anisotropic as the undeformed circular cross section becomes elliptical with the major and minor axis of the ellipse corresponding to RD and TD, respectively. The material behavior in the rolling and transverse directions will be examined as a follow-on to this study as fracture behavior of plate impact involves stresses from all directions of the plate. In addition, a barreling effect is observed near the equator of the specimen; and this is due to friction between the specimen and platens.
Fig. 12.

Average flow stress obtained from middle and near surface specimens vs. strain rate at 22 °C and ε = 0.30 under compression loading for AA7056-T761 and AA7056-T721. The error bars represent the range of values obtained from the two locations.
Fig. 13.

Comparison of the (a) undeformed circular surface and the (b) deformed elliptical surface.
At 100 °C, material behaviors such as flow stress, yield strength, and strain hardening rate are reduced for both tempers. An increase in positive SRS is apparent for the quasi-static loading region. At 200 °C, the material response becomes perfectly plastic at 100 s‒1 and 10‒2 s‒1 strain rates for both tempers as a result of dynamic recovery. Negative strain hardening due to thermal softening in the material is observed at 10‒4 s‒1 strain rate. Even though strain hardening rate continues to reduce with increasing temperature, the dynamic strain hardening remains greater than the quasi-static strain hardening. A possible explanation for these observations could be that at 200 °C, the longer deformation times at quasi-static strain rates allow for sufficient time for the dissolution of precipitates. Therefore, the material response is no longer dominated by the interaction between precipitates and dislocations. The dissolution of precipitates may not occur at 3 × 10³ s‒1 strain rate because the deformation time is very small (~10‒6 s). Thus, the dynamic strain hardening is decreasing at a slower rate than the quasi-static strain hardening. In addition, the difference in flow stress between the two tempers at 30% strain drops from 25% at 22 °C to 16% at 200 °C. At 300 °C, there is a significant drop in flow stress as the material enters the hot working region (T ≥ 0.55Tm). The material behavior in the quasi-static loading regime follows the same trend as at 200 °C. On the other hand, the dynamic material response becomes almost perfectly plastic for both tempers and this is likely due to the effects of thermal softening. Lastly, the positive SRS between the quasi-static and dynamic regimes increases by more than 2-fold when compared to deformation at 200 °C.
3.3. Uniaxial tension response of AA7056-T761 and AA7056-T721
Fig. 14 shows the tension response to failure for AA7056-T761 and AA7056-T721 at different strain rates and temperatures. The “X” marks the onset of plastic instability (beyond which conversion to true stress and strain is not valid). Table 3 summarizes the tension properties for the two tempers. It should be noted that the tensile failure strains listed in Table 3 are approximate values, since they are not the local strains inside the neck and thus do not represent the true failure strains of the alloy. Increasing strain rate reduces failure strain for temperatures up to 200 °C. This was also reported by Srivatsan (1992) and El-Magd and Abouridouane (2006) for Al 7150-T77 and Al 7075-T761 alloys, respectively. Unlike in compression loading, stress saturation is not present for the T721 temper due to the low uniform strains (ε ≤ 0.08). It is well known that the uniform strain is positively dependent on the strain hardening exponent (n) and inversely dependent on the strain rate sensitivity parameter (m) for materials that display a power-law hardening rate (Ghosh, 1977; Hollomon, 1945). Similar to compression loading, the T721 temper has a higher strain hardening rate due to the differences in precipitate size and density. Thus, a higher uniform strain is achieved. Furthermore, the T721 temper has a higher failure strain due to an increase in necking following uniform strain and prior to fracture (Fig. 14). On the other hand, the T761 temper fractured after slight necking at strain rates of 10‒2 s‒1 and 100 s‒1, and at 22 °C and 100 °C. Fig. 15 shows the failure mode and reduction in area for the T761 and T721 tempers for all temperatures at 100 s‒1 strain rate.
Fig. 14.

Tension behavior of AA7056-T761 and AA7056-T721 in normal direction at various strain rates and temperatures of (a) 22 °C (top set), 200 °C (bottom set), and (b) 100 °C (top set), 300 °C (bottom set).
Table 3.
Tension properties for AA7056-T761 and AA7056-T721.
| Temper | Strain Rate (s−1) | 22 °C |
100 °C |
200 °C |
300 °C |
||||||||
|---|---|---|---|---|---|---|---|---|---|---|---|---|---|
| Uniform Strain (%) | Failure Strain (%) | UTS (MPa) | Uniform Strain (%) | Failure Strain (%) | UTS (MPa) | Uniform Strain (%) | Failure Strain (%) | UTS (MPa) | Uniform Strain (%) | Failure Strain (%) | UTS (MPa) | ||
| T761 | 10−4 | 6.0 | 9.9 | 591 | 3.6 | 13.6 | 498 | 1.6 | 17.1 | 304 | 1.4 | 28.9 | 86.8 |
| 10−2 | 5.8 | 7.5 | 601 | 3.7 | 9.0 | 532 | 2.0 | 16.3 | 356 | 1.2 | 34.0 | 116 | |
| 100 | 4.8 | 6.2 | 597 | 3.9 | 7.8 | 554 | 2.7 | 13.7 | 409 | 2.2 | 30.7 | 153 | |
| T721 | 10−4 | 6.4 | 12.4 | 485 | 4.4 | 17.8 | 389 | 1.8 | 18.2 | 263 | 1.1 | 29.1 | 88.0 |
| 10−2 | 6.8 | 11.1 | 514 | 5.2 | 18.1 | 437 | 2.1 | 18.1 | 314 | 1.4 | 34.8 | 110 | |
| 100 | 7.0 | 9.6 | 514 | 6.3 | 13.4 | 467 | 2.9 | 15.7 | 355 | 2.4 | 30.0 | 147 | |
Note: All values are calculated from the engineering stress-strain curves, which is then converted to true stress and true strain.
Failure strains are approximate values, as they are not the local strains inside the neck.
UTS: Ultimate Tensile Stress.
Fig. 15.

Fracture mode and reduction of area for (a) AA7056-T761 and (b) AA7056-T721 at and various temperatures.
When deformation temperature is increased to 100 °C, flow stress, yield strength and strain hardening rate are reduced, similar to compression loading. Moreover, there is an increase in failure strain and decrease in uniform strain. At 200 °C, the T761 temper becomes significantly more ductile as indicated by an increase in necking prior to fracture for 10‒2 s‒1 and 100 s‒1 strain rates. A large increase (>100%) in failure strain is observed when compared to failure strain at 22 °C. On the other hand, the increase in failure strain for the T721 temper is less pronounced. However, necking becomes more apparent (Fig. 15b), as indicated by an increase in the reduction of cross-sectional area. The difference in failure strain and flow stress at each strain rate, as well as SRS, between the two tempers is reduced. At 300 °C, there is a significant increase in failure strain and the failure mode changes from shear fracture to a ductile, cup and cone fracture (Fig. 15). The large decrease in flow stress observed under compression loading is also present for tension loading. Similar observations were also noticed by Clausen et al. (2004) for AA5083-H116. Finally, the difference in flow strength between the two tempers is minimal.
3.4. Tension-compression asymmetry
There is a noticeable difference in terms of yield stress and strain hardening rate between the tension and compression loading for AA7056-T761 and AA7056-T721. A representative curve showing the tension-compression asymmetry behavior for each temper at 22 °C and 100 s‒1 strain rate is shown in Fig. A.2. A higher stress is needed for yielding under compression loading, while a higher initial strain hardening rate is observed for tension loading. Differences in strain hardening rate under tension and compression loading are likely attributed to differences in texture evolution and this will be further discussed in Section 3.5. Tension-compression asymmetry has been reported in many precipitate hardened aluminum alloys that have been tempered (Fourmeau et al., 2013, 2011; Seidt and Gilat, 2013; Tucker et al., 2010). The difference in flow stress can be characterized by the SD effect as defined in (Holmen et al., 2017):
| (3) |
where σc and σt are the compression and tension stress, respectively.
The average stress value between 1 and 2% strain is used to evaluate the SD effect for AA7056-T761 and AA7056-T721. Table 4 lists the SD effect for the two tempers at 100 s‒1 strain rate for all temperatures. The T761 temper exhibits a higher SD effect than the T721 temper and similar results were noticed by Holmen et al. (2017) in Al 6XXX series alloys as they concluded that the magnitude of the SD effect has a positive dependency on yield and flow stress. Increasing temperature reduces the asymmetry, though changes in strain rate imposed a negligible effect. The difference for the T761 temper is 9% at 22 °C and decreases to 3.5% at 300 °C, while the difference for the T721 temper is 7.7% and decreases to 2.2% at 300 °C.
Table 4.
Average strength differential (SD) effect at .
| Temper | Temperature |
|||
|---|---|---|---|---|
| 22 °C | 100 °C | 200 °C | 300 °C | |
| T761 | 9.0 | 8.2 | 7.4 | 3.5 |
| T721 | 7.7 | 7.4 | 6.2 | 2.2 |
3.5. Texture evolution
Initial microstructure, stress state, as well as deformation temperature, and strain rate are important factors that contribute to the differences in mechanical behavior of AA7056. Fig. 16 compares the texture evolution of AA7056-T761 compression specimens extracted from the mid-plane and near surface layers of the plate at 22 °C and 30% plastic strain. The overall texture for the near surface specimen is weaker due to the decrease in β-fiber intensity and increase in shear texture <110>//RD, which is expected. In both cases, the grains are rotating toward the {220} poles during deformation. This results in a high Schmid factor of m = 0.408 and promotes coplanar slip activity. The majority of grains are in the stable Brass {011}<112> orientation for the middle specimens, which activates 4 slip systems on 2 out of the 4 {111} planes. On the other hand, grains near the surface are split between rotating toward the Brass {011}<112> and Goss {011}<100> orientations. Similar changes in crystallographic texture are also observed for mid-plane and near surface AA7056-T721 compression specimens (Fig. A.3). According to Caillard and Martin (2003), four equal stress {111} slip systems are active for <001> grains, though only two of them are active for <112> grains. Therefore, middle specimens have a total of 4 slip systems activated on 2 out of 4 {111} planes, while near surface specimens can have up to 8 slip systems activated on all 4 {111} planes. A higher number of active slip systems, along with finer grain size, suggests a higher fracture strain for the near surface specimens.
Fig. 16.

Experimental {111}, {200}, and {220} pole figures comparing texture evolution of near surface and middle compression specimens for AA7056-T761 at 22 °C, , and εp = 0.3.
Fig. 17 shows the texture evolution of AA7056-T761 under tension and compression loading at midplane. At 5% plastic strain, a stable {011}<211> orientation is evident for both stress states, as the tension and compression axis are rotating toward the {211} and {220} poles, respectively. Consequently, the Copper {112}<111> component increases in stability under tension loading. The increase in <111> grains results in a Schmid factor of m = 0.272, which activates 6 slip systems on 3 out of 4 {111} planes and promotes collinear slip system activity. The high activity of collinear slip system activity is a likely reason for the higher initial strain hardening rate observed under tension loading. Similar changes in crystallographic texture are also observed for AA7056-T721 under tension and compression loading (Fig. A.4). Furthermore, it is of interest to note that yield stress is positively dependent on the Schmid factor. The higher yield stress under compression loading may be caused by texture evolution, though the pressure sensitivity and plastic anisotropy of the alloy are also possible contributing factors to the SD effect that should not be ruled out (Fourmeau et al., 2011; Holmen et al., 2017).
Fig. 17.

Experimental {111}, {200}, and {220} pole figures, and φ2 = 45° section of the ODF for AA7056-T761 under compression and tension loading at mid-plane, 22 °C, , and εp = 0.05.
At elevated temperatures and strain rates, changes in recrystallization texture can provide insight on the different types of recrystallization mechanisms that take place during deformation. Figs. 18 and 19 show the texture evolution of AA7056-T761 at near surface and AA7056-T721 extracted from mid-plane under compression loading at strain rates of 10‒4 s‒1 and 3 × 10³ s‒1; and at 22 °C, 200 °C and 300 °C. From the φ2 = 45° section of the ODF, it can be seen that increasing temperature at 10‒4 s‒1 strain rate results in an increase in Cube {001}<100> orientation for both tempers. In addition, an increase in rotated CubeND {001}<310> & {001}< 320> orientations is observed for the T761 temper. It is well known for cube orientated grains to nucleate at grain boundaries and transition bands (Engler and Lücke, 1992; Lücke and Engler, 1990); and thus suggests that dynamic recrystallization may be a possible contributing factor to the negative strain hardening behavior observed in the stress-strain data for 10‒4 s‒1 strain rate at 200 °C and 300 °C (Figs. 11 and 14).
Fig. 18.

φ2 = 45° section of the ODF for AA7056-T761 compression at near surface, strain rates of 10‒4 s‒1, 3 × 10³ s‒1, and 22 °C, 200 °C, 300 °C.
Fig. 19.

φ2 = 45° section of the ODF for AA7056-T721 compression at mid-plane, strain rates of 10‒4 s‒1, 3 × 10³ s‒1, and 22 °C, 200 °C, 300 °C.
Unlike deformation at 10‒4 s‒1 strain rate, increasing temperature at the dynamic strain rate, 3 × 10³ s‒1, results in a decrease in Cube {001}<100> and rotated CubeND {001}<310> & {001}<320> oriented grains. This is an indication that dynamic recrystallization no longer occurs at 3 × 10³ s‒1 strain rate, as the time for recrystallization to occur is very small (~10 6 s). Therefore, grain boundary motion is suppressed and no new grains are formed (Engler et al., 2001; Engler and Lücke, 1992). Lastly, increasing strain rate at constant temperature results in an increase in Goss {011}<100> and P {011}<122> orientated grains, which suggests the formation of micro-scale shear bands.
4. Constitutive modeling
The KHL model proposed by Khan and Liang (1999) has been subjected to many modifications over the years. The model relates the dependence of the flow stress on the coupled effects of strain hardening, strain rate and temperature; and has shown good predictions for the mechanical response of BCC metals, i.e. Ta-2.5%W and AerMet 100 steel (Khan and Liang, 1999), as well as HCP metals, i.e. Ti–6Al–4V (Khan et al., 2007, 2004; Khan and Yu, 2012). Regarding FCC metals, Khan and Liu (2012) made modifications to the KHL model to capture the coupling effect of strain rate and temperature on strain hardening, as well as the variable SRS present in many aluminum alloys such as AA2024-T351. The KL model was successful in predicting the thermo-mechanical response of AA2024-T351. Therefore, a similar form of the KL model is used to accommodate the thermo-mechanical behavior of AA7056 at various temperatures and strain rates.
4.1. Strain rate sensitivity of AA7056-T761 and AA7056-T721
The strain rate sensitivity of AA7056 is quantified and modelled using the SRS parameter, , introduced in Khan and Liu (2012). The experimental and model equations of are presented in Eqs. (4) and (5), respectively:
| (4) |
| (5) |
where σ0 is the flow stress at reference strain rate, and at a fixed value of temperature (i.e. 22 °C); σ is the flow stress at current strain rate, and at the same temperature. T, Tm, Tr, Tc are the current, melting, reference and threshold temperatures, respectively. K2 and m2 are material constants. Fig. 20 shows the temperature and strain rate dependent SRS is reasonably correlated for the two tempers under compression loading at different strain rates and temperatures in the quasi-static loading region.
Fig. 20.

Experimental and simulated values of at various strain rates and temperatures under compression loading at εp = 0.15 for (a) AA7056-T761 and (b) AA7056-T721.
Similar to the thermo-mechanical behavior of AA2024-T351 and AA6061-T651 (Khan and Liu, 2012; Khan and Meredith, 2010), the value increases with increasing temperature and decreasing strain rate. This is due to the fact that flow stress can be additively decomposed into two components: athermal stress and thermal stress. The athermal stress is the stress needed to overcome long-range barriers such as grain boundaries. It is independent of strain and only depends on the initial yield stress, which explains the marginal strain rate sensitivity observed at 22 °C. The thermal stress is the stress needed to overcome short-range barriers, such as precipitates, solutes, and impurities. It is activated by thermal energy and becomes more influential with increasing temperature. As discussed previously in Section 3.2, the precipitates begin to dissolute at 200 °C, which dramatically reduces the number of short-range barriers. In addition, there is more time for the precipitates to dissolute at 10‒4 s‒1 strain rate, as the deformation time is significantly longer than the deformation time at 10‒2 s‒1 strain rate. This could be a reason why the values at 10‒4 s‒1 strain rate are consistently higher than the values at 10‒2 s‒1 strain rate. The values increase by a factor of 20x and 40x for 10‒2 s‒1 and 10‒4 s‒1 strain rates, respectively, over the range of temperatures investigated.
4.2. Modeling approach
Based on the experimental observations of AA7056-T761 and AA7056-T721, the KL model is modified and expressed in the form of a new constitutive equation:
| (6) |
where f(ε, T) defines the temperature dependent strain hardening behavior; describes temperature dependent strain rate effect; h(T) describes the temperature sensitivity at reference strain rate; and k(ξ) captures the tension compression asymmetry ratio.
The specific forms of the model equations for AA7056-T761 and AA7056-T721 are expressed by Eq. (7) and Eq. (8), respectively:
| (7) |
| (8) |
where σ, εp, and are the flow stress, current plastic strain and current plastic strain rate, respectively. T, Tm, Tr are the current, melting and reference temperatures. ξ is the Lode parameter. All other constants not discussed are material constants.
4.2.1. Strain hardening function
As discussed in Section 3.2, increasing strain results in flow stress that is continuously increasing until fracture for AA7056-T761; and a high initial strain hardening rate that saturates at approximately at 7% plastic strain for AA7056-T721. Given the differences in strain hardening response, two strain hardening functions are proposed for the two tempers and are presented in Eqs. (9) and (10), respectively:
| (9) |
| (10) |
In addition, experimental results for AA7056 showed a decrease in strain hardening rate with increasing temperature, similar to 3 AA2024-T351 (Khan and Liu, 2012). Thus, the power-law thermal softening term, , is successfully implemented to characterize the coupling effect of temperature on strain hardening rate.
4.2.2. Strain rate effect and temperature sensitivity functions
The temperature dependent strain rate effect term , and temperature sensitivity function, h(T), are the same for the two tempers. While the quasi-static experimental results of AA7056-T761 and AA7056-T721 are successfully simulated, as shown in Fig. 20, the stress-strain behavior in the dynamic loading regime cannot be represented by the term in the original KL model (Khan and Liu, 2012). This is because a strain rate and temperature dependent strain rate effect is also present in the dynamic loading region, based on the experimental data for AA7056. It is for this reason that a second temperature term is proposed, , where K1 and m1 are material constants. The modified expression for the temperature and strain rate dependent strain rate sensitivity function, , is as follows:
| (11) |
In addition, with the assumption that K1 ≈ 0 and K2 ≫ 1, Eq. (11) becomes:
Eq. (11) has the capability to characterize the positive SRS that occurs at elevated temperatures in the dynamic loading region, as well as the transition from zero to positive SRS at temperatures above Tc in the quasi-static loading region.
Furthermore, a new thermal softening function, , is introduced. By replacing the power law thermal sensitivity term in the original KL model (Khan and Liu, 2012) with an exponential function, the significant decrease in flow stress at 300 °C can be successfully captured.
4.2.3. Tension compression asymmetry ratio
The tension compression asymmetry ratio is related by an exponential function in terms of the Lode parameter, e C(ξ+1). The Lode parameter is defined as , where θ is the Lode angle. This relation is also successfully implemented by Khan et al. (2012) to describe the tension compression asymmetry characteristics of a Ti–6Al–4V alloy. With ξ = −1 under compression loading and ξ = 1 under tension loading, Eq. (7) can be reduced to Eq. (12) for compression loading and Eq. (13) for tension loading:
| (12) |
| (13) |
Similarly, Eq. (8) is reduced to Eq. (14) for compression loading and Eq. (15) for tension loading:
| (14) |
| (15) |
4.2.4. Determination of model constants
The material constants for the modified KL model, Eqs. (7) and (8), as determined using the step by step calibration procedure in Appendix B, are initial values used for input into a least-squared based optimization program in Matlab. The optimum values for the constants are returned by the program after several iterations. The initial and optimized constants for AA7056-T761 and AA7056-T721 are listed in Tables 5 and 6.
Table 5.
Material constants for AA7056-T761.
| A | B | C | D4 | K1 | K2 | m1 | m2 | m3 | m4 | n0 | |
|---|---|---|---|---|---|---|---|---|---|---|---|
| Initial | 584.8 | 177.9 | 0.04484 | 14.69 | 0.00002453 | 84.41 | 3.031 | 1.138 | 1.048 | 3.040 | 0.3407 |
| Optimized | 557.1 | 204.7 | 0.03587 | 14.66 | 0.00002565 | 75.16 | 2.543 | 1.059 | 1.048 | 3.102 | 0.2726 |
Table 6.
Material constants for AA7056-T721.
| A | a | B | C | D4 | K1 | K2 | m1 | m2 | m3 | m4 | |
|---|---|---|---|---|---|---|---|---|---|---|---|
| Initial | 570.0 | 27.53 | 0.2276 | 0.03212 | 11.54 | 0.00002402 | 81.31 | 3.275 | 0.9050 | 1.683 | 2.763 |
| Optimized | 564.6 | 30.46 | 0.2382 | 0.02776 | 11.54 | 0.00002372 | 72.00 | 3.102 | 1.004 | 1.515 | 2.818 |
4.3. Correlations of experimental data with the modified constitutive model
The experimental results for AA7056-T761 and AA7056-T721 under compression and tension loading are simulated using the optimized material constants obtained in the modified KL model, Eq. (7) and Eq. (8), respectively, at different strain rates and temperatures.
Figs. 21 and 22 show the correlations between the experimental results and model simulations for AA7056-T761 and AA7056-T721 under compression loading at different strain rates and temperatures. As shown in these figures, the modified model has the capability to capture the dependence of flow stress on strain rate in both the quasi-static and dynamic loading regions and at different temperatures. The simulated flow stress is in reasonable agreement after approximately 5% plastic strain for experimental results that have a positive strain hardening response. At reference temperature and strain rate, the Hollomon hardening term in Eq. (9) is successful in predicting the low strain hardening response for AA7056-T761; while the stress saturation that occurs after 7% plastic strain for AA7056-T721 is effectively modelled using the Voce hardening term in Eq. (10). The average relative error (%) between the experimental and optimized model data is shown in Table 7. At quasi-static strain rates, the relative error is measured from 0 to 30% plastic strain. Since several reverberations of the stress waves are needed to achieve stress equilibrium for a dynamic test sample, the relative error for 3 × 10³ s‒1 strain rate is measured after 5% plastic strain. Overall, the simulated flow stress is very consistent with experimental data for quasi-static strain rates at 22 °C, 100 °C, and 200 °C (within 3%). A slightly larger variation (within 5%) is observed for data at 300 °C and 10‒2 s‒1, 100 s‒1, 3 × 10³ s‒1 strain rates.
Fig. 21.

Experimental and model correlations for AA7056-T761 under compression loading at various strain rates and temperatures of (a) 22 °C (top set), 200 °C (bottom set), and (b) 100 °C (top set), 300 °C (bottom set).
Fig. 22.

Experimental and model correlations for AA7056-T721 under compression loading at various strain rates and temperatures of (a) 22 °C (top set), 200 °C (bottom set), and (b) 100 °C (top set), 300 °C (bottom set).
Table 7.
Average relative error (%) for AA7056-T761 and AA7056-T721 under compression loading.
| Temper | Strain Rate (s−1) | Temperature |
|||
|---|---|---|---|---|---|
| 22 °C | 100 °C | 200 °C | 300 °C | ||
| T761 | 10−4 | 0.610 | 0.894 | 14.3 | 13.7 |
| 10−2 | 1.01 | 0.884 | 3.08 | 4.93 | |
| 100 | 1.18 | 3.20 | 1.10 | 3.46 | |
| 3 × 10³ | 2.43 | 5.52 | 1.10 | 4.55 | |
| T721 | 10−4 | 1.11 | 3.36 | 8.62 | 18.5 |
| 10−2 | 0.643 | 2.61 | 2.50 | 2.98 | |
| 100 | 1.14 | 2.04 | 0.799 | 4.27 | |
| 3 × 10³ | 3.02 | 5.60 | 3.22 | 1.90 | |
Figs. 23 and 24 show the experimental and simulated model results in tension for the two tempers at different strain rates and temperatures. The same material constants used to model the compression response were implemented for the tension response. As discussed in Section 3.4, flow stress under tension loading is lower than flow stress under compression loading due to the SD effect. This difference in flow stress is effectively related using the tension-compression asymmetry ratio, k(ξ). Table 8 shows the average relative error (%) between the experimental and optimized model data under tension loading. Similar to the simulated results for compression loading, the relative error between the simulated and experimental data is within 5% for experimental results that have a positive strain hardening response. Therefore, the modified model has the ability to correlate the changes in strain rate sensitivity at different temperatures under tension loading.
Fig. 23.

Experimental and model correlations for AA7056-T761 under tension loading at various strain rates and temperatures of (a) 22 °C (top set), 200 °C (bottom set), and (b) 100 °C (top set), 300 °C (bottom set).
Fig. 24.

Experimental and model correlations for AA7056-T721 under tension loading at various strain rates and temperatures of (a) 22 °C (top set), 200 °C (bottom set), and (b) 100 °C (top set), 300 °C (bottom set).
Table 8.
Relative error (%) for AA7056-T761 and AA7056-T721 under tension loading.
| Temper | Strain Rate (s−1) | Temperature |
|||
|---|---|---|---|---|---|
| 22 °C | 100 °C | 200 °C | 300 °C | ||
| T761 | 10−4 | 3.69 | 0.984 | 5.21 | 6.25 |
| 10−2 | 1.95 | 1.80 | 2.43 | 4.02 | |
| 100 | 3.08 | 3.05 | 1.17 | 2.84 | |
| T721 | 10−4 | 2.12 | 1.47 | 12.9 | 15.3 |
| 10−2 | 1.11 | 2.98 | 2.86 | 4.16 | |
| 100 | 1.43 | 1.44 | 5.13 | 3.97 | |
5. Summary and conclusions
The characterization of the thermo-mechanical behavior and modelling of two overaged AA7056 plates, in T761 and T721 tempers, over a wide range of strain rates and temperatures under uniaxial stress state in the normal direction was successfully accomplished. The following conclusions are drawn from this study:
Texture analysis revealed a strong crystallographic texture gradient along the normal direction of the plate. Surface texture was weak and consisted of strong <110>//RD shear and recrystallization components while a strong β-fiber (copper, S, brass) was present at the interior of the plate. This initial texture gradient largely affected the amount of ductility sustained by specimens taken from the mid-section versus the surface layers, although the differences in strength were minimal.
Differences in flow stress and strain hardening rate between the T761 and T721 tempers were largely due to number density and size of precipitates. The shearable precipitates present in the T761 temper resulted in higher strength but lower strain hardening behavior, while the non-shearable precipitates formed in the T721 temper promoted higher ductility and a higher initial strain hardening rate that saturated at approximately 8% strain. Increasing temperature reduced the differences in material behavior between the two tempers.
Both tempers exhibited a positive strain rate sensitivity that is a function of temperature and strain rate. A negative strain hardening rate was observed for 10‒4 s‒1 strain rate at 200 °C and 300 °C. A significant drop in flow stress was seen at 300 °C, along with a transition from shear to cup and cone fracture mode in tension.
Tension-compression asymmetry was present and more significant for the T761 temper. Texture evolution revealed differences in Schmid factor (m) values, which contributed to the differences in flow strength between the compression and tension stress states. Increasing temperature reduced the tension-compression asymmetry.
At elevated temperatures, texture evolution showed a change in recrystallization texture. Increasing temperature at 10‒4 s‒1 strain rate resulted in an increase in Cube {001}<100> and rotated CubeND {001}<310> & {001}<320> orientations, which suggested nucleation at grain boundaries and the development of transition bands. Increasing strain rate at constant temperature resulted in an increase in Goss {011}<100> and P {011}<122> orientated grains, which indicated the formation of micro-scale shear bands.
The KL model was modified to accommodate: (1) the Voce “saturation type” strain hardening present at large plastic strains in severely overaged alloys, such as AA7056-T721, (2) the temperature and strain rate dependent SRS between the quasi-static and dynamic regions, and (3) the changes in stress-strain behavior for deformation that occurred under different stress states (compression and tension) and over a wide temperature range of 22–300 °C, using the same set of model constants. The strain hardening function, f(ε, T), was featured to comply with aluminum alloys that have undergone various artificial aging treatments. The modified model is able to predict the material behaviors of the two tempers very well, as the relative error between the simulated and experimental data is within 5% for the majority of experiments performed.
Acknowledgements
This research was supported in part by an appointment to the Graduate Research Participation Program at the US Army Research Laboratory (ARL) administered by the Oak Ridge Institute for Science and Education through an interagency agreement between the U. S. Department of Energy and ARL. The authors would like to acknowledge and thank Dr. Scott Schoenfeld, Chief Scientist at ARL Weapons and Materials Research Directorate, for guidance and providing the AA7056 plates (in T761 and T721 tempers) used in this study. TEM characterization was performed by Dr. Billy Chad Hornbuckle at ARL, in Aberdeen, MD.
Appendix A
Fig. A.1.

Compression behavior of AA7056-T761 and AA7056-T721 in normal direction at 22 °C and .
Fig. A.2.

Tension and compression behavior of AA7056-T761 and AA7056-T721 in normal direction at 22 °C and .
Fig. A.3.

Experimental {111}, {200}, and {220} pole figures comparing texture evolution of near surface and middle compression specimens for AA7056-T721 at 22 °C, , and εp = 0.3.
Fig. A.4.
Experimental {111}, {200}, and {220} pole figures, and φ2 = 45° section of the ODF for AA7056-T721 under compression and tension loading at mid-plane, 22 °C, , and εp = 0.05.
Appendix B
The following steps are used to systematically determine the material constants needed to correlate the uniaxial compression and tension response of AA7056-T761 and AA7056-T721. All constants are determined using experimental data in compression unless otherwise noted.
- At reference temperature, T = Tr, and strain rate, , the strain rate effect term, , and temperature sensitivity function, h(T), are reduced to unity:
- For AA7056-T761 in compression, Eq. (12), becomes:
(B1)
and for AA7056-T761 in tension, Eq. (13), becomes:
Material constant A is the yield stress, σy, and can be determined from Eq. (B1) at εp ≈ 0. Material constants B and n0 can be determined from the intercept and slope of Eq. (B2), using stress data at different plastic strains. Material constant C can be determined from Eq. (B3), using tension stress data at different plastic strains, not exceeding the uniform strain.(B3) - For AA7056-T721 in compression, Eq. (14), becomes:
(B4)
and for AA7056-T721 in tension, Eq. (15), becomes:(B5)
Material constant A is the saturation stress, σs, and can be determined from Eq. (B4) at . Material constants B and a can be determined from the intercept and slope of Eq. (B5), using stress data at different plastic strains but not exceeding the strain at which saturation stress occurs, . Material constant C can be determined from Eq. (B6) using tension stress data at different plastic strains, not exceeding the uniform strain.(B6)
- At reference strain rate, :
-
Material constants D4 and m4 are determined from the power law fit of Eq. (B9), using yield stress data, σy, at different testing temperatures. Material constant m3 can be determined from the slope of Eq. (B8), using the stress data at different plastic strains and at different testing temperatures.
-
- In the dynamic loading region, the strain rate effect term, , is reduced to:
- For AA7056-T761, Eq. (12) becomes:
(B13) -
For AA7056-T721, Eq. (14) becomes:
(B14) By dividing Eq. (B13) by Eq. (B7) in step (2) for AA7056-T761, and Eq. (B14) by Eq. (B10) in step (2) for AA7056-T721; the f(ε, T) and h(T) functions are reduced to unity:(B15) Material constants K1 and m1 are determined from the power law fit of Eq. (B15) using stress data at a fixed strain, (i.e. εp = 0.15) and at various testing temperatures.
- In quasi-static loading region, the strain rate effect term, , is reduced to:
-
For AA7056-T761, Eq. (12) becomes:
(B16) For AA7056-T721, Eq. (14) becomes:
By taking the difference between Eq. (B7) and Eq. (B16) for AA7056-T761 and Eq. (B10) and Eq. (B17) for AA7056-T721 at fixed values of temperature above Tc and at a fixed value of strain (i.e. εp = 0.15); the relations for AA7056-T761 are presented in Eq. (B18) and Eq. (B19), and the relations for AA7056-T721 are presented in Eq. (B20) and Eq. (B21):(B17) (B18) (B19) (B20)
By dividing Eq. (B18) by Eq. (B19) for AA7056-T761, and Eq. (B20) by Eq. (B21) for AA7056-T721; the f(ε, T) and h(T) functions are reduced to unity:(B21)
Material constant K2 is calculated from Eq. (B22).(B22) -
From Eq. (B19), we have for AA7056-T761:
(B23) From Eq. (B21), we have for AA7056-T721:
where C2(T) is defined with the following form:(B24)
By substituting the expression of C2(T) as defined in Eq. (B25) into Eq. (B23) and Eq. (B24) and taking the logarithm form on both sides:(B25)
Material constant m2 can be determined from the slope of Eq. (B26), using stress data at a fixed value of strain (i.e. εp = 0.15), and at various testing temperatures above Tc.(B26)
-
Footnotes
Publisher's Disclaimer: Disclaimer
Mention of commercial products does not imply endorsement by the National Institute of Standards and Technology, nor does it imply that such products or services are necessarily the best available for the purpose.
Declaration of competing interest
The authors declare that they have no known competing financial interests or personal relationships that could have appeared to influence the work reported in this paper.
References
- Ashby MF, 1972. The deformation of plastically non-homogeneous alloys. In: Kelly A, Nicholson RB (Eds.), Strengthening Methods in Crystals, pp. 137–190.
- Bhattacharyya JJ, Agnew SR, Lee MM, Whittington WR, El Kadiri H, 2017. Measuring and modeling the anisotropic, high strain rate deformation of Al alloy, 7085, plate in T711 temper. Int. J. Plast 93, 46–63. 10.1016/j.ijplas.2017.03.001. [DOI] [Google Scholar]
- Bhattacharyya JJ, Bittmann B, Agnew SR, 2019. The effect of precipitate-induced backstresses on plastic anisotropy: demonstrated by modeling the behavior of aluminum alloy, 7085. Int. J. Plast 117, 3–20. 10.1016/j.ijplas.2018.04.011. [DOI] [Google Scholar]
- Caillard D, Martin JL, 2003. Thermally Activated Mechanisms in Crystal Plasticity, vol. 8. Pergamon Materials Series
- Chen Y, Pedersen KO, Clausen AH, Hopperstad OS, 2009. An experimental study on the dynamic fracture of extruded AA6xxx and AA7xxx aluminium alloys. Mater. Sci. Eng 523 (1–2), 253–262. 10.1016/j.msea.2009.06.007. [DOI] [Google Scholar]
- Cheng LM, Poole WJ, Embury JD, Lloyd DJ, 2003. The influence of precipitation on the work-hardening behavior of the aluminum alloys AA6111 and AA7030. Metall. Mater. Trans.: Physical Metallurgy and Materials Science 34 A (11), 2473–2481. 10.1007/s11661-003-0007-2. [DOI] [Google Scholar]
- Clausen AH, Børvik T, Hopperstad OS, Benallal A, 2004. Flow and fracture characteristics of aluminium alloy AA5083-H116 as function of strain rate, temperature and triaxiality. Mater. Sci. Eng. 364 (1–2), 260–272. 10.1016/j.msea.2003.08.027. [DOI] [Google Scholar]
- Deschamps A, Bréchet Y, Livet F, 1999. Influence of copper addition on precipitation kinetics and hardening in Al Zn Mg alloy. Mater. Sci. Technol 15 (9), 993–1000. 10.1179/026708399101506832. [DOI] [Google Scholar]
- Djapic Oosterkamp L, Ivankovic A, Venizelos G, 2000. High strain rate properties of selected aluminium alloys. Mater. Sci. Eng. 278 (1–2), 225–235. 10.1016/S0921-5093(99)00570-5. [DOI] [Google Scholar]
- Doherty K, Squillacioti R, Cheeseman B, Placzankis B, Gallardy D, 2012. Expanding the availability of lightweight Aluminum alloy armor plate procured from detailed military specifications. In: ICAA13: 13th International Conference on Aluminum Alloys, (July), pp. 541–546. [Google Scholar]
- Dumont D, Deschamps A, Brechet Y, 2003. On the relationship between microstructure, strength and toughness in AA7050 aluminum alloy. Mater. Sci. Eng 356 (1–2), 326–336. 10.1016/S0921-5093(03)00145-X. [DOI] [Google Scholar]
- El-Magd E, Abouridouane M, 2006. Characterization, modelling and simulation of deformation and fracture behaviour of the light-weight wrought alloys under high strain rate loading. Int. J. Impact Eng 32 (5), 741–758. 10.1016/j.ijimpeng.2005.03.008. [DOI] [Google Scholar]
- Embury JD, 1985. Plastic flow in dispersion hardened materials. Metallurgical Transactions A 16 (12), 2191–2200. 10.1007/BF02670418. [DOI] [Google Scholar]
- Embury JD, Nes E, 1973. The fracture behaviour of a medium strength Al-Zn-Mg alloy. Zeitschrift F{ü}r Metallkunde 64 (11), 805–812. [Google Scholar]
- Embury JD, Nes E, 1974. On the tensile fracture of aluminium alloys. Zeitschrift F{ü}r Metallkunde 65, 45–55. [Google Scholar]
- Engler O, Kong XW, Lücke K, 2001. Recrystallisation textures of particle-containing Al-Cu and Al-Mn single crystals. Acta Mater 49 (10), 1701–1715. 10.1016/S1359-6454(01)00087-8. [DOI] [Google Scholar]
- Engler O, Lücke K, 1992. Mechanisms of recrystallization texture formation in aluminium alloys. Scripta Metall. Mater 27 (11), 1527–1532. 10.1016/0956-716X(92)90139-6. [DOI] [Google Scholar]
- Fourmeau M, Børvik T, Benallal A, Hopperstad OS, 2013. Anisotropic failure modes of high-strength aluminium alloy under various stress states. Int. J. Plast 48, 34–53. 10.1016/j.ijplas.2013.02.004. [DOI] [Google Scholar]
- Fourmeau M, Børvik T, Benallal A, Lademo OG, Hopperstad OS, 2011. On the plastic anisotropy of an aluminium alloy and its influence on constrained multiaxial flow. Int. J. Plast 27 (12), 2005–2025. 10.1016/j.ijplas.2011.05.017. [DOI] [Google Scholar]
- Gallardy D, 2017. Ballistic Evaluation of 7056 Aluminum ARL-TR-7947 (March)
- Ghosh AK, 1977. Tensile instability and necking in materials with strain hardening and strain-rate hardening. Acta Metall 25 (12), 1413–1424. 10.1016/0001-6160(77)90072-4. [DOI] [Google Scholar]
- Gjonnes J, Chr J, Simensen J, 1970. An electron microscope investigation of the microstructure in an Al-Zn-Mg alloy. Acta Metall 18, 881–890. [Google Scholar]
- Gracio JJ, Barlat F, Rauch EF, Jones PT, Neto VF, Lopes AB, 2004. Artificial aging and shear deformation behaviour of 6022 aluminium alloy. Int. J. Plast 20 (3), 427–445. 10.1016/S0749-6419(03)00095-0. [DOI] [Google Scholar]
- Gurrutxaga-Lerma B, Balint DS, Dini D, Sutton AP, 2015. The mechanisms governing the activation of dislocation sources in aluminum at different strain rates. J. Mech. Phys. Solid 84, 273–292. 10.1016/j.jmps.2015.08.008. [DOI] [Google Scholar]
- Hahn GT, Rosenfield AR, 1975. Metallurgical factors affecting fracture toughness of aluminum alloys. Metallurgical Transactions A 6 (3), 653–668. 10.1007/BF02672285. [DOI] [Google Scholar]
- Han CS, Wagoner RH, Barlat F, 2004. On precipitate induced hardening in crystal plasticity: theory. Int. J. Plast 20 (8–9), 1441–1461. 10.1016/j.ijplas.2003.11.002. [DOI] [Google Scholar]
- Hatch JE, 1984. Aluminum: Properties and Physical Metallurgy ASM. [Google Scholar]
- Hielscher R, Schaeben H, 2008. A novel pole figure inversion method: specification of the MTEX algorithm. J. Appl. Crystallogr 41 (6), 1024–1037. 10.1107/S0021889808030112. [DOI] [Google Scholar]
- Hollomon JH, 1945. Tensile deformation. Trans. AIME 162 (1879), 268–290. [Google Scholar]
- Holmen JK, Frodal BH, Hopperstad OS, Børvik T, 2017. Strength differential effect in age hardened aluminum alloys. Int. J. Plast 99 (7491), 144–161. 10.1016/j.ijplas.2017.09.004. [DOI] [Google Scholar]
- Johnson GR, Cook WH, 1983. A constitutive model and data for metals subjected to large strains, high strain rates and high temperatures. The 7th International Symposium on Ballistics. In: Proceedings of the 7th International Symposium on Ballistics, vol. 547, pp. 541–547. [Google Scholar]
- Jordon JB, Horstemeyer MF, Solanki K, Bernard JD, Berry JT, Williams TN, 2009. Damage characterization and modeling of a 7075-T651 aluminum plate. Mater. Sci. Eng 527 (1–2), 169–178. 10.1016/j.msea.2009.07.049. [DOI] [Google Scholar]
- Kabirian F, Khan AS, Pandey A, 2014. Negative to positive strain rate sensitivity in 5xxx series aluminum alloys: experiment and constitutive modeling. Int. J. Plast 55, 232–246. 10.1016/j.ijplas.2013.11.001. [DOI] [Google Scholar]
- Khan AS, Kazmi R, Farrokh B, 2007. Multiaxial and non-proportional loading responses, anisotropy and modeling of Ti-6Al-4V titanium alloy over wide ranges of strain rates and temperatures. Int. J. Plast 23 (6), 931–950. 10.1016/j.ijplas.2006.08.006. [DOI] [Google Scholar]
- Khan AS, Liang R, 1999. Behaviors of three BCC metal over a wide range of strain rates and temperatures: experiments and modeling. Int. J. Plast 15 (10), 1089–1109. 10.1016/S0749-6419(99)00030-3. [DOI] [Google Scholar]
- Khan AS, Liu H, 2012. Variable strain rate sensitivity in an aluminum alloy: response and constitutive modeling. Int. J. Plast 36, 1–14. 10.1016/j.ijplas.2012.02.001. [DOI] [Google Scholar]
- Khan AS, Meredith CS, 2010. Thermo-mechanical response of Al 6061 with and without equal channel angular pressing (ECAP). Int. J. Plast 26 (2), 189–203. 10.1016/j.ijplas.2009.07.002. [DOI] [Google Scholar]
- Khan AS, Suh YS, Kazmi R, 2004. Quasi-static and dynamic loading responses and constitutive modeling of titanium alloys. Int. J. Plast 20 (12), 2233–2248. 10.1016/j.ijplas.2003.06.005. [DOI] [Google Scholar]
- Khan AS, Yu S, 2012. Deformation induced anisotropic responses of Ti-6Al-4V alloy. Part I: Experiments. Int. J. Plast 38, 14–26. 10.1016/j.ijplas.2012.03.015. [DOI] [Google Scholar]
- Khan AS, Yu S, Liu H, 2012. Deformation induced anisotropic responses of Ti-6Al-4V alloy Part II: a strain rate and temperature dependent anisotropic yield criterion. Int. J. Plast 38, 1–13. 10.1016/j.ijplas.2012.03.013. [DOI] [Google Scholar]
- Lebensohn RA, Tome CN, 1993. A self-consistent anisotropic approach for the simulation of plastic deformation and texture development of polycrystals: application to zirconium alloys. Acta Metall. Mater 41 (9), 2611–2624. 10.1016/0956-7151(93)90130-K. [DOI] [Google Scholar]
- Lücke K, Engler O, 1990. Effects of particles on development of microstructure and texture during rolling and recrystallisation in fcc alloys. Mater. Sci. Technol 6 (11), 1113–1130. 10.1179/mst.1990.6.11.1113. [DOI] [Google Scholar]
- Meyers MA, 1994. Dynamic Behavior of Materials, vol. 1. John Wiley & Sons. [Google Scholar]
- Miller WS, Zhuang L, Bottema J, Wittebrood AJ, De Smet P, Haszler A, Vieregge A, 2000. Recent development in aluminium alloys for the automotive industry. Mater. Sci. Eng 280 (1), 37–49. 10.1016/S0921-5093(99)00653-X. [DOI] [Google Scholar]
- Moan GD, Embury JD, 1979. A study of the bauschinger effect in AlCu alloys. Acta Metall 27 (5), 903–914. 10.1016/0001-6160(79)90125-1. [DOI] [Google Scholar]
- Nemat-Nasser S, Li Y, 1998. Flow stress of F.C.C. polycrystals with application to OFHC Cu. Acta Mater 46 (2), 565–577. 10.1016/S1359-6454(97)00230-9. [DOI] [Google Scholar]
- Nie JF, Muddle BC, Polmear IJ, 1996. The effect of precipitate shape and orientation on dispersion strengthening in high strength aluminium alloys. Mater. Sci. Forum 217–222, 1257–1262. 10.4028/www.scientific.net/MSF.217-222.1257. [DOI]
- Pandey A, Khan AS, Kim EY, Choi SH, Gnäupel-Herold T, 2013. Experimental and numerical investigations of yield surface, texture, and deformation mechanisms in AA5754 over low to high temperatures and strain rates. Int. J. Plast 41, 165–188. 10.1016/j.ijplas.2012.09.006. [DOI] [Google Scholar]
- Park JK, Ardell AJ, 1983. Microstructures of the commercial 7075 Al alloy in the T651 and T7 tempers. Metallurgical Transactions A 14 (10), 1957–1965. 10.1007/BF02662363. [DOI] [Google Scholar]
- Pedersen KO, Roven HJ, Lademo OG, Hopperstad OS, 2008. Strength and ductility of aluminium alloy AA7030. Mater. Sci. Eng 473 (1–2), 81–89. 10.1016/j.msea.2007.03.089. [DOI] [Google Scholar]
- Poole WJ, Wang X, Lloyd DJ, Embury JD, 2005. The shearable-non-shearable transition in Al-Mg-Si-Cu precipitation hardening alloys: implications on the distribution of slip, work hardening and fracture. Phil. Mag 85 (26–27 SPEC. ISS), 3113–3135. 10.1080/14786430500154935. [DOI] [Google Scholar]
- Puiggali M, Zielinski A, Olive JM, Renauld E, Desjardins D, Cid M, 1998. Effect of microstructure on stress corrosion cracking of an Al-Zn-Mg-Cu alloy. Corrosion Sci 40 (4–5), 805–819. 10.1016/S0010-938X(98)00002-X. [DOI] [Google Scholar]
- Regazzoni G, Kocks UF, Follansbee PS, 1987. Dislocation kinetics at high strain rates. Acta Metall 35, 2865–2875. 10.1016/0001-6160(87)90285-9. [DOI] [Google Scholar]
- Seidt JD, Gilat A, 2013. Plastic deformation of 2024-T351 aluminum plate over a wide range of loading conditions. Int. J. Solid Struct 50 (10), 1781–1790. 10.1016/j.ijsolstr.2013.02.006. [DOI] [Google Scholar]
- Srivatsan TS, 1992. Microstructure, tensile properties and fracture behaviour of aluminium alloy 7150. J. Mater. Sci 27, 4772–4781. 10.1007/BF01166019. [DOI] [Google Scholar]
- Srivatsan TS, Guruprasad G, Vasudevan VK, 2008. The quasi static deformation and fracture behavior of aluminum alloy 7150. Mater. Des 29 (4), 742–751. 10.1016/j.matdes.2007.01.006. [DOI] [Google Scholar]
- Srivatsan TS, Sriram S, Veeraraghavan D, Vasudevan VK, 1997. Microstructure, tensile deformation and fracture behaviour of aluminium alloy 7055. J. Mater. Sci 32 (11), 2883–2894. 10.1023/A:1018676501368. [DOI] [Google Scholar]
- Sung JH, Kim JH, Wagoner RH, 2010. A plastic constitutive equation incorporating strain, strain-rate, and temperature. Int. J. Plast 26 (12), 1746–1771. 10.1016/j.ijplas.2010.02.005. [DOI] [Google Scholar]
- Tucker MT, Horstemeyer MF, Whittington WR, Solanki KN, Gullett PM, 2010. The effect of varying strain rates and stress states on the plasticity, damage, and fracture of aluminum alloys. Mech. Mater 42 (10), 895–907. 10.1016/j.mechmat.2010.07.003. [DOI] [Google Scholar]
- Voyiadjis GZ, Abed FH, 2005. Microstructural based models for bcc and fcc metals with temperature and strain rate dependency. Mech. Mater 37 (2–3 SPEC. ISS), 355–378. 10.1016/j.mechmat.2004.02.003. [DOI] [Google Scholar]
- Warner T, 2006. Recently-developed aluminium solutions for aerospace applications. Mater. Sci. Forum 519–521, 1271–1278.
- Zerilli FJ, Armstrong RW, 1987. Dislocation-mechanics-based constitutive relations for material dynamics calculations. J. Appl. Phys 61 (5), 1816–1825. 10.1063/1.338024. [DOI] [Google Scholar]
- Zhao Z, Frankel GS, 2007. The effect of temper on the first breakdown in AA7075. Corrosion Sci 49 (7), 3089–3111. 10.1016/j.corsci.2007.02.004. [DOI] [Google Scholar]