Abstract
Purpose:
The aim of this work is to shed light on the issue of reproducibility in MR image reconstruction in the context of a challenge. Participants had to recreate the results of “Advances in sensitivity encoding with arbitrary k-space trajectories” by Pruessmann et al.
Methods:
The task of the challenge was to reconstruct radially acquired multicoil k-space data (brain/heart) following the method in the original paper, reproducing its key figures. Results were compared to consolidated reference implementations created after the challenge, accounting for the two most common programming languages used in the submissions (Matlab/Python).
Results:
Visually, differences between submissions were small. Pixel-wise differences originated from image orientation, assumed field-of-view, or resolution. The reference implementations were in good agreement, both visually and in terms of image similarity metrics.
Discussion and Conclusion:
While the description level of the published algorithm enabled participants to reproduce CG-SENSE in general, details of the implementation varied, for example, density compensation or Tikhonov regularization. Implicit assumptions about the data lead to further differences, emphasizing the importance of sufficient metadata accompanying open datasets. Defining reproducibility quantitatively turned out to be nontrivial for this image reconstruction challenge, in the absence of ground-truth results. Typical similarity measures like NMSE of SSIM were misled by image intensity scaling and outlier pixels. Thus, to facilitate reproducibility, researchers are encouraged to publish code and data alongside the original paper. Future methodological papers on MR image reconstruction might benefit from the consolidated reference implementations of CG-SENSE presented here, as a benchmark for methods comparison.
Keywords: CG-SENSE, image reconstruction, MRI, nonuniform sampling, NUFFT, reproducibility
1 |. INTRODUCTION
Over the past decades, MRI experienced a vast thrust toward an algorithmic perspective owing to the increased computational power of standard computers leading to the invention and development of numerous reconstruction methods. This is reflected in the tremendous increase of publications registered on Pubmed that involve “MRI” and either “reconstruction” or “fitting” over the last 2 decades (see Figure 1). The peak of 3354 publications in 2018 amounts to an average of 9 papers per day. Typically, computational innovation in these papers is shown by comparing novel methods to established algorithms in the field via suitable quality metrics.
FIGURE 1.
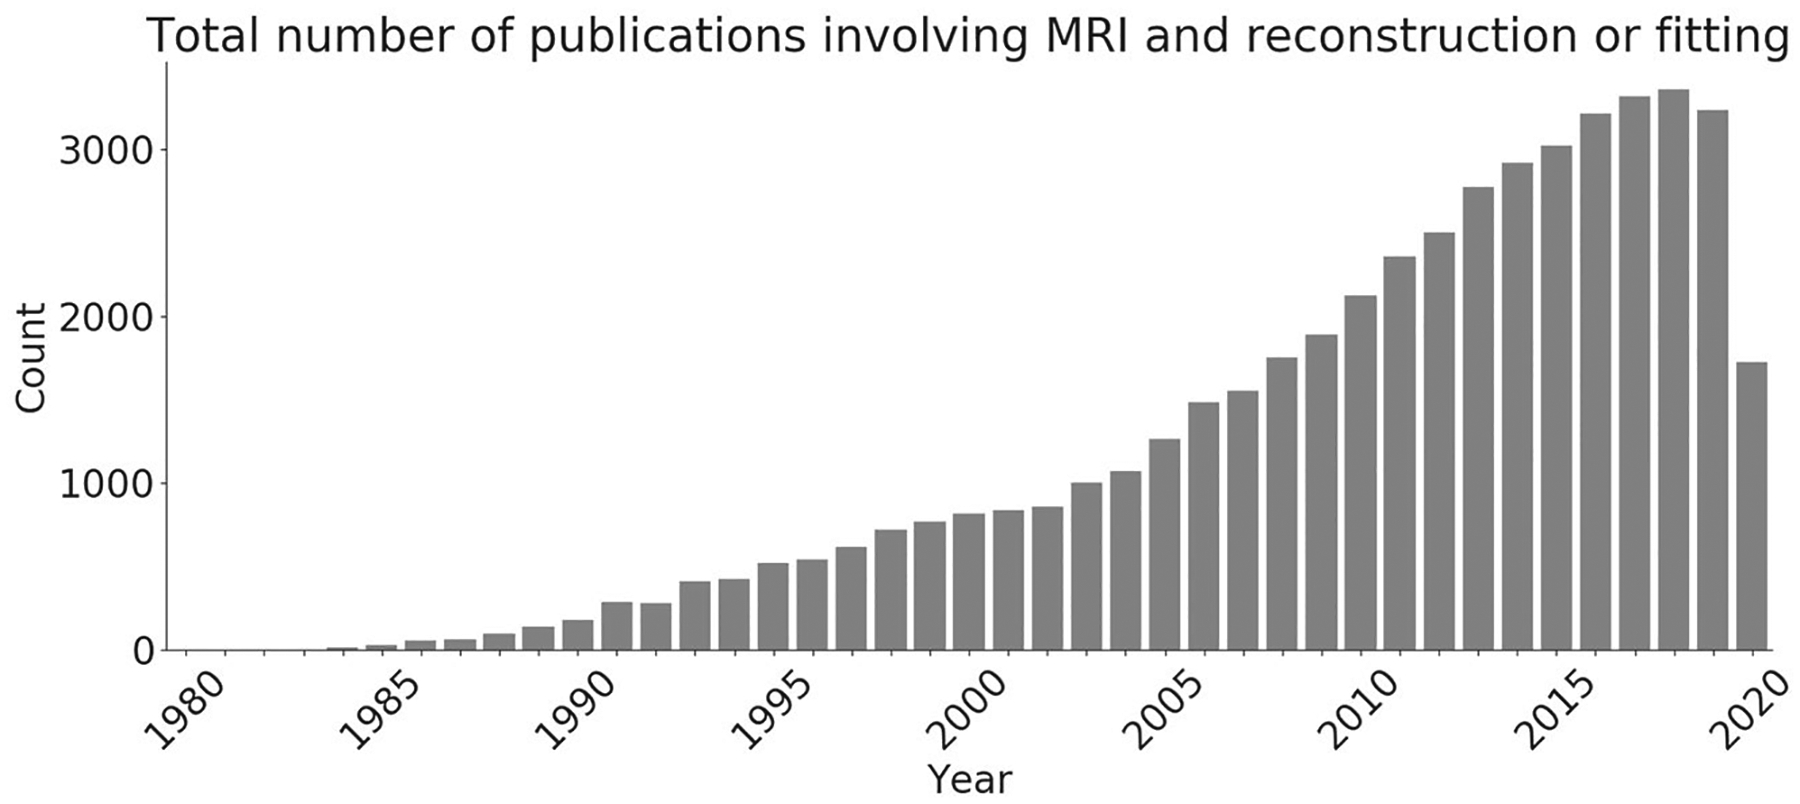
Number of publications on PubMed including “MRI” and either “reconstruction” or “fitting.” Data search done on the 4th of August 2020
One of the fundamental computational approaches to image reconstruction is parallel imaging, that is the idea to use a-priori knowledge about multiple receiver coil sensitivities to accelerate scans. Image reconstruction then shifts from a simple Fourier transform—which may optionally include a gridding step for non-Cartesian data—to solving a more complex inverse problem, based on a matrix equation of image encoding, as proposed in a general form in Pruessmann et al1 commonly referred to as “conjugate gradient CG-SENSE.” A lot of image reconstruction papers published thereafter refer to this standard algorithm, often performing direct comparisons to prove the efficacy of their method. However, no commonly agreed-on reference implementation of the CG-SENSE algorithm is readily available. Therefore, these comparisons to the “SENSE” method are mere comparisons to one version of it, be it custom implementations, those based on openly available image reconstruction toolboxes, or even obtained from a black-box implementation provided by the scanner vendors. This lack of a reference implementation reflects a fundamental problem of research reproducibility in the MR image reconstruction domain.
The reproducible research study group (RRSG) of the ISMRM aims to enhance reproducibility by facilitating fair and simple comparisons to existing algorithms. However, comparing novel algorithms to re-implementations of published work without having access to the original code can lead to wrong conclusions. Often, algorithmic details are not reported in detail in publications and small deviations of input parameters can lead to strong differences in the output, regularly degrading the performance of the existing method, which is a general problem faced in the scientific community.2–8 A questionnaire opened by the RRSGG (https://blog.ismrm.org/2019/04/15/reproducible-research-study-group-questionnaire/), regarding reproducible research, also showed that the majority of the 71 participants (77.5%) sees a reproducibility problem in their research area. This proves that scientists are aware of the problem of reproducibility of research and how hard it can be to recreate paper results without access to code or data. To that end, the RRSG announced a reproducibility challenge in April 2019 as part of the Annual Meeting of the ISMRM in Montreal. The goal was to reproduce the core findings of the paper “Advances in sensitivity encoding with arbitrary k-space trajectories” from Pruessmann et al1 solely based on the description available in the paper, and to converge toward a reference implementation being accessible to the community. The choice to reproduce the CG-SENSE paper is based on the facts that it describes one of the basic algorithms for image reconstruction, often used in modified versions on the scanner console, that it serves as basis for many modern iterative reconstruction methods, and that there exists no official reference implementation of this fundamental algorithm. Participants were required to reproduce the main figures of the original paper given two fully sampled radial brain and heart datasets. Signal and trajectory data were supplied but neither sensitivity maps nor noise covariance scans. No programming language restrictions were given, as long as the source code was shared and the computational results could be reproduced. The detailed instructions can be found in the corresponding ISMRM blog post (https://blog.ismrm.org/2019/04/02/ismrm-reproducible-researchstudy-group-2019-reproduce-a-seminal-paper-initiative/).
In this work, we present the outcome of this initiative, compare the different submissions and discuss potential problems in reproducing the findings of a scientific paper solely from the manuscript. Furthermore, we consolidated the submissions from the participating groups into two reference implementations (Python and Matlab), which are available online in the ISMRM git repository and could serve as a benchmark for future publications seeking comparison to CG-SENSE. The reference implementations will be discussed in more detail in Section 2.6, specifically focusing on critical points in the implementation. The main features of each submission will be shown in Section 2.5 and differences regarding implementation details and possible sources of deviations to the reference implementations will be discussed. We would like to note that the results of the challenge should not be seen as a comparison of the performance of any third party software or open source libraries used by the participants. Finally, recommendations for conducting reproducible research and future challenges are given.
2 |. METHODS
2.1 |. Design of the first RRSG challenge
Since this was the first ever reproducibility challenge by the study group, we designed it around a rather simple premise to encourage submissions from the community. This started with the choice of the paper. We wanted a paper that is seminal in our field, where the authors did not already provide a reference implementation themselves. We wanted to be able to provide all the data ourselves and not rely on any closed source or proprietary software for any step of the data processing. We also wanted a paper where we expected the results of the challenge to be uncontroversial. In fact, we expected that the submissions of the participants would successfully reproduce the main results of the paper without showing fundamental differences, but still would reveal some interesting differences that we could learn from about reproducibility issues. Finally, since one of the goals of this initiative is to build up a library of standard reference implementations that can be used for comparison when publishing new methods, we wanted to cover a method that is commonly used as a reference by MRM authors. A second design choice was the timeline. We wanted the turnaround of the participants to be relatively quick, because we wanted to see how well the paper can be reproduced within a time frame of a couple of weeks. In particular, we announced the challenge and provided the material on March 28, 2019, and set the deadline for submissions for May 1, 2019.
In the rest of this section, we are providing a brief review of the CG-SENSE method that was introduced in Pruessmann et al1 a detailed description of the data that was used for the challenge and an overview of the individual submissions and finally a description of the consolidated reference implementations that were developed after the conclusion of the challenge.
2.2 |. CG-SENSE
Throughout this work, let nx × ny denote the image dimension in pixels and nc the number of receive coils. For simplicity, assume that nx = ny = n. The total number of k-space samples, that is, number of read-outs times number of read-out points, is denoted as nk. Reconstructing an image from undersampled data acquired with multiple receive coils nc is an inverse problem following a linear encoding process
| (1) |
with being the linear encoding matrix, mapping from image space to k-space.1,9 The encoding matrix E describes the whole MRI acquisition pipeline, consisting of coil sensitivity profiles and Fourier transformation combined with the sampling operator, that is, the nonuniform FFT (NUFFT : ). Assuming independent and identically distributed Gaussian noise in the acquired k-space data, the bias free solution with minimal variance is given by the minimum least-squares solution of Equation (1) with respect to v. The addition of regularization (λ > 0) can improve the estimate but gives up the zero bias property. The resulting optimization problem reads as
| (2) |
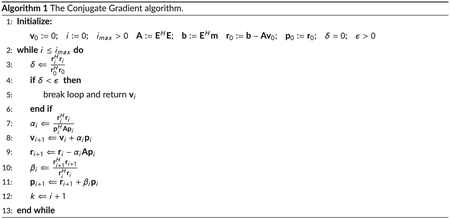
with H denoting the Hermitian transpose. As the inverse of EHE is computationally demanding, the problem is typically solved in an iterative fashion. Optionally, the conditioning of the matrix inversion can be improved by the addition of a small constant value λ ≥ 0 to the diagonal EHE + λI, with I being the identity matrix. This type of modification is typically referred to as Tikhonov regularization.10 For λ = 0, the problem reduces to ordinary least squares. A numerically fast method to solve Equation (2) is given by the conjugate gradient (CG) algorithm, outlined in Algorithm 1. A full description of the CG algorithm can be found in Shewchuk.11 The CG algorithm can be applied to problems of the form in Equation (1) but requires a positive (semi-)definite matrix E. This requirement cannot be guaranteed for arbitrary encoding matrices E. One way to solve 2 is to apply CG to the normal equation
| (3) |
which yields the least-squares solution defined by Equation (2). Another advantage of the normal equation is that it has a positive (semi-) definite operator (EHE + λI) by definition. Thus, the requirements for the CG algorithm are met.
If the noise correlation between receive coil channels can be estimated, for example, from a separate noise scan, the coils and data can be pre-whitened to account for the correlation between different channels. This process creates virtual coils which can be used in the CG algorithm instead of physical coils without requiring any other modifications.1
The conditioning of the problem and, thus, the convergence speed of the algorithm can be improved by including a density compensation function into the reconstruction pipeline. This accounts for the typically nonuniform density in the k-space center of non-Cartesian sampling strategies. This modification comes at the cost of a slightly altered noise distribution and solution. In practice, the difference between the original and the modified solution is minor in most cases, with the density compensated solution showing larger errors. As an alternative, preconditioning can be used to speed up convergence without altering the solution or noise distribution.12 The diagonal density compensation matrix D can be included in the encoding matrix E by
| (4) |
weighting each k-space signal by its spatial density. It should be noted that this introduces a weighting in the data consistency, which then deviates from the noise optimal least squares formulation. Intensity correction of the coil sensitivity profiles I can be included in analogy by
| (5) |
Substituting E with in Equation (3) gives the density and intensity corrected image reconstruction problem. After convergence, it remains to apply the intensity correction I to I−1v to obtain the final reconstruction result v, which reduces to a point-wise division in image space.1
2.3 |. Non-uniform fast Fourier transform
If measured k-space points are acquired on a non-Cartesian grid, modifications to the standard FFT are necessary. The main steps involved are as follows:
Density compensation (optional).
Standard FFT of the now Cartesian data.
Deapodization—Accounting for intensity variations due to the convolution with the gridding kernel.
Cropping to the desired Field-of-View (FOV).
These steps are generally referred to as nonuniform FFT (NUFFT). Even though it achieves the same computational complexity (N log N) as the standard FFT, the computation is typically slower and scaling with dimensionality is worse.
2.4 |. Data
The evaluation in this work was performed on two different datasets. First, the algorithm was evaluated using radially sampled data provided by the organizers of the 2019 RRSG challenge. Second, during follow-up work after the conclusion of the challenge, radial and spiral data including noise reference scans were acquired. These datasets closely follow the sampling trajectories and noise treatment of the original CG-SENSE paper, and were reconstructed with the consolidated reference implementations to evaluate their correctness and properties.
2.4.1 |. Challenge data
The challenge data consist of two radial k-space datasets, one brain and one cardiac measurement, supplied in the .h5 data format.15 The dataset entries are ordered using the BART toolbox convention,16 that is, for the data, the dimensions [1, Readout, Spokes, Channels] and for the trajectory [3, Readout, Spokes], where the first entry encodes the three spatial dimensions. The distance between sampling points is 1/FOVos and the entries run from −N/2 to N/2 with N being the matrix size of the desired FOV. FOVos is the readout-oversampled FOV. The brain data consisting of 96 radial projections. Two-dimensional radial spin echo measurements of the human brain were performed with a clinical 3 T scanner (Siemens Magnetom Trio, Erlangen, Germany) using a receive only 12 channel head coil. Sequence parameters were: TR = 2500 ms, TE = 50 ms, matrix size = 256 × 256, slice thickness 2 mm, in plane resolution 0.78 × 0.78 mm2. FOV was increased to a matrix size of 300 × 300 after acquisition. The sampling direction of every second spoke was reversed to reduce artifacts from off-resonances.17 The cardiac dataset consists of 55 radial projections acquired with a 34-channel coil on a 3 T system (Skyra, Siemens Healthcare, Erlangen, Germany). A real-time radial FLASH sequence with TR/TE = 2.22/1.32 ms, slice thickness 6 mm, 5 × 11 radial spokes per frame, 1.6 × 1.6 mm2 resolution and a flip angle of 10° was used. Matrix size was set to 160 × 160 with 2-fold oversampling and a FOV of 256 × 256 mm2, which was up-scaled by a factor of 1.5 after acquisition to fully contain the heart, leading to a reconstruction FOV of 384 × 384 mm2 with a 240 × 240 matrix size.
2.4.2 |. Reference data
In addition to the original challenge data, two new datasets, a radially acquired heart dataset and spirally acquired brain dataset, were used in this work. The heart data were acquired from the Karolinska Institutet and the acquisition parameters are as follows: Prototype bSSFP pulse sequence with golden-angle radial trajectory, acquired at 1.5 T (Aera, Siemens Healthcare, Erlangen, Germany) with an 18-channel surface coil and a 12-channel spine coil (with 8 active elements). Sequence parameters were: matrix size, 256 × 256 pixel, acquired pixel size 1.4 mm2, 420 radial views, slice thickness 8 mm, TR/TE = 3.14/1.57 ms, flip angle 50°, receiver bandwidth 930 Hz/px, an 18-channel surface coil and a 12-channel spine coil (with 8 active elements) was used.
The brain data were acquired from ETH Zurich on a 3 T MR system (Philips Healthcare, Best, The Netherlands) using a 16-channel head coil with integrated magnetic field sensors (Skope MR Technologies and ETH, Zurich, Switzerland) with the following acquisition parameters: GE spiral trajectory with three interleaves, FOV = 22 cm, pixel size 1 × 1 mm2 with 2 mm slice thickness, TR/TE = 2000/25 ms, flip angle 90°. A total of 27121 samples per spiral were acquired.
The datasets are supplied as .h5 files containing trajectories, multichannel data, coil sensitivity maps, and noise covariance matrix. Written informed consent was obtained from all healthy volunteers following the local ethics committee’s regulations. An overview of each acquisition and related parameters can be found in Supporting Information Table S1 online.
2.5 |. Submissions
The main features of each submission are summarized in Table 1. Additional information and implementation details can be found in the online supporting information. To comply with the original algorithm, some sort of k-space filter function needs to be applied after termination of the CG algorithm. The most popular choice in all submissions is an arctan-based filter function as used in the original publication1 and given by
| (6) |
The cutoff radios kc and the parameter β are stated in each submission individually if applicable. If other filters are used, they are described in the corresponding paragraph of the submission in the online supplementary material. The desired undersampling factor is attained by skipping every other acquired line for brain data to achieve factors of {1, 2, 3, 4} compared to the acquired number of spokes. The heart data are undersampled by selecting the first {55, 33, 22, 11} projections. Different realizations of undersampling for a given implementation are described in the corresponding paragraph of the online supplementary material. In compliance with the original publication,1 all submissions used a “zero” image as initial guess.
TABLE 1.
Overview of the submissions and the main features used to create the results
| Submission | Main language | License | NUFFT/gridding-type and kernel interpolation | Sensitivities | CPU/GPU |
|---|---|---|---|---|---|
| University of California, Berkeley | Python | MIT | SigPy’s NUFFT/min-max14,32 | SoS (Brain)/ ESPIRiT33 (Cardiac) | Both |
| Berlin Ultrahigh Field Facility | Matlab | MIT | BART/Kaiser-Bessel & Toeplitz emb.19,34–36 | SoS | Both |
| Eindhoven University of Technology | Python | MIT | PyNUFFT/min-max14,37 | None | Both |
| Swiss Federal Institute of Technology Zurich | Matlab | MIT | In-house/Kaiser-Bessel—nearest13 | SVD-Walsh18 | CPU |
| Karolinska Institutet | Matlab | MIT | MIRT/min-max14 | SoS | CPU |
| Massachusetts General Hospital | Matlab | n/a | BART/Kaiser-Bessel & Toeplitz emb.19,34–36 | ESPIRiT33 | Both |
| New York University | Matlab | MIT | gpuNUFFT/Kaiser-Bessel—nearest38 | Walsh18 | Both |
| University of Southern California | Matlab | MIT | In-house/Sinc | SoS | CPU |
| Stanford University | Python | MIT | In-house/Kaiser-Bessel—linear interp.13 | SoS | CPU |
| Graz, University of Technology, Institute of Computer Graphics and Vision | Python | LGPL v3.0 | gpuNUFFT/Kaiser-Bessel—nearest38 | ESPIRiT33 | GPU |
| Graz, University of Technology, Institute of Medical Engineering | Python | Apache-2 | In-house/Kaiser-Bessel—linear interp.13 | ESPIRiT33 | GPU |
| Utah Center for Advanced Imaging Research, University of Utah | Matlab | MIT | In-house/min-max14 | Walsh18 | Both |
2.5.1 |. Revised submissions
To avoid registration of individual submissions and eliminate errors due to necessary interpolation, participants were given the opportunity to submit revised code to account for differences in FOV and/or resolution between the reference and their submissions. Both the original and the revised submission are subsequently compared to the reference to show initial deviations and corrected images.
2.6 |. Consolidated implementation
Accounting for the two major programming languages used throughout the submissions, reference implementations are developed both in Python and Matlab.
2.6.1 |. General steps
To facilitate comparability between the two implementations, coil sensitivity profiles are pre-computed using the Walsh et al18 algorithm and all available projections. Density compensation is derived from the trajectory by gridding a k-space of ones followed by division of the maximum value. Taking the inverse of the gridded k-space yields the estimated density compensation function.19 Reconstruction FOV and oversampling ratio are directly determined from the supplied trajectory. No scaling of the trajectory to specific intervals (eg, [−0.5, 0.5]) is required. The apodization function is derived by Fourier transformation of the pre-computed gridding kernel followed by normalization with the maximum value. Furthermore, each iteration comprised intensity correction in image space based on the L2-norm of the sensitivity maps. In case of acquired noise reference data, noise pre-whitening is performed as a preprocessing step as described in.1 The algorithm is initialized with an image of all zeros. Similar to the original work, the CG algorithm is terminated after a fixed number of iterations is reached which is chosen as 10 for all combinations of undersampling. As a final post-processing step, a k-space filter is applied after the last CG iteration to mask out ill-conditioned k-space areas, that is, areas outside the circular support of the acquired data are masked out via hard thresholding. A supplementary step-by-step guide explaining details involved in each step of the reconstruction is provided online via a Jupyter notebook.
2.6.2 |. Matlab specific
Sensitivity maps are assumed to be pre-computed and read in at the start of the reconstruction. As in the original ETH submission, gridding is performed by a matrix-vector multiplication with a sparse matrix to reduce computation times for this time-critical operation, performed twice per iteration. The gridding kernel is based on a Kaiser window with width of 5 and 10 000 pre-computed points. The value of the kernel for gridding a specific measurement point is determined via nearest neighbor interpolation. Furthermore, each iteration comprised intensity correction in image space as well as density correction in k-space, as described in the previous section. Explicit Tikhonov regularization is not included in accordance to the original paper.
2.6.3 |. Python specific
If no coil sensitivity maps are supplied in the data file, receive coil sensitivities are estimated via the SoS approach, dividing each gridded coil image by the SoS reconstruction. To account for the typical smooth sensitivity profiles, the raw data are multiplied with a Hanning window with window width of 50 pixels, masking out high frequency components of the acquired k-space data prior to SoS reconstruction and coil sensitivity estimation. Optionally, the nonlinear inversion (NLINV) algorithm20 can be used to estimate coil sensitivities prior to reconstruction. The pre-computed gridding kernel is derived using a Kaiser-Bessel function.13,19 The kernel width is set to 5 and 10 000 points of the window are pre-computed. The value of the kernel for gridding a specific measurement point is determined via linear interpolation of the pre-computed values. Optional Tikhonov regularization and a termination criterion can be enabled by setting the corresponding values larger than zero in the configuration file.
2.7 |. Numerical comparison
The results from each submission were compared on a pixel-by-pixel basis to the Python consolidated reference implementation. To account for possible intensity variations and outliers, each image was normalized by its 0.95 quantile intensity value prior to the difference operation. Reconstructions not matching the FOV of the reference were cropped prior to the difference operation. Cropping was performed symmetrically around the image center.
The two reference implementations were compared to each other in a similar fashion. Additionally, the structural similarity index measure (SSIM), using the parameters as suggested byZhouWang et al,21 and normalized root-mean-squared error (NRMSE), defined in Equation (7), are used as metrics to compare the magnitude images of the two implementations with each other.
| (7) |
3 |. RESULTS
3.1 |. Submissions
Example reconstruction results for an acceleration factor of 2 are shown for images after evaluation of the right-hand-side of Equation (3) (Initial) and for images after convergence of the algorithm (Final) for each submission in Figure 2. All results are displayed with a window width from the minimum to the maximum occurring value in each image. Visually, intensity variations are noticeable owing to the different maximum values; however, contrast between different tissues seems to be similar in all submissions. Some submissions also use different FOVs for the brain (Eindhoven, no cropping; ETH, cropped to 340 × 340; Stanford, cropped asymmetrical to 300 × 300) compared to the others or different matrix sizes in the same FOV (USC, 256 × 256; and Utah, 512 × 512). No major structural differences are observable in the reconstruction except for the case of Eindhoven. The brain reconstruction from KI did neither use Tikhonov regularization nor early stopping, and the k-space was not filtered, resulting in a noisy appearance compared to other submissions. In addition, it shows a slight rotation to the left.
FIGURE 2.
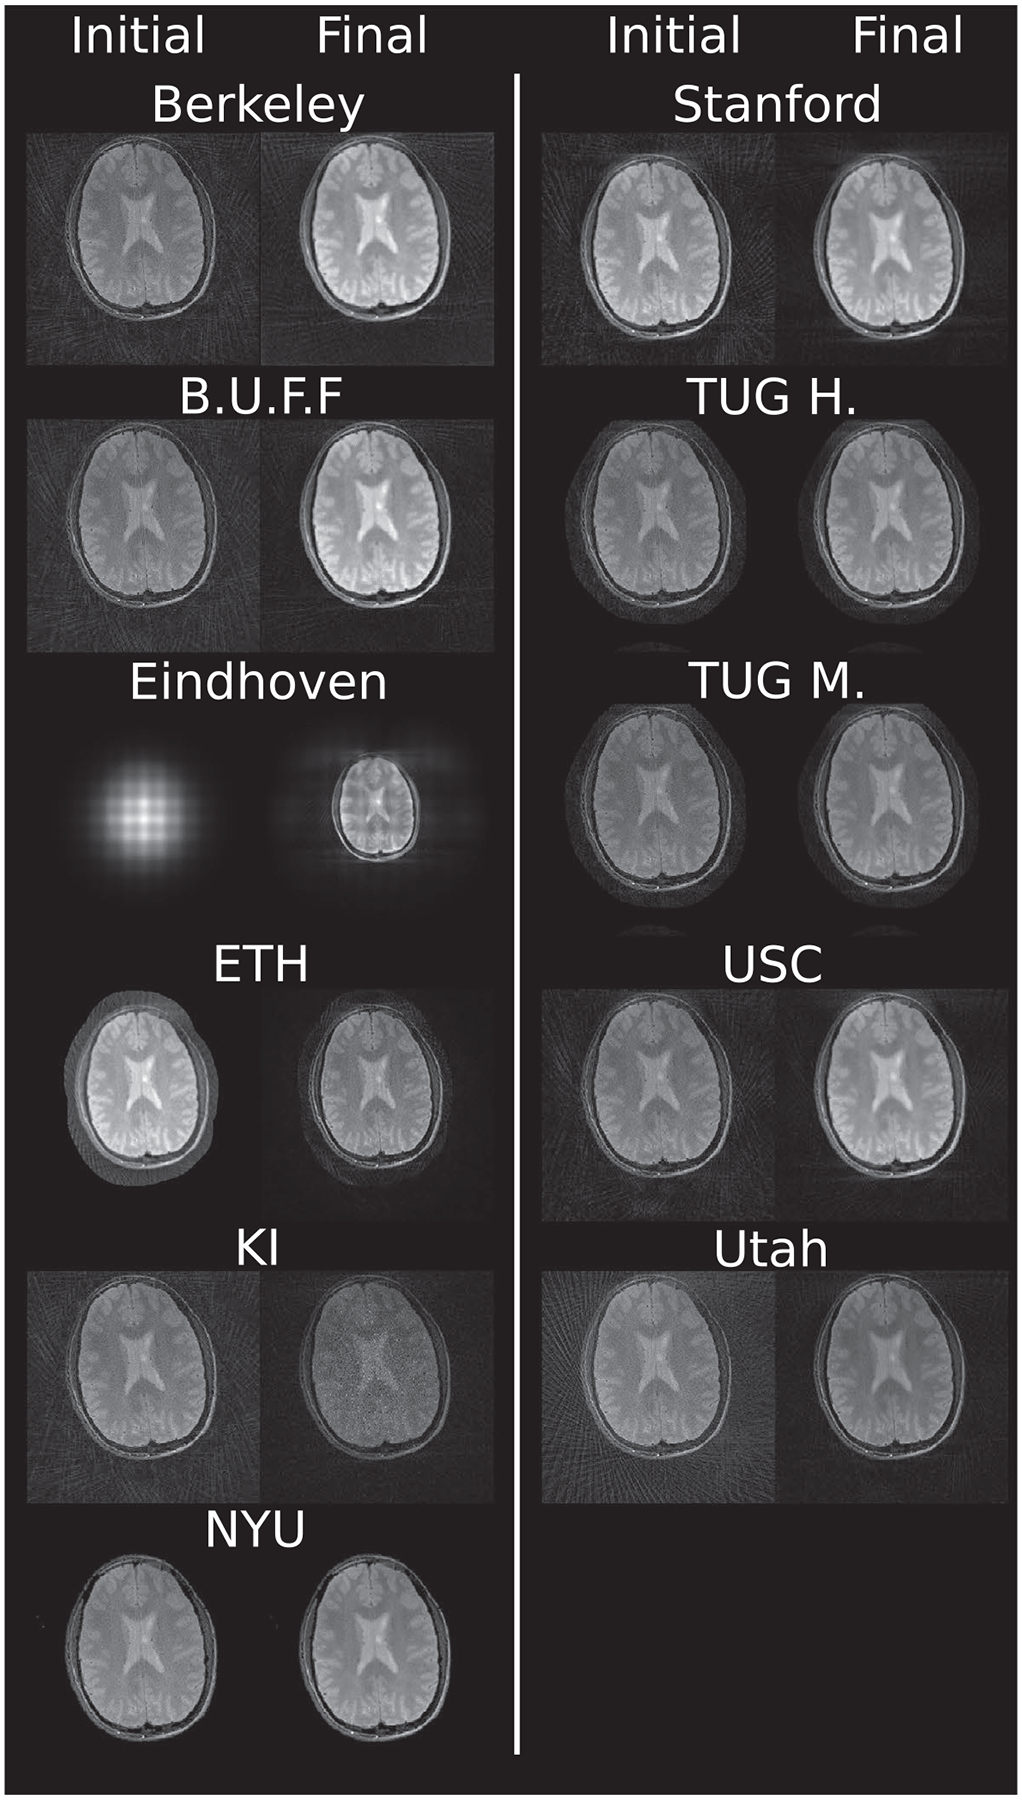
Example images after evaluation of the right-hand side of equation (Initial) and after termination of the algorithm for (Final) for each submission. Shown are results for acceleration factor of 2 of the supplied challenge brain data. All results are shown as they are returned by each algorithm. Visually observable differences include intensity variations among the reconstructions as well as some image center shifts and FOV differences. In addition, some reconstructions utilized image masks for the background
For the heart data shown in Figure 3, more differences are observed. First, FOV differences occur more frequently (Eindhoven, cropped to 320 × 320; ETH, cropped to 360 × 360; NYU, cropped to 300 × 300; Stanford, asymmetric crop to 240 × 336). Second, matrix size in the same FOV and thus resolution is changed by some submissions (Berkeley, 300 × 300; USC, 256 × 256, Utah, 320 × 320). The heart reconstruction results for 11 spokes from Berkeley seem to be more noisy than the others. The reconstructions using the reference implementations, are given in Figures 4 and 5 for Python and Matlab, respectively. Neither intensity nor contrast variations are visible between the two reference implementations.
FIGURE 3.
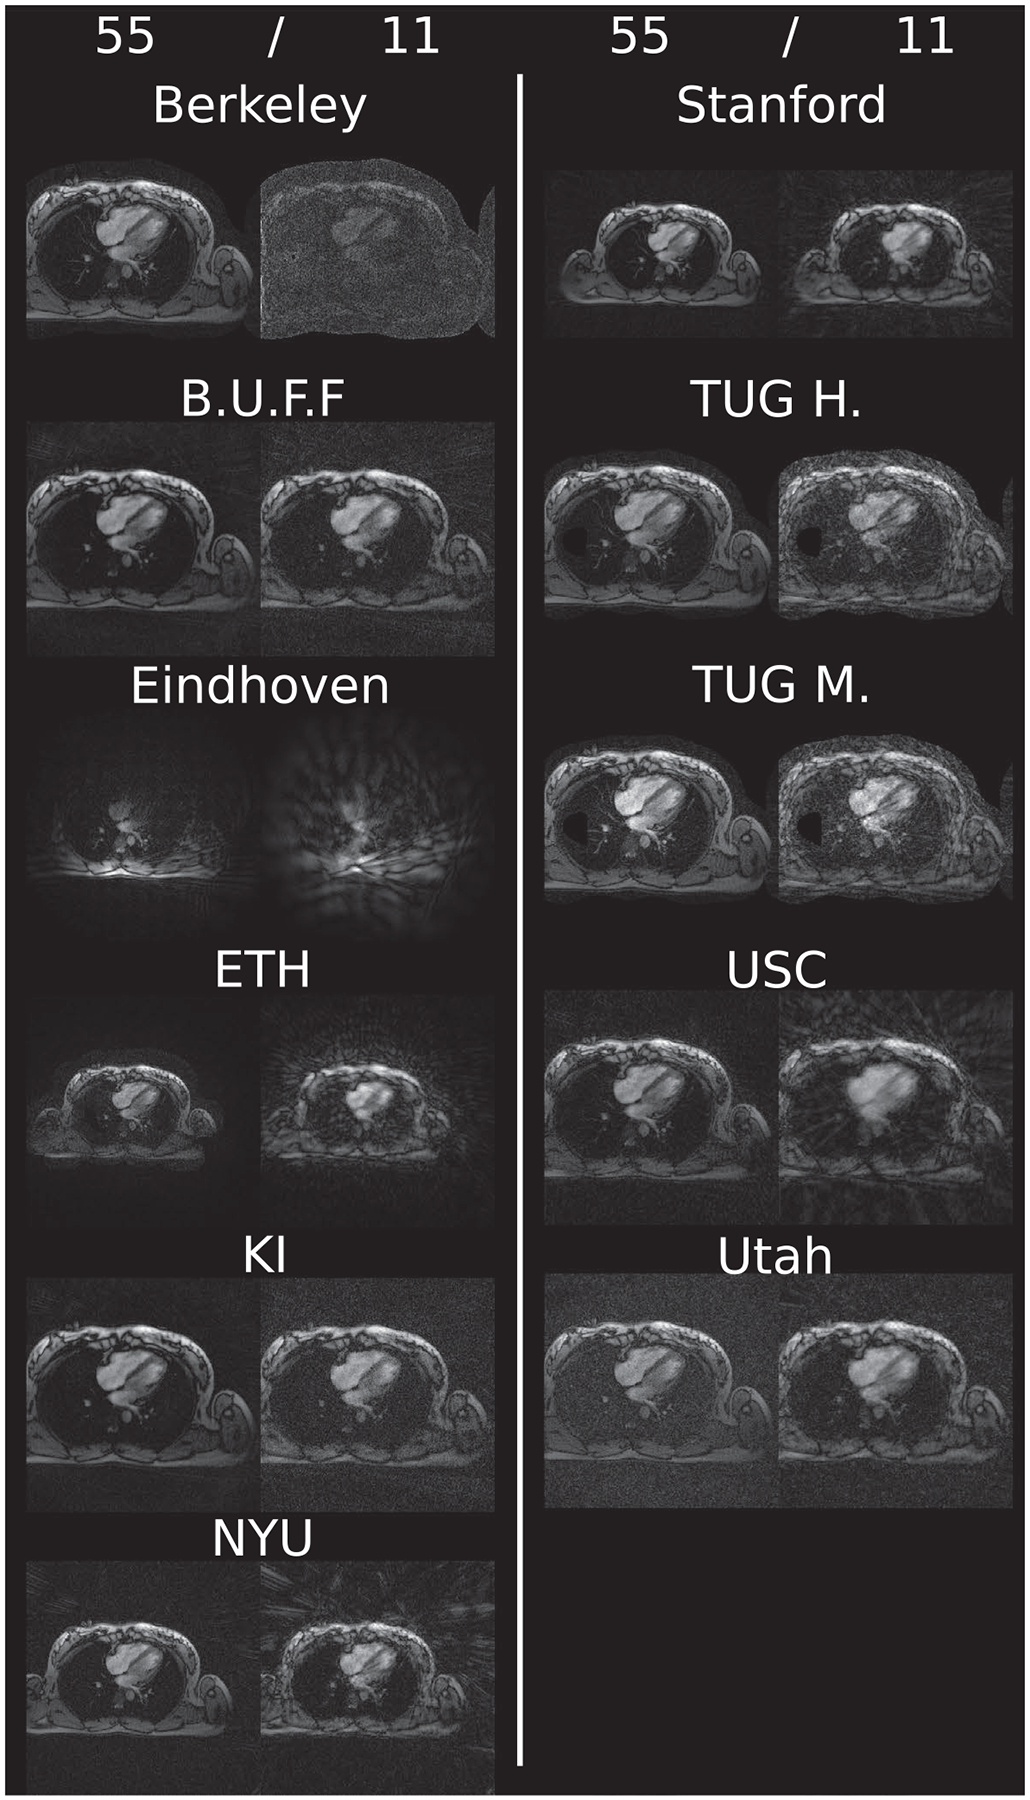
Example reconstruction results for each challenge submission. Shown are results using 55 and 11 spokes of the supplied challenge heart data. Visually observable differences amount to FOV changes as well as image center changes. Intensity variations are not as severe as in the case of brain data. Again, some reconstructions made use of a mask to suppress background signal
FIGURE 4.
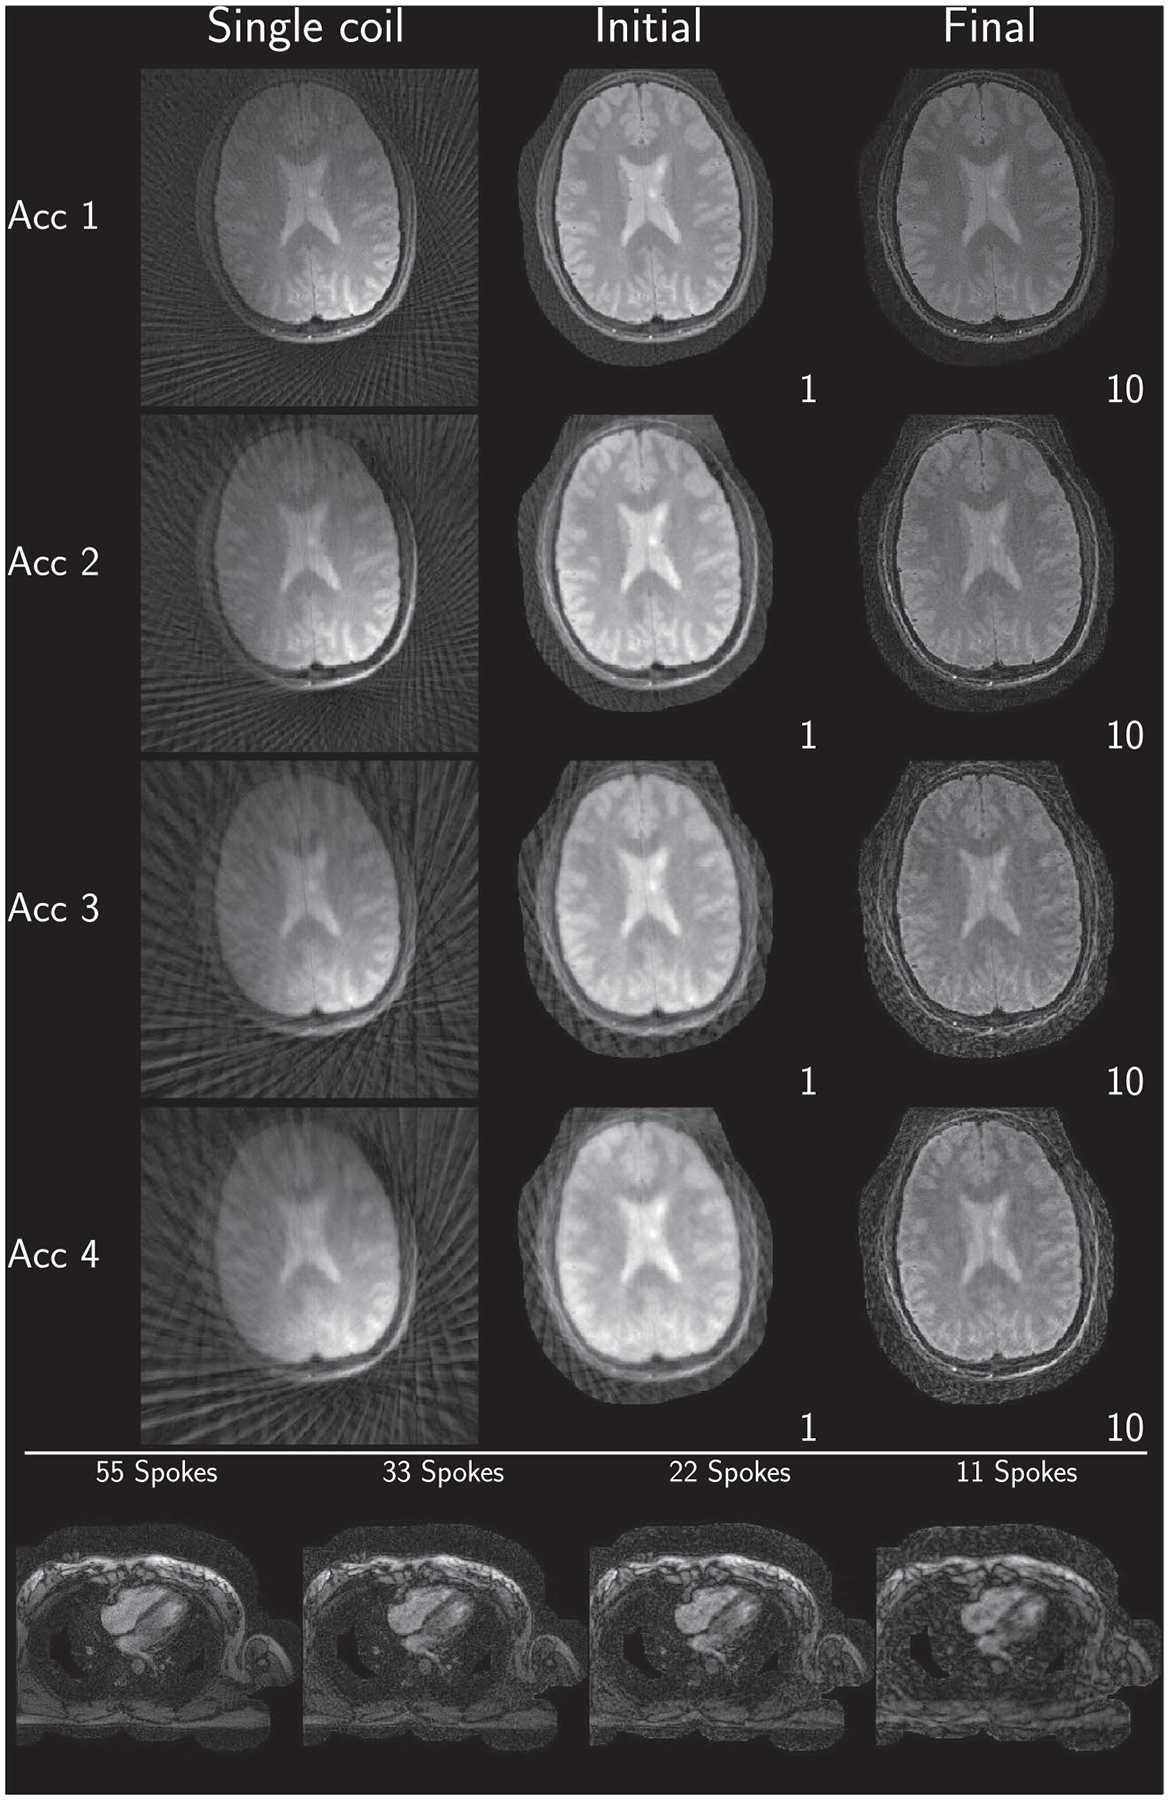
Consolidated reconstruction results using the Python reference implementation
FIGURE 5.
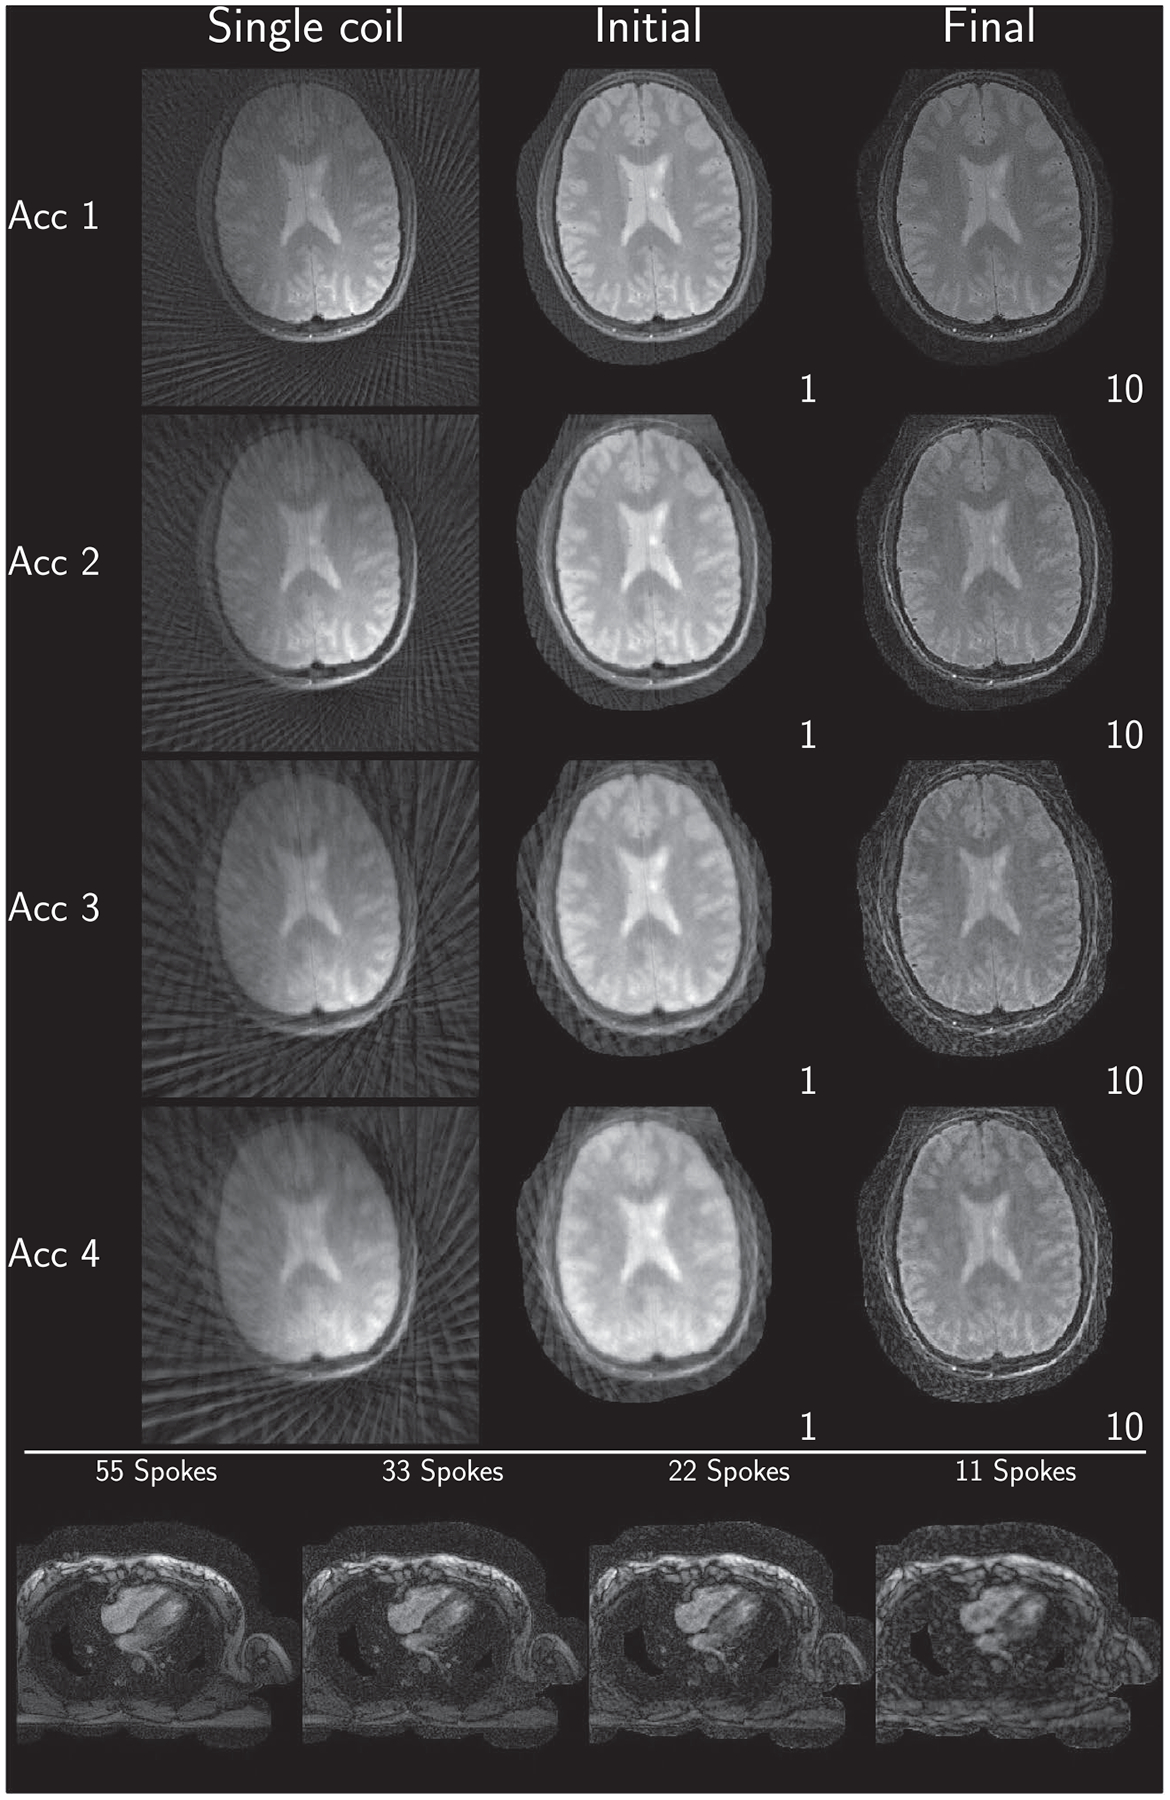
Consolidated reconstruction results using the Matlab reference implementation
3.2 |. Differences to consolidated implementation
Visually, no major differences to the submissions are visible. Pixel-wise difference plots are shown in Figure 6 for brain and Figure 7 for heart data, respectively. Reconstructions from Eindhoven, KI, USC, Stanford, and Utah show some misalignment caused by image center shift, rotation, or matrix size differences compared to the reference after cropping to the desired resolution of 300 × 300 pixels. Small intensity variations across the brain are visible in the final step of the TUG M. reconstruction. Reconstructions from Berkeley, B.U.F.F., ETH, NYU, and TUG H. show the least deviations to the reference. Visually no difference in the brain tissue can be seen. Initial steps seem to show good agreement if image alignment matches with only minor intensity difference in some submissions. Heart data show overall more differences, especially in areas of low signal-to-noise ratio (SNR). The heart itself seems consistent between most reconstructions. At the highest acceleration, differences become more pronounced.
FIGURE 6.
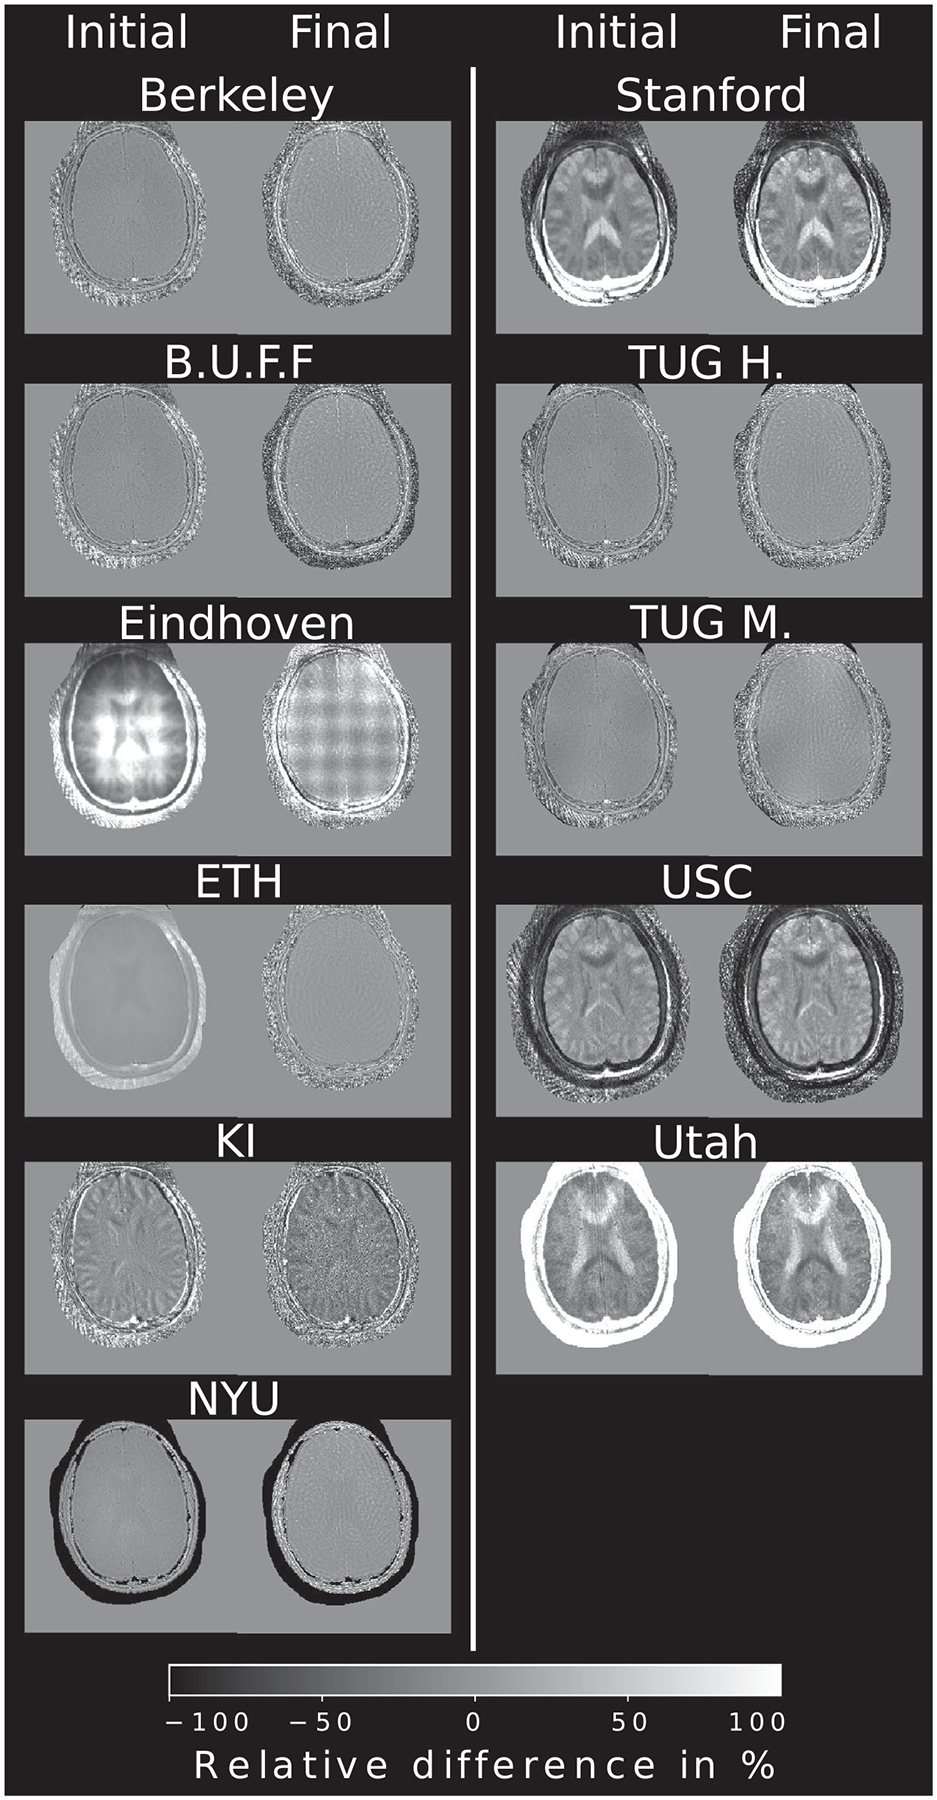
Relative pixel-wise difference of the initial and final step, taken from the brain example and compared to the Python reference implementation. To account for different intensities, all images were normalized prior to the difference operation, however the submissions were not registered in terms of lateral shifts or rotation. Still, most reconstructions do not show substantial structural differences to the reference
FIGURE 7.
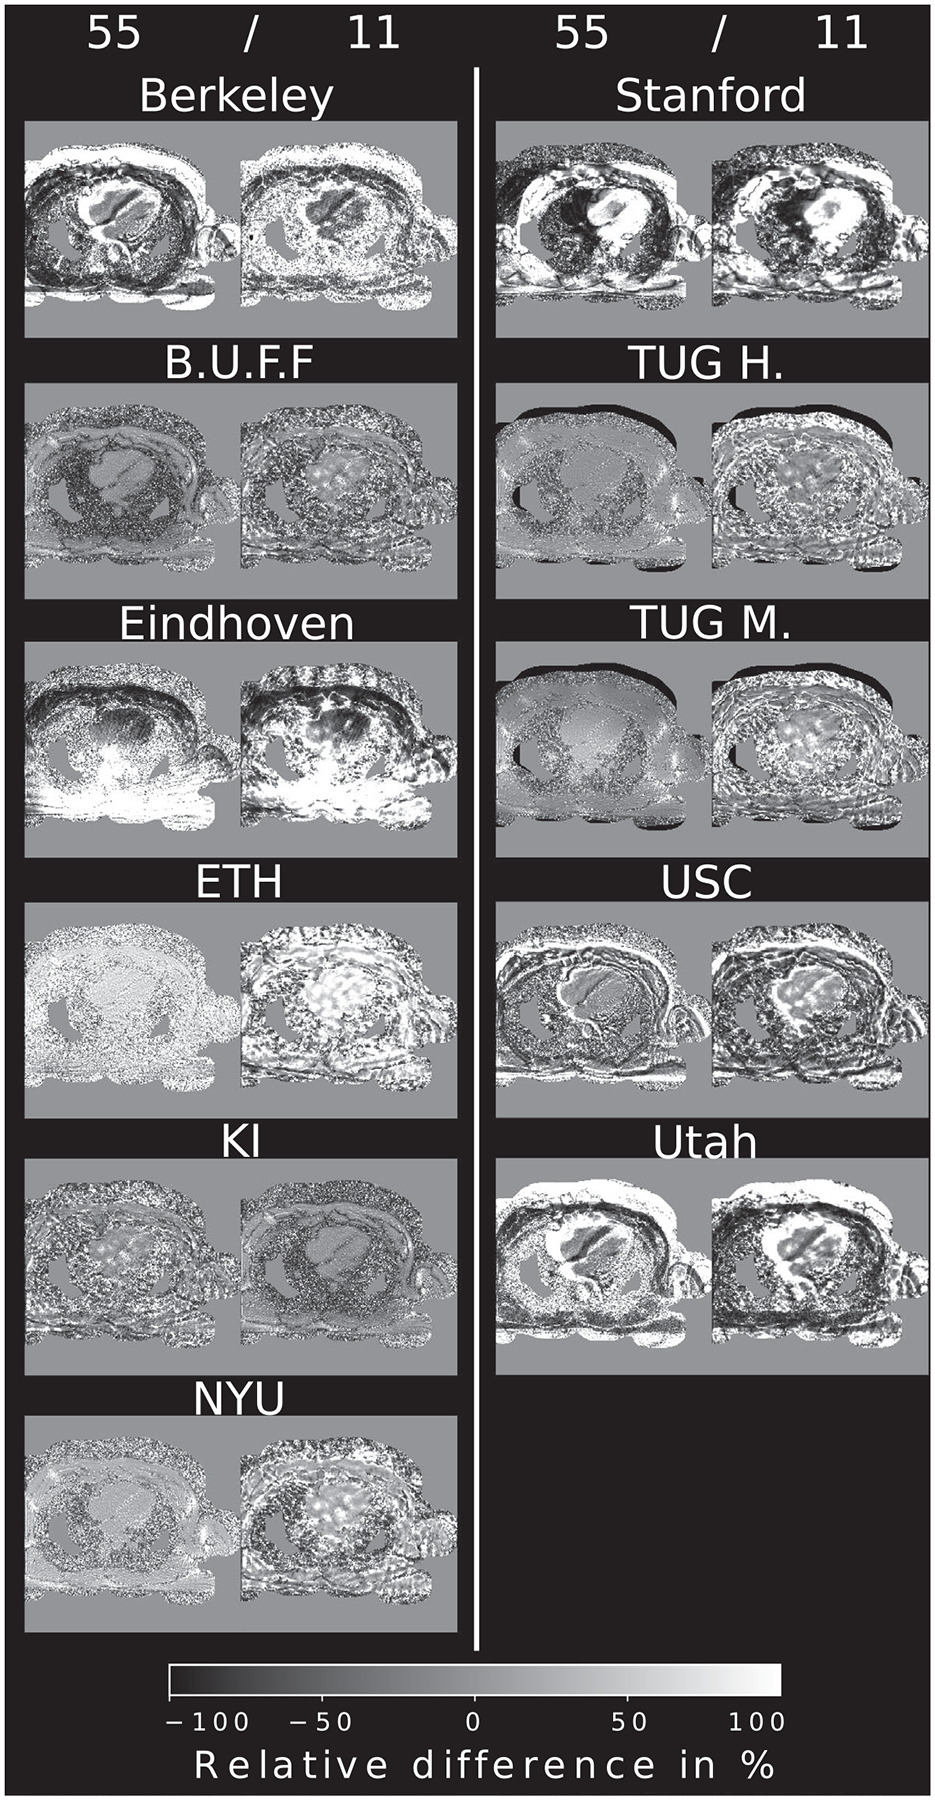
Relative pixel-wise difference of the example reconstruction using 55 and 11 radial projections, compared to the Python reference implementation. To account for different intensities, all images were normalized prior to the difference operation. Most reconstructions show similar structural information in the heart itself but differ in low signal areas
The pixel-wise comparison between the two reference implementations in Figure 8 for brain (top part) and heart (bottom part) data shows the overall excellent accordance between the Matlab and Python reconstruction results. No major differences are visible in any of the images. The single-coil images and initial images show very slight intensity differences. The visual impression is supported by high SSIM values (0.9987–0.9998) and small NRMSE values (0.006–0.028). The highest differences are visible outside of the brain at the border of the used image mask. Similar excellent accordance between both reconstructions is achieved for heart data. NRMSE and SSIM are comparable to the brain data but areas with little to no signal outside the body show slight, noise-like deviations.
FIGURE 8.
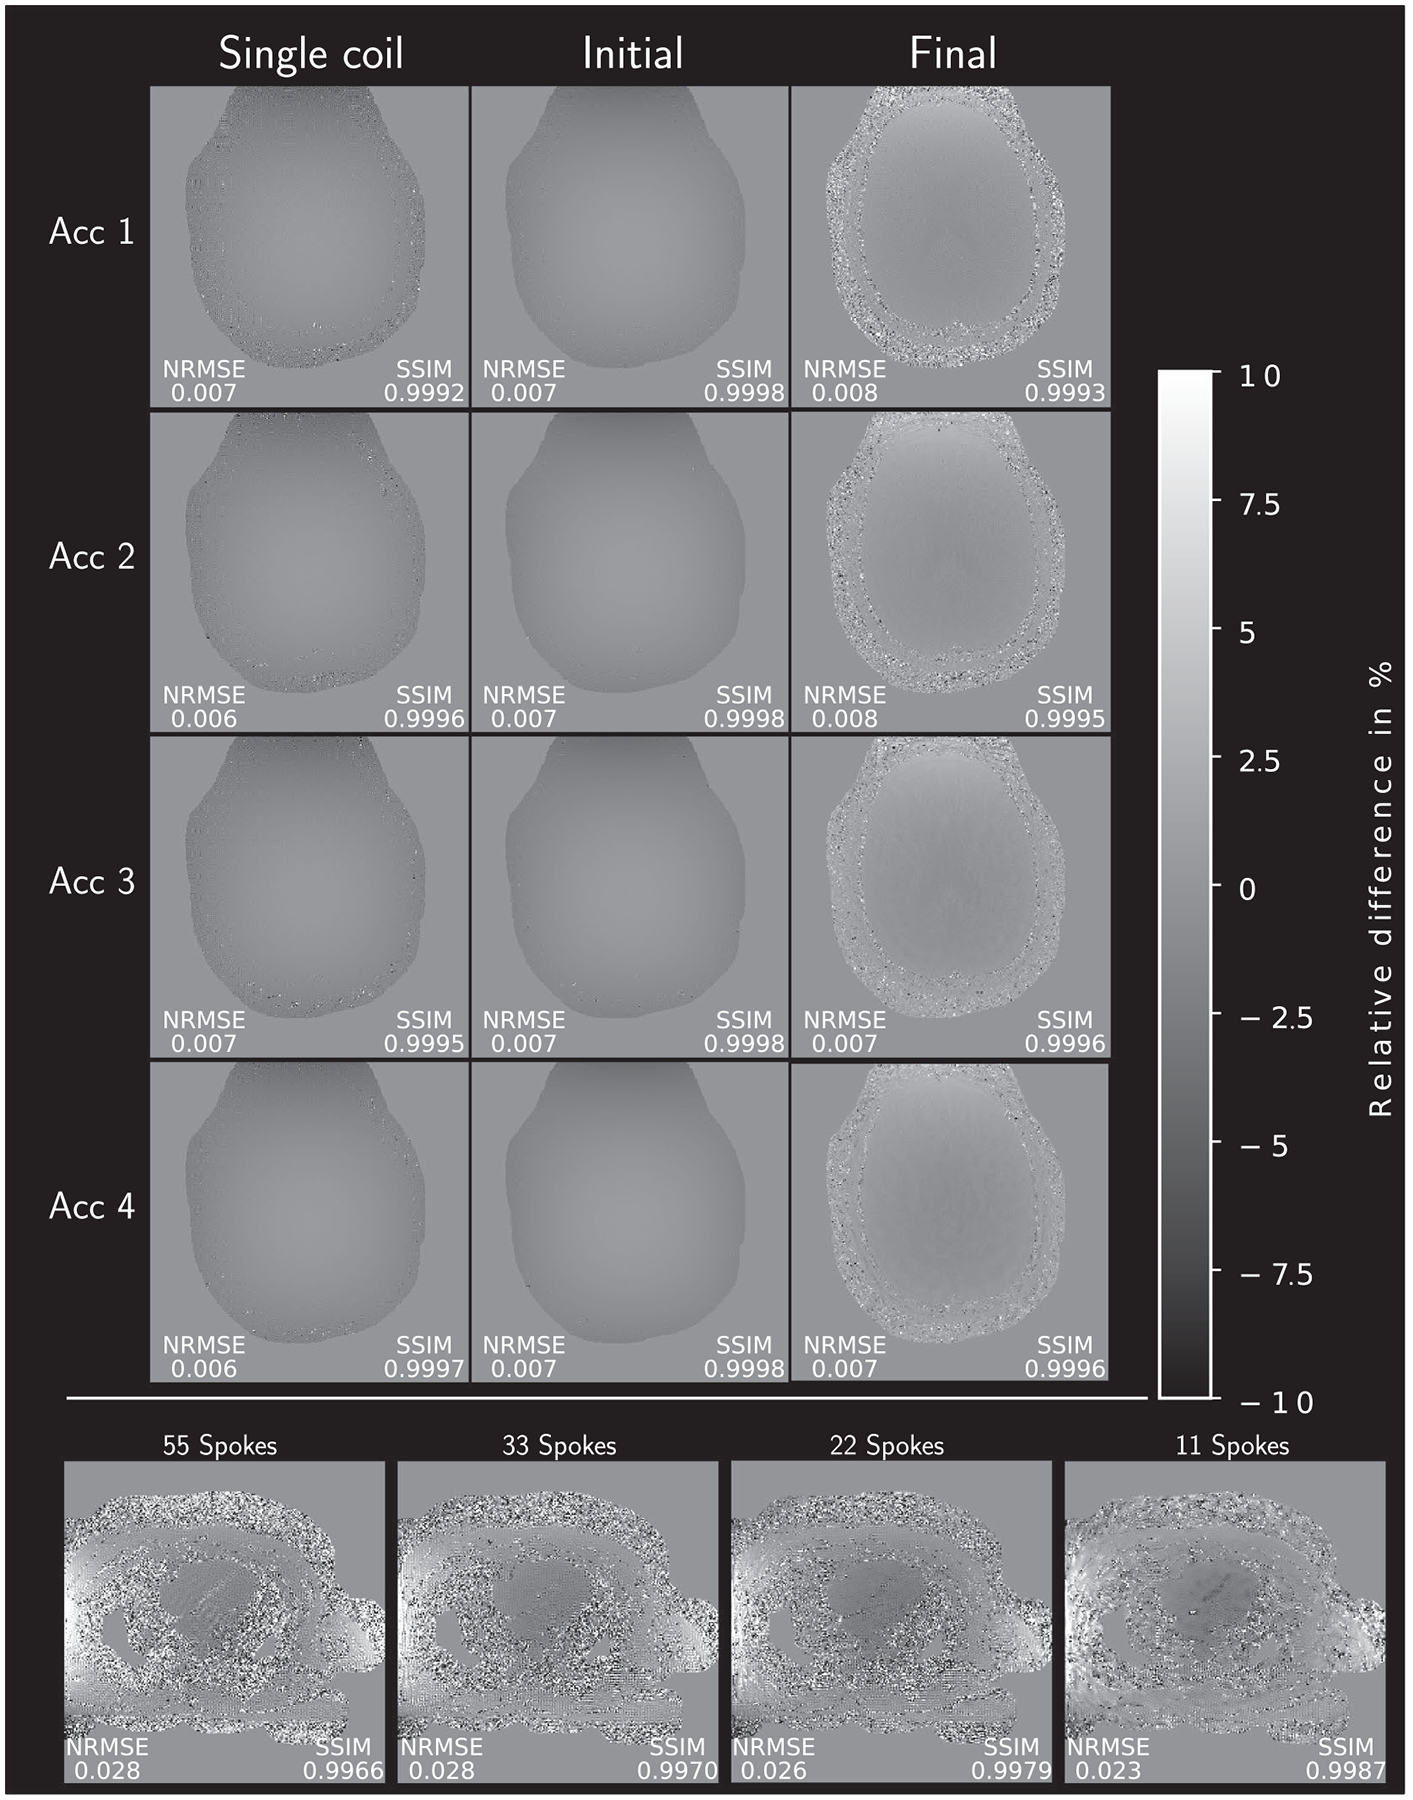
Relative pixel-wise difference between the Matlab reference reconstruction results and the Python reference implementation. To account for different intensities, all images were normalized prior to the difference operation. SSIM and NRMSE values between the two references are given next to each image. Metrics are computed from values within a binary mask, containing the brain and heart, respectively. Note the 10-fold smaller windowing (−10/10%) compared to the other submissions
Finally, Figure 9 shows the two additionally supplied datasets. Both reference methods are able to produce clean images and visually, no differences can be observed.
FIGURE 9.
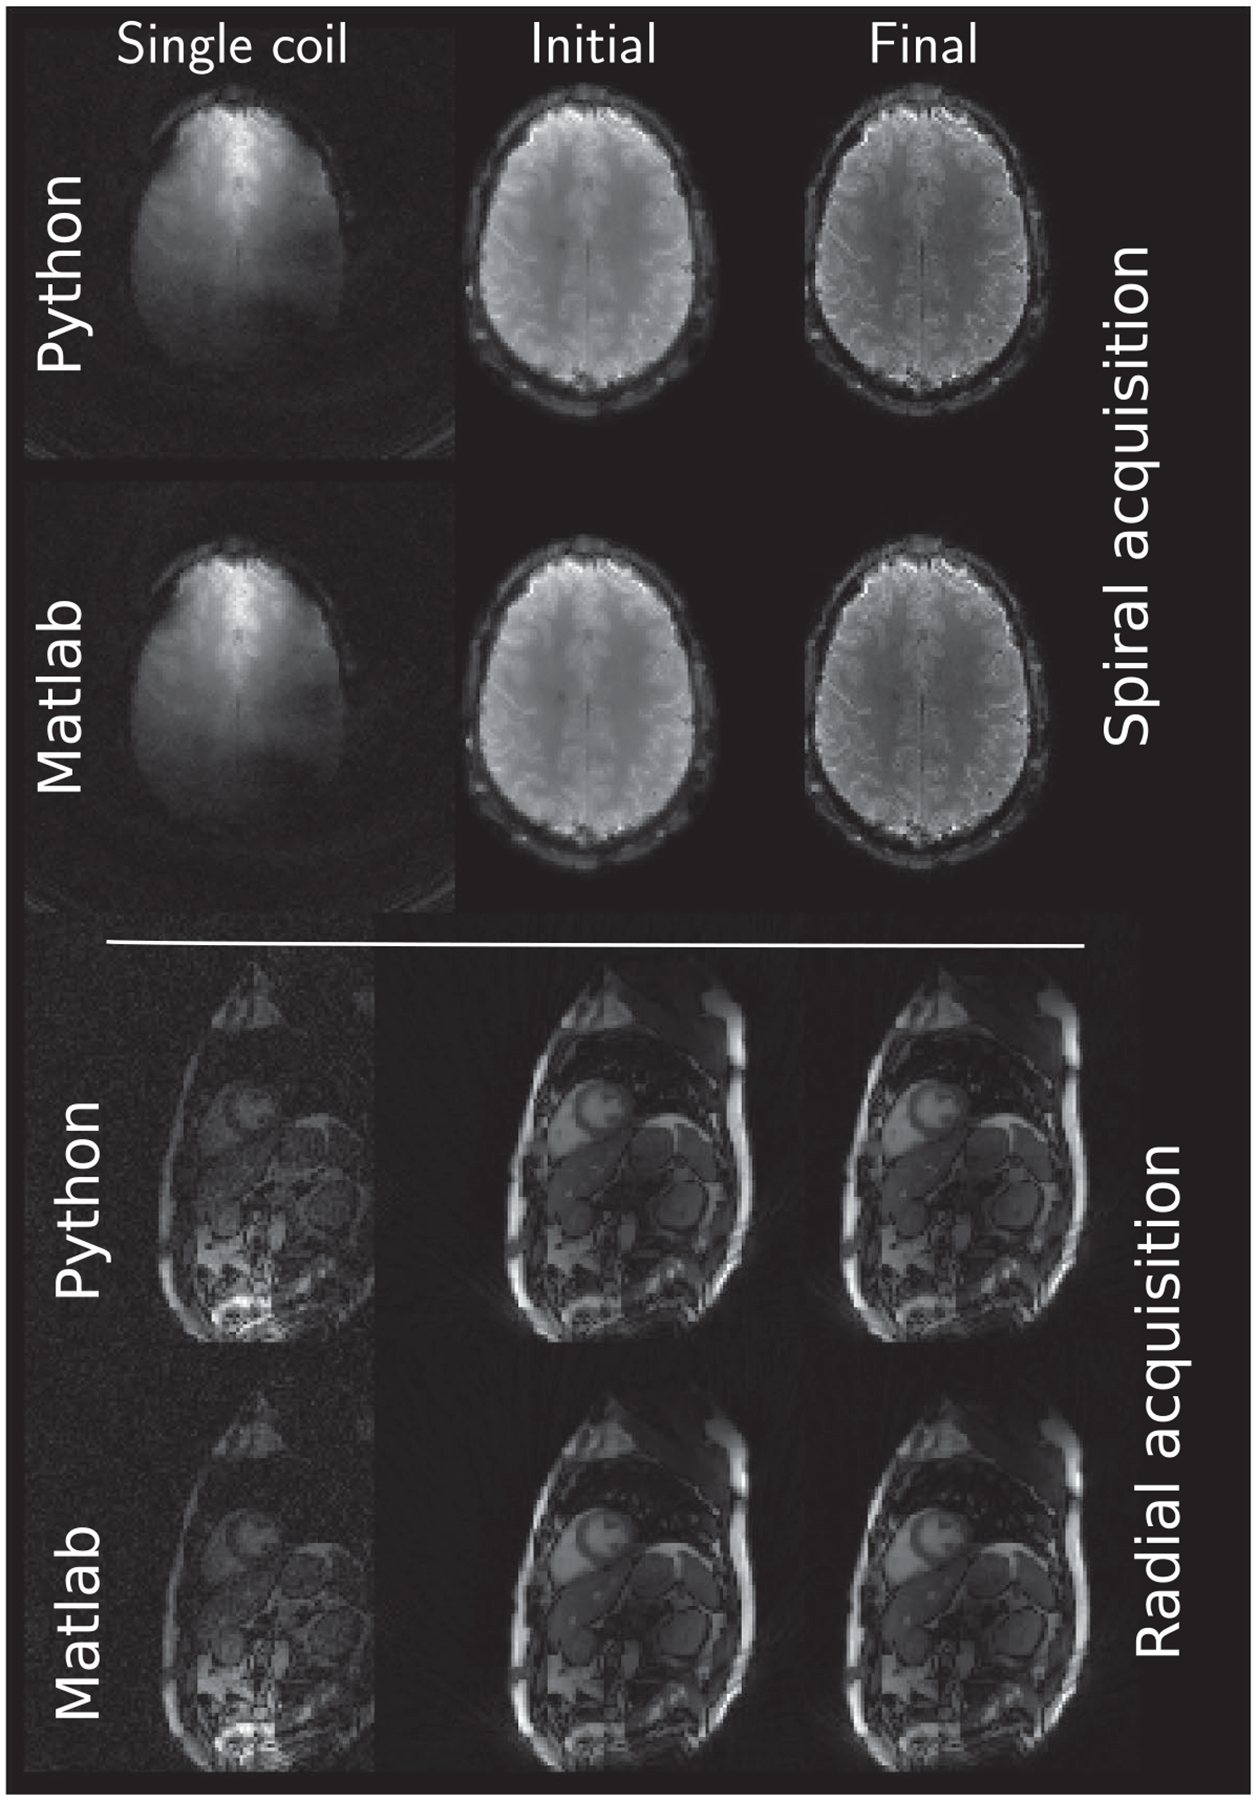
Example reconstruction results of the two additional supplied datasets. Top rows show the spirally acquired brain dataset and bottom rows show radially acquired cardiac data. Both reconstructions included noise pre-whitening prior to reconstruction from a dedicated noise scan preceding image acquisition. Windowing is performed between the minimum and maximum intensity value in each image
4 |. DISCUSSION
4.1 |. Achievements of the challenge
The first ISMRM reproducibility challenge led to twelve submissions from research groups spread across many countries. Furthermore, the challenge gave rise to the production of two consolidated implementations of the seminal paper, written in the two most commonly used programming languages across all submissions. However, it also raised the question of what concretely reproducibility means and how to measure similarity between different images. Even though many different toolboxes and reconstruction approaches were used by the participants the visual appearance of the reconstructions is very similar.
4.2 |. Difference of submissions
4.2.1 |. Imaging parameter
As no desired FOV was given, some problems arose with the correct choice of the reconstruction FOV. It is common to assume an oversampling of 2 compared to the radial acquisition but for the supplied data, this was not the case. The brain was oversampled by a factor of 1.706 and the heart by 1.3. These factors could be derived from the supplied trajectory but were not taken into account by all submissions. Larger FOVs can be easily corrected for by simply cropping to the desired FOV, which is commonly done symmetrically around the image center. All decided to crop in such a way, except for the submission of Stanford which crops symmetrically around the object. Although such an approach leads to a centered image, it can be tedious. The main reason for cropping the FOV is to crop away areas with aliasing, which typically folds back at the edges of the oversampled image grid.19,22 The aliasing gets worse with increased distance from the image center due to the amplification from the deapodization function and, depending on the gridding kernel, additional errors from outside of its pass-band can be introduced at the image edges.13,19,22
4.2.2 |. Gridding/NUFFT
As can be seen in the difference images in Figures 6 and 7, reconstructions with larger FOV show little or no structural differences to the references. A more concerning modification is the change of resolution as such changes can potentially lead to interpolation-related changes in visual appearance of the image. A possible source of such an increased or decreased pixel size lies in the way, how acquired data points are placed in the k-space via the gridding operation. If an oversampled grid is defined but the location of the samples in the trajectory is not correctly altered to span the whole range of this oversampled k-space, only the central part will be filled. Similar, if the points-to-grid lie outside of the desired k-space, they either are not gridded at all or enter on the opposite side of k-space, depending on the used boundary conditions. This leads to an interpolation in image space and an artificially altered resolution, that is, interpolation to higher or lower resolution, respectively. Small structural differences in the submissions may stem from different treatment of the supplied k-space trajectory. Normalization of the k-space coordinates, as is done in many submission, might lead to modifications of the actual k-space position if done independently for each of the spatial dimensions. This can lead to a rotation or distortion of the reconstructed image. Such differences cannot easily be corrected in the final images as those would involve some sort of interpolation to the desired matrix size or image registration, introducing errors related to the interpolation kernel. Therefore, no attempt was made to correct for different resolutions in the final image, leading to rather large deviations in the pixel-wise difference maps. Revised submissions in Figure 10, accounting for deviations in trajectory handling and/or FOV, show numerical differences for brain and heart data which are in-line with most of the other submissions. This suggests that the rather huge differences in the original submissions solely stem from wrongly treated trajectory information or FOV cropping.
FIGURE 10.
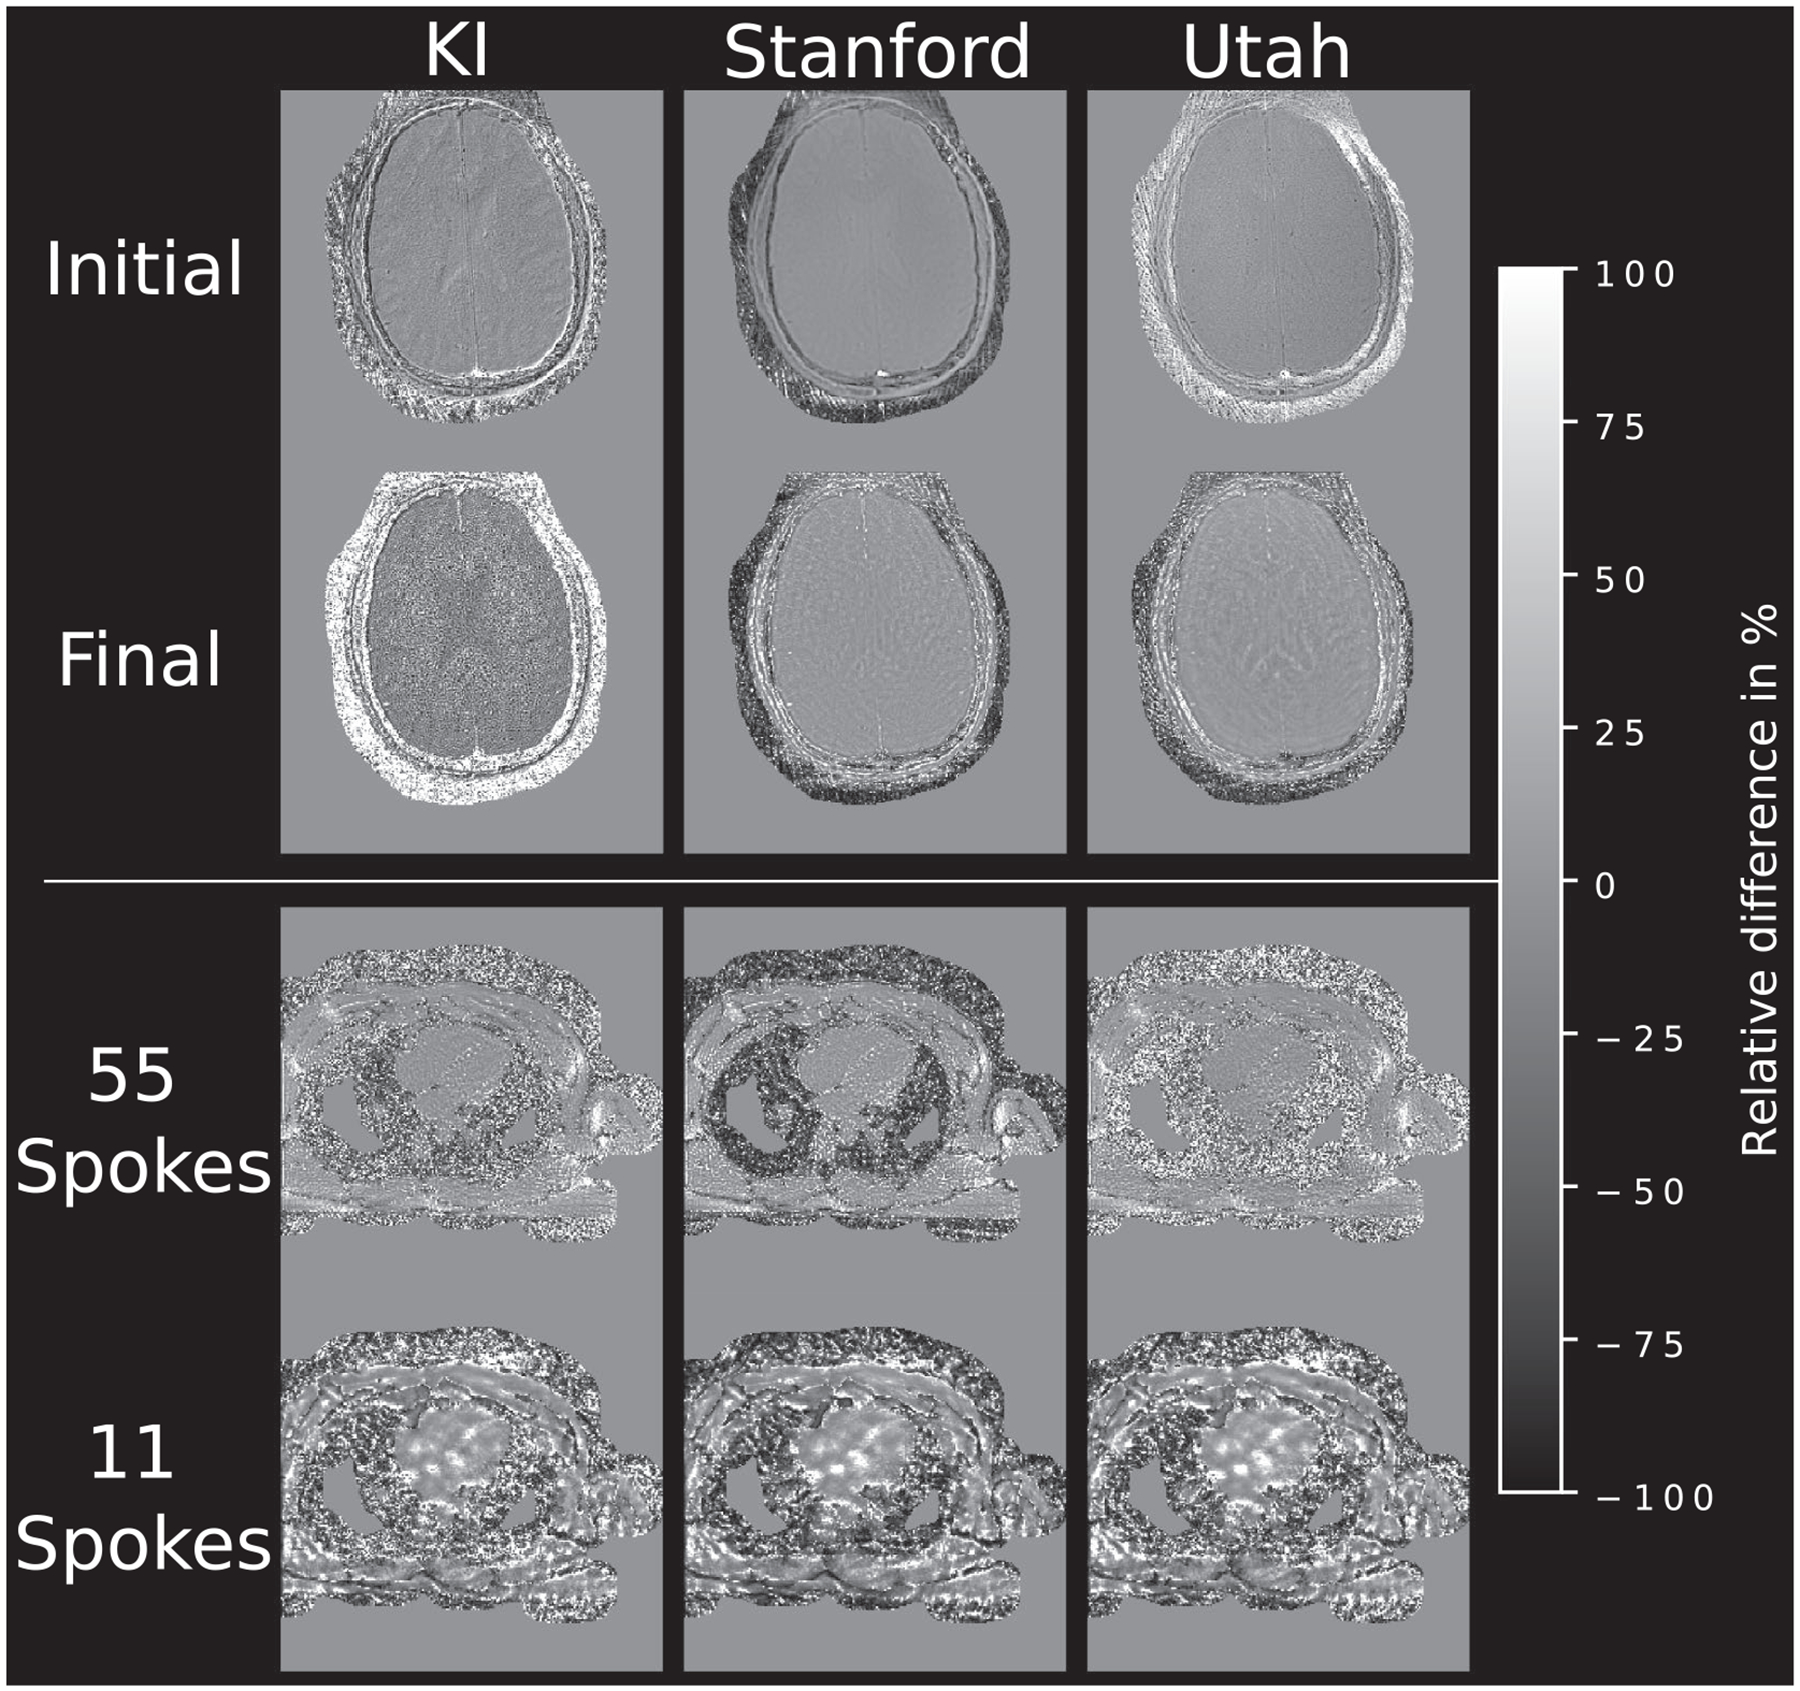
Relative pixel-wise difference of revised submissions, correcting FOV and/or trajectory related deviations to the reference implementation. In contrast to the initial submissions only minor deviations are visible
4.2.3 |. Algorithmic
The increased noise in the KI reconstruction may stem from the large amount of CG iterations combined with not using any regularization or k-space filtering. Running the CG algorithm for too many iterations leads to increased noise in the final reconstruction. This can also be seen in the heart reconstruction from 11 spokes from the Berkeley submission. Thus, early stopping is used as regularization in the original publication. Another form of regularization used in the submissions is plain Tikhonov regularization based on the L2-norm of the image, that is, λ > 0 in Equation (3). The regularization parameter, typically termed λ, is used to balance between data costs and regularization. Even though this is not included in the original publication, results from submissions with Tikhonov regularization show only minor differences to the reference using early stopping, see Figures 6 and 7. However, choosing a correct regularization parameter can be a challenging task. A too large value for the regularization parameter can lead to slow convergence and may be the reason for residual intensity variations in the TUG M. submission for both, brain and heart data. On the other hand, choosing a regularization parameter is usually easier than choosing a number of iterations, because it can be done based on sound principles.23–25
The solution of the inverse problem of finding an image from nonuniform acquired data highly depends on the quality of the pre-computed coil sensitivity profiles. A wrong or inaccurate estimate ultimately leads to poor reconstructed images. Even seemingly appropriate coil sensitivity profiles originating from different estimation methods can lead to noticeable differences in the reconstructed images, as could be expected due to their integral part in the forward and adjoint operator of the image reconstruction problem 1. Visual effects include intensity variations or signal voids in the image. In addition, the estimated coil profiles influence the solution via the intensity normalization, directly estimated from the coil profiles. To facilitate reproducibility of results included in this paper and to rule out the influence of different coil sensitivity estimation approaches when comparing to this CG-SENSE implementation all data provided online also contains estimated coil sensitivity profiles, which were used to generate the reference reconstruction results in both algorithms.
4.2.4 |. Evaluation
As images are typically given in arbitrary units, a direct numerical comparison can be challenging. As a result, image intensity normalization was applied. However, if normalization fails due to outliers or, in a more general sense, due to deviations with respect to the expected intensity histogram, it can lead to a false impression of rather large differences. This may be the reason for the increased deviations in the ETH submission of the heart data compared to the brain data as can be seen in the bright error map in Figure 7. To this end, no numerical metrics were used to compare submissions to the reference implementation as these would suffer even more from intensity variations or image shifts.
4.3 |. Reference implementations
During the development of the reference implementations, we identified that processing steps related to gridding yield the largest deviations, for example, trajectory normalization, apodization correction, and gridding kernel normalization. The largest deviations were associated with the normalization of the trajectory to a specific range, for example, |trajectory| ≤ | 0.5 |, as required by some NUFFT implementations. The least deviations can be achieved without any modifications of the supplied trajectory, that is, taking the natural range of k-space locations as acquired and stored alongside the raw k-space data from the scanner and adapting the gridding to account for the increased range of possible values (eg, |N/2| ≫ |0.5|, with N being the matrix size of the desired FOV).
The two reference implementations show no major difference inside the brain as evident in Figure 8. A very slight intensity difference for single coil and initial images can be seen which might be related to the apodization correction. Minor implementation details, such as the linear interpolation of the gridding kernel vs the nearest neighbor interpolation or the FFTW26 in Matlab vs the FFTPACK-based algorithm Cooley and Tukey,27 Bluestein28 of Python, in combination with the iterative steps of the algorithm may lead to the remaining differences. The heart data show overall good agreement with increased deviations in areas with little to no signal, either inside the lungs or outside the body. The area of interest, the heart, shows no substantial difference between the two reference implementations. The SSIM and NRMSE metrics are computed within the same binary mask used for reconstruction. Thus, even better values for these metrics are expected if only the brain tissue itself is evaluated. The same is true for the heart reconstruction. Cropping the area to only include reliable pixels, that is, pixels with high enough signal, SSIM values could be further improved.
To this end, the implementations of the CG-SENSE algorithm in Matlab and Python can be considered equally accurate and thus the submitted algorithms were compared to just one of the two references, the Python-based implementation.
4.4 |. Licensing code and data
When the challenge was initiated, very little constraints were implied on how data could be used and code should be provided, to enable widespread participation. However, in retrospect, a widespread adoption and reuse of the data and code submissions created by the challenge requires some consideration of licensing, in order to stand on firm legal footing.
This is because if no license is specified, the owners of code or data retain all copyright, and have to give explicit permission for its use. But in the context of reproducibility, making software open-source and reusable for other researchers is key. Two classes of software licenses are best suited for this cause: copyleft licenses, such as the General Public License (GPLv3), or permissive licenses, such as the MIT license.
There are good resources explaining the differences between those,29 including a very accessible website how to choose one: https://choosealicense.com/. In brief, MIT has the least restrictions and simplifies commercial use, whereas GPL puts emphasis on keeping code open source, that is, if one builds on GPL-licensed code, one has to make it publicly available, even in commercial settings. This also means that MIT-licensed code can be used within a GPL project, but not the other way around, and one might have to choose GPL as a license then.
For sharing data, the situation is complicated by the fact that data might be considered part of software and documentation, or work of creative art, for which the class of creative common (CC) licenses were envisaged (https://creativecommons.org/choose/). If the source should be attributed and any use granted, including alterations and commercialization, CC-BY 4.0 is an appropriate choice for data. Recently, the Open Data Commons (https://opendatacommons.org/) initiative of the Open Knowledge Foundation started to provide specific licensing tools for data.
For this challenge, we decided to license all data and code of the reference implementation under the MIT license, in order to keep licensing as simple and permissible as possible. We list the choice of licensing for all contributions in Table 1.
4.5 |. Future impact
The first RRSG challenge has already been met with a very positive response, both in reproducing the selected publication, but more importantly in bringing together a community of researchers who are interested in reproducible science and MR image reconstruction. On top of that, we also see very practical use of its outcome in the future, as a benchmark for novel implementations of CG-SENSE. The clear definition of the challenge and its outcome measures, combined with the resulting reference implementation and comparison code, might encourage researchers to put their own reconstruction tools to the test. It should be noted that proper tuning of iteration numbers or regularization parameters is indispensable if reference methods are applied to new data to enable a fair comparison.
In fact, researchers have already started to adopt this idea and created submissions after the official challenge had ended. A recent effort by the Hamburg University of Technology (https://github.com/MagneticResonanceImaging/ISMRM_RRSG) demonstrates reproducibility of the CG-SENSE algorithm in the modern programming language Julia30 (https://julialang.org/) utilizing their MRIReco.jl reconstruction package.31 We believe that this could become a general model for future software publications to use proposed example data and outcome measures of reproducibility challenges in order to show performance and scope of these tools in a more standardized fashion.
Reproducibility of image reconstruction in MRI can be challenging, especially with the increased complexity of the used algorithms. Even though the description in a paper allows to re-implement the reconstruction algorithm, a lot of details may be not stated explicitly and can lead to unexpected outcome, for example, exact step-sizes used in optimization, scaling of gradients, internal SNR estimates and other pre- and post-processing steps. These problems arise in many iterative fitting strategies throughout the whole field of MRI research, for example, quantifying tissue parameters, estimating perfusion/diffusion metrics, just to name a few.
Quantifying tissue parameters, more specifically the T1 relaxation constant, is also the aim of the “Reproducibility Challenge 2020” of the study group. Reproducing exact quantitative values at multiple sites is challenging due to small variations in measurement imaging hardware and software. The challenge aims to identify the sources of variation and tries to standardize T1 mapping across multiple sites.
5 |. CONCLUSION
This work shows that reproducing research results without access to the original source code and data leaves room for interpretation. Even though visual differences are minor for most submissions, a lot of deviations in various implementation details can be observed. During the evaluation, it became clear that the task of comparing the submissions to each other is by no means trivial. Seemingly minor details, such as maximum image intensity or FOV and resolution can lead to huge deviations in a pixel-wise comparison even though visually differences are small. This raises the question of what can be considered ground truth. A question, which has no clear answer if neither original code nor data are available. A consolidated implementation can be used as substitute in such cases, as done in the present work. From what we have learned in this first reproducibility challenge, our recommendation is publishing not only papers but also code and data to make sure research is really reproducible.
Supplementary Material
TABLE S1 Sequence and k-space related parameters of the supplied datasets
ACKNOWLEDGEMENTS
The authors thank
Berkeley Miki Lustig, Ekin Karasan, Suma Anand, Volkert Roeloffs
ETH Thomas Ulrich, Maria Engel, S. Johanna Vannesjo, Markus Weiger, David O. Brunner, Bertram J. Wilm, Klaas P. Pruessmann, as well as Felix Breuer and Brian Hargreaves, who contributed the sparse matrix gridding implementation
MDC/B.U.F.F. - Berlin Ludger Starke
MGH Gilad Liberman
USC Namgyun Lee
for participating in the first ISMRM Reproducible Research Study Group challenge and spending their valuable time to reproduce the CG-SENSE algorithm.
This work was supported by the NCCR “Neural Plasticity and Repair” at ETH Zurich (LK). Technical support from Philips Healthcare, Best, The Netherlands, is gratefully acknowledged (LK, FP).
FK acknowledges grant support from the NIH under awards R01EB024532, P41EB017183, and R21EB027241.
OM acknowledges grant support from the Austrian Academy of Sciences under award DOC-Fellowship 24966.
Funding information
Austrian Academy of Sciences, DOC-Fellowship, Grant/Award Number: 24966; NIH (NIBIB), Grant/Award Number: R01EB024532, P41EB017183, R21EB027241 and U24EB029240
Footnotes
DATA AVAILABILITY STATEMENT
- Challenge submissions https://ismrm.github.io/rrsg/challenge_one/.
- Reference implementations https://github.com/ISMRM/rrsg_challenge_01
- Original data https://ismrm.github.io/rrsg/challenge_one/.
- Supplementary spiral brain and radial cardiac data https://doi.org/10.5281/zenodo.3975887.
- Evaluation scripts to produce the figures https://github.com/ISMRM/rrsg_challenge_01
- All code and data are licensed under the MIT License (https://en.wikipedia.org/wiki/MIT_License)
SUPPORTING INFORMATION
Additional Supporting Information may be found online in the Supporting Information section.
REFERENCES
- 1.Pruessmann KP, Weiger M, Börnert P, Boesiger P. Advances in sensitivity encoding with arbitrary k-space trajectories. Magn Reson Med. 2001;46:638–651. [DOI] [PubMed] [Google Scholar]
- 2.Claerbout JF, Karrenbach M. Electronic documents give reproducible research a new meaning. SEG Tech Program Expanded Abstracts. 1992;601–604. [Google Scholar]
- 3.Reproducible Research. Computing in Science & Engineering. 2010;12:8–13. [Google Scholar]
- 4.Peng RD. Reproducible research in computational science. Science (80-) 2011;334:1226–1227. [DOI] [PMC free article] [PubMed] [Google Scholar]
- 5.Baker M 1,500 scientists lift the lid on reproducibility. Nature. 2016;533:452–454. [DOI] [PubMed] [Google Scholar]
- 6.Topalidou M, Leblois A, Boraud T, Rougier NP. A long journey into reproducible computational neuroscience. Front Comput Neurosci. 2015;9:30. [DOI] [PMC free article] [PubMed] [Google Scholar]
- 7.Chen X, Dallmeier-Tiessen S, Dasler R, et al. Open is not enough. Nat Phys. 2018;15:113–119. [Google Scholar]
- 8.Cacho JRF, Taghva K. The state of reproducible research in computer science. 17th International Conference on Information Technology–New Generations (ITNG 2020). Advances in Intelligent Systems and Computing. Vol. 1134. 1st ed. Cham: Springer International Publishing; 2020:519–524. [Google Scholar]
- 9.Pruessmann KP, Weiger M, Scheidegger MB, Boesiger P. SENSE: sensitivity encoding for fast MRI. Magn Reson Med. 1999;42:952–962. [PubMed] [Google Scholar]
- 10.Tikhonov AN, Arsenin VIA. Solutions of ill-posed problems/Andrey N. Tikhonov and Vasiliy Y. Arsenin. Scripta series in mathematics. Trans. ed., John Fritz. Winston distributed solely by New York: Halsted Press Washington; 1977. [Google Scholar]
- 11.Shewchuk JR. An Introduction to the Conjugate Gradient Method Without the Agonizing Pain. Schenley Park Pittsburgh, PA: Carnegie Mellon University; 1994. [Google Scholar]
- 12.Ong F, Uecker M, Lustig M. Accelerating non-Cartesian MRI reconstruction convergence using k-space preconditioning. IEEE Trans Med Imaging. 2020;39:1646–1654. [DOI] [PMC free article] [PubMed] [Google Scholar]
- 13.Beatty PJ, Nishimura DG, Pauly JM. Rapid gridding reconstruction with a minimal oversampling ratio. IEEE Trans Med Imaging. 2005;24:799–808. [DOI] [PubMed] [Google Scholar]
- 14.Fessler JA, Sutton BP. Nonuniform fast Fourier transforms using min-max interpolation. IEEE Trans Signal Process. 2003;51: 560–574. [Google Scholar]
- 15.Koziol Q, Robinson D. USDOE office of science. HDF5. Computer software. March 25, 2018. https://www.osti.gov//servlets/purl/1631295; 10.11578/dc.20180330.1 [DOI]
- 16.Uecker M, Ong F, Tamir JI, et al. Berkeley advanced reconstruction toolbox. In: Proceedings of the International Society of Magnetic Resonance in Medicine; Toronto, ON; 2015:2486. [Google Scholar]
- 17.Block KT. Advanced Methods for Radial Data Sampling in Magnetic Resonance Imaging. Georg-August-Universität Göttingen; 2008. http://hdl.handle.net/11858/00-1735-0000-0006-B3AD-C [Google Scholar]
- 18.Walsh DO, Gmitro AF, Marcellin MW. Adaptive reconstruction of phased array MR imagery. Magn Reson Med. 2000;43:682–690. [DOI] [PubMed] [Google Scholar]
- 19.Jackson JI, Meyer CH, Nishimura DG, Macovski A. Selection of a convolution function for Fourier inversion using gridding (computerised tomography application). IEEE Trans Med Imaging. 1991;10:473–478. [DOI] [PubMed] [Google Scholar]
- 20.Uecker M, Hohage T, Block KT, Frahm J. Image reconstruction by regularized nonlinear inversion–joint estimation of coil sensitivities and image content. Magn Reson Med. 2008;60:674–682. [DOI] [PubMed] [Google Scholar]
- 21.Zhou Wang, Bovik AC Sheikh HR, Simoncelli EP. Image quality assessment: from error visibility to structural similarity. IEEE Trans Image Process. 2004;13:600–612. [DOI] [PubMed] [Google Scholar]
- 22.Osullivan JD. A fast sinc function gridding algorithm for fourier inversion in computer tomography. IEEE Trans Med Imaging. 1985;4:200–207. [DOI] [PubMed] [Google Scholar]
- 23.Golub GH, Heath M, Wahba G. Generalized cross-validation as a method for choosing a good ridge parameter. Technometrics. 1979;21:215–223. http://www.jstor.org/stable/1268518 [Google Scholar]
- 24.Hansen PC, O’Leary DP. The use of the L-curve in the regularization of discrete ill-posed problems. SIAM J Sci Comput. 1993;14:1487–1503. [Google Scholar]
- 25.Hansen PC. Rank deficient and discrete ill posed problems: numerical aspects of linear inversion. Soc Industrial Appl Math. 1998;1:175–208. [Google Scholar]
- 26.Frigo M, Johnson SG. FFTW: an adaptive software architecture for the FFT. In: Proceedings of the 1998 IEEE International Conference on Acoustics, Speech and Signal Processing, ICASSP ‘98 (Cat. No.98CH36181), Seattle, WA; 1998;3:1381–1384. [Google Scholar]
- 27.Cooley JW, Tukey JW. An algorithm for the machine calculation of complex fourier series. Math Comput. 1965;19:297–301. [Google Scholar]
- 28.Bluestein L A linear filtering approach to the computation of discrete Fourier transform. IEEE Trans Audio Electroacoustics. 1970;18:451–455. [Google Scholar]
- 29.Sonnenburg S, Braun ML, Ong CS, et al. The need for open source software in machine learning. J Mach Learn Res. 2007;8:2443–2466. [Google Scholar]
- 30.Bezanson J, Edelman A, Karpinski S, Shah VB. Julia: a fresh approach to numerical computing. SIAM Rev. 2017;59:65–98. Society for Industrial and Applied Mathematics. [Google Scholar]
- 31.Knopp T, Szwargulski P, Griese F, Grosser M, Boberg M, Moddel M. MPIReco.jl: Julia package for image reconstruction in MPI. Int J Magn Particle Imaging. 2019;5:1–9. [Google Scholar]
- 32.Ong F, Lustig M. SigPy: a python package for high performance iterative reconstruction. In: Proceedings of the International Society of Magnetic Resonance in Medicine, Montréal, QC; 2019:4819. [Google Scholar]
- 33.Uecker M, Lai P, Murphy MJ, Virtue P, et al. ESPIRiT–an eigenvalue approach to autocalibrating parallel MRI: where SENSE meets GRAPPA. Magn Reson Med. 2014;71:990–1001. [DOI] [PMC free article] [PubMed] [Google Scholar]
- 34.Wajer FTAW, Pruessmann KP. Major speedup of reconstruction for sensitivity encoding with arbitrary trajectories. In: Proceedings of the International Society of Magnetic Resonance in Medicine, Glasgow, UK; 2001:767. [Google Scholar]
- 35.Uecker M, Zhang S, Frahm J. Nonlinear inverse reconstruction for real-time MRI of the human heart using undersampled radial FLASH. Magn Reson Med. 2010;63:1456–1462. [DOI] [PubMed] [Google Scholar]
- 36.Ong F, Uecker M, Jiang W, Lustig M. Fast non-Cartesian reconstruction with pruned fast Fourier transform. In: Proceedings of the International Society of Magnetic Resonance in Medicine; 2015:3639. [Google Scholar]
- 37.Lin JM. Python non-uniform fast Fourier transform (PyNUFFT): an accelerated non-Cartesian MRI package on a heterogeneous platform (CPU/GPU). J Imaging. 2018;4:51. [Google Scholar]
- 38.Knoll F, Schwarzl A, Diwoky C, Sodickson DK. gpuNUFFT–an open-source GPU library for 3D gridding with direct Matlab interface. In: In ISMRM 23rd Annual Meeting; 2014:4297. [Google Scholar]
Associated Data
This section collects any data citations, data availability statements, or supplementary materials included in this article.
Supplementary Materials
TABLE S1 Sequence and k-space related parameters of the supplied datasets


