

Abstract
Purpose
The clinical diagnosis of pulmonary involvement in individuals with systemic AL amyloidosis remains challenging. [18F]florbetapir imaging has previously identified AL amyloid deposits in the heart and extra-cardiac organs. The aim of this study is to determine quantitative [18F]florbetapir pulmonary kinetics to identify pulmonary involvement in individuals with systemic AL amyloidosis.
Methods
We prospectively enrolled 58 subjects with biopsy proven AL amyloidosis and 9 control subjects (5 without amyloidosis and 4 with ATTR cardiac amyloidosis). Pulmonary [18F]florbetapir uptake was evaluated visually and quantified as distribution volume of specific binding (Vs) derived from compartmental analysis; and, simpler semi-quantitative metrics of maximum standardized uptake values (SUVmax), retention index (RI), and target-to-blood ratio (TBR).
Results
On visual analysis, pulmonary tracer uptake was absent in most AL subjects (40/58, 69%); 12% (7/58) of AL subjects demonstrated intense bilateral homogeneous tracer uptake. In this group, compared to the control group, Vs (median Vs 30-fold higher, 9.79 vs. 0.26, p < 0.001), TBR (median TBR 12.0 vs. 1.71, p < 0.001), and RI (median RI 0.310 vs. 0.033, p < 0.001) were substantially higher. Notably, the AL group without visually apparent pulmonary [18F]florbetapir uptake also demonstrated a >3-fold higher Vs compared to the control group (median 0.99 vs. 0.26, p<0.001). Vs was independently related to left ventricular SUVmax, a marker of cardiac AL deposition, but not to ejection fraction, a marker of cardiac dysfunction. Also, intense [18F]florbetapir lung uptake was not related to [11C]acetate lung uptake, suggesting intense [18F]florbetapir lung uptake represents AL amyloidosis rather than heart failure.
Conclusions
[18F]florbetapir PET/CT offers the potential to noninvasively identify pulmonary AL amyloidosis and its clinical relevance warrants further study.
Keywords: Systemic light chain amyloidosis, [18F]florbetapir, PET/CT, lung, AL, quantitative
INTRODUCTION
Amyloidosis is a heterogeneous group of disorders that result from misfolding and aggregation of a family of proteins into insoluble β-pleated-sheet structures. In systemic light chain amyloidosis (AL), misfolding of immunoglobulin light chain proteins from a plasma cell dyscrasia results in extensive extracellular deposition of amyloid fibrils, which can lead to dysfunction of the affected organ[1].
Involvement of the lung is common in systemic AL amyloidosis; two post-mortem series reported pulmonary involvement in 90–92% of patients[2,3]. However, the diagnosis of pulmonary amyloidosis is challenging. Clinical symptoms such as dyspnea, exercise intolerance, and cough are non-specific and could be attributed to heart failure. Laboratory testing, pulmonary function testing, diffusion capacity of lungs for carbon monoxide (DLCO) studies or computed tomography of the lungs, though sometimes suggestive, cannot specifically confirm the diagnosis of pulmonary amyloidosis[4],[5]. While histology remains the gold standard, biopsy is generally avoided due to concerns of recurrent pleural effusions and bleeding risk[6]. Consequently, diagnosis of pulmonary AL amyloidosis during life is rare.
Targeted imaging of systemic amyloid deposits using positron emitting radiotracers may address this unmet clinical need. Several amyloid radiotracers which are well-established for imaging beta amyloid in Alzheimer’s disease are emerging as promising tools to evaluate other forms of systemic amyloid deposition [7],[8]. Our group and others have shown that [18F]florbetapir positron emission tomography computed tomography (PET/CT) can identify amyloid deposits in the heart[9] and extra-cardiac organs[10].
Increased lung uptake of [18F]florbetapir could represent specific binding to pulmonary AL amyloid deposits. However, in heart failure, elevated left atrial pressures and slower transit time through the pulmonary vascular bed are known to result in pulmonary accumulation of myocardial perfusion tracers (Thallium-201, Technetium-99m sestamibi and tetrofosmin), [11]–[13] especially on early images[14],[15]. Whether this finding is unique to perfusion tracers or may occur with [18F]florbetapir as well is unclear.
The primary aim of this study was to test our hypothesis that the distribution volume of [18F]florbetapir specific binding in the lungs, evaluated by compartmental modeling, reflects pulmonary AL amyloid deposition in subjects with systemic AL amyloidosis. Because kinetic modeling is impractical outside of research setting, we assessed several simple, clinically relevant semi-quantitative [18F]florbetapir metrics for identifying pulmonary AL amyloidosis. To distinguish pulmonary AL amyloidosis from heart failure related increased lung tracer uptake, we evaluated the clinical correlates of pulmonary [18F]florbetapir uptake and compared lung uptake of [18F]florbetapir to lung uptake of [11C]acetate in a subgroup of subjects.
METHODS
Subject Eligibility and Study Design
This analysis included 67 subjects: 58 subjects in the AL amyloidosis group and 9 subjects in the control group. Fifty-eight subjects with biopsy-proven systemic AL amyloidosis were prospectively recruited for this study, “Molecular Imaging of Primary Amyloid Cardiomyopathy” (ClinicalTrials.gov Identifier: NCT02641145), per predefined inclusion and exclusion criteria (Supplemental Table 1). The control group included 5 subjects without amyloidosis and 4 subjects with cardiac transthyretin (ATTR) amyloidosis enrolled in a prior pilot study of [18F]florbetapir cardiac PET[9]. The study was approved by the institutional Human Research Committee and all subjects provided written informed consent.
Study Protocol
All 58 subjects underwent research [18F]florbetapir PET/CT, cardiac magnetic resonance imaging and clinical echocardiography within a median of 1–2 days of each other. 18 of the 58 subjects underwent [11C]acetate cardiac PET/CT scan within a median of 1 day of the [18F]florbetapir PET/CT scan.
[18F]florbetapir PET/CT
Acqusition
Subjects underwent PET/CT using a GE Discovery DRX imaging system (GE Healthcare, Chicago, IL, USA). This PET/CT scanner was accredited by Intersocietal accreditation commission Nuclear/PET as per American College of Radiology (ACR) guideline and manufacturer requirements to maintain good image quality. System calibration, well-counter cross-calibration, and SUV accuracy (within 5%) were done quarterly.
Following a low-dose CT scan of the heart (120–140 kV, 80 mA), 358±45 MBq of [18F]florbetapir (PETNET, Woburn, MA) was injected and a 60-minute dynamic PET scan of the heart was acquired in three-dimensional list mode. A partial-body PET scan was then obtained from skull base to below the kidneys for 30 minutes with 5 minutes per PET bed position. CT images of the same region were acquired for attenuation correction using a non-contrast technique (10 mA tube current, 140 kVP tube voltage, free tidal breathing). Dynamic cardiac image series were generated by reconstruction of the list-mode data into 47 dynamic frames (20 × 5 s, 8 × 10 s, 6 × 30 s, 4 × 60 s, 8 × 300 s, 1 × 600 s). Static images were reconstructed from 4 minutes to 30 minutes for review of myocardial tracer uptake. Images were reconstructed onto a 128 × 128 matrix (4.09 × 4.09 × 3.27 mm3 voxel size) by ordered subsets expectation maximization (OSEM) with two iterations, 21 subsets, and 4.48 mm full-width at half-maximum Gaussian post-filter. All scans were corrected for decay, scatter, random coincidences and photon attenuation.
Analysis
Lung:
Visually, [18F]florbetapir uptake was assessed from the static partial-body images, and static cardiac images, and categorized as no uptake, mild diffuse uptake or intense diffuse uptake. Subjects with minimal uptake limited to the dependent portions of the lungs, typically in the posterior bases of the lungs, and otherwise no tracer uptake in the rest of the lungs were categorized as no uptake.
Kinetic modelling:
For kinetic modelling, compartmental analyses were performed using PMOD version 3.805 (PMOD Technologies LLC., Zurich, Switzerland). The lung was manually segmented, in a slice-by-slice manner from the apex to base. Care was taken to exclude the major airways, pulmonary vessels and the liver, which typically had intense tracer uptake as the radiotracer was excreted via the hepatobiliary system. Tracer activity concentration was corrected for density using CT data, i.e., activity concentration in kBq/ml was converted to kBq/g. This was done to remove the confounding effect of any physiological or pathological process that might increase the amount of lung tissue in a given volume, such as atelectasis or collapse, which would lead to higher tracer activity in the given volume not attributable to actual tracer uptake by the tissue. A spherical VOI of 3 mm radius in the pulmonary artery below the bifurcation was defined as the blood pool and used as the input function. Several models were tested on a subset of subjects (i.e., 3 subjects from each group). Models included 1-tissue-2-kinetic-parameter compartment model (1T2k), 2T4k, 3T6k, all with fitted blood volume fraction, and Logan plot. The 2T4K model was selected as the best model based on the lowest Akaike information criteria (AIC) scores and was then used for compartmental analysis for all subjects on the dynamic PET data using PMOD. The outcome measure for the model was distribution volume of specific binding (Vs =K1/k2*k3/k4). Normal kinetic parameters were derived from the control cohort (n=9).
Semiquantitative metrics:
We also evaluated pulmonary [18F]florbetapir uptake semi-quantitatively using maximum standardized uptake values (SUVmax), retention index (RI) and target-to-blood ratio (TBR). TBR and RI were corrected for lung density while SUVmax was not. From the dynamic images, we obtained the RI of the whole lungs from 10 to 30 minutes after radiotracer injection using PMOD. The same VOIs of the whole lungs and blood pool were also used to obtain TBR from the reconstructed dynamic images from 50 to 60 minutes after radiotracer injection.
We determined the average SUVmax of the lungs from the static partial-body images by averaging the SUVmax within four spherical volumes of 1 cm radius over the lungs on the delayed partial-body PET/CT images, two at the level of the aortic arch to represent the upper lobes in each lung and two at the level of the left atrium to represent the lower lobes. An additional spherical volume of interest (VOI) was drawn over a pleural effusion if present. This analysis could not be performed in the control cohort as static images at a comparable time point (60 to 90 minute) were not available. For the purpose of comparison to [11C]acetate PET/CT, the average SUVmax values of the lungs were derived from images acquired from 2 to 6 minutes post radiotracer injection.
Normalized [18F]florbetapir time activity curves were generated from the dynamic images by standardizing the measured activity in MBq/cc to an injected dose of 300MBq (unit: MBq/cc/300MBq).
Heart:
We evaluated [18F]florbetapir uptake in the left ventricle using SUVmax within the left ventricular myocardium and global RI from 10 to 30 minutes with Carimas 2.9 (Turku PET centre, Finland) as described previously[16]. Image-derived input function was defined by the blood pool within the left atrium. The right ventricle was assessed visually for presence or absence of tracer uptake.
Other organs:
Images were assessed for tracer uptake in the following organs: parotid, tongue, thyroid, pancreas, spleen, kidney, muscle, subcutaneous fat and humeral head bone marrow as described before. The organ was deemed to be involved if its SUVmax exceeded 2.5 [10].
CT Methods
All CT images were evaluated for pleural effusion and CT features suggestive of pulmonary amyloidosis. The whole lung was manually segmented as described above. The average density was approximated by: Density [g/cm3] = 1 + HU/1000 [17]
The diameter of the main pulmonary artery (PA) and ascending aorta were measured on a transaxial slice at the level of the PA bifurcation and the PA to ascending aorta ratio was calculated.
[11C]acetate PET/CT
Following a CT scout and a low-dose CT scan of the heart (120–140 kV, 80 mA), 609±146 MBq of [11C]acetate was injected intravenously and a 30-minute dynamic PET scan of the heart was acquired in three-dimensional list mode. Images were reconstructed into static myocardial perfusion images (2–6 minutes) and SUVmax was estimated as described in the above section on lung/semiquantitative metrics/average SUVmax.
Echocardiography Methods
2D echocardiography with spectral and color Doppler imaging was performed in all subjects according to standard American Society of Echocardiography recommendations[18]. Tricuspid regurgitation pressure and peak velocity were measured to estimate the pulmonary artery systolic pressure (PASP) using the modified Bernoulli equation. Elevated PASP was defined as > 36mm Hg[19].
Cardiac Magnetic Resonance Imaging (CMR) Methods
All CMR images were acquired on a 3.0-T system (Tim Trio, Siemens, Erlangen, Germany), with electrocardiographic gating and breath holding. The protocol consisted of steady-state free-precession cine imaging for assessing ventricular function and morphology. Gadolinium contrast was used. A commercial software package (Medis Suite 3.0 Medical Imaging Systems, Leiden, the Netherlands) was used to post-process and quantify left and right ventricular end diastolic volume (EDV), end systolic volume (ESV), stroke volume (SV), ejection fraction (EF) and right ventricular wall thickness. Abnormal left ventricular (LV) EF was defined as described previously: < 56% for males and < 58% for females[20]. Abnormal right ventricular (RV) EF was defined as described previously: < 48% for males and < 50% for females[21]. Abnormal RV wall thickness was defined as > 5 mm[22].
Six-minute walk test
Subjects performed a six-minute walk test using a standardized protocol adapted from the American Thoracic Society guidelines; the subject walked on a level surface at a self-governed pace for six minutes, and the total distance travelled was measured.
Statistical analysis
Statistical analyses were performed using SPSS version 20.0.0 (IBM Corp., Armonk, NY). To investigate demographic and clinical data, χ2 tests for discrete variables and Student’s t-tests for continuous data were used. Results of non-normally distributed variables were reported as medians with inter-quartile range (IQR). Differences were compared using the Mann–Whitney U test for 2 groups of continuous variables and the Kruskal–Wallis test for 3 groups of continuous variables. Spearman’s rank correlation was used to determine the association between two non-normally distributed continuous variables. We evaluated several categorical parameters that could affect pulmonary [18F]florbetapir tracer kinetics including pulmonary parenchymal changes and pleural effusions, circulating light chain pathology (active vs. remission status of AL disease), left and right ventricular function, amyloid burden in both ventricles and systemic organ involvement. Univariable correlates of Vs were determined. Significant univariable correlates were included in a multivariable linear regression model to determine the independent predictors of Vs. A 2-tailed p-value of less than 0.05 was considered significant.
RESULTS
Baseline characteristics.
Demographics and clinical characteristics of the 58 subjects included in this analysis are listed in Table 1. Forty-two subjects had active AL amyloidosis and abnormal serum free light chain levels (32 with and 10 without cardiac involvement). Sixteen subjects had AL amyloidosis with cardiac involvement in hematologic remission with normal serum free light chain levels for at least one-year post treatment (remission-AL).
Table 1.
Baseline Characteristics
| Characteristics | 18F-florbetapir lung uptake present (n = 18) | 18F-florbetapir lung uptake absent (n = 40) | p-value |
|---|---|---|---|
| Age (years)a | 62 ± 7 | 61 ± 7 | 0.973 |
| Gender | |||
| Male | 67% | 60% | 0.772 |
| Monoclonal light-chain isotype | |||
| κ (mg/L) | 15.2 (1.9–1716.0) | 15.1 (2.2–704.6) | 0.593 |
| λ (mg/L) | 196.2 (3.8–1640.0) | 44.3 (1.3–921.6) | 0.101 |
| κ/ λ ratio | 0.12 (0.01–228.80) | 0.40 (0.01–56.65) | 0.112 |
| NT-proBNP (pg/mL) | 4350 (146–15116) | 1248 (44–48412) | 0.022 |
| Troponin (ng/mL) | 0.09 (0–248.0) | 0.01 (0–247) | 0.022 |
| PA diameter (cm)a | 2.9 ± 0.3 | 2.8 ± 0.3 | 0.167 |
| PA/aorta ratioa | 0.90 ± 0.13 | 0.85 ± 0.09 | 0.064 |
| 6-minute walk test (meters)a | 427 ± 101 | 411 ± 96 | 0.604 |
Values given as median (range) unless otherwise stated
Values given as mean ± standard deviation
NT-proBNP = N-terminal pro b-type natriuretic peptide. PA = pulmonary artery.
Pulmonary parenchymal changes.
Most of the lung findings in this study (visual, quantitative and semi-quantitative) were bilateral, without appreciable unilateral differences.
Visual evaluation
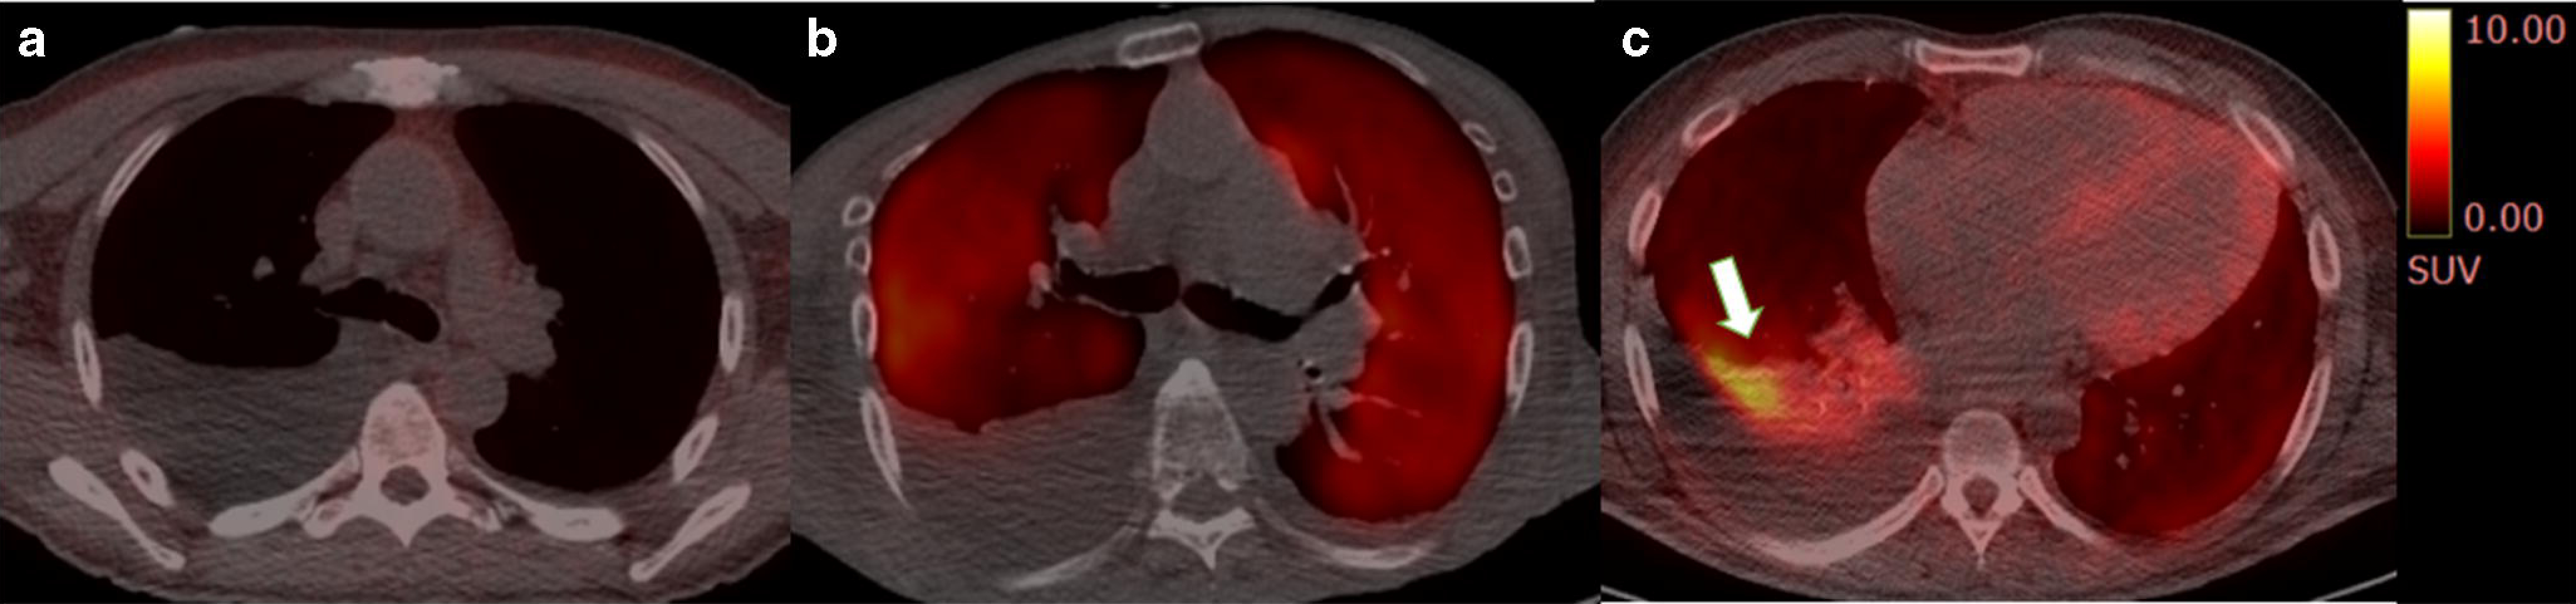
On visual evaluation, we noted intense diffuse lung uptake of tracer in 12% (n=7), while most of the remaining subjects showed mild diffuse uptake (n=11, 19%) or no significant uptake (n=40, 69%), including two subjects with minimal uptake in the dependent areas of the lungs (Fig 1a–c). None of the subjects showed any specific lung CT findings suggestive of amyloid deposits. Non-specific patchy or diffuse ground glass opacity was seen in 9/18 (50%) on CT, but the average lung densities did not differ among the three patterns of [18F]florbetapir uptake in the lungs as well as the control and ATTR subjects (Fig 1d).
Fig 1. Evaluation of [18F]florbetapir lung uptake and CT lung density values.
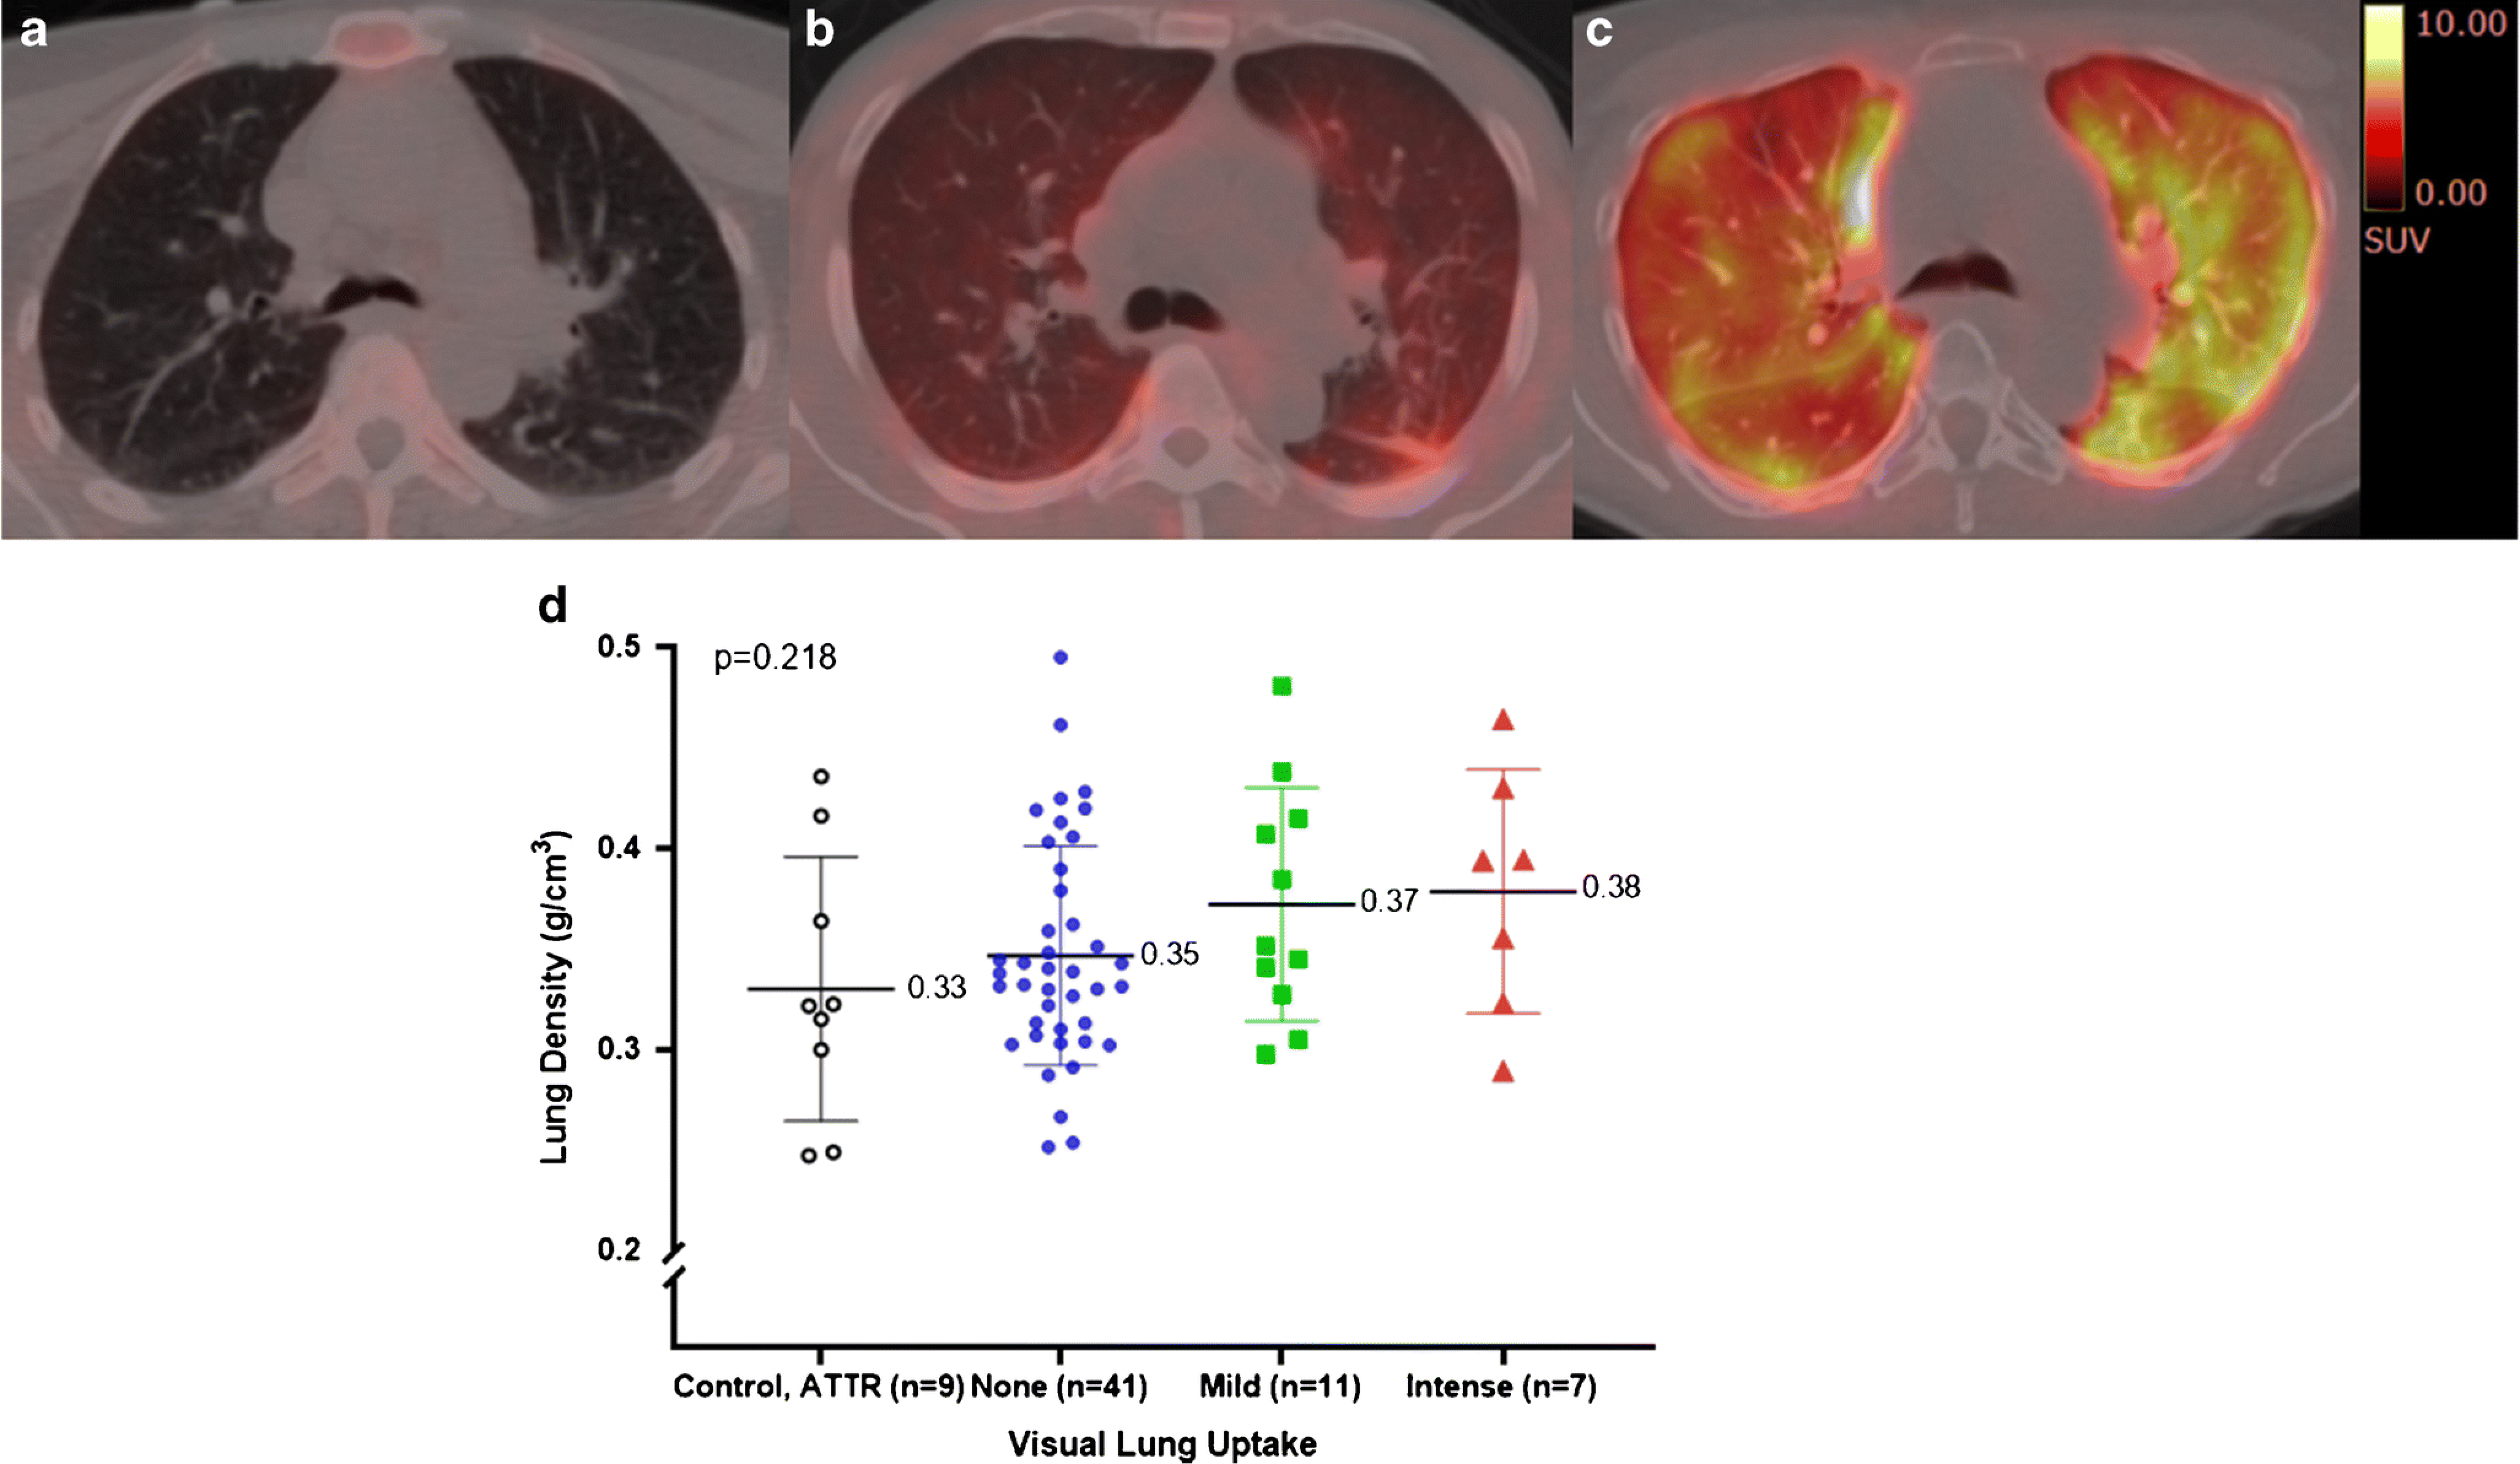
Axial fused [18F]florbetapir PET/CT delayed images (Top, a-c) from three subjects with no significant uptake (a), diffuse mild uptake (b) and diffuse intense uptake (c). Their left ventricular ejection fractions were 47%, 36% and 62% respectively. CT appearance of the lung parenchyma was unremarkable in these subjects.
CT average lung densities did not differ among subjects with no significant uptake, mild diffuse uptake, intense homogeneous uptake and the control group (bottom, d). The mean and standard deviation are shown. Each marker corresponds with a single subject
In the subjects with active AL amyloidosis, the majority (61.9%, 26/42) showed no lung uptake of [18F]florbetapir; the remaining demonstrated mild (19%, 11/42) or intense (8.6%, 5/42) lung uptake of [18F]florbetapir. In the remission-AL group, while the majority (84%, 14/16) showed no lung uptake, a small percentage of subjects showed intense uptake (12%, 2/16).
Quantitative Evaluation
Mean time activity curves of normalized [18F]florbetapir activity in the lungs differed significantly among the three patterns of lung uptake and was lowest in the control group (Fig 2). On compartmental modelling, [18F]florbetapir pulmonary Vs was highest in the subjects with intense [18F]florbetapir lung uptake (median 9.788, IQR 4.796–14.500, 30-fold higher than control group Vs) and lowest in the control group (Fig 3a). Notably, even among AL amyloidosis subjects without pulmonary [18F]florbetapir uptake, median [18F]florbetapir pulmonary Vs was more than three-fold higher than in the control group (median 0.994, IQR 0.483–1.693 vs. 0.262, IQR 0.098–0.380, p<0.001). Among these 9 control subjects, LVEF was < 50% in three subjects, > 50% in three subjects and unavailable in the remaining three subjects.
Fig 2. [18F]Florbetapir time–activity curves in the lungs.
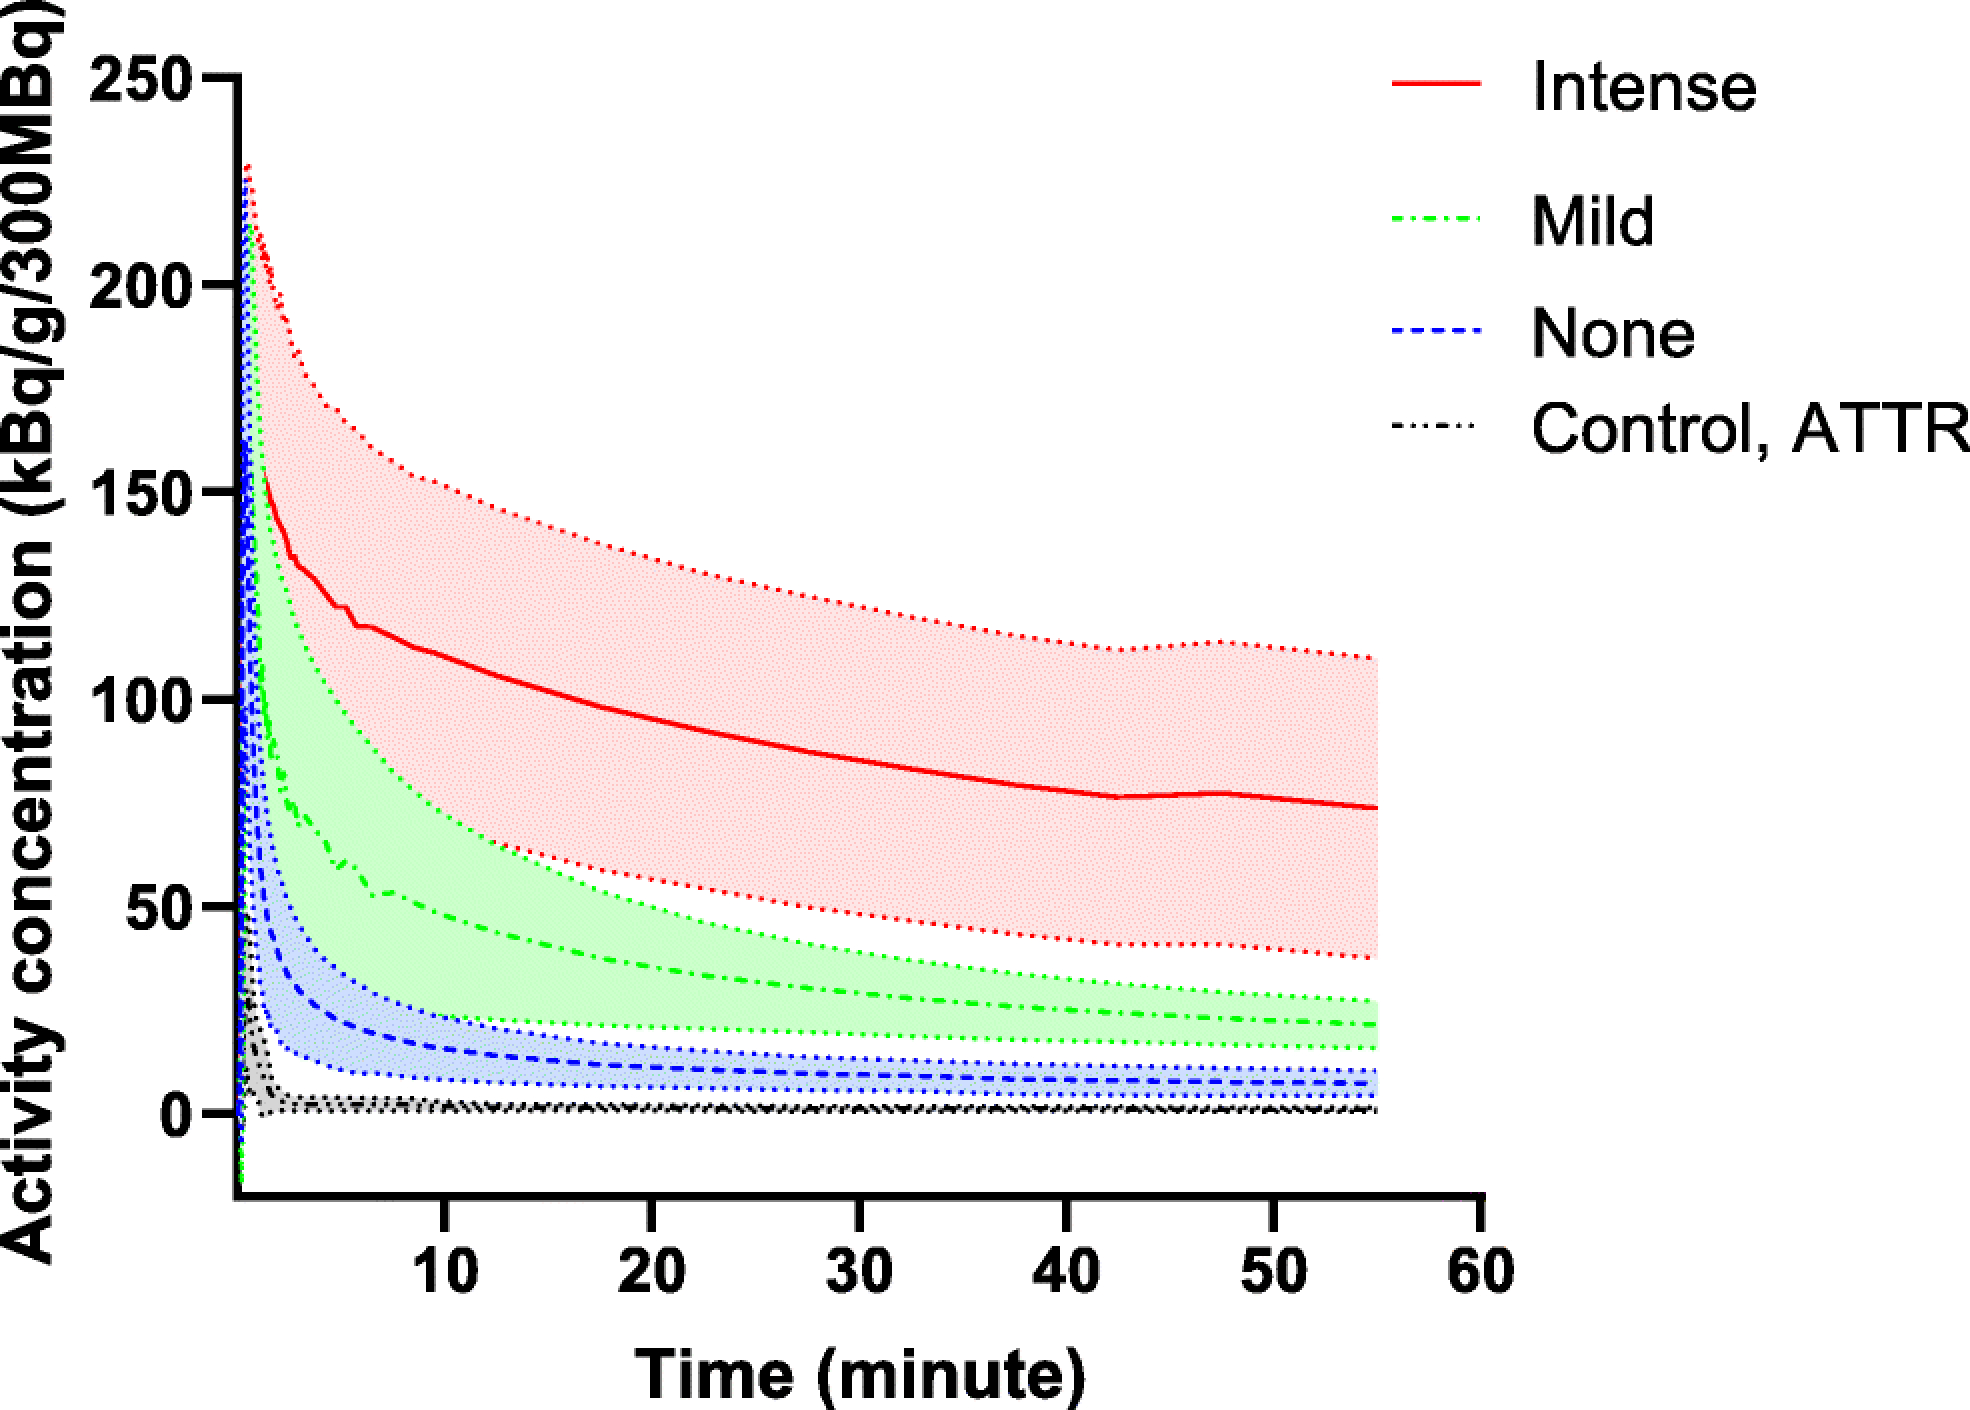
The rate of [18F]florbetapir tracer washout was slowest in subjects with intense uptake and fastest in the control subjects. Shaded area represents standard deviation
Fig 3. Quantitative metrics of [18F]florbetapir stratified by visual lung uptake.
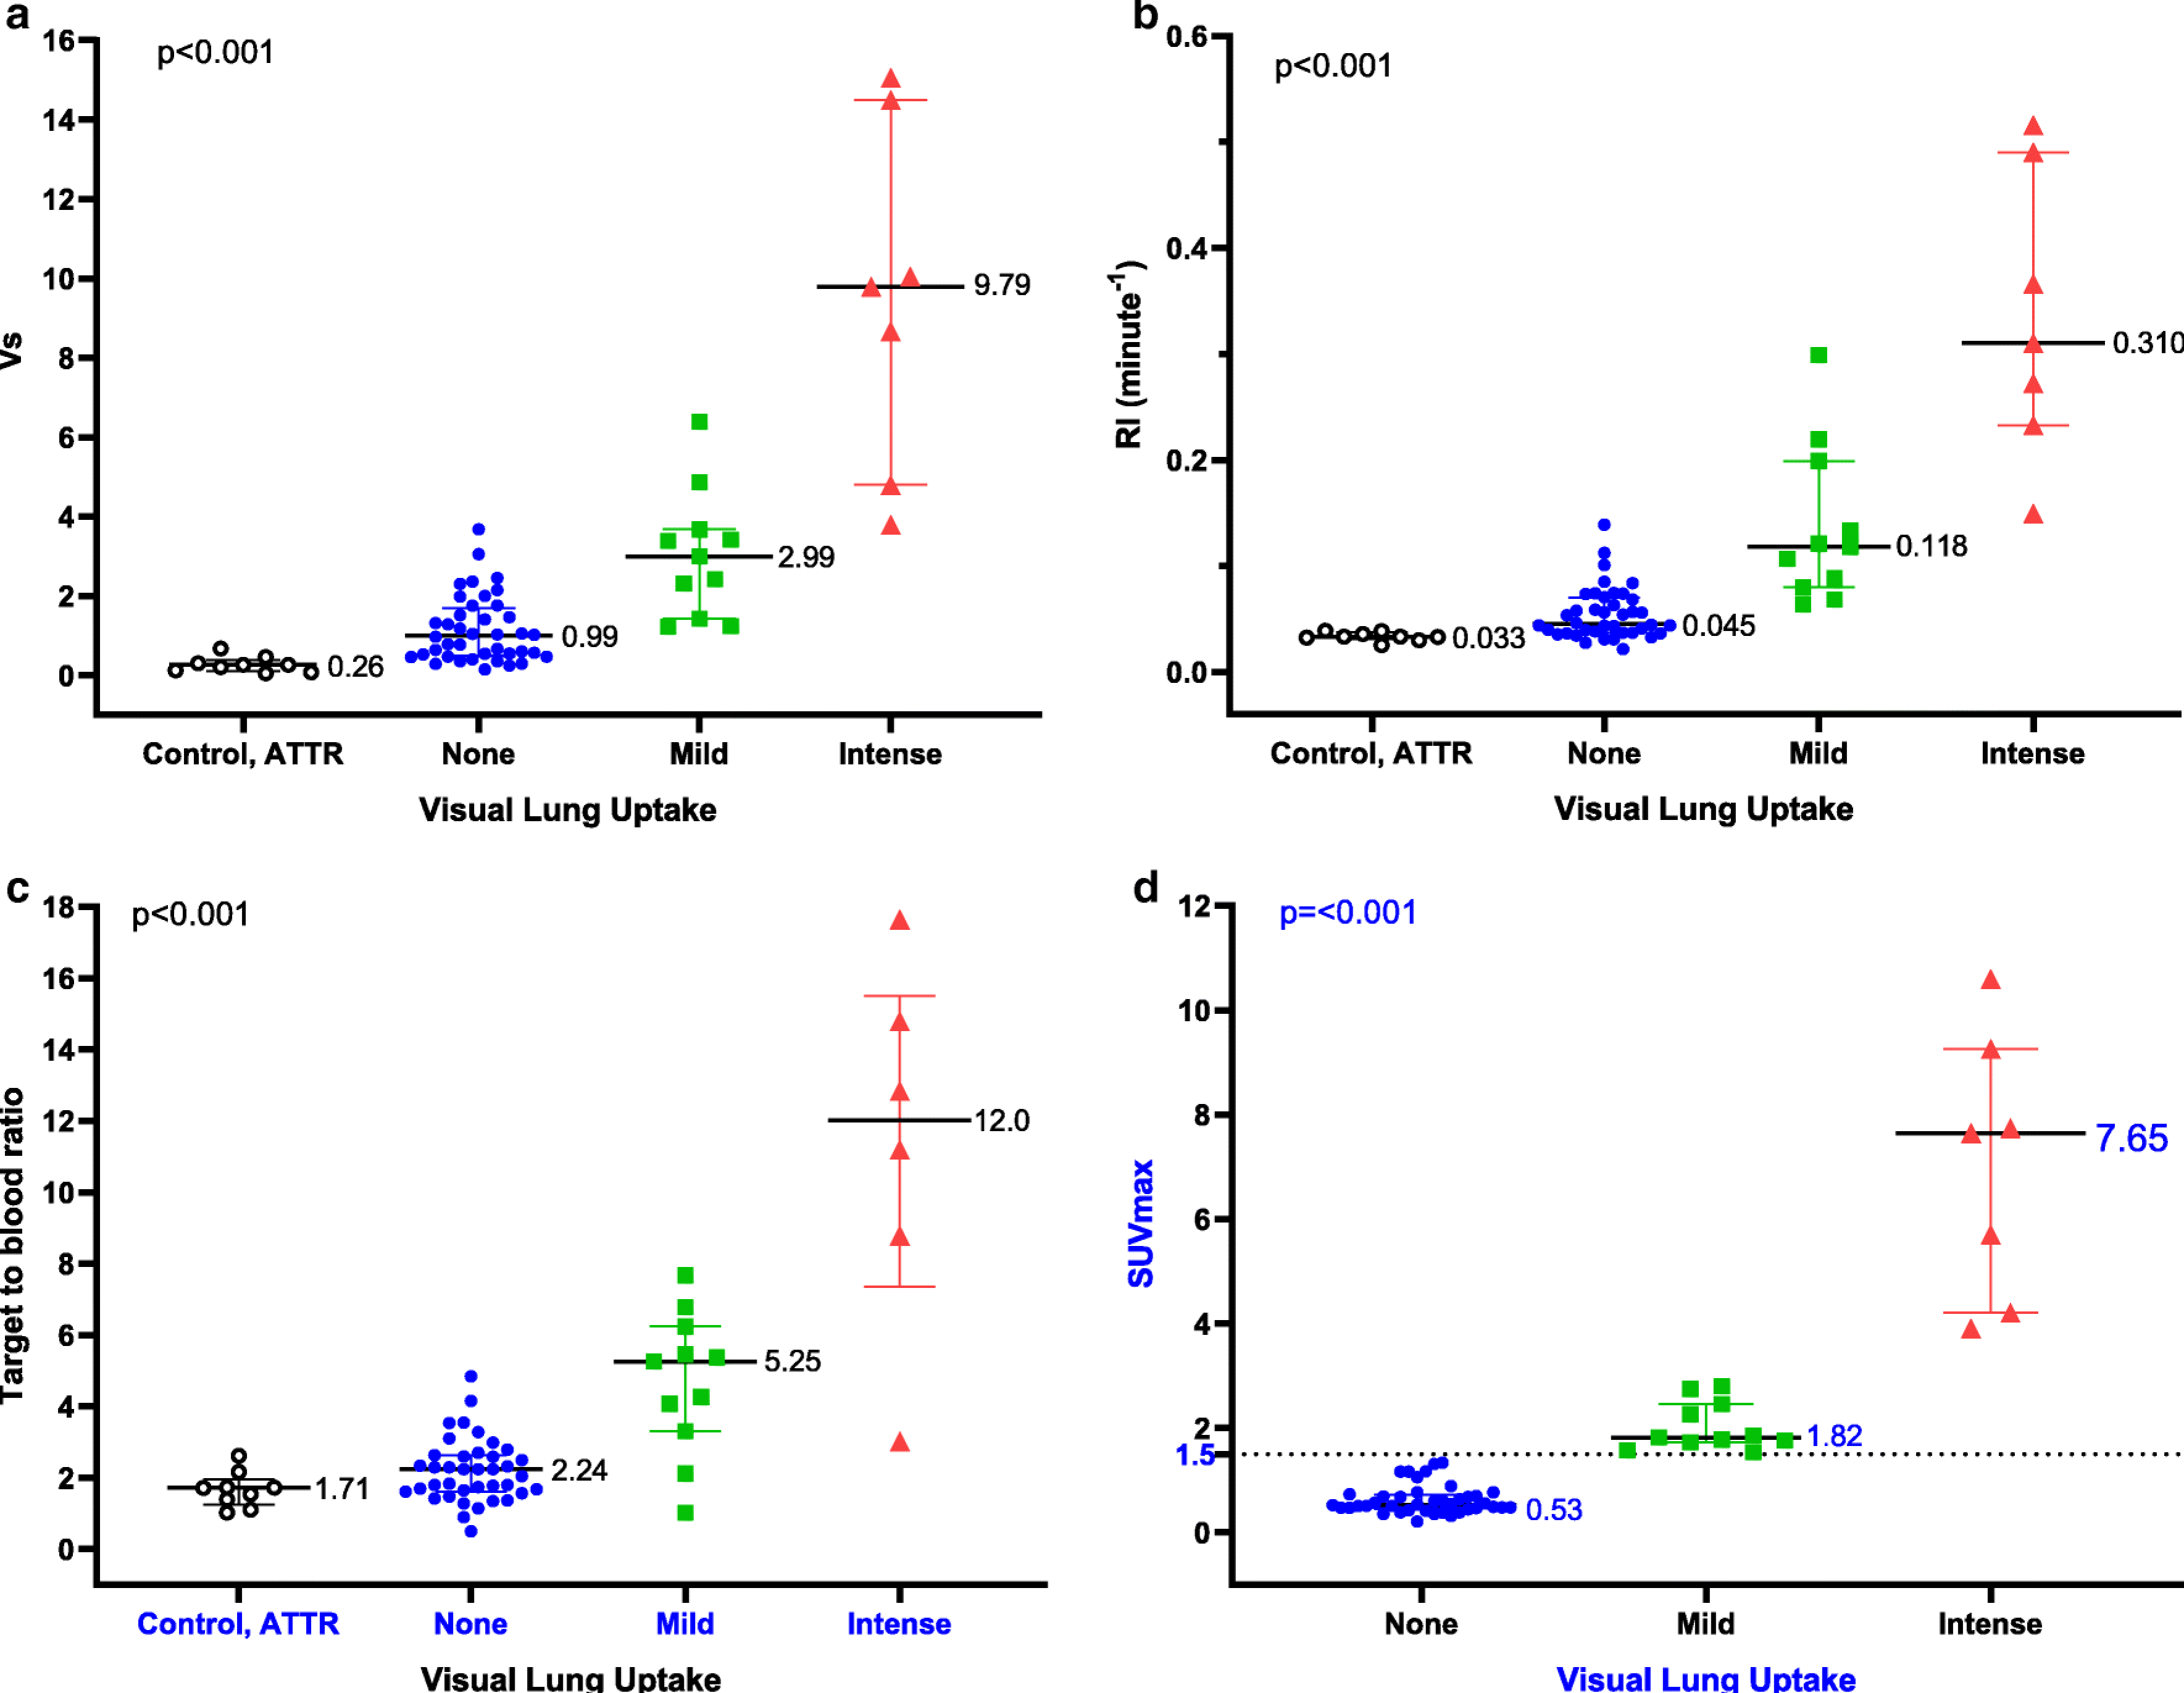
Median Vs of subjects from the control group (5 subjects without amyloidosis and 4 subjects with ATTR amyloidosis) was more than three-fold lower than AL amyloidosis subjects (a). RI (b), TBR (c) and SUVmax (d) were the highest in subjects with intense tracer uptake, followed by subjects with mild and no uptake. The control and ATTR subjects demonstrated the lowest TBR and RI. A SUVmax value of 1.5 distinguished subjects with and without lung uptake. The median and interquartile range are shown. Each marker corresponds with a single subject
Semiquantitative Evaluation
Estimation of lung Vs requires dynamic imaging and compartmental modelling and is therefore not suitable for routine clinical use. For this reason, we evaluated three simpler metrics of [18F]florbetapir lung uptake—SUVmax, TBR and RI. Measurement of SUVmax could not be performed on the control and ATTR subjects as static images at a comparable time point (60 to 90 minute) were not available. All three simplified quantitative metrics of [18F]florbetapir lung uptake were highest in subjects with intense lung uptake, followed by those with mild uptake and then no uptake. The control and ATTR subjects demonstrated the lowest TBR and RI (Fig 3b to d). A SUVmax threshold value of 1.5 perfectly classified subjects with and without [18F]florbetapir lung uptake. Vs was highly correlated with SUVmax, RI and TBR, with the strongest relationship to RI (Fig 4a to c).
Fig 4. Simplified quantitative metrics of [18F]florbetapir in the lungs and their correlation with outcome of kinetic modelling.
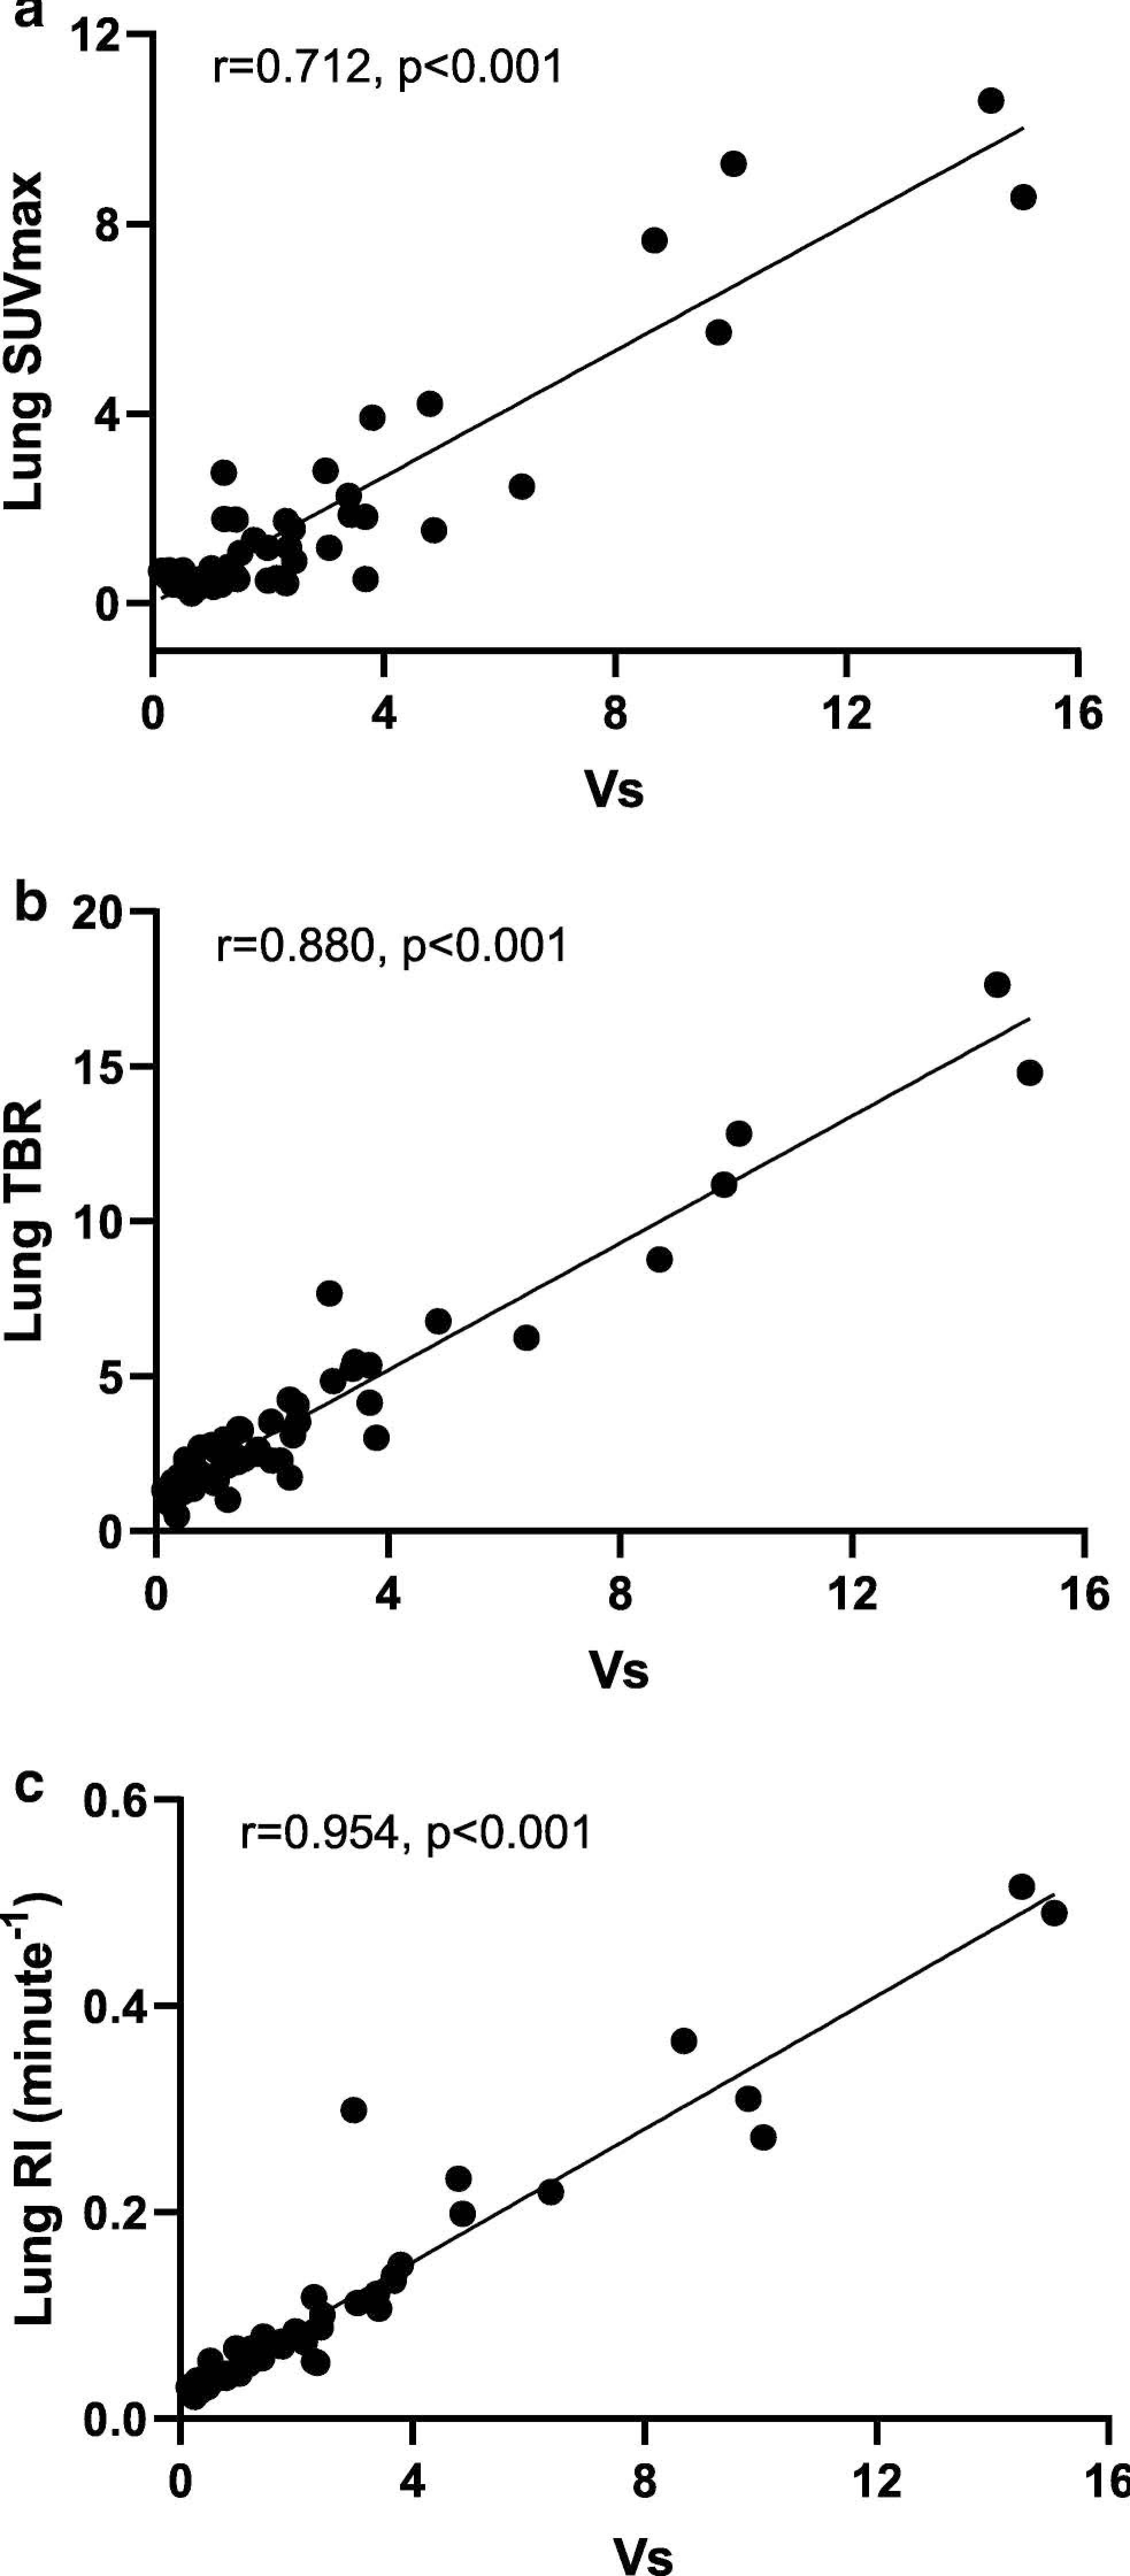
SUVmax, target to blood ratio and RI were strongly correlated with Vs
Pleural effusions.
Forty percent of the study subjects (n=23) had pleural effusion on at least one side, ranging in size from minimal to large. Clinical and laboratory differences in subjects with and without pleural effusion are shown in Supplemental Table 2. Notably, the effusions showed no significant tracer uptake with mean SUVmax of 0.84±0.43. No significant tracer uptake or tracer-avid nodularity was detected along the pleura in any subjects. Pleural effusion was only seen in subjects with cardiac AL amyloidosis (48% vs. 0%, p=0.004). Visual [18F]florbetapir lung uptake was more prevalent in subjects with compared to without pleural effusion (52% vs. 23%, p=0.027) (Fig 5a, b). However, Vs, SUVmax, TBR and RI of [18F]florbetapir in the lungs were not significantly different between subjects with and without pleural effusion. Moderate to intense tracer uptake adjacent to the pleural effusion was seen in 6 subjects, likely attributable to accumulation of tracer uptake within the atelectatic or collapsed lung (Fig 5c).
Fig 5. [18F]florbetapir imaging in AL amyloidosis and pleural effusion.
Axial fused [18F]florbetapir PET/CT images from three subjects with right pleural effusion showed no significant pulmonary parenchymal uptake (a), homogeneous intense uptake in the lungs (b) and intense tracer uptake in the collapsed lung anterior to the pleural effusion on the background of diffuse intense tracer uptake in the lung parenchyma (c)
Distinguishing pulmonary AL amyloidosis from heart failure related lung tracer uptake.
Univariable predictors of Vs, the distribution volume of specific binding, of [18F]florbetapir in the lungs.
We evaluated the distribution volume of specific binding of [18F]florbetapir in the lungs based on the subjects’ LV and RV structure and function, LV and RV amyloid content, systemic organ involvement and circulating light chain pathology. Certain parameters of amyloid load, such as LV SUVmax (r=0.517, p<0.001), RV uptake (0.321, p = 0.025) and log Troponin-T (0.279, p =0.045), correlated with Vs. However, parameters of cardiac function (LVEF, RVEF, RV wall thickness, estimated PASP) or wall stress (NT proBNP) did not correlate with Vs. Serum free light chain levels were not also related to Vs. Median Vs was similar between subjects with normal and abnormal values of LVEF, RVEF, estimated PASP, RV wall thickness, in the active AL vs. remission group and between subjects with AL amyloid involvement of ≥ 3 or < 3 extra-thoracic organs (Table 2).
Table 2.
Summary of univariable predictors of distribution volume of specific binding (Vs).
| Variable | Distribution volume of specific binding (Vs) | p-value |
|---|---|---|
| LVEF | ||
| Normal | 1.12 (0.44–2.43) | 0.103 |
| Abnormal | 1.76 (1.04–3.55) | |
| RVEF | ||
| Normal | 1.12 (0.53–2.59) | 0.199 |
| Abnormal | 1.75 (0.91–3.55) | |
| PASP | ||
| Normal | 1.26 (0.56–2.34) | >0.99 |
| Abnormal | 2.00 (0.27–6.72) | |
| RV wall thickness | ||
| Normal | 1.24 (0.58–2.72) | 0.732 |
| Abnormal | 1.41 (0.46–3.80) | |
| Systemic AL status | ||
| In remission | 1.46 (0.61–2.27) | 0.857 |
| Active | 1.30 (0.56–3.40) | |
| Extra-thoracic organ involvement | ||
| Less than 3 | 1.29 (0.57–2.43) | 0.327 |
| ≥3 | 1.43 (0.64–3.80) | |
Values given as median (range). LV=left ventricle, EF=ejection fraction, RV=right ventricle, PASP=pulmonary artery systolic pressure, AL=light chain amyloidosis
Independent predictors of Vs, the distribution volume of specific binding of [18F]florbetapir in the lungs
We performed multiple linear regression analysis to determine independent determinants of Vs. The model included significant univariable parameters, log LV SUVmax, RV uptake, log troponin T, as well as the parameter of interest, namely LVEF. This model significantly predicted Vs (F=3.978, r=0.570, p=0.010). However, log LV SUVmax was the only significant predictor of lung Vs (Table 3).
Table 3.
Summary of multiple linear regression analysis for variables predicting Vs.
| Beta | 95% CI Lower Bound | p-value | |
|---|---|---|---|
| Log Troponin T | 0.191 | −0.048–0.197 | 0.226 |
| RV Uptake (present or absent) | −0.148 | −0.269–0.133 | 0.495 |
| LVEF % | −0.078 | −0.022–0.014 | 0.635 |
| Log LV SUVmax | 0.582 | 0.243–1.564 | 0.009 |
Model R=0.570, F=3.978, p=0.010. β=standardized beta coefficient, RV=right ventricular, EF=ejection fraction, LV=left ventricular, RI=retention index; SUV = standardized uptake value; NT pro BNP = N terminal pro brain natriuretic peptide.
Comparing lung uptake of [ 11C]acetate to [18F]florbetapir
To further discriminate lung AL amyloidosis from heart failure (high filling pressures and/or slow pulmonary transit of radiotracer), we analyzed a subset of 18 subjects who underwent [11C]acetate and [18F]florbetapir scans (56% same day studies, median 1 day apart). Visually, none of the 18 subjects had intense [11C]acetate lung uptake, despite four of them showing intense [18F]florbetapir lung uptake suggesting lung amyloidosis (Fig 6). SUVmax of [11C]acetate lung uptake in these four subjects was indistinguishable from the subjects with no [18F]florbetapir lung uptake (1.1, IQR 0.8–1.7, vs. 1.4, IQR 0.8–1.6, p=0.959, Fig 7). The discordant finding of minimal [11C]acetate lung uptake in subjects with intense [18F]florbetapir lung uptake further supports the notion that intense lung uptake of [18F]florbetapir likely represents lung amyloidosis.
Fig 6. Discordant uptake of [11C]acetate and [18F]florbetapir in the lungs.
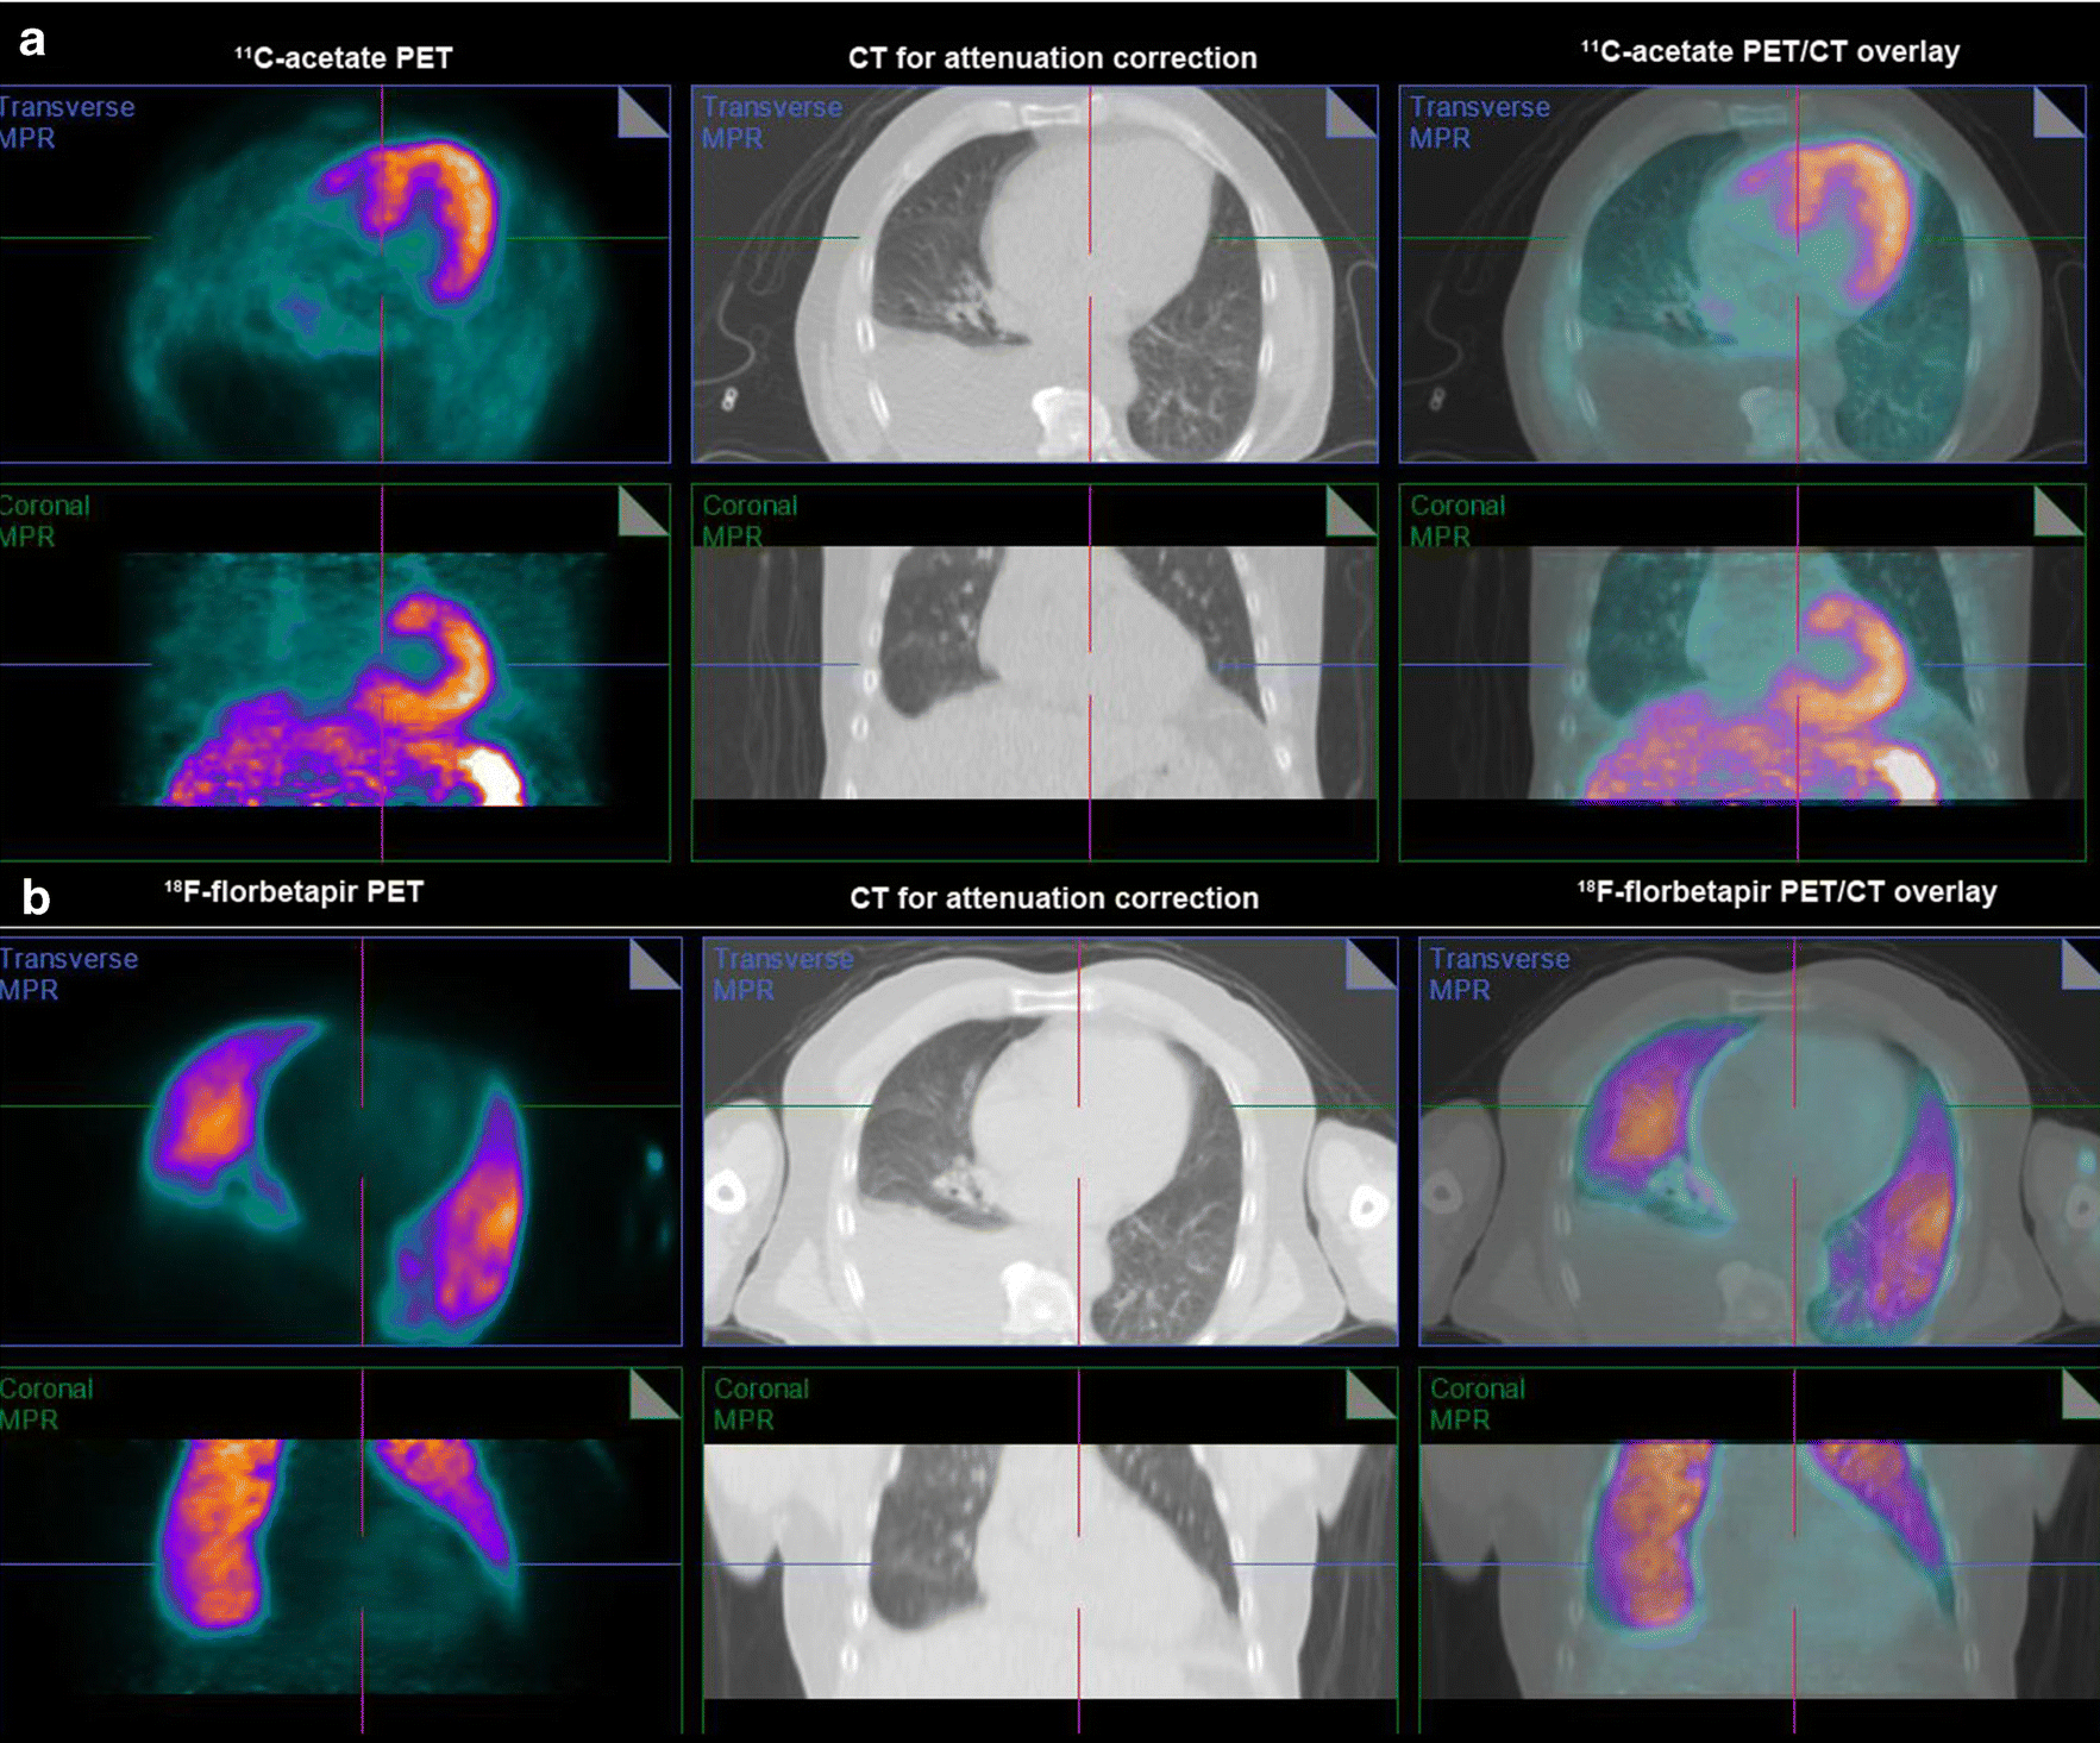
Early (2–6 minutes after injection of radiotracer) axial and coronal images in one subject showed minimal lung uptake of [11C]acetate (Fig 6a) despite intense lung uptake of [18F]florbetapir (Fig 6b). We propose that this discordant finding combined with high [18F]florbetapir Vs, the distribution volume of [18F]florbetapir specific binding in the lungs derived from compartmental modelling, suggests pulmonary AL amyloidosis
Fig 7. SUVmax values of [11C]acetate PET/CT and [18F]florbetapir PET/CT.
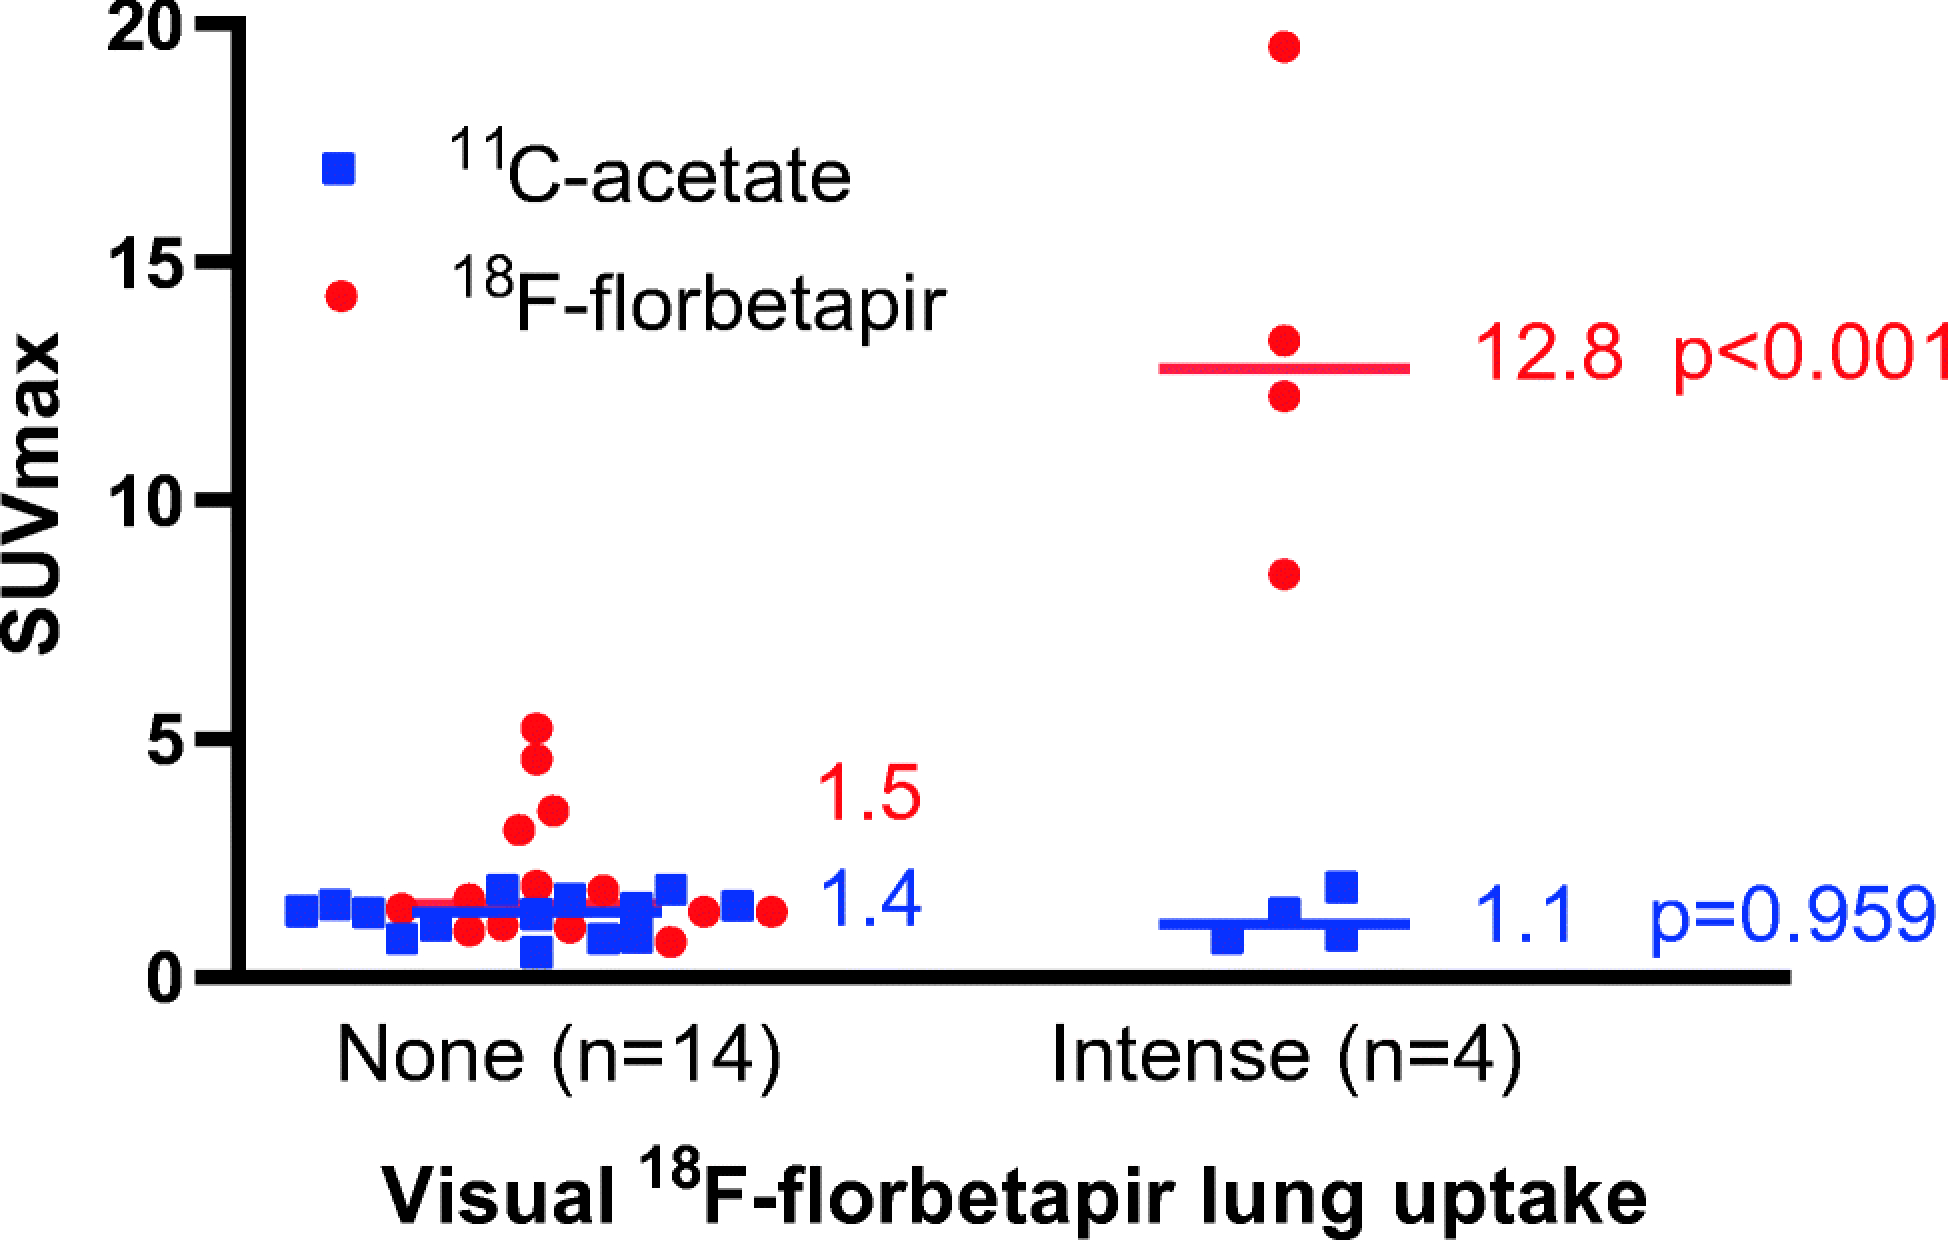
On the early images (2–6 minutes after injection of radiotracer), subjects with intense visual lung uptake of [18F]florbetapir had significantly higher [18F]florbetapir SUVmax values than subjects with no uptake (1.5, IQR 1.1–3.2, vs 12.8, IQR 9.4–18.0, p<0.001) but the median [11C]acetate SUVmax of the lungs were similar in all subjects (1.1, IQR 0.8–1.7, vs. 1.4, IQR 0.8–1.6, p=0.959), suggesting pulmonary AL amyloidosis. The median is shown. Each marker corresponds with a single subject
DISCUSSION
To our knowledge, our study is the first study to date to prospectively evaluate for pulmonary AL amyloidosis using [18F]florbetapir PET/CT. In this study of 58 subjects with systemic AL amyloidosis and 10 control subjects, our findings show that pulmonary [18F]florbetapir Vs, the distribution volume of [18F]florbetapir specific binding in the lungs, derived from compartmental modelling, is substantially higher (3–30 fold) in subjects with AL amyloidosis compared to the control subjects, suggesting specific binding to AL lung deposits. Vs was strongly correlated with lung SUVmax and TBR, which were measured late (50–90 minutes post injection of [18F]florbetapir). Notably, Vs was independently related to LV SUVmax, a marker of cardiac AL deposition, and not to LVEF, a marker of cardiac dysfunction. Furthermore, on early phase images, increased lung uptake of [11C]acetate might have suggested heart failure; but none of the subjects with intense [18F]florbetapir lung uptake showed increased [11C]acetate lung uptake. Together, these findings support our hypothesis that intense [18F]florbetapir lung uptake reflects binding to pulmonary amyloid deposits rather than heart failure related lung tracer uptake. Importantly, our results show that simpler metrics of SUVmax, TBR, and RI are reliable measures for assessment of AL lung involvement in clinical practice.
Three forms of amyloidosis can be found in the lung: nodular pulmonary amyloidosis, diffuse alveolar-septal amyloidosis and tracheobronchial amyloidosis. The form that is most commonly associated with systemic AL amyloidosis is diffuse alveolar-septal amyloidosis, which typically involves all lobes and is characterised by the presence of amyloid deposits in the interstitium within the alveolar septa and vessel walls[23]. The PET/CT appearance of homogeneous [18F]florbetapir uptake in the lung parenchyma in our subjects most closely reflects this histopathology. None of the subjects demonstrated tracer-avid nodules in the lung parenchyma or airways which, if present, would have suggested the nodular and tracheobronchial forms of amyloidosis.
We found that 21% of subjects with AL cardiac amyloidosis (either active or in remission) showed diffuse mild [18F]florbetapir tracer uptake in the lungs and 15% showed diffuse intense tracer uptake. These findings are consistent with those of an autopsy series from Johns Hopkins Hospital, in which 24% of patients with cardiac amyloidosis were found to have moderate amyloid involvement of the alveolar septa and/or pulmonary vessels and 13% had severe amyloid involvement[24]. Together, these findings imply that presence of visually apparent pulmonary [18F]florbetapir uptake in subjects with systemic AL amyloidosis indicates moderate to severe amyloid involvement in the lungs.
The prevalence of pleural effusions in our study subjects (40%) is higher than previously reported by Berk et al (6–18%)[25]. This difference can be explained by the selective enrolment of subjects with cardiac involvement in our study compared to that cohort. We did not detect tracer-avid pleural nodularity in any subject with effusion, either because none of the subjects had amyloid infiltration of the pleura or because the pleural amyloid nodules were too small for detection by PET.
Until now pulmonary amyloidosis could not be diagnosed pre-mortem, hence its clinical significance has not been established. Based on several studies [2],[26]–[28], it is generally believed to be rarely symptomatic and of little clinical consequence, however, some studies have implied the opposite. In a 20-year review at Boston Medial Centre of 76 patients with biopsy-proven pulmonary amyloidosis, 71% had abnormal pulmonary function test results, and approximately half demonstrated restrictive pattern[29]. A study by Mayo clinic with complete survival data of patients with biopsy-proven pulmonary amyloidosis reported poor long-term outcome, with a median survival after diagnosis of 16 months[30]. These findings imply a wide spectrum of disease manifestation, ranging from asymptomatic to life-threatening. Importantly, failure to recognize a co-existing lung pathology in patients with cardiac amyloidosis may lead to futile heart-targeted therapy, such as over-diuresis, which can be dangerous. Non-invasive detection of pulmonary amyloidosis, now available for the first time using [18F]florbetapir PET/CT, will likely advance our understanding of this disease and improve management.
All the metrics used to evaluate pulmonary uptake of [18F]florbetapir performed well. We find that measurement of SUVmax of the lungs is a fast, simple and reliable method of quantifying pulmonary uptake of [18F]florbetapir. It is comparable to the more complex and time-consuming metric of Vs which requires long scanning time in dynamic mode and knowledge of kinetic modelling.
Other PET radiotracers had also been evaluated for diagnosis of systemic amyloidosis; for example, 2-deoxy-2-[18F]fluoro--D-glucose ([18F]FDG) is widely available and is shown to be helpful in distinguishing between localized and systemic amyloidosis[31]. [18F]FDG is, however, limited by relatively low sensitivity [32] as well as specificity [33] due to tracer accumulation in other common conditions such as neoplasm, infection and inflammation. [18F]florbetapir has the advantage of highly specific binding to amyloid fibrils[34],[35] and does not require an on-site cyclotron unlike [11C]-labeled Pittsburgh Compound B (PiB).
A limitation of the study is the lack of histological confirmation as gold standard to evaluate the diagnostic performance of [18F]florbetapir PET/CT to identify pulmonary amyloidosis. Lung/pleural biopsies are not commonly performed clinically in AL amyloidosis and a correlative study with pulmonary histology is likely not feasible. However, we were able to demonstrate a 3 to 30-fold higher Vs in the AL cohort compared to control cohort, strongly supporting the notion of tracer binding to AL. AL lung activity can show increased [18F]FDG uptake. However, unfortunately, [18F]FDG PET was not performed for the study subjects in this protocol. Our study used the 6-minute walk test as a measure of subjects’ functional capacity, which was not significantly different between subjects with and without pulmonary uptake of [18F]florbetapir. As a composite measure of cardiopulmonary fitness, the test is not able to distinguish between a cardiac and respiratory cause of subjects’ functional limitation. Future studies with pulmonary function tests with DLCO and a prospective study of a select group of patients with proven lung involvement/diffuse interstitial lung pattern using [18F]florbetapir PET will be critical to expand these pilot results.
CONCLUSIONS
[18F]florbetapir PET/CT appears to be a promising non-invasive imaging approach to diagnose pulmonary involvement in individuals with systemic AL amyloidosis. The clinical and prognostic implications of pulmonary AL amyloidosis diagnosed by [18F]florbetapir warrant further study.
Supplementary Material
Acknowledgement:
We are extremely grateful to the study subjects and the study sites for their participation.
Funding support:
SD and RF are supported by NIH RO1 grant (RO1 HL 130563); SD and RL are supported by American Heart Association Grant (AHA 16 CSA 2888 0004). HL receives support from NIH/NCI Cancer Center Support Grant P30 CA008748. MDC are supported by Spectrum Dynamics and Gilead.
Compliance with Ethical Standards:
Conflicts of interest: HH is a working owner of MedTrace Pharma. MDC has received consulting fees from Sanofi and GE Health care. HL has received consulting fees from Celgene, Takeda, Janssen, Prothena, Pfizer and Juno and research support from Amgen, Spectrum and Takeda. VS has received research support from Takeda, Celgene, Janssen and Prothena and is on the scientific advisory board for Caleum Biosciences. FLR has received consulting fees from Pfizer, GlaxoSmithKline, and Caleum Biosciences, and research support from Eidos Therapeutics. RHF has received consulting fees from Ionis Pharmaceuticals and Alnylam Pharmaceuticals and research funding from GlaxoSmithKline. SD has received consulting fees from Pfizer, GE Health Care, and AAA; research grants from Pfizer. YMK declares that she has no conflict of interest. SC declares that she has no conflict of interest. MFK declares that she has no conflict of interest. MAP declares that she has no conflict of interest. MR declares that he has no conflict of interest. HH declares that she has no conflict of interest. GB declares that she has no conflict of interest. AJY declares that he has no conflict of interest. RL declares that she has no conflict of interest. JB declares that he has no conflict of interest.
Abbreviations:
- AL
light chain amyloidosis
- ATTR
transthyretin amyloidosis
- FLC
free light chains
- PET/CT
positron emission tomography computed tomography
- RI
retention index
- SUVmax
maximum standardized uptake value
- TBR
target-to-blood ratio
- Vs
distribution volume of specific binding
- HU
Hounsfield unit
- PA
pulmonary artery
- PASP
pulmonary artery systolic pressure
- CMR
cardiac magnetic resonance imaging
- EDV
end diastolic volume
- ESV
end systolic volume
- SV
stroke volume
- EF
ejection fraction
- LV
left ventricle
- RV
right ventricle
- 6mwt
six minute walk test
- IQR
interquartile range
- NT-proBNP
N-terminal pro b-type natriuretic peptide
Footnotes
Ethical approval: All procedures performed in studies involving human participants were in accordance with the ethical standards of the Partners Human Research Committee and with the 1964 Helsinki declaration and its later amendments or comparable ethical standards.
Informed consent: Informed consent was obtained from all individual participants included in the study.
References:
- 1.Merlini G, Bellotti V. Molecular mechanisms of amyloidosis. N Engl J Med. 2003;349(6):583–596. [DOI] [PubMed] [Google Scholar]
- 2.Celli BR, Rubinow A, Cohen AS, Brody JS. Patterns of pulmonary involvement in systemic amyloidosis. Chest. 1978;74(5):543–547. [DOI] [PubMed] [Google Scholar]
- 3.Browning MJ, Banks RA, Tribe CR, et al. Ten years’ experience of an amyloid clinic--a clinicopathological survey. Q J Med. 1985;54(215):213–227. [PubMed] [Google Scholar]
- 4.Czeyda-Pommersheim F, Hwang M, Chen SS, Strollo D, Fuhrman C, Bhalla S. Amyloidosis: Modern Cross-sectional Imaging. Radiographics. 2015;35(5):1381–1392. [DOI] [PubMed] [Google Scholar]
- 5.Pickford HA, Swensen SJ, Utz JP. Thoracic cross-sectional imaging of amyloidosis. AJR Am J Roentgenol. 1997;168(2):351–355. [DOI] [PubMed] [Google Scholar]
- 6.Yood RA, Skinner M, Rubinow A, Talarico L, Cohen AS. Bleeding Manifestations in 100 Patients With Amyloidosis. JAMA. 1983;249(10):1322–1324. [PubMed] [Google Scholar]
- 7.Ezawa N, Katoh N, Oguchi K, Yoshinaga T, Yazaki M, Sekijima Y. Visualization of multiple organ amyloid involvement in systemic amyloidosis using11C-PiB PET imaging. Eur J Nucl Med Mol Imaging. 2018;45(3):452–461. [DOI] [PubMed] [Google Scholar]
- 8.Wagner T, Page J, Burniston M, et al. Extracardiac 18F-florbetapir imaging in patients with systemic amyloidosis: more than hearts and minds. Eur J Nucl Med Mol Imaging. 2018;45(7):1129–1138. [DOI] [PMC free article] [PubMed] [Google Scholar]
- 9.Dorbala S, Vangala D, Semer J, et al. Imaging cardiac amyloidosis: a pilot study using 18F-florbetapir positron emission tomography. Eur J Nucl Med Mol Imaging. 2014;41(9):1652–1662. [DOI] [PubMed] [Google Scholar]
- 10.Ehman EC, El-Sady MS, Kijewski MF, et al. Early Detection of Multiorgan Light Chain (AL) Amyloidosis by Whole Body (18)F-florbetapir PET/CT. J Nucl Med. 2019. Sep;60(9):1234–1239 [DOI] [PMC free article] [PubMed] [Google Scholar]
- 11.Patel GM, Hauser TH, Parker JA, et al. Quantitative relationship of stress Tc-99m sestamibi lung uptake with resting Tl-201 lung uptake and with indices of left ventricular dysfunction and coronary artery disease. J Nucl Cardiol. 2004;11(4):408–413. [DOI] [PubMed] [Google Scholar]
- 12.Sanders GP, Pinto DS, Parker JA, Koutkia P, Aepfelbacher FC, Danias PG. Increased resting Tl-201 lung-to-heart ratio is associated with invasively determined measures of left ventricular dysfunction, extent of coronary artery disease, and resting myocardial perfusion abnormalities. J Nucl Cardiol. 2003;10(2):140–147. [DOI] [PubMed] [Google Scholar]
- 13.Georgoulias P, Demakopoulos N, Kontos A, Xaplanteris P, Xydis K, Fezoylidis I. Early post-stress pulmonary uptake of 99mTc tetrofosmin during exercise (SPECT) myocardial perfusion imaging: correlation with haemodynamic, perfusion and function parameters. Nucl Med Commun. 2006;27(2):119–126. [DOI] [PubMed] [Google Scholar]
- 14.Martinez EE, Horowitz SF, Castello HJ, et al. Lung and myocardial thallium-201 kinetics in resting patients with congestive heart failure: Correlation with pulmonary capillary wedge pressure. Am Heart J. 1992;123(2):427–432. [DOI] [PubMed] [Google Scholar]
- 15.Marcassa C, Galli M, Baroffio C, Eleuteri E, Campini R, Giannuzzi P. Independent and incremental prognostic value of 201Tl lung uptake at rest in patients with severe postischemic left ventricular dysfunction. Circulation. 2000;102(15):1795 –1801. [DOI] [PubMed] [Google Scholar]
- 16.Nesterov S V, Han C, Maki M, et al. Myocardial perfusion quantitation with 15O-labelled water PET: high reproducibility of the new cardiac analysis software (Carimas). Eur J Nucl Med Mol Imaging. 2009;36(10):1594–1602. [DOI] [PubMed] [Google Scholar]
- 17.Rosenblum LJ, Mauceri RA, Wellenstein DE, et al. Density patterns in the normal lung as determined by computed tomography. Radiology. 1980;137:409–416. [DOI] [PubMed] [Google Scholar]
- 18.Mitchell C, Rahko PS, Blauwet LA, et al. Guidelines for Performing a Comprehensive Transthoracic Echocardiographic Examination in Adults: Recommendations from the American Society of Echocardiography. J Am Soc Echocardiogr. 2019;32(1):1–64. [DOI] [PubMed] [Google Scholar]
- 19.Bossone E, D’Andrea A, D’Alto M, et al. Echocardiography in pulmonary arterial hypertension: from diagnosis to prognosis. J Am Soc Echocardiogr. 2013;26(1):1–14. [DOI] [PubMed] [Google Scholar]
- 20.Yeon SB, Salton CJ, Gona P, et al. Impact of Age, Sex and Indexation Method on MR Left Ventricular Reference Values in the Framingham Heart Study Offspring Cohort. J Magn Reson Imaging. 2015;41(4):1038–1045. [DOI] [PMC free article] [PubMed] [Google Scholar]
- 21.Alfakih K, Plein S, Thiele H, Jones T, Ridgway JP, Sivananthan MU. Normal human left and right ventricular dimensions for MRI as assessed by turbo gradient echo and steady-state free precession imaging sequences. J Magn Reson Imaging. 2003;17(3):323–329. [DOI] [PubMed] [Google Scholar]
- 22.Maceira AM, Prasad SK, Khan M, Pennell DJ. Reference right ventricular systolic and diastolic function normalized to age, gender and body surface area from steady-state free precession cardiovascular magnetic resonance. Eur Heart J. 2006. Dec;27(23):2879–88. [DOI] [PubMed] [Google Scholar]
- 23.Khoor A, Colby TV. Amyloidosis of the lung. Arch Pathol Lab Med. 2017;141(2):247–254. [DOI] [PubMed] [Google Scholar]
- 24.Smith RRL, Hutchins GM, Moore GW, Humphrey RL. Type and distribution of pulmonary parenchymal and vascular amyloid. Am J Med. 1979;66(1):96–104. [DOI] [PubMed] [Google Scholar]
- 25.Berk JL. Pleural effusions in systemic amyloidosis. Curr Opin Pulm Med. 2005;11(4):324–328. [DOI] [PubMed] [Google Scholar]
- 26.Cordier J- F. Pulmonary amyloidosis in hemat logical disorders. Semin Respir Crit Care Med. 2005;26(5):502–513. [DOI] [PubMed] [Google Scholar]
- 27.Milani P, Basset M, Russo F, Foli A, Palladini G, Merlini G. The lung in amyloidosis. Eur Respir Rev. 2017;26(145). [DOI] [PMC free article] [PubMed] [Google Scholar]
- 28.Berk JL, Keane J, Seldin DC, et al. Persistent pleural effusions in primary systemic amyloidosis: Etiology and prognosis. Chest. 2003;124(3):969–977. [DOI] [PubMed] [Google Scholar]
- 29.Govender P, Keyes CM, Hankinson EA, O’Hara CJ, Sanchorawala V, Berk JL. Transbronchial biopsies safely diagnose amyloid lung disease. Amyloid. 2017. Mar;24(1):37–41 [DOI] [PMC free article] [PubMed] [Google Scholar]
- 30.Utz, Swensen G. Pulmonary amyloidosis. Ann intern med. 1996;28(1):75–83. [DOI] [PubMed] [Google Scholar]
- 31.Glaudemans AWJM, Slart RHJA, Noordzij W, Dierckx RAJO, Hazenberg BPC. Utility of 18F-FDG PET/CT in patients with systemic and localized amyloidosis. Eur J Nucl Med Mol Imaging. 2013;40(7):1095–1101. [DOI] [PubMed] [Google Scholar]
- 32.Lee JH, Lee GY, Kim SJ, et al. Imaging Findings and Literature Review of 18F-FDG PET/CT in Primary Systemic AL Amyloidosis. Nucl Med Mol Imaging (2010). 2015;49(3):182–190. [DOI] [PMC free article] [PubMed] [Google Scholar]
- 33.Baqir M, Lowe V, Yi ES, Ryu JH. 18F-FDG PET Scanning in Pulmonary Amyloidosis. J Nucl Med. 2014;55(4):565–568. [DOI] [PubMed] [Google Scholar]
- 34.Park MA, Padera RF, Belanger A, et al. 18F-Florbetapir Binds Specifically to Myocardial Light Chain and Transthyretin Amyloid Deposits: An Autoradiography Study. Circ Cardiovasc Imaging. 2016;59(3):157–161. [DOI] [PMC free article] [PubMed] [Google Scholar]
- 35.Choi SR, Schneider JA, Bennett DA, et al. Correlation of Amyloid PET Ligand Florbetapir F 18 Binding With Aβ Aggregation and Neuritic Plaque Deposition in Postmortem Brain Tissue. Alzheimer Dis Assoc Disord. 2012;26(1):8–16. [DOI] [PMC free article] [PubMed] [Google Scholar]
Associated Data
This section collects any data citations, data availability statements, or supplementary materials included in this article.