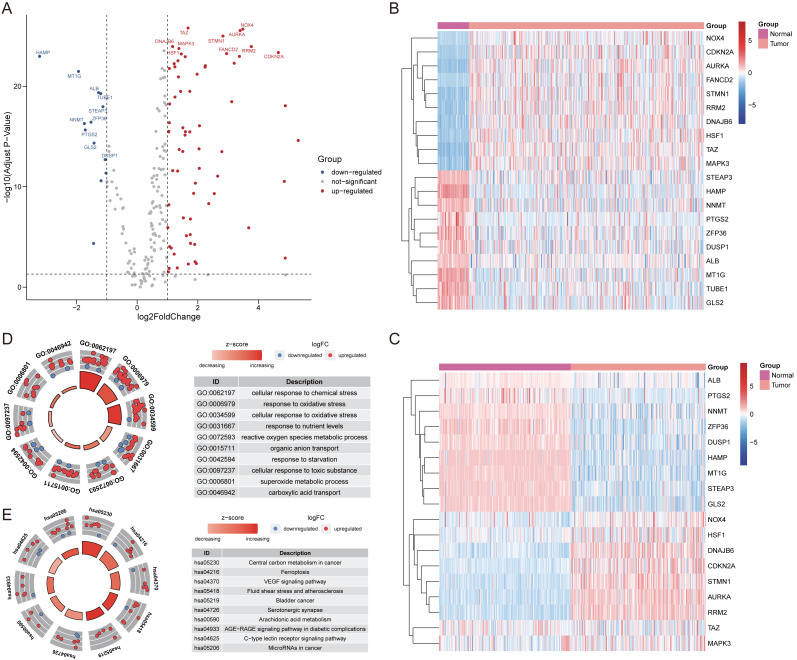
Figure 1. The differentially expressed ferroptosis-related genes.
(A) The Volcano plot of the differentially expressed ferroptosis-related genes. The red dots indicated up-regulated and blue for down-regulated. The top 20 gene symbols with high variation were displayed in the plot. (B) The heatmap of 20 ferroptosis-related genes with high variation in training cohort. (C) The heatmap of 20 ferroptosis-related genes with high variation (except for TUBE1, and FANCD2) between tumor and normal samples in validation cohort. (D) The GO circle plot of functional enrichment. The red dots indicated up-regulation, while the blue indicated down-regulation. (E) The KEGG circle plot of enrichment analysis. The Z-score was directly proportional to the level of enrichment.

