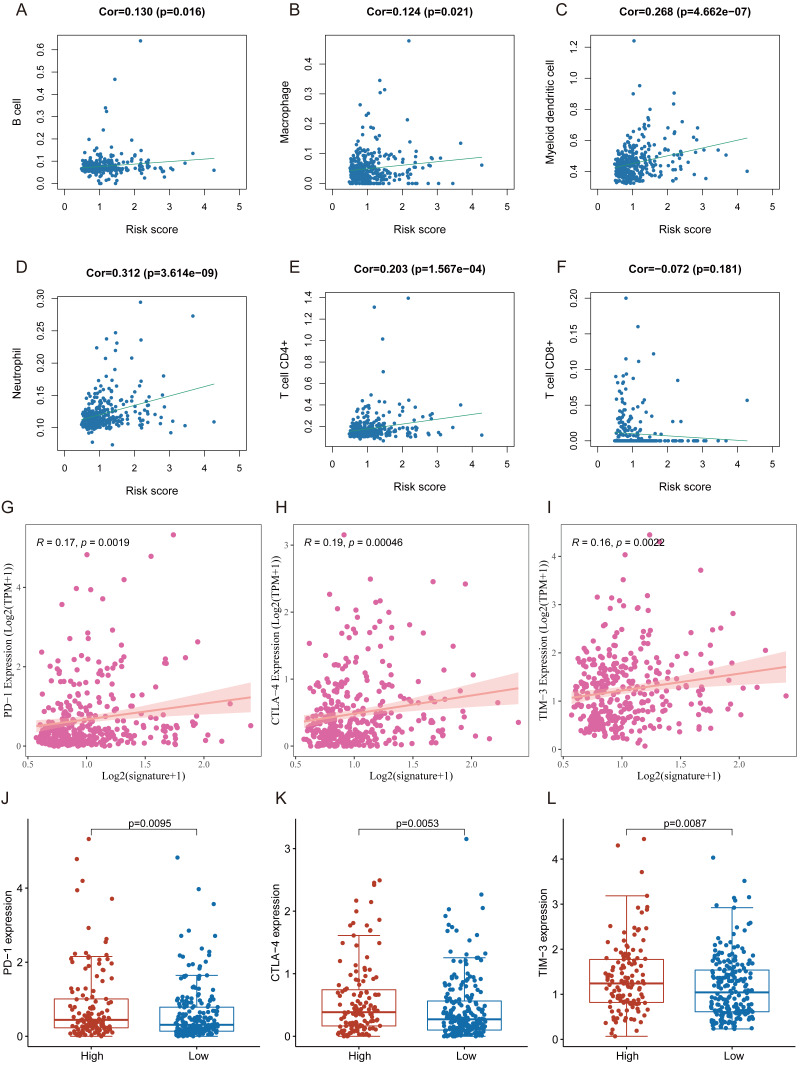
Figure 8. The relationship between FRlncRNAs signature and TIICs, ICB molecules based on TIMER results.
(A) Spearman correlation between the signature and B cell; (B) Spearman correlation between the signature and Macrophage cell. (C) Spearman correlation between the signature and Myeloid dendritic cell. (D) Spearman correlation between the signature and Neutrophil cell. (E) Spearman correlation between the signature and CD4+ T cell. (F) Spearman correlation between the signature and CD8+ T cell. (G–I) Significant positive association between our FRlncRNAs signature and ICB receptors PD-1 (R = 0.17; P = 0.0019), CTLA-4 (R = 0.19; P <0.001), and TIM-3 (R = 0.16; P < 0.001). (J–L) The comparison of the expression levels of PD-1, CTLA-4, and TIM-3 between high-risk and low- groups.

