

Abstract
BACKGROUND:
Haiti has the highest incidence rate of TB in the Western Hemisphere, with an estimated 170 cases per 100,000 in 2019. Since 2010, control efforts have focused on targeted case-finding activities in urban areas, implementation of rapid molecular diagnostics at high-volume TB centers, and improved reporting. TB analyses are rarely focused on lower geographic units; thus, the major goal was to determine if there were focal areas of TB transmission from 2011 to 2016 at operational geographic levels useful for the National TB Control Program (PNLT).
METHODS:
We created a geocoder to locate TB cases at the smallest geographic level. Kulldorff’s space-time permutation scan, Anselin Moran’s I, and Getis-Ord Gi* statistics were used to determine the spatial distribution and clusters of TB.
RESULTS:
With 91% of cases linked using the geocoder, TB clusters were identified each year. Getis-Ord Gi* analysis revealed 14 distinct spatial clusters of high incidences in the Port-au-Prince metropolitan area. One hundred retrospective space-time clusters were detected.
CONCLUSION:
Our study confirms the presence of TB hotspots in the Ouest département, with most clusters in the Port-au-Prince metropolitan area. Results will help the PNLT and its partners better design case-finding strategies for these areas.
Keywords: Geocoder, Getis-Ord Gi*, Anselin Moran’s I, space-time scan
Abstract
CONTEXTE :
Haïti a le taux d’incidence le plus élevé de TB de l’hémisphère Ouest avec un nombre de cas estimé à 170 par 100 000 en 2019. Depuis 2010, les efforts de contrôle se sont focalisés sur des activités de recherche ciblée des cas dans les zones urbaines, la mise en œuvre de diagnostic moléculaire rapide dans des centres TB de grand volume et de meilleurs rapports. Les analyses TB sont rarement focalisées sur les unités géographiques; le but principal était de déterminer s’il existait des zones focales de transmission de la TB de 2011 à 2016 à des niveaux géographiques opérationnels utiles pour le Programme national de Lutte contre la TB (PNLT).
MÉTHODES :
Nous avons créé géocodeur pour localiser les cas de TB au plus petit niveau géographique. Le scan de permutation espace-temps de Kulldorff’s, Anselin Moran’s I et les statistiques de Getis-Ord Gi* ont été utilisés pour déterminer la distribution spatiale et les clusters de TB.
RÉSULTATS :
Avec 91% des cas liés avec le géocodeur, les clusters de TB ont été identifiés chaque année. L’analyse Getis-Ord Gi* a révélé 14 clusters spatiaux distincts d’incidence élevée dans la zone métropolitaine de Port-au-Prince. Cent clusters rétrospectifs espacetemps ont été détectés.
CONCLUSION :
Notre étude confirme la présence de hotspots TB dans la département Ouest, la majorité des clusters étant situés dans la zone métropolitaine de Port-au-Prince. Les résultats aideront le PNLT et ses partenaires à mieux affiner leurs stratégies de recherche des cas dans ces zones.
Haiti has the highest burden of TB in the Western Hemisphere, with an estimated incidence of 170 cases per 100,000 population in 2019.1 The WHO estimates that in 2019 there were 19,000 incident TB cases (range: 15,000–24,000) in Haiti.1 TB case-finding in Haiti relies primarily on passive case detection, although there are efforts to expand screening in HIV clinical settings and health facilities, and through contact tracing. After the 2010 earthquake, Haiti’s National TB Program (Programme National de Lutte contre la Tuberculose, PNLT) expanded control efforts to increase the number of notified cases from 14,222 in 2010 to 17,043 in 2013.2,3 Since this increase, notified cases have plateaued at ∼15,000 cases per year. Several innovative approaches have contributed to this increase: active case finding (ACF) in urban slums, implementation of new diagnostic methods such as fluorescent light-emitting diode (LED) microscopy at high-volume TB sites, and expansion of a network of Xpert® MTB/RIF (Cepheid, Sunnyvale, CA, USA) testing.4–8 ACF in high-risk urban neighborhoods in Port-au-Prince, Haiti’s capital, revealed rates five times above the national rates in 2011 and four times above national rates in 2015.9,10
Efforts to control TB in developing countries have focused mainly on the implementation of the WHO-recommended directly observed treatment (DOTS) strategy, expanded testing for TB within health facilities, and administering the bacille Calmette-Guérin vaccine to children.1,11,12
Geospatial analysis is a powerful tool for identifying areas of active transmission of infectious diseases. In the last few years, various studies have shown how geospatial analysis of TB cases can be useful in detecting clusters of cases and in helping TB programs better target their control efforts.13–16
The main objective of this study was to conduct spatial analyses using routine TB surveillance data to determine if there were focal areas of TB transmission in the Ouest département from 2011 to 2016 at operational geographic levels useful for PNLT to target prevention and control strategies.
METHODS
Study population and setting
This retrospective descriptive study was conducted in Haiti, a country (2017 population: approximately 10.9 million; 58% in urban areas) in the Caribbean.17 There are 10 geographic départements in Haiti, which are divided into 140 communes and 570 communal sections.
This analysis is restricted to the Ouest département, which has the highest number of newly diagnosed self-reported TB patients. In Ouest, there are 17 communes with 41 health facilities diagnosing and treating patients with TB.
Data analysis
Data from the PNLT’s surveillance system from 2011 to 2016 was cleaned in Excel (Microsoft, Redmond, WA, USA) and analyzed using Stata v13.1 (StataCorp, College Station, TX, USA) for all descriptive statistics.18,19
Patient residences are captured in two fields: commune of residence and an open text address field. The address field included one or more of the following: house number, street, city, communal section, neighborhood, road, intersection, or landmark. Haiti’s address hierarchy below the commune is not well known by the general population. Collaborators standardized the orthography for the villages (French: localités), and the commune of reported residence was corrected based on the village.
A composite address geocoder was created in ArcGIS Desktop 10.5 (ESRI, Redlands, CA, USA), shown in Figure 1. Individual locators were created using data from the National Center for Geo-Spatial Information (Centre Nationale De Information Géospatiale [CNIGS]; Port-au-Prince, Haiti): commune capitals, communal section centroids, and quartier centroids.20 Villages, points of interest, and street mid-point locators were created using data from OpenStreetMap, Google Maps, Doctors without Borders (MSF), Haiti’s Ministry of Public Health and Population (MSPP), and the CNIGS. A small number of neighborhoods and streets were physically visited by collaborators.
FIGURE 1.
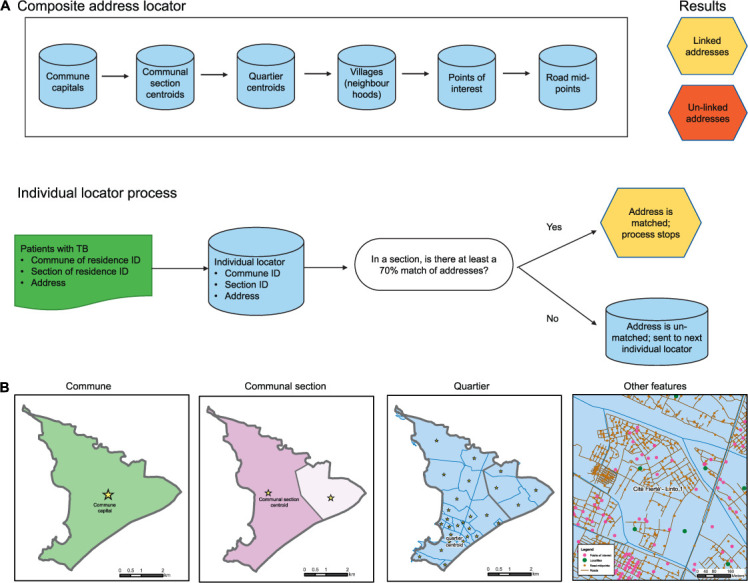
Haiti’s composite address geocoder.
The algorithm was used to compare the TB dataset with each individual address geocoder matching on three fields (address, commune ID, and département ID) if the orthography and word length of the address field was >70% similar (Figure 1), proceeding until a match was found.
Spatial analyses
The geocoded TB database was spatially joined with the communal section and quartier shapefiles. Cumulative incidence rates (CIRs) of the number of new TB patients per 100,000 persons were calculated by communal section for each year using population estimates from the Haitian Institute of Statistics and Informatics linked with administrative boundaries from the CNIGS.20 Official population estimates from 2009, 2012, and 2015 were correlated with sampled years (2011 CIR, 2012–2013 CIR, and 2014–2016 CIR). In Ouest, communal sections are on average 42.5 km2 (range: 4.3–287.8). CNIGS delineated a smaller urban operational unit, the quartier. Quartiers are on average 0.8 km2 (range: 0.02–20.1 km2) and cover a subset of the Ouest département.
The Getis-Ord Gi*-optimized hotspot analysis and the Anselin’s Moran’s I outlier tests were conducted in ArcGIS v10.5 using the raw TB cases and the CIR individually each year for communal sections and quartiers. Parameters for both tests were set to use the inverse distance spatial relationship. The Getis-Ord Gi* analysis identifies clusters using a global rate, whereas the Anselin Moran’s I test identifies statistically significant hotspots, cold spots, and outliers (high areas surrounded by areas with low values and low areas surrounded by areas with high values) using local averages.
Retrospective space-time permutation model
A space-time permutation model was performed in SatScanTM v9.6 (Martin Kulldorff, Department of Population Medicine, Harvard Medical School and Harvard Pilgrim Health Care Institute, Boston, MA, USA) using all geo-coded data excluding 12 cases lacking a diagnosis date.21 Based on supporting research, circular space-time clusters were searched for using a 1-month minimum time window temporally up to 18 months (25% of the study period) and spatially up to a radius of 322 km (15% of the study area).22–24 Geographic overlap of cluster centers was not allowed.
Ethical clearance
The study protocol was reviewed and determined to be a public health evaluation by the Haiti National Bioethics Committee at the MSPP, Port-au-Prince, Haiti. This project (2017-106) was reviewed in accordance with the Centers for Disease Control and Prevention human research protection procedures and was determined to be program evaluation.
RESULTS
From 2011 to 2016, a total of 97,117 cases of TB were notified. Of the 42,712 (44.0%) TB patients living in the Ouest département included in this analysis, most persons were diagnosed for the first time (93.3%). Demographic and clinical characteristics are shown in Table 1. Of all patients with TB in Ouest, 78 did not report a commune of residence. In Ouest, 91.0% of TB patients were located at a finer geographic level below the commune; this number was consistent across years. Six communes had consistently high numbers of residing TB patients: Port-au-Prince, Delmas, Carrefour, Croix-des-Bouquets, Cité Soleil, and Petionville. Nine communes had <1.5% of the cases each: Arcahaie, Cabaret, Kenscoff, Gressier, Ganthier, Grand-Goâve, Thomazeau, Cornillon/Grand-Bois, and Fonds-Verrettes.
TABLE 1.
Demographic and clinical characteristics of TB patients in Ouest department, Haiti, 2011–2016
| Characteristic | All TB cases (n = 42,712) n (%) | Geolocated TB cases (n = 38,874) n (%) | Non-geolocated* TB cases (n = 3,838) n (%) | Pearson’s χ2 P value |
|---|---|---|---|---|
| Sex | 0.03† | |||
| Male | 23,203 (54.3) | 21,183 (54.5) | 2,020 (52.6) | |
| Female | 19,509 (45.7) | 17,691 (45.5) | 1,818 (47.4) | |
| Age group, years | 0.32 | |||
| <15 | 5,490 (12.9) | 4,996 (12.9) | 494 (12.9) | |
| 15–24 | 10,476 (24.5) | 9,541 (24.5) | 935 (24.4) | |
| 25–44 | 18,836 (44.1) | 17,195 (44.2) | 1,641 (42.8) | |
| 45–64 | 6,534 (15.3) | 5,904 (15.2) | 620 (16.2) | |
| ⩾65 | 1,376 (3.2) | 1,228 (3.2) | 148 (3.9) | |
| Residence | <0.001† | |||
| Port-au-Prince metropolitan area | 31,274 (73.2) | 29,681 (76.4) | 1,593 (41.5) | |
| Outside of metropolitan area | 11,438 (26.8) | 9,193 (23.6) | 2,245 (58.5) | |
| Category of patient | 0.05† | |||
| New | 39,837 (93.3) | 36,228 (93.2) | 3,609 (94.0) | |
| Retreatment | 2,875 (6.7) | 2,646 (6.8) | 229 (6.0) | |
| Type of TB disease | 0.04† | |||
| Pulmonary smear-positive | 24,202 (56.7) | 21,917 (56.4) | 2,285 (59.5) | |
| Pulmonary smear-negative | 13,322 (31.2) | 12,189 (31.4) | 1,133 (29.5) | |
| Extra-pulmonary | 5,188 (12.1) | 4,768 (12.2) | 420 (10.9) | |
| HIV status | <0.001† | |||
| Negative | 30, 694 (71.9) | 28,085 (72.3) | 2,609 (68.0) | |
| Positive | 6,893 (16.1) | 6,306 (16.2) | 587 (15.3) | |
| Indeterminate | 920 (2.2) | 820 (2.1) | 100 (2.6) | |
| Not documented | 4,205 (9.8) | 3,663 (9.4) | 542 (14.1) | |
| Antiretroviral therapy status‡ | 0.06 | |||
| Yes | 3,881 (56.3) | 3,575 (56.7) | 306 (52.1) | |
| No | 1,187 (17.2) | 1,084 (17.2) | 103 (17.5) | |
| Not reported | 1,825 (26.5) | 1,647 (26.1) | 178 (30.3) | |
| Chest radiography | 0.001† | |||
| Abnormal | 13,071 (30.6) | 11,939 (30.7) | 1,132 (29.5) | |
| Normal | 83 (0.2) | 77 (0.2) | 6 (0.2) | |
| Not performed | 29,558 (69.2) | 26,858 (69.1) | 2,700 (70.3) |
* Cases with TB not linked at a communal section, quartier, or street level, but which could be linked at the commune of residence.
† Statistically significant.
‡ Denominator is the number of HIV-positive patients.
TB patients who could not be linked (n = 3,838) at the communal section or lower level were dissimilar to linked cases. Non-linked patients were more likely to live outside the metropolitan Port-au-Prince area (58.5% vs. 23.6%, P < 0.001) than linked patients. While there was no observed difference between newly diagnosed vs. retreated cases, non-linked patients had a higher probability of having a smear-positive TB test (59.5% vs. 56.4%, P = 0.001) and were less likely to have had an HIV test (84.2% vs. 89.3%, P < 0.001) than linked patients.
The distribution of newly confirmed cases of TB living in Ouest is different from where these patients were diagnosed due to the location of testing facilities; 52% of all patients were diagnosed within five facilities: Centres GHESKIO (Groupe Haïtien d’Étude du Sarcome de Kaposi et des Infections Opportunistes) (23.7%), Sanatorium de Port-au-Prince (9.2%), Mennonite de Croix-des-Bouquets (7.0%), Hôpital de l’Université d’Etat d’Haiti (6.3%), and Hôpital Grace Children (6.0%). Only 1.6% of patients residing in Ouest were diagnosed in other départements. No TB diagnostic capacity exists in Fonds-Verrettes or Gressier. More patients (53.8%) seek care within the Port-au-Prince commune than in any other commune.
Localization by communal section
In urban sections of metropolitan Port-au-Prince, the CIR (Figure 2) varied with an average of 138 TB cases/100,000 (range: 0–518); rural communal sections with no linked cases are seen in white. Outside the metropolitan Port-au-Prince, the average was higher with 184 cases/100,000 persons (range: 0–6,125).
FIGURE 2.
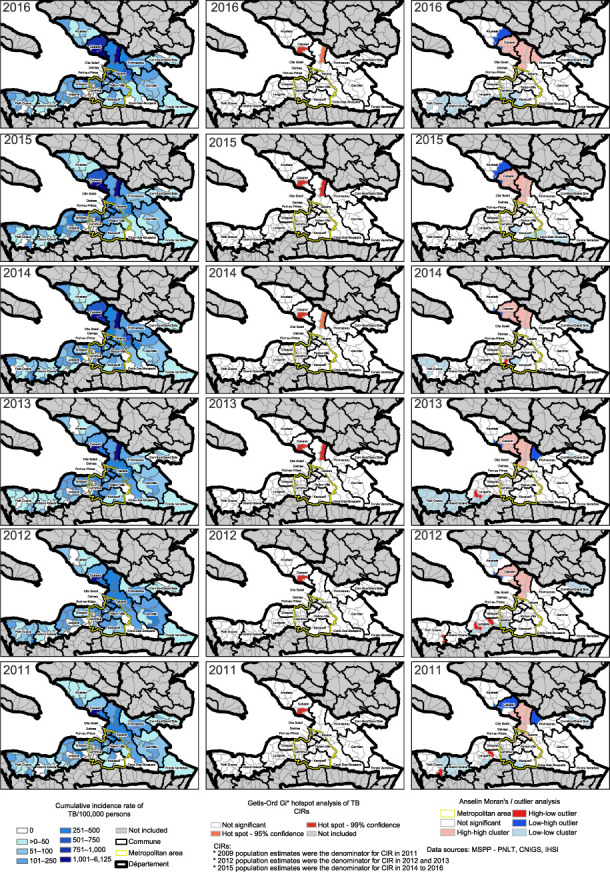
Cumulative incidence rate of new TB cases by communal section, Getis-Ord Gi* analysis, Anselin Moran’s I analysis per year, 2011–2016. CIR = cumulative incidence rates; MSPP = Ministry of Public Health and Population; PNLT = Programme National de Lutte contre la Tuberculose; CNIGS = Centre Nationale De Information Géospatiale; IHSI = Institut Haïtien de Statistique et d’Informatique.
Spatial autocorrelation of CIR of TB cases using the Global Moran’s I test was significant each year (P < 0.001). The Getis-Ord Gi* analysis performed on the CIR of TB per communal sections detected two statistically significant clusters (P < 0.05) in Croix-des-Bouquets and Cabaret seen in red (Figure 2); these communal sections had consistently high CIRs with an average of respectively 1,106 and 3,982 cases/100,000.
The Anselin Moran’s I outlier analysis showed similar results with significant clusters in light red each year in Cabaret and Croix-des-Bouquets (Figure 2). In total, nine communal sections were hotspots. High-low outliers (bright red) and cold spots (light blue) were detected in Leogane, Petit-Goâve, and in Carrefour. Cold spots were detected in rural areas of Grand-Goâve, Gressier, Kenscoff, and Cornillon/Grand-Bois.
Hotspots of raw cases of TB (Supplementary Figure S1) showed a different distribution than CIR hotspots (Figure 2). Using the Getis-Ord Gi* analysis, each year the same four communal sections were significant clusters (P < 0.05) seen in red (Figure 2) in Delmas, Port-au-Prince, and Carrefour. In 2014 and 2015, this coastal cluster (P < 0.05) included a section in Cité-Soleil.
All Getis-Ord Gi* hotspots of raw cases were also detected using Anselin Moran’s I analysis. The Anselin Moran’s I analysis detected a greater number of clusters in the metropolitan region (Supplementary Figure S1). Eighteen communal sections were significant hotspots with a centralized coastal pattern (light red) (Supplementary Figure S1). Two high-low outliers were detected (dark red) at the city centers in Leogane and Petit-Goâve. Each year there were cold spots (light blue) detected in Petit-Goâve, Grand-Goâve, Leogane, and Cornillon/Grand Bois.
Localization by quartier
Of all the cases of TB geo-located in the Ouest department, 89.5% were located within quartiers (Supplementary Figure S2). The Getis-Ord Gi* analysis detected an average of 118 hotspots (P < 0.05) each year (range: 52–139 hotspots). In most years, these hotspots were primarily located near the coast of Port-au-Prince, Carrefour, Cité-Soleil, and in Delmas’ northeastern quartiers (Supplementary Figure S2). In 2011 and 2013–2015, inland hotspots were detected in Croix-des-Bouquets. In 2016, the distribution of hotspots was localized with smaller clusters. Significant cold spots were detected each year in Gressier and Leogane (P < 0.05).
The Anselin local Moran’s I analysis (Supplementary Figure S2) identified coastal hotspots in Port-au-Prince, Delmas, and Carre-four. Low-high outliers were found along the edges of the main coastal cluster. High-low outliers were detected in Croix-des-Bouquets, Delmas, Gressier, and Leogane.
Space-time permutation model
A space-time permutation model was run using individual geo-located cases. One hundred retrospective space-time clusters (Figure 3) were detected (P < 0.05) with an average duration of 10.5 months (range: 1–18) and an average radius of 269.7 m (range: 0–4.9 km). Only six clusters had a radius >1 km. Most space-time clusters began in 2016. The average number of cases observed inside a cluster was 47 cases (range: 5–240).
FIGURE 3.
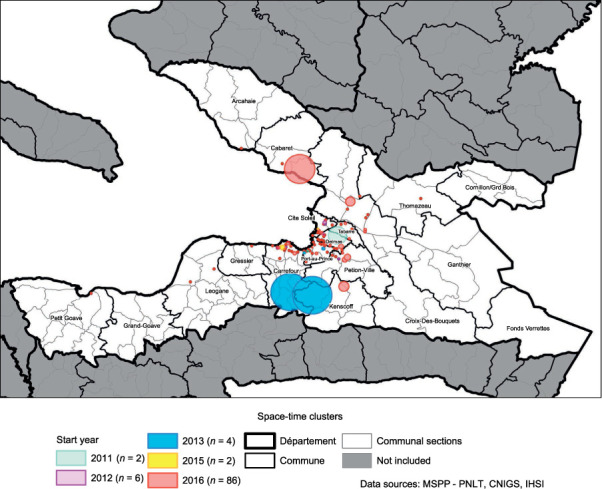
Retrospective space-time clusters of TB in the Ouest département, 2011–2016.
DISCUSSION
This is Haiti’s first effort to remotely geocode TB cases for an entire département. A composite geo-coder of addresses was built and successfully linked 91% of patients to an operational geographic level. With limited additional field data collection at the neighborhood level, this composite geocoder can be utilized for subsequent years by PNLT and by the wider health system. Geo-coding addresses in developing countries is feasible with minimal investment in creating spatial data at a geographic operational level such as a village or a quartier.
TB clusters were detected each year at multiple spatial scales in the Ouest département: communal section, quartier level, and smaller clusters across both space and time. Traditional methods utilize the CIR clusters only, adjusting for low reporting rates with Bayesian smoothing techniques. For the PNLT, hotspots identified using raw counts were more valuable than CIR hotspots. Hotspots identified using raw counts (Supplementary Figures S1 and S2) mirrored PNLT expectations and historical case-finding efforts, while CIR hotspots were outside the urban Port-au-Prince metropolitan region. CIR relied on official population estimates, with one estimate used for several years, and were generated from Haiti’s last census in 2003, limiting confidence in the CIR hotspots.
Identification of significant TB clusters and actionable results depend on geographic response units. For the PNLT, the smaller quartier-level clusters (Supplementary Figure S2) are more pro-grammatically actionable than large communal sections clusters (Supplementary Figure S1). At the quartier level, larger hotspots in denser areas were detected using the Getis-Ord Gi* method, whereas high-low outliers in semi-urban areas were identified using the Anselin Moran’s I method. Both methods are useful for targeting ACF efforts. Furthermore, retrospective space-time clusters allow for focusing of control activities (269.7 m average radius and 10.5-month duration) within quartiers if resources are not available for a quartier level approach.
In Ho Chi Minh, Vietnam, Vo et al. observed an increased theoretical yield of 0.32% for screening 50 m around index cases, but screening at 100 m and 200 m had lower theoretical yields (0.21% and 0.17%) and higher screening times of 1 and 4 months.14 In 2013, ACF screening and contact tracing approaches were used in Cité de Dieu (a quartier) finding a total of 144 new confirmed TB cases out of 7,500 screened (1.9% yield).9 Cité de Dieu was also identified both in the top 20 quartiers and as a space-time cluster. The high number needed to screen to find additional cases indicates that a defined targeted approach inside quartiers assisted by using the geographically smaller space-time clusters may improve ACF.
Limitations
In 2019, WHO estimates Haiti missed 32% of new TB cases.1 Additionally, 9% of all the persons with TB could not be linked. These hotspot analyses rely on linking reported residences of confirmed TB cases to estimate where to detect additional cases. In the Ouest département, 56% of confirmed patients traveled outside their commune for a TB diagnosis; these travelers are more likely to be lost to follow-up (χ2 16.1, P < 0.001). Care providers do record addresses below the commune level — only 1.6% patients lacked a recorded address. Modified forms with three fields for commune, section, and address would improve linkages. Some people may have been attributed to the town center but live in nearby neighborhoods. Furthermore, persons with TB were attributed to their residences based on notification data, whereas studies show that TB may also spread at work sites, schools, public transportation, and dense markets.15 As TB spreads faster in dense urban areas, it is more likely that undetected cases are in the urban areas of the Ouest département.5
CONCLUSION
PNLT now has a method to identify retrospective quartiers of TB for 40% of Haiti’s detected cases. Next steps include expanding the composite geocoder to include nine other départements and visiting key places in rural areas to add villages. The PNLT can already conduct door-to-door household ACF screenings within space-time clusters and within quartier hotspots to evaluate the percentage yield. This targeted geospatial strategy could increase the number of persons detected with TB and limit community transmission as people are treated. As a result of this study, PNLT will integrate GPS (global positioning system) data collection in routine TB data collection to conduct quarterly hotspot analyses that will help better tailor future case-finding activities.
ACKNOWLEDGEMENTS
The work described in this manuscript was supported by the President’s Emergency Plan for AIDS Relief (PEPFAR) through the Centers for Disease Control and Prevention (CDC) under the terms of GH15-152702.
Footnotes
CDC Disclaimer: The findings and conclusion of this manuscript are those of the authors and do not necessarily represent the official position of the funding agencies.
References
- 1.World Health Organization Global tuberculosis report, 2020. Geneva, Switzerland: WHO; 2020. https://worldhealthorg.shinyapps.io/tb_profiles/?_inputs_&lan=%22EN%22&iso2=%22HT%22 [Google Scholar]
- 2.World Health Organization Global tuberculosis control, 2011. Geneva, Switzerland: WHO; 2011. [Google Scholar]
- 3.World Health Organization Global tuberculosis report, 2013. Geneva, Switzerland: WHO; 2013. [Google Scholar]
- 4.Koenig SP, et al. Tuberculosis in the aftermath of the 2010 earthquake in Haiti. Bull World Health Organ. 2015;93:498–502. doi: 10.2471/BLT.14.145649. [DOI] [PMC free article] [PubMed] [Google Scholar]
- 5.Charles M, et al. Trends in tuberculosis case notification and treatment success, Haiti, 2010–2015. Am J Trop Med Hyg. 2017;97:49–56. doi: 10.4269/ajtmh.16-0863. [DOI] [PMC free article] [PubMed] [Google Scholar]
- 6.Delva GJ, et al. Active tuberculosis case finding in Port-au-Prince, Haiti: experiences, results, and implications for tuberculosis control programs. Tuberc Res Treat. 2016;2016:8020745. doi: 10.1155/2016/8020745. [DOI] [PMC free article] [PubMed] [Google Scholar]
- 7.Rivera VR, et al. Diagnostic yield of active case finding for tuberculosis at human immunodeficiency virus testing in Haiti. Int J Tuberc Lung Dis. 2019;23(11):1217–1222. doi: 10.5588/ijtld.18.0835. [DOI] [PMC free article] [PubMed] [Google Scholar]
- 8.Louis FR, et al. Building and rebuilding: the national public health laboratory systems and services before and after the earthquake and cholera epidemic, Haiti, 2009–2015. Am J Trop Med Hyg. 2017;97(4):21–27. doi: 10.4269/ajtmh.16-0941. [DOI] [PMC free article] [PubMed] [Google Scholar]
- 9.Masur J, et al. Active tuberculosis case finding in Haiti. Am J Trop Med Hyg. 2017;97(2):433–435. doi: 10.4269/ajtmh.16-0674. [DOI] [PMC free article] [PubMed] [Google Scholar]
- 10.Rivera VR, et al. Diagnostic yield of active case finding for tuberculosis and HIV at the household level in slums in Haiti. Int J Tuberc Lung Dis. 2017;21(11):1140–1146. doi: 10.5588/ijtld.17.0049. [DOI] [PMC free article] [PubMed] [Google Scholar]
- 11.Maher D, Floyd K, Raviglione M. Strategic framework to decrease the burden of HIV/TB. Geneva, Switzerland: World Health Organization; 2002. [Google Scholar]
- 12.Harries AA-O, Kumar AMV. Challenges and progress with diagnosing pulmonary tuberculosis in low- and middle-income countries. Diagnostics. 2018;8(4):78. doi: 10.3390/diagnostics8040078. [DOI] [PMC free article] [PubMed] [Google Scholar]
- 13.Kuupiel D, et al. Geographic accessibility to public health facilities providing tuberculosis testing services at point-of-care in the upper east region, Ghana. BMC Public Health. 2019;19(1):718. doi: 10.1186/s12889-019-7052-2. [DOI] [PMC free article] [PubMed] [Google Scholar]
- 14.Vo LA-O, et al. Optimizing community screening for tuberculosis: Spatial analysis of localized case finding from door-to-door screening for TB in an urban district of Ho Chi Minh City, Viet Nam. PloS One. 2018;13(12):e0209290. doi: 10.1371/journal.pone.0209290. [DOI] [PMC free article] [PubMed] [Google Scholar]
- 15.Shaweno DA-O, et al. Methods used in the spatial analysis of tuberculosis epidemiology: a systematic review. BMC Med. 2018;16(1):193. doi: 10.1186/s12916-018-1178-4. [DOI] [PMC free article] [PubMed] [Google Scholar]
- 16.Ratovonirina NH, et al. Assessment of tuberculosis spatial hotspot areas in Antananarivo, Madagascar, by combining spatial analysis and genotyping. BMC Infect Dis. 2017;17(1):562. doi: 10.1186/s12879-017-2653-9. [DOI] [PMC free article] [PubMed] [Google Scholar]
- 17.United Nations Haiti. New York, NY, USA: UN; 2017. http://data.un.org/en/iso/ht.html [Google Scholar]
- 18.Salyer SJ, et al. Evaluation of the national tuberculosis surveillance program in Haiti. Int J Tuberc Lung Dis. 2015;19(9):1045–1050. doi: 10.5588/ijtld.15.0051. [DOI] [PMC free article] [PubMed] [Google Scholar]
- 19.Puttkammer N, et al. An assessment of data quality in a multi-site electronic medical record system in Haiti. Int J Med Inform. 2016;86:104–116. doi: 10.1016/j.ijmedinf.2015.11.003. [DOI] [PubMed] [Google Scholar]
- 20.Institut Haïtien de Statistique et d’Informatique, Direction des Statistiques Démographiques et Sociales. Population totale, population de 18 ans et plus ménages et densités estimés en 2015. Port-au-Prince, Haiti: IHSI; 2015. [Google Scholar]
- 21.Kulldorff M. SatScan User Guide for version 9.6. Boston, MA, USA: Information Management Services; 2018. [Google Scholar]
- 22.Roth D, et al. Identification of spatial and cohort clustering of tuberculosis using surveillance data from British Columbia, Canada, 1990–2013. Soc Si Med. 2016;168:214–222. doi: 10.1016/j.socscimed.2016.06.047. [DOI] [PubMed] [Google Scholar]
- 23.Gómez-Barroso D, et al. Spatio-temporal analysis of tuberculosis in Spain, 2008–2010. Int J Tuberc Lung Dis. 2013;17(6):745–751. doi: 10.5588/ijtld.12.0702. [DOI] [PubMed] [Google Scholar]
- 24.Yang S, et al. Spatiotemporal distribution of tuberculosis during urbanization in the new urban area of Nanchang city, China, 2010–2018. Int J Environ Res Public Health. 2019;16(22):4395. doi: 10.3390/ijerph16224395. [DOI] [PMC free article] [PubMed] [Google Scholar]