

Abstract
The central nervous system exerts control over the activation of muscles via a dense network of nerve fibers targeting each individual muscle. There are numerous clinical situations where a detailed assessment of the nerve-innervation pattern is required for diagnosis and treatment. Especially, deep muscles are hard to examine and are as yet only accessible by uncomfortable and painful needle EMG techniques. Just recently, a new and flexible method and device became available to measure the small magnetic fields generated by the contraction of the muscles: optically pumped magnetometers (OPMs). OPMs are small devices that measure the zero-field level crossing resonance of spin-polarized rubidium atoms. The resonance is dependent on the local magnetic field strength, and therefore, these devices are able to measure small magnetic fields in the range of a few hundred femtoteslas. In this paper, we demonstrate as a proof of principle that OPMs can be used to measure the low magnetic fields generated by small hand muscles after electric stimulation of the ulnar or median nerve. We show that using this technique, we are able to record differential innervation pattern of small palmar hand muscles and are capable of distinguishing between areas innervated by the median or ulnar nerve. We expect that the new approach will have an important impact on the diagnosis of nerve entrapment syndromes, spinal cord lesions, and neuromuscular diseases.
Index Terms—: Magnetoneurography, N. medianus, N. ulnaris, optically pumped magnetometers (OPM), myography
I. Introduction
THE human body has far over 200 muscles. Motor control of the central nervous system is exerted via a dense network of nerve fibers targeting each individual muscle [1]–[4]. There are numerous clinical situations - such as traumatic nerve injuries, spinal cord lesions, or entrapment syndromes [5], [6] - were a detailed assessment of the nerval-innervation pattern is required for diagnosis and treatment [7], [8]. Therefore, measuring the physiological activity of nerves and muscles is a common but sometimes challenging task in clinical medicine. Especially, deep muscles are difficult to examine and are, to date, only accessible by uncomfortable and painful needle electromyography (EMG) [9].
One organ, were a detailed analysis of the innervation pattern is often required, is the hand. The hand is innervated by three major nerves: the radial nerve, the ulnar nerve, and the median nerve [10]. These nerves originate from the plexus brachialis which originates from the spinal roots (C5 to Th1: C5 & C6 upper trunk, C7 middle trunk, and C8 & Th1 lower trunk). Ulnar and medial nerve mainly originate from the upper and lower trunk whereas the radial nerve originates from the middle trunk. The radial nerve supplies the extensor muscles of the hand and fingers and is the sensory nerve for the dorsal skin of the hand. The intrinsic muscles of the hand are innervated by the median and the ulnar nerve. In the classical view, the median nerve is supposed to supply the majority of muscles of the thumb and the index finger. The ulnar nerve is thought to supply the muscles of the fingers II to V (see Figure 1). However, the innervation pattern shows a wide range of variability. The extremes are the sole innervation of the intrinsic hand muscles either by the median or by the ulnar nerve. Furthermore the median and ulnar nerves frequently show anastomosis (i.e., Riche-Cannieu Anastomosis), while stretching from the brachial plexus to the hand. Some of these variations are associated with significant clinical consequences (paresis after minor hand surgery). Therefore, a proper assessment of the innervation pattern of the hand is of great clinical relevance. To date two classical electrophysiological techniques exist [11]–[13] for objective assessment of muscle activity: Surface electric myographic and needle myographic recordings. Surface recordings rely on the projection of deep neural and muscular electrical activity to the skin surface via volume conduction. In contrast, needle recordings probe the electric field invasively in close proximity to muscle cells with needle thin needle electrodes that are inserted into the muscle. The needle is typically a small concentric device with an electrode at the tip. Needle recordings allow for a precise assessment of the muscle activity but are painful and limited to a small area and few spatial sampling points.
Fig. 1.
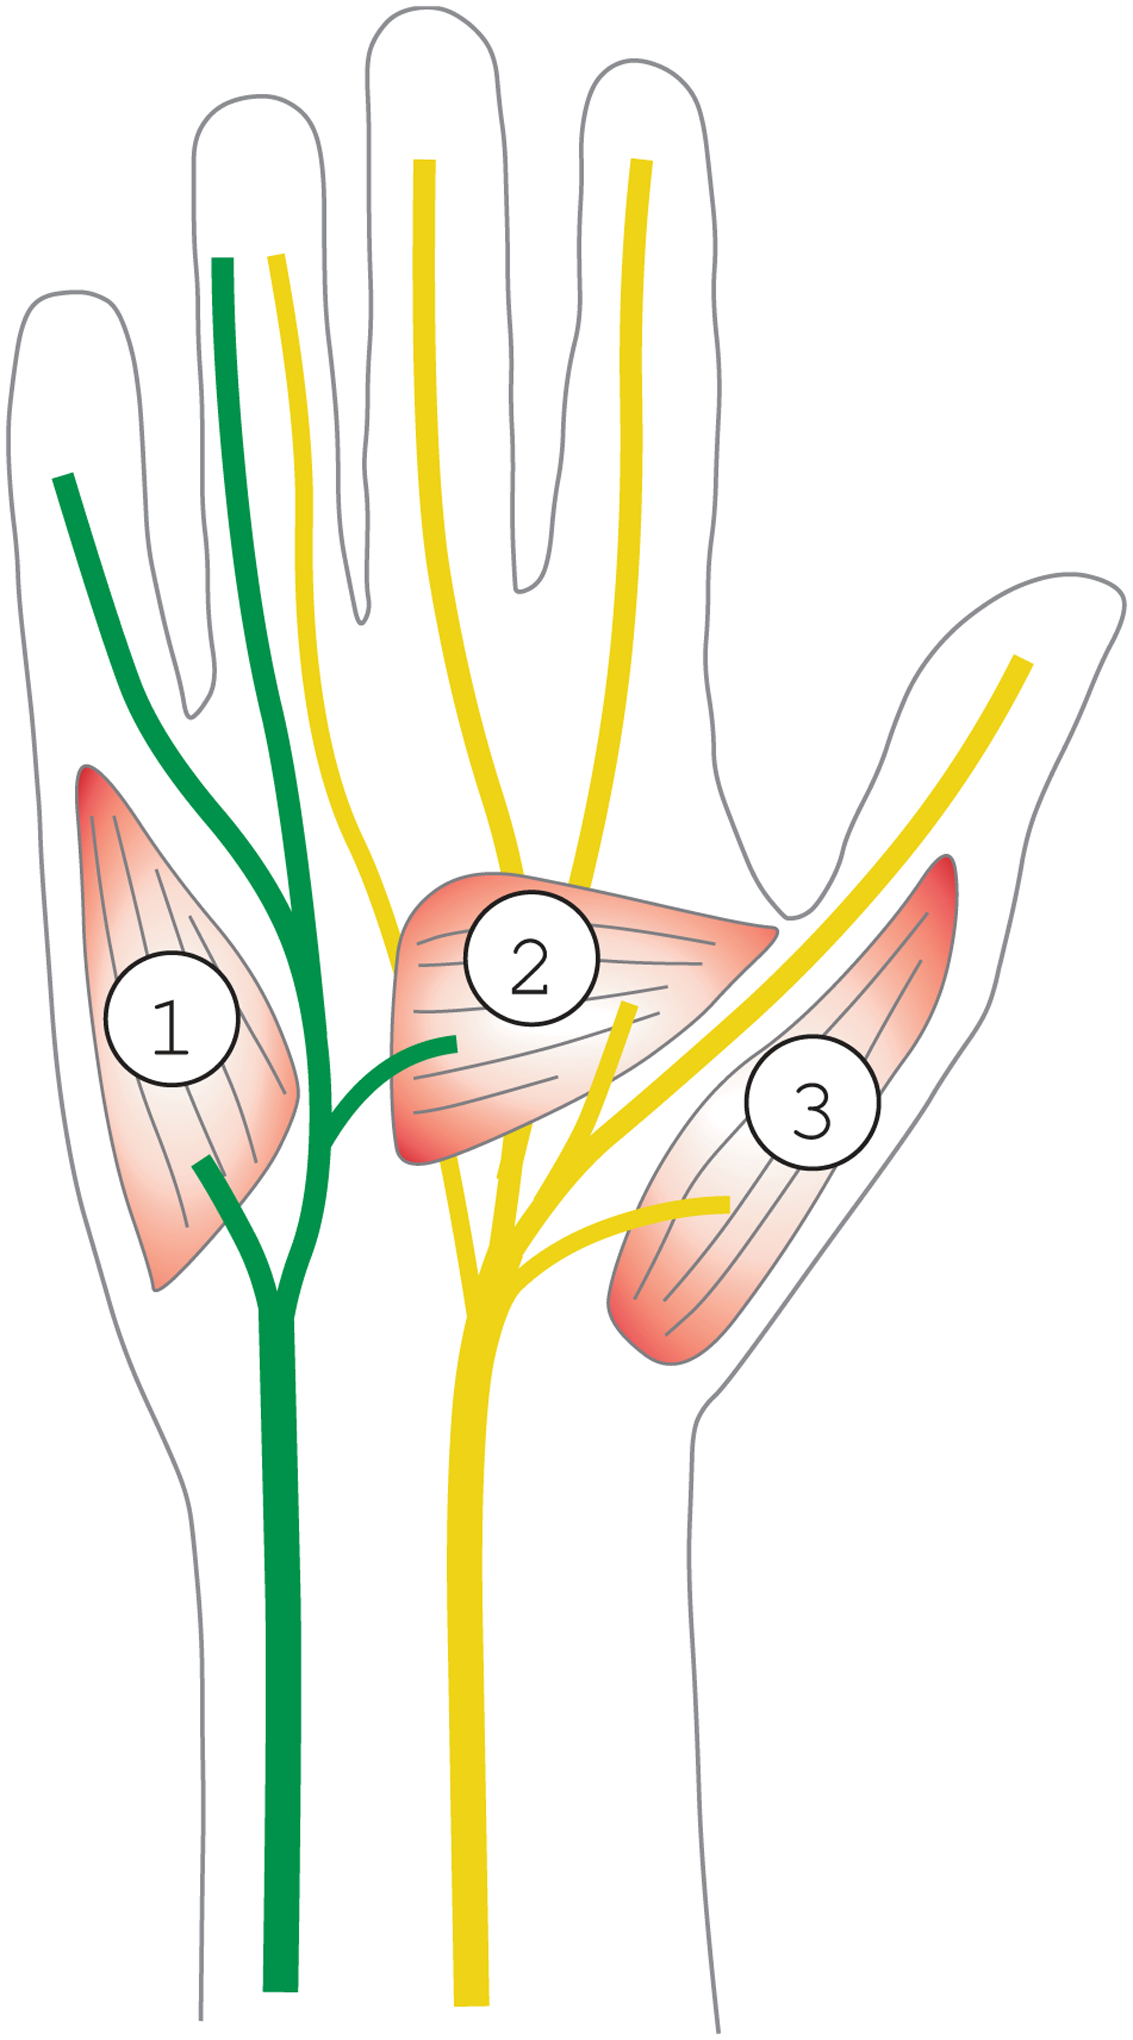
Normal neuronal innervation pattern of the hand. This Figure shows a schematic drawing of the right hand seen from the ventral side. The simplified typical location of the ulnar and median nerve is shown in green and yellow, respectively. 1: location of the M. abductor digiti (innervate by the ulnar nerve), 2: several intrinsic muscles of thumb with a mixed ulnar or medial nerve innervation. 3: M. abductor pollicis (innervated by the medial nerve).
Soon after the discovery that muscle contraction is coupled to electric activity on the cell surface of the muscle cell by Galvani (1791) [14] it was hypothesized - based on theoretical considerations - that there is also a tiny magnetic field associated with this activity. However it took almost two hundred years until methods became available to study these very small magnetic fields.
The first tools with sufficient sensitivity to measure these magnetic fields were SQUIDs (Super conducting quantum interference devices). They allow for the measurement of sub-pico Tesla magnetic fields and are therefore suited to record the small magnetic fields generated by neuronal or muscular tissue. However, they have to be cooled with liquid Helium and require a large apparatus. It was shown by Reinecke [15] that the recording of the biomagnetic fields of the activity of larger muscles is in principle possible. But the bulkiness of the device makes it difficult to place the sensor close to the area of interest in complex anatomical locations like the hand.
Just recently, a new method became available in the form of small uncooled, highly sensitive magnetometers: Optically pumped magnetometers (OPM). Based on the zero-field resonance of spin-polarized rubidium atoms, these sensors can record magnetic fields [16] with a noise floor roughly 3 times the one of commercial low-Tc SQUID magnetometers.
The OPMs here have a noise level of ( above 1 Hz) and a bandwidth around 100 Hz. The operational dynamic range is ±5 nT.
Rubidium vapor is confined in small container of volume (3mm)3. Circularly-polarized light from a low-power laser is shone through the vapor of atoms and orients their electron spins. In the presence of a magnetic field, the spin-orientation changes, which in turn, changes the transmission of the laser light though the cell [17]. These light power variations are monitored with a photodiode and the strength of the magnetic field can be inferred (see Figure 2 Panel b).
Fig. 2.

Technical setup of the setup apparatus. Panel a shows the two sensors mounted on the gantry. Panel b shows a schematic technical drawing of OPM sensor and Panel c shows the supporting electronic device outside of the magnetic shielded chamber. Panel d shows sensors mounted on the gantry inside the recording chamber. (Scalebar 1cm).
A detailed description of the OPM magnetometers and the system can be found in [18]. In this study, we demonstrate as a proof of principle that these OPMs can be used to measure the low magnetic field generated by the small hand muscles after electrical stimulation of the ulnar or median nerve. We show that with this technique we are able to assess the detailed innervation pattern of small palmar hand muscles. We expect that the new approach has an important impact on the diagnosis of nerval entrapement syndroms, spinal cord-lesions, and neuro-muscular diseases.
II. Methods
We conducted a proof-of-principal study to investigate whether OPMs are suitable for the assessment of muscle activity of the small intrinsic hand muscles (see Figure 3 Panel a, black dotted box). We therefore recorded and analyzed the magnetic field generated by the activity of the intrinsic hand muscles after electric stimulation of the ulnar or median nerve at the level of the elbow (see Figure 3, Panel a, green and yellow circles). In order to identify the specificity of the method, we compared the magnetic field strength pattern in the hand after median and after ulnar stimulation separately activating distinct groups of intrinsic hand muscles.
Fig. 3.

Measurement setup. Panel a shows the location of recording (black dotted box) and stimulation. The green dots point to the site of stimulation (ulnar fossa) for the ulnar nerve. The yellow dots point to the site of stimulation for the median nerve. (filled dot : cathode). Panel b shows the box with a foam (Novotritt, Schein, Remscheid, Germany) impression of the right hand of the subject, together with the positions of the OPM sensors (labeled A to C and 1,2). The hand was placed into the box and the box was mounted to the measurement chair (see Panel c). The hand was measured in a pronated position (Panel d). The OPMs were inserted from the palmar side. The sensors were placed just about the levels of the skin.
The detailed experimental setup was the following: The subject (male, 49 years, right-handed) was sitting in a comfortable chair inside a magnetic shielded room (Vakuumschmelze, Ak3b, Hanau, Germany). The subject (an author of this paper) gave his informed consent to participate in the study and agreed that his data and images are used for research and publication. The study was performed in accordance with the principles of the Declaration of Helsinki.
The subject rested his right elbow on a pillow (see Figure 3c). The right hand was placed in a box (25cm × 15cm), filled with rigid foam with a cavity to accommodate the hand (see Figure 3 Panel b and c). Our OPM measurement system consists of two OPM sensors, which simultaneously recorded the magnetic field in two orthogonal directions each. During subsequent runs, the sensors were placed in a chessboard kind pattern close to the palm of the hand (see Figure 3 Panel b) at 2 × 3 positions.
The median and ulnar nerves were stimulated sequentially for each location. Both nerves were stimulated at the level of the elbow by self-adherent electrodes. The stimulator (System Plus Fire, Micromed, Italy) was placed outside the magnetically-shielded room and the four-electrode cables (2×Kathode and 2×Anode) were routed through small holes into the magnetic chamber. Stimulation sites at the participants elbow are shown in Figure 3 Panel a. The nerves were stimulated with a monopolar square wave pulse of 500 us duration and an intensity of 15 mA for the median nerve and 10 mA for the ulnar nerve, respectively. The intensity for both nerves was chosen such that a contraction in the hand could be felt without any movement of the fingers or the hand. Intensity was kept constant during the measurement sequence. While providing electrical stimuli, a simultaneous trigger signal was recorded for each electric stimulation with the data acquisition system of our MEG system (CTF Omega 275, Canada) in order to synchronize both the stimulation and the recording (a sampling rate of 1171.88 samples/sec was used). The OPM system (QuSpin QZFM, [18]–[20]) was used to measure the magnetic field. The OPM system delivered four analog signals: the magnetic field strength in the y and z direction for each sensor. For this study only the field strength in z direction normal to the palm surface was used. A low pass filter of 100 Hz was applied to the analog signal. The OPM and the analog digital converter of the recording system both have an intrinsic delay. This delay was measured to be t = 0.0077 s. The data was post hoc calibrated, such that the stimulus was applied at 0 s.
Magnetic muscular activity was recorded at six positions (Panel b of Figure 3). Two positions were measured simultaneously with the two OPMs. So a total of three runs were required to cover all positions. Locations were evenly distributed across the palm region of the hand. Recording positions (i,j) are labeled by a numeric index from distal (i=1) to proximal (i=2) direction and by an alphabetical index (A to C) in lateral direction with the hypothenar and the thenar area coded as j=A to j=C, respectively. Each session started with the placement of the OPM sensor at the pre-defined positions and the fixation of sensors by the gantry (see Figure 3 Panel d). Measurements were done with the door of the magnetic chamber closed. Prior to the measurement, OPM sensors were calibrated after having reached a stable operation state. First, OPM signals from the two sensors were recorded while the median nerve was stimulated 100 times. In the next step, the N. ulnaris was stimulated 100 times and the OPM signal was recorded to complete the first run. No data processing was done during the recording. Thereafter, both runs were repeated twice. As a control measurement, the stimulation electrodes were placed just a few centimeters away from the nerve at the elbow after the last run to see if a signal is generated without proper stimulation of either the median or ulnar nerve.
III. Results
We first analyzed the statistical character of the data. We expected to require about 100 averages to obtain a stable signal. However the signal convergences quickly with increasing trial numbers which is depicted in Figure 4. Figure (4 Panel a) shows the data from ten individual traces (Traces 20 to 29) recorded after median stimulation and measurement at position C1. Panel b shows the mean signal and the standard error of the mean (SEM). The maximum of the standard error of the mean is 0.0011nT. Given that the SEM is fairly small we decided to conduct all further analyses with only ten traces (Traces 20 to 29). We further compared the data recorded at the hypothenar (A1) and thenar (C1) location after proper stimulation of either the ulnar nerve Figure (5 Panel a) or median nerve Figure (5 Panel b) with the control condition (stimulation electrodes slightly distant from the nerves). In the control condition no magnetic signal in the time window ranging from 5 to 30 ms after the stimulation could be seen (traces not shown) confirming that the recorded signal is due to a stimulation of either the median or ulnar nerve.
Fig. 4.

This Figure shows the statistical characteristics of the measured OPM data. Panel a shows the individual traces Nr. 20 to 29 after median stimulation and recording at position C1. Panel b shows the mean plusminus the standard error of the mean.
Fig. 5.
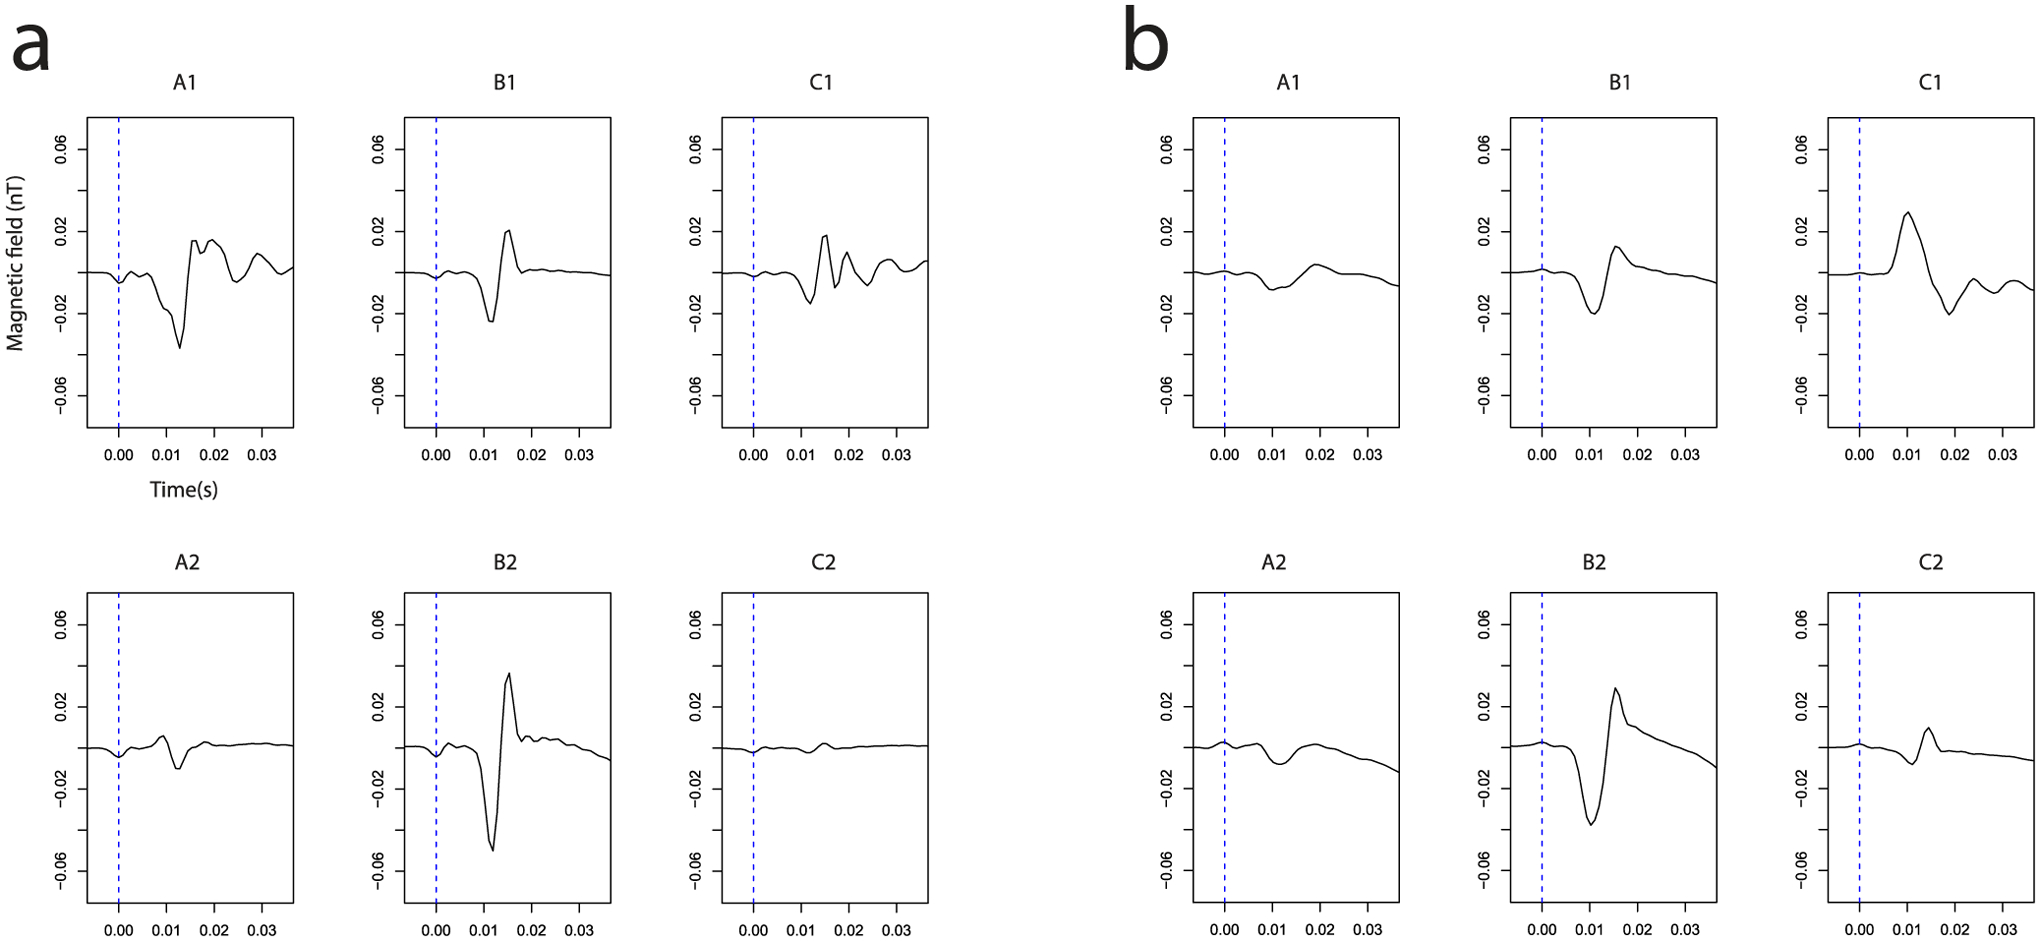
This Figure shows the time course of the measured magnetic field after ulnaris (Panel a) and medianus (Panel b) stimulation for the locations A to C and 1,2. The dashed blue line at t=0s shows the time of stimulation. Typically the curve leaves the base line 8 ms after the stimulation.
We then compared the detected signals with the standard electrophysiological recordings. Our participant had an arm length of 40 cm (elbow to metacarpophalangeal joint III) with the stimulation site 3 cm from the elbow and the recording site about 3 cm from the joint which gives us about 34 cm nerve conduction length.
Based on data from electrophysiology, we expected a signal latency between stimulation and the muscular response of about 6 to 8 ms. In good accordance with this theoretical considerations, we measured the latency of the magnetic field after electric stimulation of the median nerve from our experimental recordings at about 6–7 ms (see Figure 5 Panel b). The latency obtained for stimulation of the ulnar nerve yielded about 8–9 ms. Both latencies correspond to the latencies measured with standard surface electric EMG (Medianus: 6.5 ms, Ulnaris: 9.1 ms, traces not shown). From clinical examinations and standard electrophysiological recordings we know that our subject has a standard innervation pattern of the hand, as outlined in Figure 1. In addition, no anastomosis at the level of the forearm is present. Therefore, the stimulation of either the median or ulnar nerve should show a distinct pattern explained by the model outlined in Figure 1. To test if our data is in agreement with this hypothesis, we created a heat plot of the peak-to-peak amplitude in the time window 7 to 25 ms (see Figure 6). As expected, a strong signal is recorded at the hypothenar area (Figure 5a, A1) after ulnar nerve stimulation and a strong signal at the thenar region is recorded after median nerve stimulation (Figure 6 Panel b, C1). In the middle of the palm (B2), we see a mixed innervation pattern which is again in correspondence with the standard innervation model.
Fig. 6.

Signal distribution after stimulation of the a) ulnar b) median nerve.
IV. Discussion
In this article we present the first study on the recording of stimulated compound muscle action potentials (CMAP) using optically pumped magnetometers (OPMs). We used the devices to analyze the strength and distribution of the magnetic field in the palm of the right hand created by muscle activity after median and ulnar nerve stimulation. We could show that the magnetic components of the CMAPs are recordable and that the magnetic signals show the same latencies as the electric ones. We could further show that the method is capable of reproducing the expected magnetic field distribution pattern. We were able to use the method to clearly separate areas in the hand mainly innervated by the median and such areas which are mainly innervated by ulnar nerve. The sensors are small enough to analyze the magnetic field pattern in complex anatomical situations. However at present, the OPMs still have significant limitation which needs improving. The bandwidth of the OPMs is too low to differentiate magnetic signal with a small temporal delay. For instance, a separation of the signal from the lumbrical muscle of the hand and thumb muscles is not possible at present. Further, the method also shows some disadvantages in comparison to surface electromyography. While in surface EMG usually 3–5 trials are needed to obtain a meaningful signal, a summation of 10 stimulations was required to get a sufficiently good OPM signal. Ideally, the technique should be improved so that a single stimulation is sufficient to record the magnetic component of the compound action potential after muscle contraction. The measurements presented here were performed in a costly magnetically-shielded room. We believe that such measurements could also be made in a small shielded enclosure that surrounds the hand and forearm of the patient along with the sensors. This could lead to a very inexpensive imaging method which could add valuable information in the clinical and scientific setting. The field of device development in biomagnetism is currently rapidly developing [21]. As an alternative to the OPM devices high temperature SQUID devices [22] might be available in similar dimension. If the bandwidth of the OPMs could be significantly improved, theoretically a measurement of the propagation of the action potential along the muscle fiber could be analyzed. Other potential sensors for this type of measurement could be high-temperature SQUIDs, which usually exhibit higher bandwidths [23].
The human muscular action potential propagates with a speed of about . So the action potential requires 5 ms to propagate along a 2 cm sized muscle. To obtain a reasonable clinical / biological information at least 10 measurements during that period are required. This results in 0.4 ms per measurement or a required bandwith of 5 k. Especially in myopathies with an impaired contraction after a sufficient stimulation of the supplying nerve, this new emerging technique will be helpful to further localize the pathophysiological process. In addition, with an increased bandwidth not only the muscle action potential but also the nerval action potential could be measured, and a detailed analysis of the whole chain of activation from the cortex via the spine, to the nerve, to the endplate and finally to the muscle-cell could be studied in great detail.
Contributor Information
Philip J. Broser, Kinderspital, 9006 St. Gallen, Switzerland.
Svenja Knappe, Department of Mechanical Engineering, University of Colorado, Boulder, CO 80309 USA, and also with FieldLine Inc., Lafayette, CO 80026 USA..
Diljit-Singh Kajal, MEG Center, University of Tübingen, 72076 Tübingen, Germany..
Nima Noury, Centre for Integrative Neuroscience and MEG Center, University of Tübingen, 72076 Tübingen, Germany, and also with the IMPRS for Cognitive and Systems Neuroscience, University of Tübingen, 72076 Tübingen, Germany..
Orang Alem, Department of Mechanical Engineering, University of Colorado, Boulder, CO 80309 USA, and also with FieldLine Inc., Lafayette, CO 80026 USA..
Vishal Shah, QuSpin Inc., Louisville, CO 80027 USA..
Christoph Braun, MEG Center, University of Tübingen, 72076 Tübingen Gerrmany, also with the Center for Mind/Brain Science, University of Trento, 38068 Rovereto, Italy, and also with the Department of Psychology and Cognitive Science, University of Trento, 36086 Rovereto, Italy..
References
- [1].ten Donkelaar HJ, Lammens M, Wesseling P, Hori A, Keyser A, and Rotteveel J, “Development and malformations of the human pyramidal tract,” J. Neurol, vol. 251, no. 12, pp. 1429–1442, December. 2004. [DOI] [PubMed] [Google Scholar]
- [2].Miller B, Chou L, and Finlay BL, “The early development of thala-mocortical and corticothalarnic projections,” J. Comparative Neurol, vol. 335, no. 1, pp. 16–41, 1993. [DOI] [PubMed] [Google Scholar]
- [3].Ulinski PS, “Design features in vertebrate sensory systems,” Integrative Comparative Biol, vol. 24, no. 3, pp. 717–731, 1984. [Google Scholar]
- [4].Wozniak W, O’Rahilly R, and Olszewska B, “The fine structure of the spinal cord in human embryos and early fetuses,” J. Hirnforschung, vol. 21, no. 1, pp. 101–124, 1980. [PubMed] [Google Scholar]
- [5].Sabatini U et al. , “Motor recovery after early brain damage. A case of brain plasticity,” Stroke, vol. 25, pp. 514–517, February. 1994. [DOI] [PubMed] [Google Scholar]
- [6].Chu D, Huttenlocher PR, Levin DN, and Towle VL, “Reorganization of the hand somatosensory cortex following perinatal unilateral brain injury,” Neuropediatrics, vol. 31, pp. 63–69, April. 2000. [DOI] [PubMed] [Google Scholar]
- [7].Griffin JW, Hogan MD, Chhabra AB, and Deal DN, “Peripheral nerve repair and reconstruction,” J. Bone Joint Surg. Amer, vol. 95, no. 23, pp. 2144–2151, December. 2013. [DOI] [PubMed] [Google Scholar]
- [8].Marquardt LM and Sakiyama-Elbert SE, “Engineering peripheral nerve repair,” Current Opinion Biotechnol, vol. 24, no. 5, pp. 887–892, October. 2013. [DOI] [PMC free article] [PubMed] [Google Scholar]
- [9].Stålberg E, “Between genetics and biology. Is ENMG useful in peripheral neuropathy diagnosis and management?” Revue Neurologique, vol. 172, no. 10, pp. 627–631, October. 2016. [DOI] [PubMed] [Google Scholar]
- [10].Wynter S and Dissabandara L, “A comprehensive review of motor innervation of the hand: Variations and clinical significance,” Surg. Radiol. Anatomy, vol. 40, no. 3, pp. 259–269, July. 2017. [DOI] [PubMed] [Google Scholar]
- [11].Ghezzi A, Callea L, Zaffaroni M, Zibetti A, and Montanini R, “Study of central and peripheral motor conduction in normal subjects,” Acta Neurol. Scandmavica, vol. 84, no. 6, pp. 503–506, December. 1991. [DOI] [PubMed] [Google Scholar]
- [12].Kazamel M and Warren PP, “History of electromyography and nerve conduction studies: A tribute to the founding fathers,” J. Clin. Neurosci, vol. 43, pp. 54–60, September. 2017. [DOI] [PubMed] [Google Scholar]
- [13].Millet GY, Martin V, Martin A, and Vergès S, “Electrical stimulation for testing neuromuscular function: From sport to pathology,” Eur. J. Appl. Physiol, vol. 111, no. 10, pp. 2489–2500, October. 2011. [DOI] [PubMed] [Google Scholar]
- [14].Martonosi AN, “Animal electricity, Ca2+ and muscle contraction. A brief history of muscle research,” Acta Biochim. Polonica, vol. 47, no. 3, pp. 493–516, 2000. [PubMed] [Google Scholar]
- [15].Reincke M, “Magnetomyographie mit dem SQUID–magnetomyography with the SQUID,” Biomed. Eng, vol. 38, no. 11, pp. 276–281, November. 1993. [DOI] [PubMed] [Google Scholar]
- [16].Allred JC, Lyman RN, Kornack TW, and Romalis MV, “High-sensitivity atomic magnetometer unaffected by spin-exchange relaxation,” Phys. Rev. Lett, vol. 89, no. 13, p. 130801, September. 2002. [DOI] [PubMed] [Google Scholar]
- [17].Dupont-Roc J, Haroche S, and Cohen-Tannoudji C, “Detection of very weak magnetic fields (10−9gauss) by 87Rb zero-field level crossing resonances,” Phys. Lett. A, vol. 28, pp. 638–639, February. 1969. [Google Scholar]
- [18].Boto E et al. , “A new generation of magnetoencephalography: Room temperature measurements using optically-pumped magnetometers,” NeuroImage, vol. 149, pp. 404–414, April. 2017. [DOI] [PMC free article] [PubMed] [Google Scholar]
- [19].Alem O et al. , “Magnetic field imaging with microfabricated optically-pumped magnetometers,” Opt. Express, vol. 25, no. 7, pp. 7849–7858, April. 2017. [DOI] [PubMed] [Google Scholar]
- [20].Sheng D, Perry AR, Krzyzewski SP, Geller S, Kitching J, and Knappe S, “A microfabricated optically-pumped magnetic gradiometer,” Appl. Phys. Lett, vol. 110, no. 3, p. 031106, January. 2017. [DOI] [PMC free article] [PubMed] [Google Scholar]
- [21].Clarke J, Lee Y-H, and Schneiderman J, “Focus on SQUIDs in biomagnetism,” Superconductor Sci. Technol, vol. 31, no. 8, p. 080201, 2018. [Online]. Available: http://stacks.iop.org/0953-2048/31/i=8/a=080201 [Google Scholar]
- [22].Faley MI et al. , “High-Tc squid biomagnetometers,” Superconductor Sci. Technol, vol. 30, no. 8, p. 083001, 2017. [Online]. Available: http://stacks.iop.org/0953-2048/30/i=8/a=083001 [Google Scholar]
- [23].Oeisjen F et al. , “High-TC superconother ducting quantum interference device recordings of spontaneous brain activity: Towards high-TC magnetoencephalography,” Appl. Phys. Lett, vol. 100, no. 8, pp. 132601–1–132601–4, 2012. [Google Scholar]