

Abstract
Understanding the factors that influence the use of evidence-based practices (EBPs) for Autism Spectrum Disorder (ASD) in schools is critical to the selection of effective implementation strategies to support their sustained use. The current study has two aims: 1) evaluate the association between school leadership profiles (undifferentiated and optimal) and fidelity of EBP implementation; and 2) examine the role of implementation climate as a mediator in this association. Participants included 56 principals, 90 special education teachers and 133 classroom staff from 66 elementary schools. Participants completed the Multifactor Leadership Questionnaire and Implementation Climate Scale. Teachers and staff reported on intensity (frequency) of EBP delivery, and the research team rated the accuracy (adherence) to the components of the EBP. Schools were required to implement at least one of three EBPs for ASD (Discrete Trial Training [DTT], Pivotal Response Training [PRT], or Visual Supports [VS]). Using structural equation modeling, we found that schools with optimal leadership had higher observed ratings of teacher and staff fidelity for PRT accuracy (p < .05), but not for DTT or VS. However, this association became non-significant with the introduction of implementation climate into the models. Optimal leadership profiles were linked to more positive teacher/staff-reported implementation climate, compared with undifferentiated profiles (p < .01), but found no association between implementation climate and fidelity. Overall, the results of this study indicate that the role of principal leadership in EBP implementation is complex, which has implications for fostering a conducive organizational implementation context in schools.
Keywords: autism, leadership, implementation climate, school, evidence-based practice
Autism spectrum disorder (ASD) is a developmental disability characterized by difficulties in social communication and restrictive or repetitive behaviors (American Psychological Association [APA], 2013). The education system is a central provider of treatment services for children with ASD (Brookman-Frazee et al., 2009). Over the past decade, the number of children with ASD receiving special education services in public schools has increased by 51% totaling 576,000 students in 2014–2015 (National Center for Education Statistics [NCES], 2018). According to the Centers for Disease Control and Prevention, the current prevalence rate of ASD is 1 in 59 children in the USA (Baio et al., 2018). This dramatic increase has made the improvement of school-based ASD services a priority in the United States (Fixsen, Blase, Metz, & Van Dyke, 2013; Locke, Kratz, Reisinger, & Mandell, 2014). While schools are increasingly required to implement evidence-based practices (EBP) (NCLB, 2002; IDEA, 2004), research indicates that EBPs are not consistently implemented in schools (Dingfelder and Mandell, 2011; Locke et al., 2014). Furthermore, when EBPs are used in schools, fidelity of implementation – the degree to which an intervention is implemented as intended by developers (Proctor et al., 2011) – is typically poor (Pellecchia et al., 2015; Mandell et al., 2013; Suhrheinrich et al., 2013; Locke et al., 2015). This is problematic as studies have found that higher fidelity to ASD intervention components is associated with better student outcomes (Pellecchia et al. 2015). Understanding the factors that influence the implementation of EBPs for ASD in schools with fidelity is critical to the selection of targeted and effective implementation strategies to support their sustained use (Harn, Parisi, & Stoolmiller, 2013).
Several EBPs for children with ASD that yield positive outcomes in various areas of development when used appropriately have been identified (National Autism Center, 2015; Wong et al., 2015). The National Professional Development Center on Autism Spectrum Disorder (NPDC-ASD) has identified 27 EBPs for ASD that can be used to target 11 goal domains such as social, communication, behavior, and cognition (Wong et al., 2015) and the National Standards Project identified 10 developmental skills to target including academic, interpersonal, and self-regulation (National Autism Center, 2015). However, the potential benefit of EBPs is limited by how the intervention is implemented. School variables such as available resources and provider variables such as EBP expertise, may affect the feasibility to successfully implement EBPs with fidelity (Odom, Duda, Kucharczyk, Cox, & Stabel, 2014). This becomes more challenging in special education settings, where students with ASD have a wide range of needs, and teachers must ensure the fit of an EBP to the overall classroom structure.
Despite efforts focused on improving the fidelity of EBP implementation in schools (California Autism Professional Training and Information Network [CAPTAIN]; NPDC-ASD), only a small number of studies have investigated the relationship between organizational factors and fidelity in schools (Kratz et al., 2019; Locke et al., 2019; Williams et al., 2019). Implementation leadership (leader behaviors that support EBP use) and implementation climate (the shared perceptions of staff that the use of EBPs is expected, supported, and rewarded by their organization) are relevant organizational factors associated with successful implementation of EBPs in community service settings (Ehrhart, Aarons, & Farahnak, 2014; Aarons, Ehrhart, Farahnak, & Sklar, 2014). Leadership, more broadly, also is an important organizational factor in supporting successful implementation of EBPs in community service settings (Aarons et al., 2014). Research in other organizational settings, including health service settings, indicate two forms of leadership that may be fundamental in affecting implementation of EBPs in schools: 1) transformational leadership, the degree to which a leader inspires and motivates staff; and 2) transactional leadership, perceived support from a leader in providing incentives and rewards (Bass & Avolio, 1995; Michaelis, Stegmaier, & Sonntag, 2010). Both transformational and transactional leadership are associated with successful intervention implementation (Michaelis et al., 2010; Sloan & Gruman, 1988). While EBP implementation in schools involves coordination between multiple leaders who oversee teaching, staff, and decision making (Camburn, Rowan, & Taylor, 2003), research indicates principal support of an intervention is essential for implementation success (Forman & Barakat, 2011) and can be manifested by actions such as public support of the intervention. Transformational and transactional leadership have been studied in schools where principal leadership is associated with implementation climate (Stadnick et al., 2019), but studies on their effect on fidelity of implementation is sparse.
Implementation climate is another organizational construct that can support EBP implementation in community service settings (Ehrhart et al., 2014). Empirical research in children’s mental health service settings found that the effect of leadership on working alliance (shared commitment to tasks and goals between provider and client) is mediated by implementation climate, which suggests that leadership may affect the quality of care through improving implementation climate (Green, Albanese, Cafri, & Aarons, 2014). A growing body of research has investigated the relationship between implementation climate and implementation of EBPs in schools (Locke et al., 2019; Lyon et al., 2018) and one recent study found that in classrooms with strong perceived implementation climate, higher fidelity of implementation was associated with improved student outcomes for children with ASD (Kratz et al., 2019). However, the relationship between leadership, implementation climate, and fidelity of implementation of EBPs in schools has yet to be studied.
The current study builds upon a larger multi-site mixed-methods study aimed at understanding individual and organizational factors that impact EBP implementation in schools for children with ASD (Locke et al., 2016). As part of the larger study, leadership profiles of principals involved in EBP implementation for students with ASD were established from the multifactor leadership questionnaire (Stadnick et al., 2019). Using latent profile analysis, a three-pattern solution was identified: disengaged (characterized by low levels of all leadership behaviors; 6% of sample), undifferentiated (characterized by moderately low levels of all leadership behaviors; 23% of sample), and optimal (characterized by high levels of transformational and transactional leadership behaviors; 71% of sample). Latent profile analysis identifies profiles based on responses to a series of continuous variables. In this case, the profiles were derived by entering the MLQ subscales (which measure different styles of leadership) individually, allowing for unique patterns of leadership to emerge. The decision to examine general leadership as a series of profiles is derived from previous work from Arnold and colleagues (2017) that used a person-oriented approach focused on critical styles of leadership including transformational, contingent reward, management by exception active, management by exception passive, and laissez-faire. These studies examining leadership profiles have been able to identify distinct patterns of leadership, including what can be considered “optimal” leadership (Arnold et al., 2017; Doucet, Fredette, Simard, & Tremblay, 2015). The optimal group was associated with more positive implementation climate than the undifferentiated or disengaged groups (Stadnick et al., 2019). For this study, we aggregated the individual profile probabilities to determine one profile (disengaged, optimal or undifferentiated) for each school. Using this method, no school had a categorization of disengaged; thus, this study only focuses on the optimal and undifferentiated profiles. The current study builds off of this literature and has two aims: 1) evaluate the association between school leadership profiles (undifferentiated and optimal) and fidelity of EBP implementation for students with ASD; and 2) examine the role of implementation climate as a mediator in this association. This study uniquely contributes to the field of implementation science by identifying direct and indirect pathways by which leadership and implementation climate may affect the fidelity of EBP implementation in schools. Findings of this study offer the potential to inform targeted implementation strategies to bolster successful EBP implementation and sustainment in public school settings.
Method
Participants and Setting
Participants included 56 principals, 90 teachers and 133 classroom staff members (i.e., classroom assistants, one-on-one classroom aides) from elementary schools across 7 school districts in the northeastern and northwestern United States. Specific to this study, participants were predominantly White (64% principals; 87% teachers; 52% staff) and female (61% principals; 97% teachers; 92% staff). Table 1 presents additional participant demographics. Teachers and classroom staff worked in Kindergarten through third grade self-contained classrooms for children with ASD. Ninety-two schools were invited to participate based on whether the school had a Kindergarten through third-grade special education classroom for students with ASD. Complete data were available for 71 schools and 5 schools were excluded because a leadership profile could not be assigned to the school, resulting in 66 schools in this study.
Table 1.
Participant Demographics
| M (SD) or n (%) | Principals (n=56) |
Teachers (n=90) |
Classroom Staff (n=133) |
|---|---|---|---|
| Age (years) | 47.48 (7.92) | 37.71 (11.39) | 42.22 (12.74) |
| Gender (Female) | 34 (61%) | 86 (97%) | 118 (92%) |
| Ethnicity (Hispanic/Latino) | 5 (9%) | 2 (2%) | 6 (5%) |
| Race | |||
| White | 34 (64%) | 77 (87%) | 67 (52%) |
| African American | 17 (32%) | 10 (11%) | 52 (41%) |
| American Indian/Alaska Native | 0 (0%) | 1 (1%) | 0 (0%) |
| Asian/Pacific Islander | 2 (4%) | 1 (1%) | 5 (4%) |
| Multiracial & Other | 0 (0%) | 0 (0%) | 4 (3%) |
| Highest Level of Education | |||
| High School | 0 (0%) | 0 (0%) | 26 (20%) |
| Some College | 0 (0%) | 0 (0%) | 36 (27%) |
| College Degree | 3 (5%) | 13 (14%) | 47 (36%) |
| Graduate/Professional | 52 (93%) | 76 (84%) | 18 (14%) |
| Vocational/Other | 1 (2%) | 1 (1%) | 5 (4%) |
| Years in Current Position | 5.01 (4.23) | 3.70 (5.00) | 4.25 (4.75) |
| Specialized ASD Training | 7 (13%) | 61 (68%) | 66 (50%) |
Schools had an average of 568 students enrolled (SD=171; Range; 290–1175) and the student population of the schools was racially and ethnically diverse, with a breakdown as follows: 36% African American, 29% White, 17% Hispanic/Latinx, 8% Asian, <1% Pacific Islander, <1% American Indian, and 9% Other. On average across schools, 15% of students had individualized education programs (IEPs; range: 5.9%–31.6%) and 75% of students qualified for free or reduced lunch.
Comparison of regions.
Regions (i.e., northeastern and northwestern United States) were compared across a range of factors including staff, principal, and school characteristics including student population differences (see Supplemental Table 2). There were no differences between regions on principal and staff characteristics, except on race (p < .05) where there were significantly more African-American principals and staff in the northeast region. There were significant differences between regions (p < .05) with regard to school size, percentage of students eligible for free and reduced lunch, and percentage of minority students per school. Examination of the correlation between these variables and fidelity (Supplemental Table 1) revealed significant correlations between percentage of students eligible for free and reduced lunch and percentage of minority students per school with Discrete Trial Training fidelity intensity and Pivotal Response Training fidelity intensity. These differences were accounted for in all analyses.
Schools in these regions were required by their school districts to implement three EBPs for students with ASD (Discrete Trial Training, Pivotal Response Training, and Visual Supports). Discrete Trial Training (DTT) is an instructional process grounded in Applied Behavior Analysis (ABA) that uses repeated trials and instructional cues to teach skills in a systematic manner (Wong et al., 2015; Smith, 2001). During each trial reinforcers and clear contingencies are used to teach the new skill, typically in one-on-one sessions (Sam & AFIRM Team, 2016). Trials are repeated several times with the learner receiving reinforcement for responding correctly. Pivotal Response Training (PRT) is a behavioral intervention also grounded in ABA that builds on learner interests and initiative to develop communication, language, play, and social skills (Wong et al., 2015). PRT focuses on four pivotal areas including motivation of the child, responding to multiple cues, self-management, and self-initiation (Vismara & Bogin, 2009). PRT is typically play-based, child-led and can be incorporated into day-to-day activities. There is evidence PRT can be used in a variety of settings including home and school and in one-on-one sessions or group sessions. Both DTT and PRT use the ABA pattern of behavior, antecedent-behavior-consequence, to determine the function of a behavior and tailor an intervention. Visual Supports (VS) provides concrete visual cues that provide information about a routine, activity, and/or support skill demonstration that can take a number of forms and functions (Wong et al., 2015). Visual supports are typically divided into three categories including visual boundaries (e.g., classroom arrangement), visual cues (e.g., choice boards and visual instructions) and visual schedules (e.g., individual and classroom schedules). DTT and PRT were teacher or staff-delivered as one-on-one intervention sessions that lasted approximately 10–15 minutes with a student with ASD in the classroom. VS included visual prompts that were used classroom-wide throughout the day.
Procedure
Institutional review boards at each university and each school district approved the study. Research team members met with school district officials to explain the study and request a list of elementary schools with special education classrooms for children with ASD. Subsequently, principals were contacted at each prospective school to obtain consent for their school to participate in the study. After receiving approval from the principal, consent was obtained by teachers and school staff to participate in the study.
Teachers and classroom staff participated in a two-day in-person didactic group training on DTT, PRT, and VS led by graduate-level clinicians prior to the school year. The training session focused on strategies for implementing the EBP; participants were given access to training manuals, curriculum, and given time to develop materials such as visual schedules. Following initial training, teachers and staff also received ongoing monthly two-hour coaching sessions on the EBPs they were implementing in their classroom. Complete training and coaching procedures can be found in previous studies (Locke et al., 2016; Locke et al., 2019; Pellecchia et al., 2016). All participants at each school completed study measures (i.e., general and implementation leadership and implementation climate) at the beginning of the school year and were offered $50 USD for their time. Throughout the middle of the school year two classroom observations were conducted approximately two months apart by a research team member in order to assess fidelity to the EBP used in the classroom.
Measures
Demographic questionnaire.
Participants completed a questionnaire about their gender, age, race/ethnicity, educational attainment, years of teaching experience, experience working with children with ASD, and special education certification.
Leadership.
Participants completed the multifactor leadership questionnaire (MLQ; Bass & Avolio, 1995), a 36-item psychometrically validated measure of general leadership. Participants rated each item on a five-point Likert-type scale to indicate the frequency of leader behaviors from (0) “not at all” to (4) “frequently”. Principals self-rated each statement on their behaviors while teachers and classroom staff rated each statement about their principal. Sample items from the leader form include: “I talk optimistically about the future”, “I spend time teaching and coaching”, and “I avoid making decisions”. Sample items from the staff form include: “talks optimistically about the future”, “spends time teaching and coaching”, and “avoids making decisions”. Five subscales were used including transformational leadership (20 items; α=0.96), contingent reward (four items, α=0.85), management by exception active (four items, α=0.68), management by exception passive (four items, α=0.76), and laissez-faire/avoidant (four items, α=0.81; Stadnick et al., 2019). In the current study, data were available for 262 participants.
Implementation climate.
The implementation climate scale (ICS) is an 18-item scale that measures strategic implementation climate (Ehrhart et al., 2014). Ratings range from (0) “not at all” to (4) “very great extent”. The school-based version of the ICS was used, which was adapted for use in the school context (Lyon et al., 2018). The ICS is psychometrically validated and reliable (α = 0.81–0.91; Ehrhart et al., 2014). Psychometric properties were upheld for use in schools (Lyon et al., 2018; Locke et al., 2019). Example items include “people in this school think that the implementation of EBPs is important”, “this school provides EBP trainings or in-services”, and “teachers/school staff who use EBPs are held in high esteem in this school”. The ICS total score was used, which is the mean of the six subscales of the instrument (focus on EBPs, educational support for EBPs, recognition for EBPs, rewards for EBPs, selection for EBPs, and selection for openness) because the individual subscales were highly correlated (average correlation = 0.47; all correlations p < 0.05; Locke et al., 2019). In the current study, data were available for 275 participants. Principal scores were used individually, while scores for teachers and classroom staff were aggregated to the classroom-level and the school-level.
Fidelity.
Fidelity of EBP implementation was measured in two ways, accuracy (or adherence) and intensity (or dose). Accuracy refers to how well the teachers and staff implemented components of each EBP, while intensity refers to how often the EBP was implemented in the classroom. For accuracy, a research assistant rated fidelity of DTT, PRT, and VS using a checklist previously developed for each specific EBP during two 10 to 15-minute direct observations in each classroom (Locke et al., 2016; Locke et al., 2019; Pellecchia et al., 2016). The checklists consisted of 11 items for DTT (α= .97), 17 items for PRT (α= .97), and 10 items for VS (α= .93). Items on each checklist were rated using a five-point Likert scale from (0) “does not implement” to (4) “highly accurate implementation.” A total score was computed for each observation period and then averaged across the two observations to yield one accuracy score for each EBP in each classroom. Accuracy fidelity assessments did not focus on a specific teacher or staff, but rather assessed any teacher or staff member implementing the EBP during the observation period. Intensity was measured using teacher and staff report on a five-point Likert scale ranging from (0) “less than one time per week” to (4) “two times per day” for PRT and DTT. Since VS is primarily used during transitions, the Likert scale ranged from (0) “never” to (4) “every transition”. Teachers reported on the intensity with which the EBP was delivered for every student with ASD in their classroom during the past week. A research assistant visited each classroom monthly to gather the teacher- and staff-reported intensity data and averaged ratings across students to determine one classroom score for each EBP. These monthly classroom scores were averaged across months 5–9 of the school year to yield one intensity score for each EBP. In the current study, data were available for 66 schools and 70 classrooms. Research assistants were trained to 90% reliability with each other and the trainer for each EBP fidelity checklist through didactic instruction and coding of training videos with an established trainer, prior to conducting field observations.
Data Analytic Plan
Study data were collected using Research Electronic Data Capture (REDCap), a secure, web-based application designed to support data capture for research studies (Harris et al., 2009). For this study, we started with the individual (person-oriented) leadership profile probabilities (i.e., a probability of profile membership was calculated for each participant) that were calculated from MLQ scores from the sample of all principals, teachers and staff used in Stadnick et al., (2019). We then aggregated the individual profile probabilities to determine one profile (disengaged, optimal or undifferentiated) for each school. Data aggregation precluded schools with fewer than three respondents from inclusion in this study. Using this method, no school had a categorization of disengaged, thus this study only focuses on the optimal (n = 50) and undifferentiated (n = 16) profiles. This study sought to: 1) evaluate the association between school leadership profiles and fidelity of EBP implementation for three EBPs; and 2) examine the role of implementation climate as a mediator in this association. Given the nested nature of the data (classrooms within schools), null models were conducted for each fidelity outcome to determine if there was a significant amount of variance attributable to the school level. Results showed a substantial amount of variance at the school level for all outcomes (ICCs = .74 to .89). Therefore, all multilevel models were conducted with consideration of two levels, with classrooms at level 1 (n = 223 teachers/staff) and schools at level 2 (n = 66). Level 1 (classroom) variables consisted of classroom intensity and accuracy fidelity to each of the three EBPs and teacher/staff-reported implementation climate. Level 2 (school) variables included principal characteristics, including leadership profiles (there was one principal per school) and principal-reported implementation climate. No significant associations were found between teacher and staff demographics, training, or experience and fidelity (see Supplemental Table 1), therefore these variables were not included as covariates in the models.
To explore possible associations between leadership profiles and EBP fidelity, (Aim 1) a multilevel structural equation model was used, with the dichotomous variable of leadership profile (optimal vs. undifferentiated) predicting fidelity (intensity and accuracy) for each of the three EBPs, resulting in six models. For Aim 2, a multilevel structural equation model was used to examine the possible mediating role of implementation climate in the relationship between leadership profiles and fidelity (intensity and accuracy) for each of the three EBPs, resulting in six models. Supplemental Figure 1 portrays the multilevel structural equation model for Aim 1 and 2.
Results
Aim 1. Evaluate the association between school leadership profiles and fidelity of EBP implementation
Table 2 and Figure 1 show the mean fidelity ratings per school for optimal and undifferentiated leadership profiles. To investigate whether there were statistically significant differences in fidelity ratings of accuracy and intensity between schools with principals with optimal and undifferentiated leadership profiles, multilevel structural equation models were conducted, with the dichotomous variable of leadership profile (optimal vs. undifferentiated) predicting fidelity accuracy and intensity for each of the three EBPs. Table 3 shows the results of these models. There were no significant differences between schools with optimal and undifferentiated leaders with regard to fidelity accuracy and intensity for DTT and VS. There was a significant difference in fidelity accuracy for PRT (B = .80, SE = .40, p < .05), with schools with principals perceived as exhibiting an optimal leadership style showing higher observed ratings of teacher and staff fidelity accuracy. In contrast, there were no significant differences between schools based on leadership for fidelity intensity for PRT.
Table 2.
Descriptive statistics for fidelity ratings per school for each EBP for optimal and undifferentiated leadership profiles
| Fidelity Ratings | Optimal Leadership |
Undifferentiated Leadership |
|---|---|---|
| M (SD) | M (SD) | |
| Discrete Trial (DTT) | ||
| Fidelity intensity | 1.38 (1.23) | 1.44 (1.01) |
| Fidelity accuracy | 2.29 (1.18) | 1.86 (1.15) |
| Pivotal Response Training (PRT) | ||
| Fidelity intensity | .67 (.81) | .75 (.62) |
| Fidelity accuracy | 2.09 (.95) | 1.39 (1.11) |
| Visual Supports (VS) | ||
| Fidelity intensity | 1.88 (1.36) | 1.90 (1.45) |
| Fidelity accuracy | 1.62 (.99) | 1.79 (1.17) |
Figure 1.
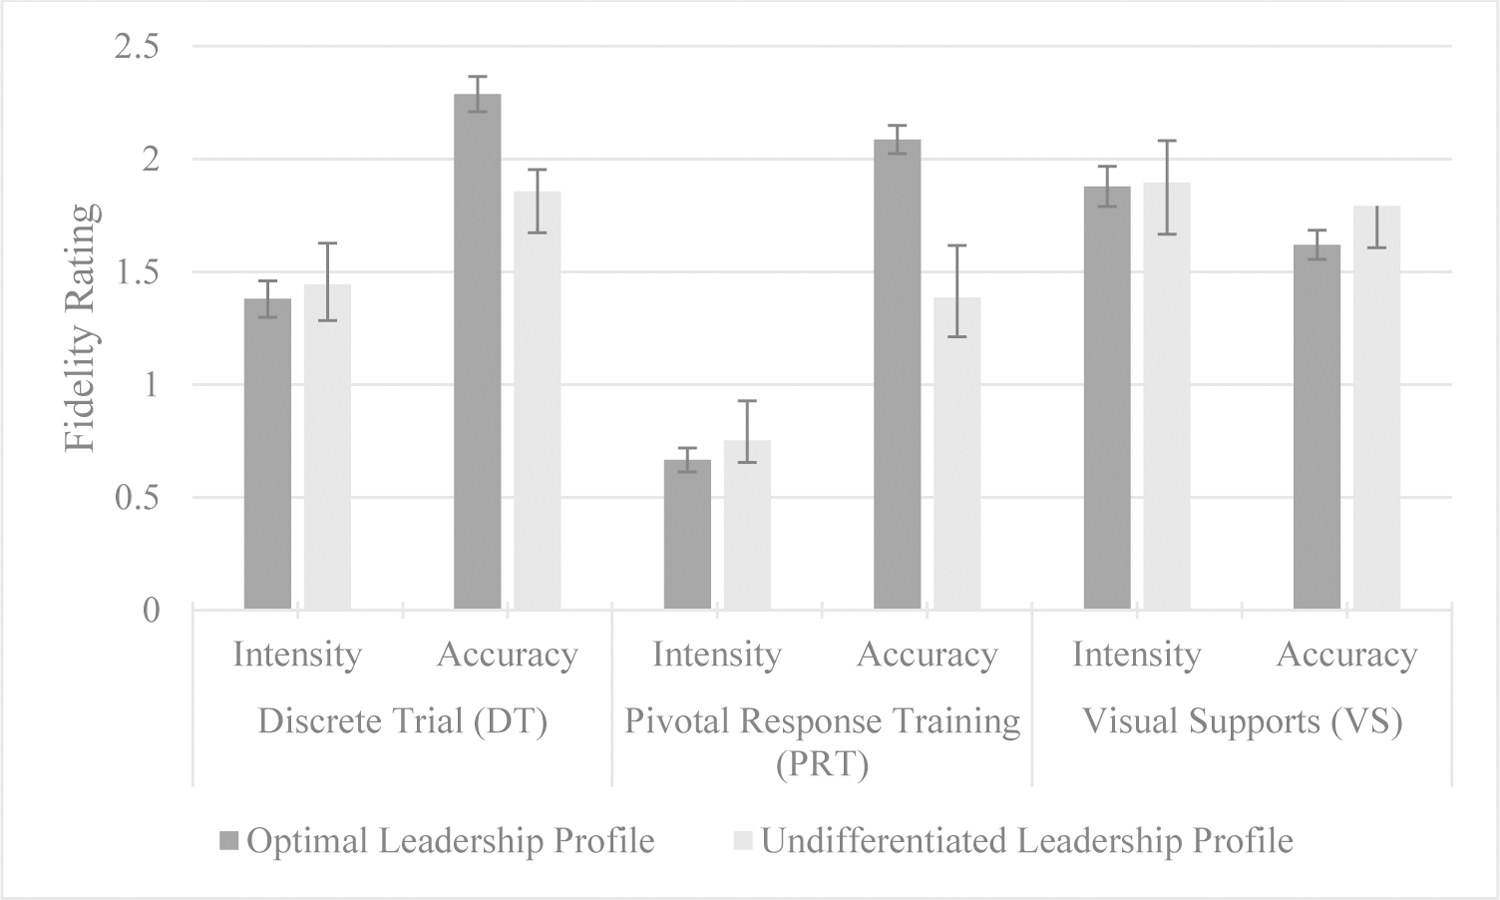
Fidelity ratings per school for each EBP for optimal and undifferentiated leadership profiles.
Table 3.
Multilevel structural equation models predicting differences in fidelity ratings for optimal and undifferentiated leadership profiles
| Discrete Trial (DTT) |
Pivotal Response Training (PRT) |
Visual Supports (VS) |
||||
|---|---|---|---|---|---|---|
| Intensity | Accuracy | Intensity | Accuracy | Intensity | Accuracy | |
| B (SE) | B (SE) | B (SE) | B (SE) | B (SE) | B (SE) | |
| Optimal Leadership (vs. Undifferentiated) | −03 (.38) | .21 (.41) | −.002 (.25) | .80 (.40)* | .05 (.50) | −.09 (.35) |
Note. All analyses controlled for school size, percentage of minority students per school, and percentage free and reduced lunch per school.
p < .01,
p < .05.
Aim 2. Examine the role of implementation climate as a mediator in the association between leadership and fidelity
To explore the possible influence of principal- and teacher/staff-reported implementation climate on the relationship between leadership profiles and fidelity, multilevel structural equation models were conducted for EBP fidelity accuracy and intensity (see Table 4). In all of the models there was a significant association between leadership profiles and teacher/staff-reported implementation climate, with optimal leadership profiles linked to more positive teacher/staff-reported implementation climate, compared with undifferentiated profiles (B = .85, SE = .25, p <.01). However, the relationship between leadership profiles and fidelity became non-significant in these models, and there were no other significant associations between variables.
Table 4.
Multilevel structural equation models examining associations between fidelity, leadership profiles, and principal- and teacher-reported implementation climate
| Variables | Discrete Trial (DTT) |
Pivotal Response (PRT) |
Visual Supports (VS) |
|||
|---|---|---|---|---|---|---|
| Intensity | Accuracy | Intensity | Accuracy | Intensity | Accuracy | |
| B (SE) | B (SE) | B (SE) | B (SE) | B (SE) | B (SE) | |
| Classroom (Within) Level: | ||||||
| Residual variances | ||||||
| Fidelity rating | .02 (.02) | .08 (.05) | .003 (.002) | .10 (.07) | .19 (.18) | .08 (.07) |
| School (Between) Level: | ||||||
| Slope ON | ||||||
| Optimal leadership profile | 2.41 (1.93) | 3.99 (2.34) | −2.49 (3.09) | 4.62 (3.58) | −2.53 (5.75) | −2.18 (3.24) |
| Principal-reported climate | −2.65 (1.05)* | −2.37 (1.89)* | −2.20 (1.89) | −2.56 (1.56) | −1.19 (2.39) | .66 (1.28) |
| Teacher-reported climate | .15 (.86) | .46 (.93) | 1.85 (1.03) | 2.14 (1.25) | −.47 (1.31) | .10 (1.10) |
| Fidelity rating ON | ||||||
| Optimal leadership profile | .13 (.50) | .29 (.50) | .24 (.32) | .77 (.45) | .004 (.63) | −.07 (.43) |
| Principal-reported climate | −.17 (.25) | −.01 (.28) | −.29 (.22) | −.17 (.29) | .12 (.36) | −.05 (.26) |
| Teacher-reported climate | −.11 (.18) | −.03 (.27) | −.17 (.14) | .14 (.25) | −.05 (.31) | .01 (.22) |
| Principal-reported climate ON | ||||||
| Optimal leadership profile | .38 (.31) | .38 (.31) | .36 (.32) | .36 (.31) | .39 (.31) | .39 (.32) |
| Teacher-reported climate ON | ||||||
| Optimal leadership profile | .85 (.25)** | .85 (.25)** | .85 (.25)** | .85 (.25)** | .85 (.25)** | .85 (.25)** |
| Principal-reported climate WITH | ||||||
| Teacher-reported climate | −.02 (.06) | −.02 (.06) | −.02 (.06) | −.03 (.06) | −.03 (.06) | −.02 (.06) |
| Intercepts | ||||||
| Principal-reported climate | 1.69 (.30)** | 1.68 (.31)** | 1.71 (.31)** | 1.69 (.30)** | 1.68 (.30)** | 1.68 (.31)** |
| Teacher-reported climate | 1.26 (.24)** | 1.26 (.24)** | 1.26 (.24)** | 1.26 (.24)** | 1.26 (.24)** | 1.26 (.24)** |
| Fidelity rating | 3.08 (.62)** | 2.60 (.97)** | 1.63 (.63)* | 1.31 (.81) | 1.75 (1.06) | 2.32 (.75)** |
| Slope | .82 (4.22) | 2.34 (4.75) | −11.46 (4.77)* | −6.27 (7.92) | 1.81 (6.52) | −2.13 (5.51) |
| Residual variances | ||||||
| Principal-reported climate | .34 (.06)** | .35 (.06)** | .34 (.05)** | .35 (.06)** | .35 (.06)** | .35 (.06)** |
| Teacher-reported climate | .36 (.06)** | .35 (.06)** | .36 (.06)** | .36 (.06)** | .36 (.06)** | .36 (.06)** |
| Fidelity rating | .82 (.17)** | 1.32 (.18)** | .56 (.13)** | .89 (.15)** | 1.75 (.20)** | .93 (.12)** |
| Slope | 1.38 (.71) | 2.49 (.74)** | 4.18 (3.04) | 3.72 (2.79) | 4.06 (2.12) | 3.16 (2.21) |
Note. All analyses controlled for school size, percentage of minority students per school, and percentage free and reduced lunch per school.
p < .01,
p < .05.
Discussion
This study examined the associations between leadership and implementation climate and fidelity of implementation of three EBPs (i.e., DTT, PRT, and VS) for children with ASD in self-contained elementary settings. Teachers and staff at schools with an optimal principal leadership profile had higher EBP fidelity accuracy (adherence) for PRT; however, this association became non-significant in models that included implementation climate. Consistent with Stadnick et al., (2019), optimal leadership was significantly associated with higher teacher/staff-reported implementation climate. However, there were no significant associations between principal- and teacher/staff-reported implementation climate and EBP fidelity. Overall, the results of this study indicate that the role of principal leadership in EBP implementation is complex, which have implications for fostering a conducive organizational implementation context in schools (Lyon et al., 2018).
Our findings suggest that optimal leadership was associated with higher fidelity of PRT implementation and not DTT or VS. We believe that the structure and components of the interventions may play a role. Research suggests that interventions that can be implemented with minimal support and training might be less influenced by organizational factors (Weiner, Belden, Bergmire, & Johnston, 2011). DTT and VS may be interventions that fit these criteria. DTT is a highly structured intervention with prescribed and scripted lesson plans and materials that may require less ongoing support once teachers and staff are trained. VS implementation requires initial set up (e.g., developing materials and setting up the classroom), but may be easily sustained with minimal support. However, PRT is a naturalistic intervention that relies on the abilities of the teacher or staff to engage in creative and imaginative play, make decisions in the moment, and adapt to student behaviors and preferences. Because of the dynamic and flexible nature of PRT, it may require more intensive support and ongoing supervision, and teachers and staff may potentially benefit from certain leader behaviors (e.g., ongoing feedback, resources, protected time for supervision or consultation) to ensure its successful use with children with ASD. Additionally, DTT and VS may more easily align with traditional approaches already in use in classrooms and schools (visuals and one-on-one structured time) and be naturally supported by principals unfamiliar with EBPs for ASD, while a less familiar and more complex EBP, like PRT, might require optimal leaders that go beyond general support to ensure successful implementation. It is important to note that fidelity of all EBPs was low, so it is possible that there are other factors involved that affect EBP delivery by classroom teachers and staff. At the organizational level, it might be that the schools have limited resources for sustained use, while at the individual level teachers and classroom staff might have low motivation or competing responsibilities that inhibit their use of the EBP. Furthermore, the complexity of the EBP also might make it challenging for teachers to implement the EBP, which was supported by our data indicating PRT had the lowest fidelity across the EBPs.
The results indicate that the optimal leadership pattern was associated with higher teacher/staff-reported implementation climate as compared to the undifferentiated leadership pattern. This is consistent with research in community service settings suggesting that leadership plays a key role in driving strong implementation climates (Stadnick et al., 2019; Aarons et al., 2014). Aarons and colleagues (2017) theorize that general and implementation leadership lead to positive implementation climate, which in turn leads to greater EBP use (Ehrhart et al., 2014). Within schools, it is possible that principals who often do not have adequate training in special education may not provide positive implementation climates to support EBP implementation with fidelity for children with ASD (DiPaola & Walther-Thomas, 2003). It might be that implementation climate mediates the relationship between leadership and fidelity; in this study the significant relationship between optimal leadership and fidelity of PRT becomes non-significant when implementation climate is included in the model. In this study, only 13% of principals reported having specialized ASD training. Research suggests that principals may need ongoing professional development to create learning environments and implementation climates conducive to success for students with disabilities (DiPaola & Walther-Thomas, 2003). Principals may benefit from targeted leadership training on how to foster positive implementation climates for EBP implementation. One such intervention, the Leadership and Organizational Change for Implementation (LOCI), is an organizational implementation strategy that targets both general and implementation-specific leadership to improve the organizational context to support EBP implementation (Aarons, Ehrhart, Farahnak, & Finn, 2015; Aarons, Ehrhart, Torres, Finn, & Beidas, 2017). LOCI creates a positive general and strategic implementation climate that, in turn, is theorized to change EBP fidelity. LOCI has been tested in health service settings and is currently being tested in school settings specifically for implementation of EBPs for ASD (Brookman-Frazee & Stahmer, 2018).
Lastly, the results also indicate that there were no significant associations between neither principal- nor teacher/staff-reported implementation climate and EBP implementation. While a significant association emerged between optimal leadership and PRT accuracy, this became non-significant in subsequent models. While research in other community service settings have found associations between strong leadership and EBP implementation (Aarons et al., 2014), within the school context, principals might be too far removed from the classroom to influence teacher and staff implementation behaviors. Based on the profiles derived by Stadnick et al., (2019), optimal leader behaviors perceived by teachers, staff, and principals were characterized by transformational and transactional leader behaviors, generally, and not specifically directed towards EBP implementation efforts. Although principals are “first-level” leaders (Aarons et al., 2017), in that they manage and supervise teachers’ and staff’s direct services to students, the vast array of services provided in schools may not allow principals to develop the depth and breadth of knowledge and skills to provide thorough intensive implementation support to teachers and staff of children with ASD. It is imperative to further investigate the leadership landscape in school settings, specifically in special education where informal leaders (e.g., special education liaison, school psychologist, teacher coach, etc.) may play important roles in supporting EBP use. For example, although principals generally evaluate teacher and staff performance and are responsible for promotions and rewards, a more proximal leader to teacher and staff implementation behaviors may be a program or autism specialist, who is trained to work with children with ASD and able to provide coaching and direct feedback to teachers and staff (Brookman-Frazee & Stahmer, 2018; Brookman-Frazee et al., 2019). Further research is needed to explore informal leaders (e.g., implementation influencers, implementation champions) in the complex leadership structure of the special education system.
Implications
Although additional research is needed, our findings suggest important implications for implementation of EBPs for ASD in schools and the development of targeted implementation strategies more broadly. First, our results suggest more research is needed that investigates how the components and complexity of an EBP may affect implementation fidelity by professionals across varying settings. It is possible that even with optimal leadership and a strong implementation climate, the complexity of an EBP is a determining factor in successful implementation. Second, consistent with prior research, our results suggest optimal leadership is associated with implementation climate. Future research can further examine leadership qualities, including implementation leadership, that booster implementation climate and the relationship between implementation climate and fidelity. Lastly, our results indicate further research is needed in examining the leadership structure in the school system and more broadly across organizations to understand the effect on implementation outcomes and to inform leadership training. Furthermore, it is possible that different qualities make an “optimal” leader depending on organizational structure. This is an important area to continue to study as trainings and frameworks for cultivating leadership conducive to implementation of EBPs are developed. Using implementation science to examine the implementation of EBPs in different contexts and settings advances the field by identifying inner- and outer-context factors that uniquely affect implementation.
Limitations
Several limitations should be noted. First, several measures (general and implementation leadership, implementation climate, leadership profiles and fidelity for intensity (dose)) were assessed through self-report, which potentially introduces a shared measurement issue and bias. Second, leadership profile classifications were determined by averaging the probabilities across participants within each school. In doing so, a majority of schools were classified as the optimal profile and no schools were classified as disengaged as originally identified in Stadnick et al., (2019), creating two disproportionate comparison groups (optimal vs. undifferentiated). Third, because teachers and staff work as a team within the classroom to implement all EBPs, scores for each construct were aggregated from members of the special education sector, which differs from the general education context. Therefore, this may not be an accurate representation of the general or implementation leadership and implementation climate of the entire school. In addition, data aggregation precluded schools with fewer than three respondents from inclusion in this study. Fourth, our sample was geographically located in the northwestern and northeastern United States, two different contexts. Future studies should include representative samples from regions across the United States in order to ensure generalization. Fifth, fidelity was overall low for all three EBPs, which might have precluded our analysis from detecting significant relationships between implementation climate and fidelity. Further research should explore the complex factors mitigating fidelity of implementation for EBPs in special education classrooms. Sixth, this study did not have data available on training and coaching fidelity. Future research should investigate how varying levels or methods of training and coaching might impact implementation of EBPs. Seventh, it is possible observers drifted in their observations of fidelity throughout the school year. Eighth, future research might consider using a continuous measure of leadership to examine the relationships posed in this study. Finally, the non-significant effects from the multilevel structural equation models do not guarantee that a meaningful effect does not exist. More specifically, a power analysis is required to estimate the probability of detecting a given effect size for our current sample size (70 classrooms nested in 66 schools). Since approaches for calculating power in multilevel structural equation modeling exist are unclear, future methods-related research focused on power analyses for multilevel structural equation modeling is needed to identify estimate of power for research involving implementation of EBPs in school settings.
Further research is warranted to explore the relative contribution of organizational factors that influence EBP implementation for children with ASD in schools. The results of this study suggest that perceptions of principal leadership behavior are not directly related to EBP implementation for children with ASD in special education settings. However, they may play a role in creating a positive implementation climate to facilitate EBP use for direct-care providers (teachers and staff) and may potentially benefit from targeted leadership training to improve EBP implementation conditions. Future research should focus on unpacking the complex leadership structure (e.g., the influence of perceived leadership behaviors exhibited by mid-level leaders such as teacher supervisors) in special education that may be distally related to EBP use.
Supplementary Material
Public Significance:
This study contributes to the field of implementation science by identifying pathways by which leadership and implementation climate may affect the fidelity of evidence-based practice implementation in schools. Findings of this study offer the potential to inform targeted implementation strategies to bolster successful evidence-based practice implementation and sustainment in public school settings.
Acknowledgments
Funding for this work was supported by a grant from the National Institute of Mental Health K01 MH100199 (Locke).
Footnotes
Editor’s note. This article is part of a special issue, “Expanding the Impact of Psychology Through Implementation Science,” published in the November 2020 issue of American Psychologist. Shannon Wiltsey Stirman and Rinad S. Beidas served as editors of the special issue, with Anne E. Kazak as advisory editor.
Disclosures: The authors declare that they have no conflict of interest.
References
- Aarons GA, Ehrhart MG, Farahnak LR, & Sklar M (2014). Aligning leadership across systems and organizations to develop a strategic climate for evidence-based practice implementation. Annual Review of Public Health, 35(1), 255–274. 10.1146/annurev-publhealth-032013-182447 [DOI] [PMC free article] [PubMed] [Google Scholar]
- Aarons GA, Ehrhart MG, Farahnak LR, & Finn N (2015). Implementation leadership: Confirmatory factor analysis and supervisor-clinician discrepancy in ratings on the Implementation Leadership Scale (ILS). Implementation Science, 10(S1). 10.1186/1748-5908-10-s1-a70 [DOI] [Google Scholar]
- Aarons GA, Ehrhart MG, Torres EM, Finn NK, & Beidas RS (2017). The humble leader: Association of discrepancies in leader and follower ratings of implementation leadership with organizational climate in mental health. Psychiatric Services, 68, 115–122. 10.1176/appi.ps.201600062 [DOI] [PMC free article] [PubMed] [Google Scholar]
- American Psychological Association. (2013). Diagnostic and statistical manual of mental disorders (5th ed.). Arlington, VA: American Psychiatric Publishing. [Google Scholar]
- Arnold KA, Connelly CE, Gellatly IR, Walsh MM, & Withey MJ (2017). Using a pattern-oriented approach to study leaders: Implications for burnout and perceived role demand. Journal of Organizational Behavior, 38, 1038–1056. 10.1002/job.2182 [DOI] [Google Scholar]
- Baio J, Wiggins L, Christensen DL, et al. (2018). Prevalence of autism spectrum disorder among children aged 8 years—Autism and developmental disabilities monitoring network, 11 sites, United States, 2014. Morbidity and Mortality Weekly Report: Surveillance Summaries 67(6), 1–23. 10.15585/mmwr.ss6706a1 [DOI] [PMC free article] [PubMed] [Google Scholar]
- Bass BM, & Avolio BJ (1995). MLQ: Multifactor Leadership Questionnaire (Technical report). Binghamton, NY: Center for Leadership Studies, Binghamton University. [Google Scholar]
- Brookman-Frazee L, Baker-Ericzén M, Stahmer A, Mandell D, Haine RA, & Hough RL (2009). Involvement of youths with autism spectrum disorders or intellectual disabilities in multiple public service systems. Journal of Mental Health Research in Intellectual Disabilities, 2(3), 201–219. 10.1080/19315860902741542 [DOI] [PMC free article] [PubMed] [Google Scholar]
- Brookman-Frazee & Stahmer, 2018. Effectiveness of a multi-level implementation strategy for ASD interventions: Study protocol for two linked cluster randomized trials. Implementation Science, 13(1). 10.1186/s13012-018-0757-2 [DOI] [PMC free article] [PubMed] [Google Scholar]
- Brookman-Frazee L, Chlebowski C, Suhrheinrich J, Finn N, Dickson KS, Aarons GA, Stahmer A (2019). Characterizing shared and unique implementation influences in two community services systems for autism: Applying the EPIS framework to two large-scale autism intervention community effectiveness trials. Administration and Policy in Mental Health and Mental Health Services Research. 10.1007/s10488-019-00931-4 [DOI] [PMC free article] [PubMed]
- California Autism Professional Training and Information Network. (2017). Welcome. Retrieved from http://www.captain.ca.gov/
- Camburn E, Rowan B, & Taylor JE (2003). Distributed leadership in schools: The case of elementary schools adopting comprehensive school reform models. Educational Evaluation and Policy Analysis, 25, 347–373. 10.3102/01623737025004347 [DOI] [Google Scholar]
- Dingfelder HE, & Mandell DS (2011). Bridging the research-to-practice gap in autism intervention: An application of diffusion of innovation theory. Journal of Autism and Developmental Disorders, 41(5), 597–609. 10.1007/s10803-010-1081-0 [DOI] [PMC free article] [PubMed] [Google Scholar]
- DiPaola MF, & Walther-Thomas C (2003). Principals and special education: The critical role of school leaders (COPPSE Document No. IB-7). Gainesville: Center on Personnel Studies in Special Education, University of Florida. [Google Scholar]
- Doucet O, Fredette M, Simard G, & Tremblay M (2015). Leader profiles and their effectiveness on employees’ outcomes. Human Performance, 28, 244–264. 10.1080/08959285.2015.1021039 [DOI] [Google Scholar]
- Ehrhart MG, Aarons GA, & Farahnak LR (2014). Assessing the organizational context for EBP implementation: The development and validity testing of the Implementation Climate Scale (ICS). Implementation Science, 9(1), 157–168. 10.1186/s13012-014-0157-1 [DOI] [PMC free article] [PubMed] [Google Scholar]
- Fixsen D, Blase K, Metz A, & Dyke MV (2013). Statewide implementation of evidence-based programs. Exceptional Children, 79(3), 213–230. 10.1177/001440291307900206 [DOI] [Google Scholar]
- Forman SG, & Barakat NM (2011). Cognitive-behavioral therapy in the schools: Bringing research to practice through effective implementation. Psychology in the Schools, 48(3), 283–296. 10.1002/pits.20547 [DOI] [Google Scholar]
- Green AE, Albanese BJ, Cafri G, & Aarons GA (2014). Leadership, organizational climate, and working alliance in a children’s mental health service system. Community Mental Health Journal, 50(7), 771–777. 10.1007/s10597-013-9668-5 [DOI] [PMC free article] [PubMed] [Google Scholar]
- Harn B, Parisi D, & Stoolmiller M (2013). Balancing fidelity with flexibility and fit: What do we really know about fidelity of implementation in schools? Exceptional Children, 79(2), 181–193. 10.1177/001440291307900204 [DOI] [Google Scholar]
- Harris PA, Taylor R, Thielke R, Payne J, Gonzalez N, & Conde JG (2009). Research electronic data capture (REDCap)—A metadata-driven methodology and workflow process for providing translational research informatics support. Journal of Biomedical Informatics, 42(2), 377–381. 10.1016/j.jbi.2008.08.010 [DOI] [PMC free article] [PubMed] [Google Scholar]
- Individuals with Disabilities Education Act, 20 U.S.C. § 1400 (2004).
- Kratz HE, Stahmer A, Xie M, Marcus SC, Pellecchia M, Locke J, … Mandell DS (2019). The effect of implementation climate on program fidelity and student outcomes in autism support classrooms. Journal of Consulting and Clinical Psychology, 87(3), 270–281. 10.1037/ccp0000368 [DOI] [PMC free article] [PubMed] [Google Scholar]
- Locke J, Beidas RS, Marcus S, Stahmer A, Aarons GA, Lyon AR, & … Mandell DS (2016). A mixed methods study of individual and organizational factors that affect implementation of interventions for children with autism in public schools. Implementation Science, 11(1), 135. 10.1186/s13012-016-0501-8 [DOI] [PMC free article] [PubMed] [Google Scholar]
- Locke J, Kratz H, Reisinger E, & Mandell D (2014). Implementation of evidence-based practices for children with autism spectrum disorders in public schools. In Beidas R & Kendall P (Eds.), Child and adolescent therapy: Dissemination and implementation of empirically supported treatments (261–276). New York: Oxford University Press. [Google Scholar]
- Locke J, Lawson GM, Beidas RS, Aarons GA, Xie M, Lyon AR, … Mandell DS (2019). Individual and organizational factors that affect implementation of evidence-based practices for children with autism in public schools: a cross-sectional observational study. Implementation Science, 14(1). 10.1186/s13012-019-0877-3 [DOI] [PMC free article] [PubMed] [Google Scholar]
- Locke J, Olsen A, Wideman R, Downey MM, Kretzmann M, Kasari C, & Mandell DS (2015). A tangled web: The challenges of implementing an evidence-based social engagement intervention for children with autism in urban public school settings. Behavior Therapy, 46(1), 54–67. 10.1016/j.beth.2014.05.001 [DOI] [PMC free article] [PubMed] [Google Scholar]
- Lyon AR, Cook CR, Brown EC, Locke J, Davis C, Ehrhart M, & Aarons GA (2018). Assessing organizational implementation context in the education sector: confirmatory factor analysis of measures of implementation leadership, climate, and citizenship. Implementation Science, 13(1). 10.1186/s13012-017-0705-6 [DOI] [PMC free article] [PubMed] [Google Scholar]
- Mandell DS, Stahmer AC, Shin S, Xie M, Reisinger E, & Marcus SC (2013). The role of treatment fidelity on outcomes during a randomized field trial of an autism intervention. Autism, 17(3), 281–295. 10.1177/1362361312473666 [DOI] [PMC free article] [PubMed] [Google Scholar]
- Michaelis B, Stegmaier R & Sonntag K (2010). Shedding light on followers’ innovation implementation behavior. Journal of Managerial Psychology, 25(4), 408–429. 10.1108/02683941011035304 [DOI] [Google Scholar]
- National Autism Center. (2015). Findings and conclusions: National standards project, phase 2. Randolph, MA: Author. [Google Scholar]
- National Center for Education Statistics. (2018). Children and youth with disabilities. Retrieved from https://nces.ed.gov/programs/coe/indicator_cgg.asp
- National Professional Development Center on Autism Spectrum Disorder. (2007). NPDC project background. Retrieved from https://autismpdc.fpg.unc.edu/national-professional-development-center-autism-spectrum-disorder
- No Child Left Behind Act of 2001, P.L. 107–110, 20 U.S.C. § 6319 (2002).
- Odom SL, Duda MA, Kucharczyk S, Cox AW, & Stabel A (2014). Applying an implementation science framework for adoption of a comprehensive program for high school students with autism spectrum disorder. Remedial and Special Education, 35(2), 123–132. 10.1177/0741932513519826 [DOI] [Google Scholar]
- Pellecchia M, Connell JE, Beidas RS, Xie M, Marcus SC, & Mandell DS (2015). Dismantling the active ingredients of an intervention for children with autism. Journal of Autism and Developmental Disorders, 45(9), 2917–2927. 10.1007/s10803-015-2455-0 [DOI] [PMC free article] [PubMed] [Google Scholar]
- Pellecchia M, Connell JE, Kerns CM, Xie M, Marcus SC, & Mandell DS (2016). Child characteristics associated with outcome for children with autism in a school-based behavioral intervention. Autism, 20(3), 321–329. 10.1177/1362361315577518 [DOI] [PMC free article] [PubMed] [Google Scholar]
- Proctor E, Silmere H, Raghavan R, Hovmand P, Aarons G, Bunger A, … Hensley M (2011). Outcomes for implementation research: Conceptual distinctions, measurement challenges, and research agenda. Administration and Policy in Mental Health and Mental Health Services Research, 38(2), 65–76. 10.1007/s10488-010-0319-7 [DOI] [PMC free article] [PubMed] [Google Scholar]
- Sam A, & AFIRM Team. (2016). Discrete Trial Training. Chapel Hill, NC: National Professional Development Center on Autism Spectrum Disorder, FPG Child Development Center, University of North Carolina. Retrieved from http://afirm.fpg.unc.edu/discrete-trial-training [Google Scholar]
- Sloan RP, & Gruman JC (1988). Participation in workplace health promotion programs: The contribution of health and organizational factors. Health Education Quarterly, 15(3), 269–288. 10.1177/109019818801500303 [DOI] [PubMed] [Google Scholar]
- Smith T (2001). Discrete trial training in the treatment of autism. Focus on Autism and Other Developmental Disabilities, 16(2), 86–92. 10.1177/108835760101600204 [DOI] [Google Scholar]
- Stadnick NA, Meza RD, Suhrheinrich J, Aarons GA, Brookman-Frazee L, Lyon AR, … Locke J (2019). Leadership profiles associated with the implementation of behavioral health evidence-based practices for autism spectrum disorder in schools. Autism, 23(8), 1957–1968. 10.1177/1362361319834398 [DOI] [PMC free article] [PubMed] [Google Scholar]
- Suhrheinrich J, Stahmer AC, Reed S, Schreibman L, Reisinger E, & Mandell D (2013). Implementation challenges in translating pivotal response training into community settings. Journal of Autism and Developmental Disorders, 43(12), 2970–2976. 10.1007/s10803-013-1826-7 [DOI] [PMC free article] [PubMed] [Google Scholar]
- Vismara LA, & Bogin J (2009). Steps for implementation: Pivotal response training. Sacramento, CA: The National Professional Development Center on Autism Spectrum Disorders, The M.I.N.D. Institute, The University of California at Davis School of Medicine. [Google Scholar]
- Weiner BJ, Belden CM, Bergmire DM, & Johnston M (2011). The meaning and measurement of implementation climate. Implementation Science, 6(1). 10.1186/1748-5908-6-78 [DOI] [PMC free article] [PubMed] [Google Scholar]
- Williams NJ, Frank HE, Frederick L, Beidas RS, Mandell DS, Aarons GA, … Locke J (2019). Organizational culture and climate profiles: relationships with fidelity to three evidence-based practices for autism in elementary schools. Implementation Science, 14(1). 10.1186/s13012-019-0863-9 [DOI] [PMC free article] [PubMed] [Google Scholar]
- Wong C, Odom S, Hume K, Cox A, Fettig A, Kucharczyk S, … Schultz T (2015). Evidence-based practices for children, youth, and young adults with Autism Spectrum Disorder: A comprehensive review. Journal of Autism & Developmental Disorders, 45(7), 1951–1966. 10.1007/s10803-014-2351-z [DOI] [PubMed] [Google Scholar]
Associated Data
This section collects any data citations, data availability statements, or supplementary materials included in this article.