Abstract
Alternans of cardiac action potential duration represent critical precursors for the development of life-threatening arrhythmias and sudden cardiac death. The system’s thermal state affects these electrical disorders requiring additional theoretical and experimental efforts to improve a patient-specific clinical understanding. In such a scenario, we generalize a recent work from Loppini et al. [Phys. Rev. E 100, 020201(R) (2019)] by performing an extended spatiotemporal correlation study. We consider high-resolution optical mapping recordings of canine ventricular wedges’ electrical activity at different temperatures and pacing frequencies. We aim to recommend the extracted characteristic length as a potential predictive index of cardiac alternans onset and evolution within a wide range of system states. In particular, we show that a reduction of temperature results in a drop of the characteristic length, confirming the impact of thermal instabilities on cardiac dynamics. Moreover, we theoretically investigate the use of such an index to identify and predict different alternans regimes. Finally, we propose a constitutive phenomenological law linking conduction velocity, characteristic length, and temperature in view of future numerical investigations.
Complex spatiotemporal dynamics of cardiac action potential (AP) duration (APD) have been shown to potentially induce irregular heart rhythms, such as tachycardia and fibrillation, life-threatening arrhythmias, and sudden cardiac death [1–4]. Electrical disturbances are supported by specific regimes, known as cardiac alternans, characterized by patterns of periodic beat-to-beat oscillations of APD emerging during fast electrical pacing. These rhythm disorders enhance spatial dispersion of repolarization, inducing large variations in the refractory period and greatly affect the wave-front conduction velocity (CV) of the cardiac excitation wave [5,6]. A direct link has been further shown experimentally [6–9] and theoretically [10,11] to T-wave alternans in the electrocardiogram signal [12,13] and the QRS [14], suggesting clinical importance in risk stratification for sudden cardiac death [15–17].
Understanding the nonlinear nature of electrical activity and the drivers of cardiac arrhythmias [18] in terms of variations of physical parameters (e.g., local heterogeneity and thermal state) in simplified systems [19,20] plays a key role in the development of medical devices for the monitoring and treatment of heart diseases [21–24]. Novel bioelectronic patches, for example, able to perform spatiotemporal mapping of the cardiac conduction system, can provide therapeutic capabilities, such as electrical pacing, thermal ablation, and cardiac monitoring [25–27]. As such, they require an advanced theoretical and modeling knowledge of the physics underlying the complexity of the cardiac tissue.
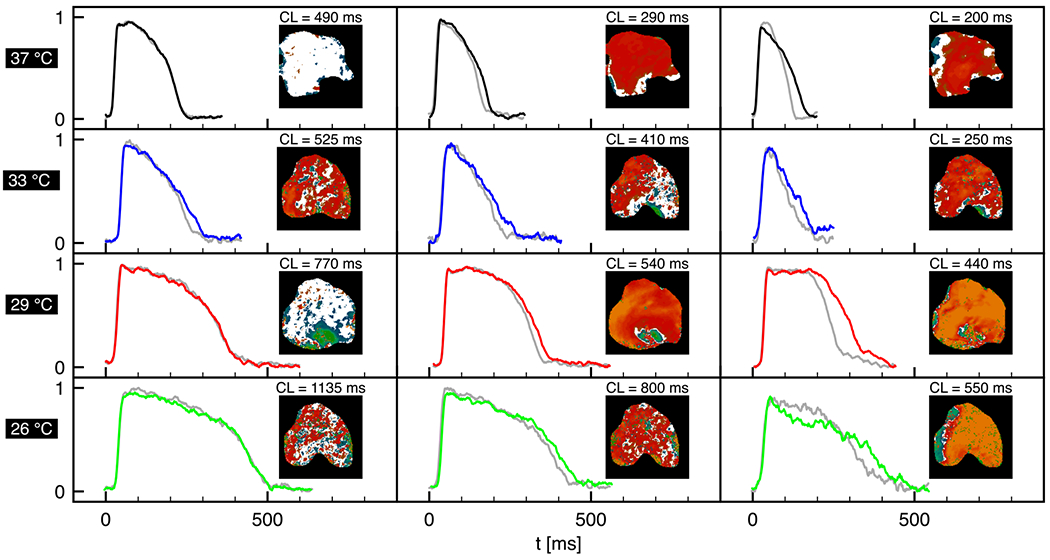
An experimental example of cardiac alternans at varying pacing frequencies and temperatures is provided in Fig. 1. We overlay two consecutive APs (extracted from a representative pixel within the field of view) varying pacing cycle length (CL) and temperature, together with two-dimensional endocardial surface voltage data from fluorescence optical mapping. These spatial maps show the alternans evolution during pacing-down restitution protocol, i.e., a gradual reduction in CL, assessing the presence of alternans through the condition ms, proved to be an appropriate threshold for alternans identification [3,28,29]. In particular, white areas represent nonalternating regions, red areas feature concordant alternans (CA), and the simultaneous presence of red and green regions exhibit discordant alternans (DA) cases [3]. We observe a lengthening of APD at lower temperatures due to slowing of the sodium and calcium dynamics [29], inducing a more heterogeneous and disorganized distribution of alternans maps (DM) in the tissue (enhanced dispersion of repolarization).
FIG. 1.

Action potential shape and spatial alternans maps at varying temperature. Fluorescence signal traces from the center of the field of view at 37, 33, 29, and 26°C (rows). Different regimes (columns) are shown according to the selected pacing cycle length (CL). Severity of alternans increases from left to right as CL decreases. The spatial dispersion of ΔAPD (insets) refers to the color code for concordant (red), discordant (red-blue), and absence (white) of alternans. At 37 °C (black) the tissue does not present alternans for CL > 300 ms. At 33 °C (blue) the tissue is already alternating at CL ~ 520 ms, and discordant alternans patterns can be observed at lower CLs. At lower temperatures, i.e., 29 (red) and 26 °C (green), alternans onset (gray traces represent the previous AP) is progressively shifted at higher CLs, and alternans get more severe when CL decreases.
In the present Letter, we conduct an experimental and theoretical study to investigate the effect of temperature on alternans onset and development through a spatiotemporal correlation analysis extending and generalizing the results shown in Ref. [30]. We focus on AP optical mapping data on endocardial canine ventricles measuring characteristic lengths recorded at different thermal conditions and under different dynamical regimes [31]. The Letter shows that the characteristic length of the system reduces at lower temperature and during fast pacing. These observations are explained by using a generalized constitutive phenomenological law to relate the CV restitution curve with the characteristic length of the system further including temperature dependence. We identify, then, the normalized characteristic length as a synthetic and predictive indicator of alternans onset and evolution within a thermoelectric scenario.
Experimental data.
The reader is referred to Ref. [3] for a detailed description of the experimental setup. Experimental data consist of canine endocardium activation maps optically recorded during pacing-down restitution protocols at different thermal conditions, ranging from 37 °C down to 26 °C. The camera field of view is 7 × 7 cm2, and space and time resolutions are ~600 μm/pixel and 2 ms/frame, respectively. All activation maps were recorded on the same tissue keeping the stimulating electrode fixed to avoid spurious analyses. Data were preanalyzed to remove signal drift; a nearest-neighbor averaging was performed for time and space filtering with rectangular and two-dimensional Gaussian kernels, respectively. Kernel windows were appropriately set to obtain optimal noise filtering without affecting action potential shape and spatial diffusive patterns, i.e., seven time frames and four-pixel radius.
Correlation analysis.
To investigate correlation features in tissue transmembrane potential, V, we evaluated the pairwise correlation indices among all locations within a square box domain extracted from the mapped field. In particular, we computed the following correlation function:
| (1) |
where and are the voltage time series for the two selected points (pixel p); σ1 and σ2 are the standard deviations of V1 and V2; ⟨·⟩ represents the time average computed on a specific time window. We selected such a time window to match one beat cycle, i.e., one activation wave front and one repolarization wave back within the box. The final correlation function R(r) is evaluated by averaging all the correlation indices computed for pairs of points separated by a distance d for which r ⩽ d < r + dr. Such a procedure represents an average over thin annular sectors performed to smooth the resulting correlation function. In our analyses we set dr = 250 μm.
Characteristic length.
Following the arguments in Ref. [30], we assume an exponential decay of the correlation function, shaped by a space constant L0 which strongly depends on the stimulating frequency and operating conditions:
| (2) |
In particular, for every beat cycle, we extracted the characteristic length L0 through a linear fitting in a semilogarithmic plot, eventually quantifying the space-time correlation across the tissue via a unique parameter.
To generalize the analysis provided in Ref. [30] and investigate beat-to-beat variation in the characteristic length, we evaluated L0 for four successive beats after reaching steady state at each stimulating frequency over the pacing-down restitution protocol. The number of four beats was chosen to highlight period doubling bifurcations shown to occur for this set of data (both two- and four-cycle alternans [3]). Accordingly, global correlation properties at varying stimulating frequencies characterize beat-to-beat variation, alternans onset, and evolution. Specifically, we normalized the characteristic length for the ith beat based on the average value among the four cycles (average operator 〈〈·〉〉),
| (3) |
Temperature-dependent dispersion relation.
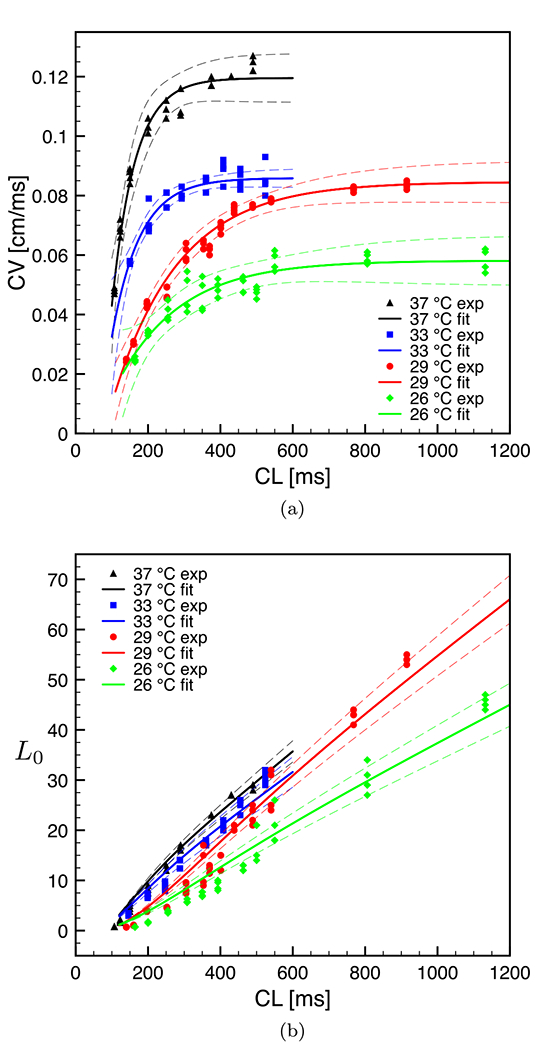
Once we quantified the average L0, we related this parameter to the conduction velocity restitution curve and to the pacing frequency. Accordingly, we evaluated the CV of the activation wave front for each beat, finally averaging over the four cycles. In particular, we computed the local velocity of the activation along the normal-to-the-front boundary direction within the aforementioned box (see Ref. [32] for details). All the computed local velocities were eventually averaged over all the boundary points and over the four beats to obtain a unique value of the CV at a specific CL. The experimental CVs are reported in Fig. 2(a) (colored markers) for decreasing values of the CL and four temperatures.
FIG. 2.

(a) Conduction velocity and (b) characteristic length restitution curves at four temperatures. Colored markers represent CV and L0 experimental values computed over four beats. Continuous lines denote the nonlinear fitting function Eq. (4) in (a) and Eq. (5) in (b). Dashed lines denote 95% confidence interval.
Furthermore, as previous studies that use exponential functions to fit the APD [33] and the CV [30] restitution functions, we fit the CV restitution by the following exponential function:
| (4) |
where a–c are fitting parameters that change with temperature (we avoid the functional dependence for the sake of notation). The fitting laws with the corresponding confidence intervals are shown in Fig. 2(a) (continuous lines). As previously stated [31], the fitted CV restitution curves present a monotonic trend as temperature decreases. Other physiological-based constitutive laws can be explored in this context considering thermal-dependent sodium time constants [34], although we chose to pursue a phenomenological approach in the present Letter.
Then, we looked for a generalized dispersion relation,
| (5) |
such to retrieve an analytical derivation of the characteristic length in a thermoelectric scenario. It is worth noting that the fitting parameters a—c, and the exponent α(T) are, in general, dependent on the dynamical response of the system and, therefore, also on its thermal state. Figure 2(b) illustrates the characteristic lengths computed following the aforementioned approach at varying CLs and temperatures. The value of L0 can be interpreted as the total length of propagation of the excitation wave to physiologically synchronize the whole organ restoring the resting state. The lower the values of L0, the more irregular (pathological) behaviors characterize the evolution of the system. Similar to the CVs restitution curves, characteristic lengths decrease at short CLs as well as at low temperatures. This implies that, when the temperature drops, short-range correlated dynamics triggering pathological phenomena are more likely to occur, further confirming the impact of thermal instabilities on spatiotemporal cardiac dynamics in mammalian hearts [35].
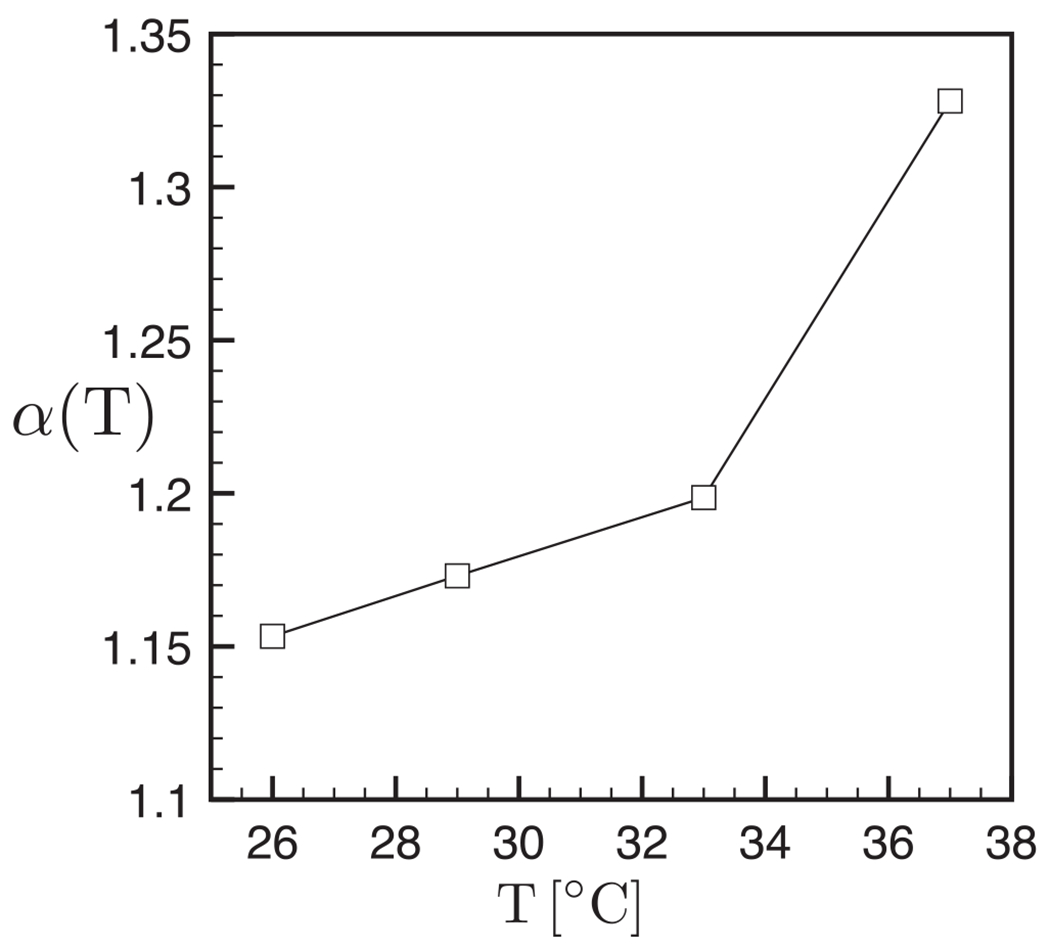
Figure 3 shows the thermal variation of the dispersive exponent α(T) featured in the phenomenological relation (5). We observe that, at 37°C, a fitting law able to replicate the measured characteristic lengths is obtained for α = 1.33, lower than α = 1.5 previously found in Ref. [30]. This is due to the variability between different tissues used in the present experimental recordings although in line with standard deviation analyses. The overall trend for α(T) consists of a gradual reduction at low temperatures.
FIG. 3.

Temperature dependence of the exponent α in Eq. (5).
Cardiac alternans thermal index.
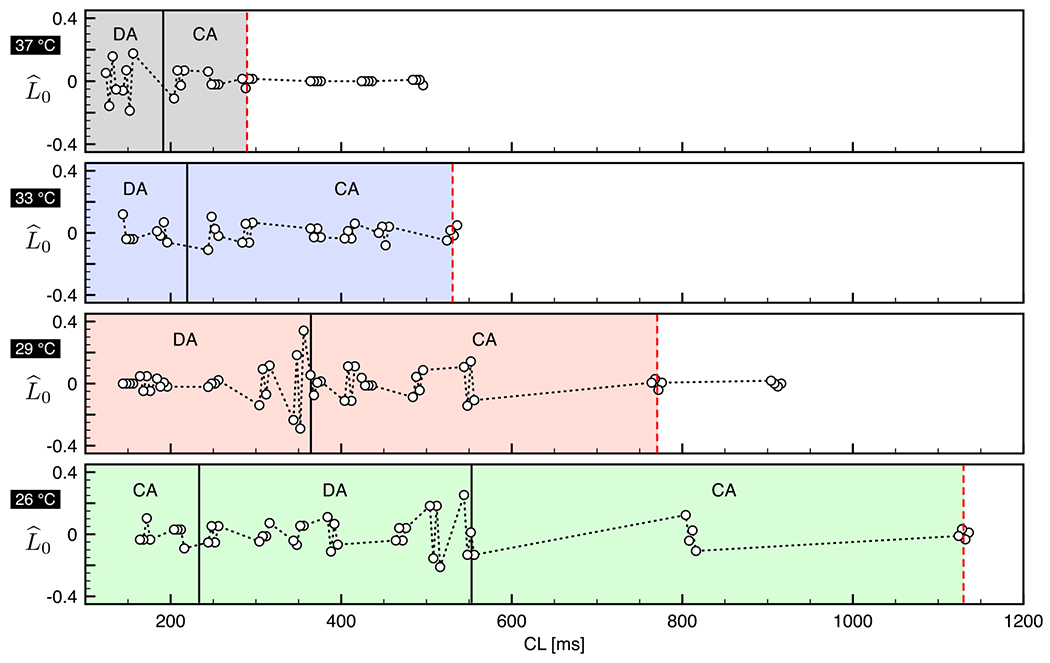
To characterize the multiple transitions occurring at fast pacing, we enrich the previous analysis by quantifying the normalized decay length . This particular indicator can further identify: (i) the onset of concordant alternans when a first net deviation of from zero is observed, (ii) the transition from concordant alternans to discordant alternans when consecutive high-amplitude oscillations of are present, and (iii) the appearance of smaller and disorganized structures for fast pacing (e.g., CL < 300 ms) and, in particular, at low temperatures (e.g., T < 35°C). In the present thermoelectric scenario alternans onset and evolution is readily identified through oscillations at increasing CLs for decreasing temperatures as shown in Fig. 4 according to previous studies [31]. Furthermore, oscillations evolution are in line with the nonlinear behavior observed experimentally in terms of discordant alternans evolution during pacing-down restitution protocols [3]. The complex interplay among activated and inactivated local states connected to the spatiotemporal propagation of the AP wave leads to reproduce intrinsic nonlinearities, i.e., CA-DA or CA-DA-CA-DA evolutions with a reduction of DA and the appearance of DM before induction of fibrillation.
FIG. 4.

Computed values of for four beats all over the pacing-down restitution protocol at T = 37, 33, 29, and 26 °C. Dashed red vertical lines denote experimental alternans onset. Solid black vertical lines denote transition from CA, DA, and DMs. Colored areas represent alternans regimes over the whole range of pacing frequency.
Finally, it is worth noting that lowering the system’s thermal state leads to a concurrent increment of the basal signal noise due to the dye temperature dependence.
Discussion and perspectives.
Thermal imbalances are well-known drivers of irregular dynamics in excitable biological media [5]. In the cardiac tissue, temperature contributes to modifying AP shape and morphology, resting membrane state and restitution features, CV of planar waves, alternans onset, and evolution [31,36–38]. Besides, cardiac arrhythmias’ development is linked to the thermal state of the heart [39,40]. As such, additional nonlinear dynamics are enforced in a cardiac thermoelectric scenario contributing to complex spatiotemporal behaviors, critical in medical research, and calling for efficient, predictive, and quantitative indices.
The literature is populated by a multitude of studies trying to classify the different regimes appearing during cardiac dynamics [3,41–49] and evaluate the effects of temperature by means of animal experiments as well as finely tuned mathematical models [31,50–53]. Quantitative indicators, such as order parameters and correlation functions, have been proposed to identify the prevalent features of ventricular fibrillation [54–56]. A predictive index based on characteristic spatial length, however, has been recently introduced [30] qualifying the transition of the excitation wave from normal rhythm (nonalternating), passing through a period-doubling bifurcation (concordant and discordant alternans), and ending with sustained ventricular fibrillation. An extended theoretical and modeling investigation has been also provided to emphasize the role of characteristic length in domain rescaling such to correctly reproduce spiral wave behavior during sustained fibrillation. Such an analysis, however, was limited at normal body temperature and did not address the full power of the method. A comprehensive thermoelectric study is provided here, emphasizing the role of such a synthetic index towards a better understanding and prediction of cardiac alternans onset and evolution. On such a ground, a mandatory action plan for a concrete translation towards clinical diagnostic requires: (1) reproduction and mechanistic explanation of decay lengths via thermoelectric mathematical models [57]; (2) inverse problem identification of the ionic modeling parameters ruling regime transitions, alternans onset, and fibrillation states [58]; (3) in silico analysis of large-scale cardiac models uncovering the specific links among decay lengths and clinical signatures, e.g., electrocardiocardiograms [59,60]. In such a perspective, we are planning to test and extend the present approach with other mammals, such as guinea pigs, rabbits, horses, in addition to humans, that have been shown to produce alternans. Such forthcoming studies will foster elucidating the inter-and intracellular mechanisms responsible for life-threatening cardiac arrhythmias.
Acknowledgments.
We acknowledge support from the International Center for Relativistic Astrophysics Network (ICRANet), the Italian National Group for Mathematical Physics (GNFM-INdAM), the National Science Foundation under Grant No. CMMI-1762553, and the National Institutes of Health Grant No. R01HL143450-01.
Contributor Information
Alessandro Loppini, Department of Engineering, Campus Bio-Medico University of Rome, 00128 Rome, Italy.
Alessandro Barone, Department of Engineering, Campus Bio-Medico University of Rome, 00128 Rome, Italy.
Alessio Gizzi, Department of Engineering, Campus Bio-Medico University of Rome, 00128 Rome, Italy.
Christian Cherubini, Department of Science and Technology for Humans and the Environment and ICRA, Campus Bio-Medico University of Rome, 00128 Rome, Italy and International Center for Relativistic Astrophysics Network-ICRANet, 65122 Pescara, Italy.
Flavio H. Fenton, School of Physics, Georgia Institute of Technology, Atlanta, Georgia, USA
Simonetta Filippi, Department of Engineering and ICRA, Campus Bio-Medico University of Rome, 00128 Rome, Italy and International Center for Relativistic Astrophysics Network-ICRANet, 65122 Pescara, Italy.
References
- [1].Han J and Moe GK, Circ. Res. 14, 44 (1964). [DOI] [PubMed] [Google Scholar]
- [2].Kuo C-S, Munakata K, Reddy CP, and Surawicz B, Circulation 67, 1356 (1983). [DOI] [PubMed] [Google Scholar]
- [3].Gizzi A, Cherry E, Gilmour RF Jr., Luther S, Filippi S, and Fenton FH, Fron. Physiology 4, 71 (2013). [DOI] [PMC free article] [PubMed] [Google Scholar]
- [4].Hörning M, Blanchard F, Isomura A, and Yoshikawa K, Sci. Rep. 7, 7757 (2017). [DOI] [PMC free article] [PubMed] [Google Scholar]
- [5].Burton FL and Cobbe SM, Cardiovasc. Res. 50, 10 (2001). [DOI] [PubMed] [Google Scholar]
- [6].Pastore JM, Girouard SD, Laurita KR, Akar FG, and Rosenbaum DS, Circulation 99, 1385 (1999). [DOI] [PubMed] [Google Scholar]
- [7].Walker ML, Wan X, Kirsch GE, and Rosenbaum DS, Circulation 108, 2704 (2003). [DOI] [PubMed] [Google Scholar]
- [8].Walker ML and Rosenbaum DS, Heart Rhythm 2, 1383 (2005). [DOI] [PubMed] [Google Scholar]
- [9].De Diego C, Pai RK, Dave AS, Lynch A, Thu M, Chen F, Xie L-H, Weiss JN, and Valderrábano M, Am. J. Physiol.: Heart Circ. Physiol. 294, H1417 (2008). [DOI] [PubMed] [Google Scholar]
- [10].Qu Z, Garfinkel A, Chen P-S, and Weiss JN, Circulation 102, 1664 (2000). [DOI] [PubMed] [Google Scholar]
- [11].Watanabe MA, Fenton FH, Evans SJ, Hastings HM, and Karma A, J. Cardiovascular Electrophysiol. 12, 196 (2001). [DOI] [PubMed] [Google Scholar]
- [12].Zabel M, Portnoy S, and Franz MR, J. Am. Coll. Cardiol. 25, 746 (1995). [DOI] [PubMed] [Google Scholar]
- [13].Verrier RL, Klingenheben T, Malik M, El-Sherif N, Exner DV, Hohnloser SH, Ikeda T, Martínez JP, Narayan SM, Nieminen T et al. , J. Am. Coll. Cardiol. 58, 1309 (2011). [DOI] [PMC free article] [PubMed] [Google Scholar]
- [14].Chen DD, Gray RA, Uzelac I, Herndon C, and Fenton FH, Phys. Rev. Lett. 118, 168101 (2017). [DOI] [PubMed] [Google Scholar]
- [15].Němec J, Kim JJ, Gabris B, and Salama G, Heart Rhythm 7, 1686 (2010). [DOI] [PMC free article] [PubMed] [Google Scholar]
- [16].Kim JJ, Němec J, Papp R, Strongin R, Abramson JJ, and Salama G, Am. J. Physiol.: Heart Circ. Physiol. 304, H848 (2013). [DOI] [PMC free article] [PubMed] [Google Scholar]
- [17].Glass L and Lerma C, Heart Rhythm 3, 1497 (2006). [DOI] [PubMed] [Google Scholar]
- [18].Bini D, Cherubini C, Filippi S, Gizzi A, and Ricci P, Commun. Comput. Phys. 8, 610 (2010). [Google Scholar]
- [19].Cusimano N, Gizzi A, Fenton FH, Filippi S, and Gerardo-Giorda L, Commun. Nonlinear Sci. Numer. Simul. 84, 105152 (2020). [DOI] [PMC free article] [PubMed] [Google Scholar]
- [20].Treml LM, Bartocci E, and Gizzi A, Mathematics 9, 164 (2021). [Google Scholar]
- [21].Cantwell CD, Roney CH, Ng FS, Siggers JH, Sherwin SJ, and Peters NS, Comput. Biol. Med. 65, 229 (2015). [DOI] [PMC free article] [PubMed] [Google Scholar]
- [22].Erem B, Brooks DH, Van Dam PM, Stinstra JG, and MacLeod RS, in 2011 Annual International Conference of the IEEE Engineering in Medicine and Biology Society (IEEE, Piscataway, NJ, 2011), pp. 5884–5887. [DOI] [PMC free article] [PubMed] [Google Scholar]
- [23].Gu S, Wang YT, Ma P, Werdich AA, Rollins AM, and Jenkins MW, Biomed. Opt. Express 6, 2138 (2015). [DOI] [PMC free article] [PubMed] [Google Scholar]
- [24].Luther S, Fenton FH, Kornreich BG, Squires A, Bittihn P, Hornung D, Zabel M, Flanders J, Gladuli A, Campoy L et al. , Nature (London) 475, 235 (2011). [DOI] [PMC free article] [PubMed] [Google Scholar]
- [25].Saccomandi P, Schena E, and Silvestri S, Int. J. Hyperthermia 29, 609 (2013). [DOI] [PubMed] [Google Scholar]
- [26].Lo Presti D, Massaroni C, D’Abbraccio J, Massari L, Caponero M, Longo UG, Formica D, Oddo C, and Schena M, IEEE Sens. J. 19, 7391 (2019). [DOI] [PMC free article] [PubMed] [Google Scholar]
- [27].Sim K, Ershad F, Zhang Y, Yang P, Shim H, Rao Z, Lu Y, Thukral A, Elgalad A, Xi Y et al. , Nat. Electron. 3, 775 (2020). [Google Scholar]
- [28].Gizzi A, Loppini A, Cherry E, Cherubini C, Fenton F, and Filippi S, Physiol. Meas. 38, 833 (2017). [DOI] [PubMed] [Google Scholar]
- [29].Uzelac I, Ji YC, Hornung D, Schröder-Scheteling J, Luther S, Gray RA, Cherry EM, and Fenton FH, Front. Physiol. 8, 819 (2017). [DOI] [PMC free article] [PubMed] [Google Scholar]
- [30].Loppini A, Gizzi A, Cherubini C, Cherry EM, Fenton FH, and Filippi S, Phys. Rev. E 100, 020201(R) (2019). [DOI] [PubMed] [Google Scholar]
- [31].Fenton FH, Gizzi A, Cherubini C, Pomella N, and Filippi S, Phys. Rev. E 87, 042717 (2013). [DOI] [PubMed] [Google Scholar]
- [32].Loppini A, Gizzi A, Ruiz-Baier R, Cherubini C, Fenton FH, and Filippi S, Front. Physiol. 9, 1714 (2018). [DOI] [PMC free article] [PubMed] [Google Scholar]
- [33].Elharrar V and Surawicz B, Am. J. Physiol.: Heart Circ. Physiol. 244, H782 (1983). [DOI] [PubMed] [Google Scholar]
- [34].Cain JW, He L, and Waldrop L, Phys. Rev. E 102, 062421 (2020). [DOI] [PubMed] [Google Scholar]
- [35].Herndon C, Astley HC, Owerkowicz T, and Fenton FH, Integrative Organismal Biology, obaa047 (2021). [DOI] [PMC free article] [PubMed] [Google Scholar]
- [36].Watanabe M, Otani NF, and Gilmour RF Jr., Circ. Res. 76, 915 (1995). [DOI] [PubMed] [Google Scholar]
- [37].Filippi S, Gizzi A, Cherubini C, Luther S, and Fenton FH, Europace 16, 424 (2014). [DOI] [PMC free article] [PubMed] [Google Scholar]
- [38].Majumder R, Nabizath Mohamed Nazer A, Panfilov AV, Bodenschatz E, and Wang Y, bioRxiv 414573 (2020). [Google Scholar]
- [39].Burashnikov A, Shimizu W, and Antzelevitch C, Circ.: Arrhythmia Electrophysiol. 1, 202 (2008). [DOI] [PMC free article] [PubMed] [Google Scholar]
- [40].Modi S and Krahn AD, Circulation 123, 2994 (2011). [DOI] [PubMed] [Google Scholar]
- [41].Wiggers CJ, Am. Heart J. 20, 399 (1940). [Google Scholar]
- [42].Amaral LAN, Goldberger AL, Ivanov P. Ch, and Stanley HE, Phys. Rev. Lett. 81, 2388 (1998). [DOI] [PubMed] [Google Scholar]
- [43].Hakim V and Karma A, Phys. Rev. E 60, 5073 (1999). [DOI] [PubMed] [Google Scholar]
- [44].Glass L, Nature (London) 410, 277 (2001). [DOI] [PubMed] [Google Scholar]
- [45].Echebarria B and Karma A, Phys. Rev. Lett. 88, 208101 (2002). [DOI] [PubMed] [Google Scholar]
- [46].Bub G, Shrier A, and Glass L, Phys. Rev. Lett. 94, 028105 (2005). [DOI] [PubMed] [Google Scholar]
- [47].Weiss JN, Karma A, Shiferaw Y, Chen P-S, Garfinkel A, and Qu Z, Circ. Res. 98, 1244 (2006). [DOI] [PubMed] [Google Scholar]
- [48].Shiferaw Y, Qu Z, Garfinkel A, Karma A, and Weiss JN, Ann. N.Y. Acad. Sci. 1080, 376 (2006). [DOI] [PubMed] [Google Scholar]
- [49].Song Z and Qu Z, PLoS Comput. Biol. 26, e1007931 (2020). [DOI] [PMC free article] [PubMed] [Google Scholar]
- [50].Cherry EM and Fenton FH, Am. J. Physiol.: Heart Circ. Physiol. 286, H2332 (2004). [DOI] [PubMed] [Google Scholar]
- [51].Takagi S, Pumir A, Pazo D, Efimov I, Nikolski V, and Krinsky V, Phys. Rev. Lett. 93, 058101 (2004). [DOI] [PubMed] [Google Scholar]
- [52].Cherry EM and Fenton FH, New J. Phys. 10, 125016 (2008). [Google Scholar]
- [53].Biktasheva IV, Dierckx H, and Biktashev VN, Phys. Rev. Lett. 114, 068302 (2015). [DOI] [PubMed] [Google Scholar]
- [54].Egolf DA and Greenside HS, Nature (London) 369, 129 (1994). [Google Scholar]
- [55].Ashkenazy Y, Ivanov P. Ch, Havlin S, Peng C-K, Goldberger AL, and Stanley HE, Phys. Rev. Lett. 86, 1900 (2001). [DOI] [PubMed] [Google Scholar]
- [56].Quail T, Shrier A, and Glass L, Phys. Rev. Lett. 113, 158101 (2014). [DOI] [PubMed] [Google Scholar]
- [57].Bini D, Cherubini C, and Filippi S, Chaos, Solitons Fractals 42, 2057 (2009). [Google Scholar]
- [58].Barone A, Gizzi A, Fenton F, Filippi S, and Veneziani A, Comput. Methods Appl. Mech. Eng. 358, 112615 (2020). [Google Scholar]
- [59].Ramírez WA, Gizzi A, Sack KL, Guccione JM, and Hurtado DE, Sci. Rep. 10, 12990 (2020). [DOI] [PMC free article] [PubMed] [Google Scholar]
- [60].Ramírez WA, Gizzi A, Sack KL, Filippi S, Guccione JM, and Hurtado DE, Mathematics 8, 2242 (2020). [Google Scholar]


