Abstract
BACKGROUND
The appearance of hyperglycemia is due to insulin resistance, functional deficits in the secretion of insulin, and a reduction of β cell mass. There is a long-standing debate as to the relative contribution of these factors to clinically manifesting β cell dysfunction. The aim of this study was to verify the acute effect of one of these factors, the reduction of β cell mass, on the subsequent development of hyperglycemia.
METHODS
To pursue this aim, nondiabetic patients, scheduled for identical pancreaticoduodenectomy surgery, underwent oral glucose tolerance tests (OGTT) and hyperglycemic clamp (HC) procedures, followed by arginine stimulation before and after surgery. Based on postsurgery OGTT, subjects were divided into 3 groups depending on glucose tolerance: normal glucose tolerance (post-NGT), impaired glucose tolerance (post-IGT), or having diabetes mellitus (post-DM).
RESULTS
At baseline, the 3 groups showed similar fasting glucose and insulin levels; however, examining the various parameters, we found that reduced first-phase insulin secretion, reduced glucose sensitivity, and rate sensitivity were predictors of eventual postsurgery development of IGT and diabetes.
CONCLUSION
Despite comparable functional mass and fasting glucose and insulin levels at baseline and the very same 50% mass reduction, only reduced first-phase insulin secretion and glucose sensitivity predicted the appearance of hyperglycemia. These functional alterations could be pivotal to the pathogenesis of type 2 diabetes (T2DM).
TRIAL REGISTRATION
ClinicalTrials.gov NCT02175459.
FUNDING
Università Cattolica del Sacro Cuore; Italian Ministry of Education, University and Research; European Foundation for the Study of Diabetes.
Keywords: Endocrinology, Metabolism
Keywords: Beta cells, Diabetes, Insulin
Introduction
β Cell dysfunction and loss of β cell mass both contribute to the pathogenesis of hyperglycemia in type 2 diabetes (T2DM) (1). However, while some reports suggest that β cell mass loss occurs prior to β cell functional impairment (2–4), others maintain that the decrease in β cell mass actually predisposes to impaired glucose homeostasis (5, 6). Whereas cross-sectional autopsy studies have shown β cell loss and increased β cell apoptosis in T2DM (7), studies examining the timing and relationship among changes in blood glucose, β cell morphology, insulin secretion, and sensitivity have identified the functional deficit as dominant and as requisite for the development of hyperglycemia (8, 9). There is still, therefore, much debate as to whether insulin deficiency and consequent hyperglycemia are the results of compromised β cell function, reduced β cell mass, and/or a combination of both (1, 5, 10).
Partial pancreatectomy is a standardized surgical procedure, and all patients undergoing pancreaticoduodenectomy receive virtually the same partial (50%) resection, maintaining almost the same remaining portion of the endocrine pancreas. It is well known that β cell mass may differ even within normal glucose tolerance (NGT) (11); however, whatever the preexisting β cell mass may be, the surgical procedure always removes approximately 50% of it.
We had previously used this technique to demonstrate the extraordinary plasticity of islet and exocrine cells triggered by insulin resistance in order to maintain euglycemia in the prediabetic state (11). Although an increased β cell workload (insulin resistance) is a risk factor for hyperglycemia, in most individuals, there is an adaptive increase in insulin and proinsulin secretion without apparent β cell failure (12). As β cell function declines in the presence of insulin resistance (13), a sudden decrease in β cell mass compromises β cell function and secretory capacity and viability, leading to a progressive loss of β cell number and function. Several studies have examined the metabolic changes occurring following partial pancreatectomy in humans (14, 15) and have suggested that the acute removal of β cell mass inevitably accelerates a decline in β cell functional capacity, already “stressed” by the attempt to compensate for increasing insulin demand (7, 16)
In the present study, we aim to evaluate (a) the changes in β cell secretory capacity, modeled from an oral glucose tolerance test (OGTT) and hyperglycemic clamp (HC) in nondiabetic individuals before and after acute β cell reduction, and (b) whether preexisting insulin secretory defects can predict glucose disarrangements following a reduction in β cell mass.
Results
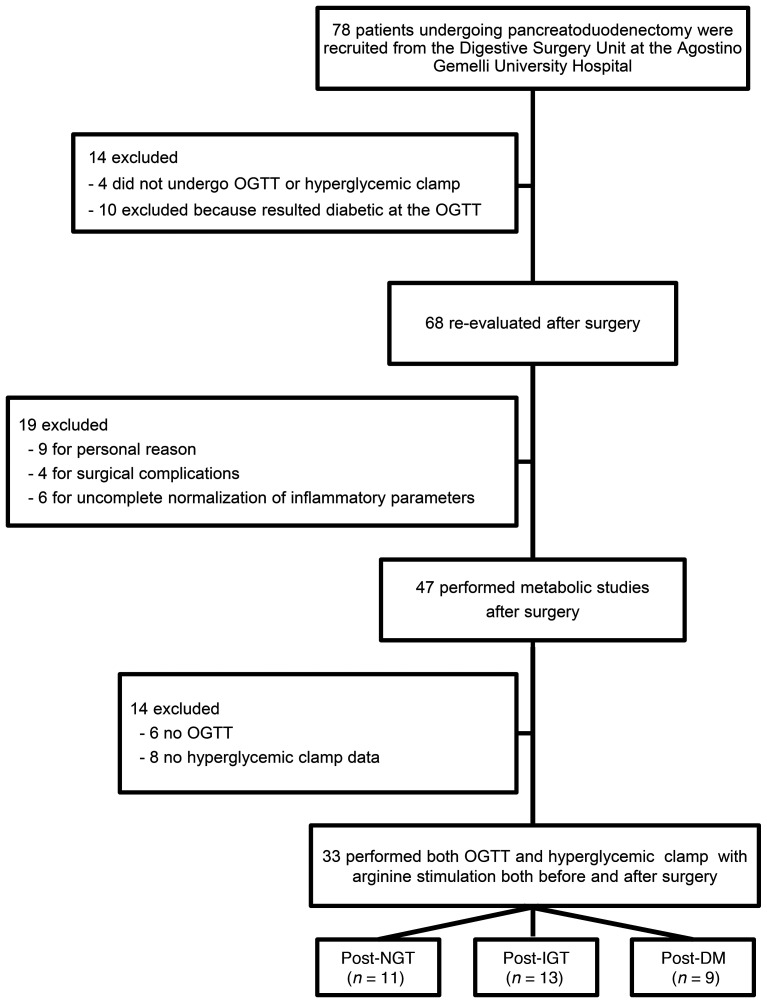
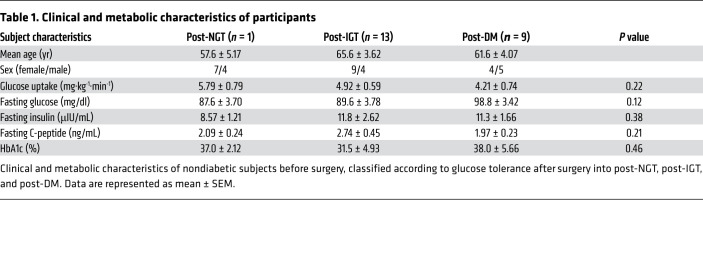
Seventy-eight patients (41 females, 38 males; mean age 64 ± 12 years ± SEM) undergoing pylorus-preserving pancreatoduodenectomy were recruited from January 2017 to April 2019 at the Digestive Surgery Unit and studied at the Centre for Endocrine and Metabolic Diseases unit (both at the Agostino Gemelli University Hospital). Indications for surgery were periampullary tumors, pancreatic intraductal papillary tumors, mucinous cystic neoplasm of the pancreas, and nonfunctional pancreatic neuroendocrine tumors. None of the patients enrolled had a known history of diabetes. Only patients with normal cardiopulmonary and kidney function, as determined by medical history, physical examination, electrocardiography, estimated glomerular filtration rate, and urinalysis, were included. Altered serum lipase and amylase levels prior to surgery, as well as morphologic criteria for pancreatitis, were considered exclusion criteria. Patients with severe obesity (BMI >40), uncontrolled hypertension, and/or hypercholesterolemia were also excluded. Patients underwent both OGTT and HbA1c testing to exclude diabetes, on the basis of the American Diabetes Association criteria, and subjects with fasting glucose above 126 mg/dl, with 2-hour postload glucose at baseline above 200 mg/dl or with HbA1c greater than or equal to 48 mmol/mol (6.5%) were excluded from the study. As can be seen in the Figure 1 CONSORT diagram, only 33 of the 78 nondiabetic subjects underwent both an OGTT and a HC with arginine stimulation to evaluate insulin secretion (from C-peptide deconvolution), as described below, both before and approximately 40 days after surgery. The adequacy of the recovery period was determined by the normalization of inflammatory parameters, such as C-reactive protein, erythrocyte sedimentation rate, stability of weight, absence of symptoms of abnormal intestinal motility, or exocrine pancreatic deficiency. Clinical and metabolic characteristics of study subjects are provided in Table 1.
Figure 1. Flow diagram of study participants.
Table 1. Clinical and metabolic characteristics of participants.
Identical hemipancreatectomy has different results after surgery.
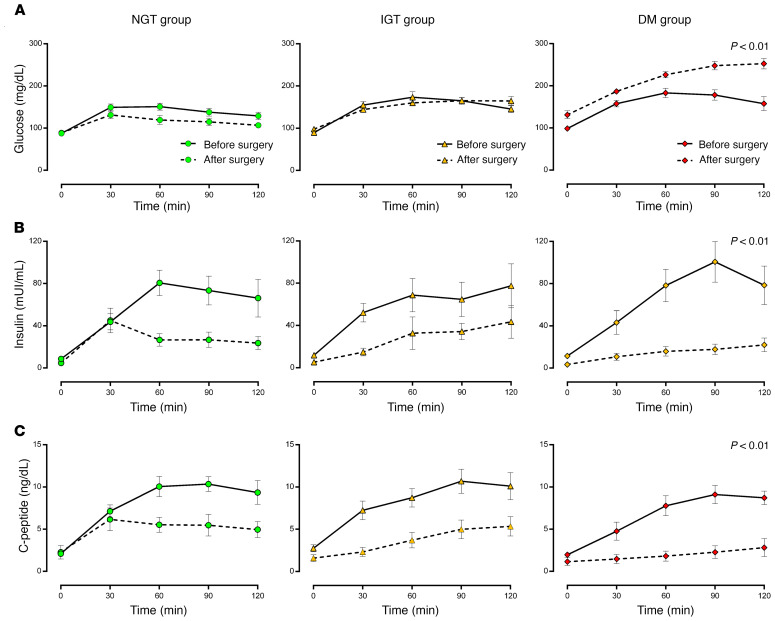
All groups displayed similar levels of fasting glucose (Table 1; P = 0.12) and mean glucose at presurgery OGTT (Figure 2A), while postsurgery OGTT showed that fasting and mean glucose levels increased significantly only in subjects who went on to develop diabetes (P < 0.01 for interaction; Figure 2A), as expected according to classification. Moreover, insulin sensitivity, as assessed by the hyperinsulinemic euglycemic clamp (Table 1), fasting, and mean insulin levels at OGTT (Figure 2B), were also similar among groups before surgery. Insulinogenic index (P = 0.77, Supplemental Figure 2; supplemental material available online with this article; https://doi.org/10.1172/JCI146788DS1) and disposition index (Supplemental Figure 3; P = 0.27) were also comparable among the groups before surgery.
Figure 2. Identical hemipancreatectomies show different results after surgery.
Glucose (A), insulin (B), and C-peptide (C) levels during OGTT before (solid lines) and after (dotted lines) partial pancreatectomy in post-NGT (first column, green circles), post-IGT (second column, orange triangles), and post-DM (third column, red diamonds) patients. P < 0.05 was considered statistically significant for glucose, insulin, and C-peptide levels for third-level interactions and included a product term of time × pancreatectomy × glucose tolerance in the model.
Although the Matsuda index was not validated in this model, we observed similar Matsuda indexes in all groups before surgery (Supplemental Figure 2A; P = 0.61) and an increase in Matsuda index in all groups after surgery (Supplemental Figure 2A; P < 0.05), while the insulinogenic index decreased significantly only in impaired glucose tolerance (post-IGT) and diabetes mellitus (post-DM) groups after surgery (Supplemental Figure 2B, P = 0.01). Postsurgery OGTT showed that insulin and C-peptide levels had decreased significantly for all groups (Figure 2, B and C). Although 50% pancreatectomy led to decreased insulin and C-peptide levels in the entire cohort, its effect on change over time in glucose, insulin, and C-peptide levels across the 3 groups was significantly different (P < 0.01 for the interaction among pancreatectomy, time, and glucose tolerance of insulin, C-peptide, and glucose levels), insulin, and C-peptide, glucose levels) (Figure 2).
Functional defects predict diabetes occurrence after hemipancreatectomy.
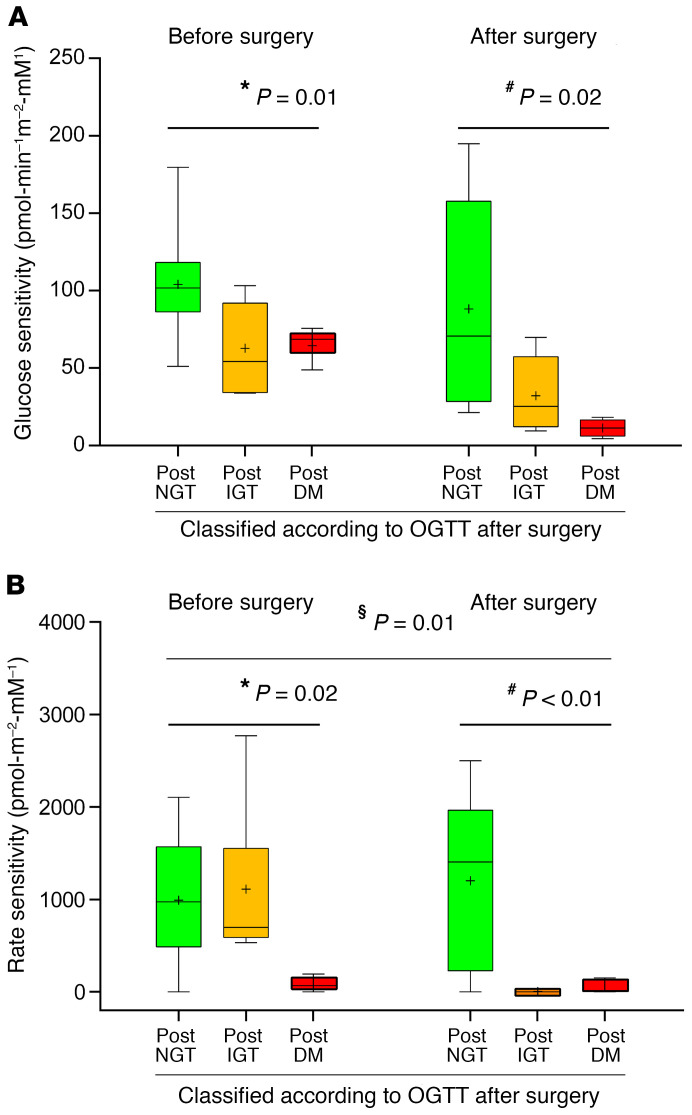
After surgery, β cell glucose sensitivity (βCGS), as a model-based index of β cell function derived from OGTT, was significantly reduced across the 3 groups (post-NGT, 88.2 ± 22.7; post-IGT, 32.1 ± 10.4; and post-DM, 11.3 ± 2.8 pmol·min-1m-2·mM-1, P = 0.02; Figure 3A). The comparison of groups before surgery revealed that βCGS was significantly worse in the post-IGT and post-DM groups compared with the post-NGT group (P = 0.01, post-NGT vs. post-IGT group; P < 0.01, post-NGT vs. post-DM group; Figure 3A).
Figure 3. Functional defects predict diabetes occurrence after hemipancreatectomy.
OGTT-derived glucose sensitivity (A) and rate sensitivity (B) before and after partial pancreatectomy in post-NGT (green box), post-IGT (orange box), and post-DM subjects (red box). The relationship between variables was derived by linear regression analysis. Variables were regressed against glucose tolerance status by using (a) prepancreatectomy values, (b) postpancreatectomy values, and (c) postpancreatectomy values adjusted for prepancreatectomy values. *P < 0.05 before surgery; #P < 0.05 after surgery; §P < 0.05 before surgery adjusted for after surgery. Box plots indicate median and interquartile range; whiskers indicate 2.5th to 97.5th percentile ± mean value.
We also assessed the model-based rate-sensitivity parameter, representing early phase insulin release. We found that rate sensitivity was already reduced before surgery in those subjects who developed diabetes following pancreaticoduodenectomy (post-NGT, 993 ± 225; post-IGT, 1111 ± 289; and post-DM, 87.2 ± 48.8 pmol·min-1m-2·mM-1, P = 0.02; Figure 3B). Postsurgery rate sensitivity differed significantly among the 3 groups (P < 0.01; Figure 3B). Further, we observed that the post-IGT group showed a greater reduction in rate sensitivity compared with post-NGT and post-DM groups (P < 0.01 for rate sensitivity after surgery adjusted for rate-sensitivity presurgery), suggesting that acute β cell mass reduction had a considerable effect on early insulin release only in the post-IGT group (Supplemental Figure 5).
Impaired first-phase insulin secretion, rather than reduced β cell mass, predicts diabetes appearance.
To further investigate changes in the different phases of insulin secretion in response to 50% pancreatectomy, we also performed a 2-hour HC followed by an arginine bolus, which is the gold-standard technique to measure insulin secretion, and an indirect measure of β cell mass. Comparison among the 3 groups revealed that pancreatectomy had a significantly different effect on time-dependent change in insulin and C-peptide levels during HC (P < 0.01 for the interaction among pancreatectomy, time, and glucose tolerance of insulin, C-peptide, and glucose levels) (Supplemental Figure 4).
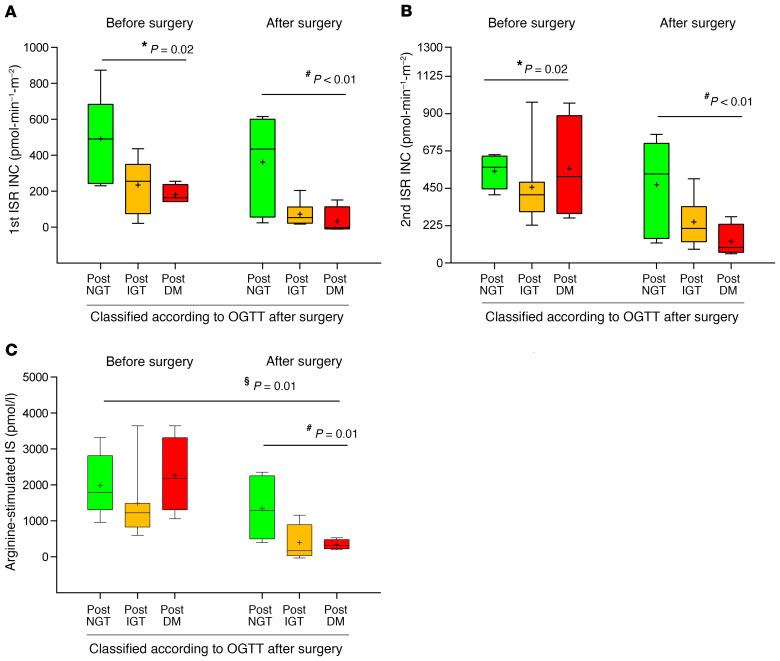
Further, we also used mathematical modeling to calculate incremental first and second phases of insulin secretion rate (ISR) and arginine-stimulated insulin secretion. We observed that the first-phase ISR was significantly lower in post-IGT and post-DM groups compared with post-NGT, both before surgery (Figure 4A; P = 0.02) and after surgery (Figure 4A; P < 0.01). Despite different levels of first-phase ISR both before and after surgery, all groups experienced a similar rate of reduction following surgery (P = 0.20 for first-phase ISR after surgery adjusted for first-phase ISR before surgery). Second-phase ISR was comparable among groups before surgery (Figure 4B), while significant differences were observed after surgery (P = 0.03). Further, the postsurgery change in second-phase ISR differed significantly among the 3 groups (P = 0.05 for second-phase ISR after surgery adjusted for second-phase ISR before surgery), suggesting that pancreatectomy had a significantly different impact on the second-phase ISR.
Figure 4. Impaired first-phase insulin secretion, rather than reduced β cell mass, predicts diabetes appearance.
Clamp-derived first-phase insulin secretion (A), second-phase insulin secretion (B), and arginine-stimulated insulin secretion (C) before and after partial pancreatectomy in post-NGT (green box), post-IGT (orange box), and post-DM subjects (red box). INC, incremental. The relationship between variables was derived by linear regression analysis. Variables were regressed against glucose tolerance status by using (a) prepancreatectomy values, (b) postpancreatectomy values, and (c) postpancreatectomy values adjusted for prepancreatectomy values. *P < 0.05 before surgery; #P < 0.05 after surgery; §P < 0.05 before surgery adjusted for after surgery. Box plots indicate median and interquartile range, and whiskers indicate 2.5th–97.5th percentile ± mean value.
Despite comparable levels among the 3 groups before surgery, arginine-stimulated insulin secretion (indirect measure of β cell mass) was significantly different among the 3 groups after surgery (Figure 4C; P < 0.01). Further, while all groups experienced a reduction after surgery, a greater decrease was observed in the post-IGT and post-DM groups compared with post-NGT (Figure 4C; P = 0.01). Thus, even though subjects had comparable basal levels of arginine-stimulated insulin secretion and the same proportion of surgical β cell mass reduction, arginine proxy of β cell mass was different after surgery. Impairment of β cell function, rather than decrease in β cell mass, is the main predictor of insulin deficiency.
Discussion
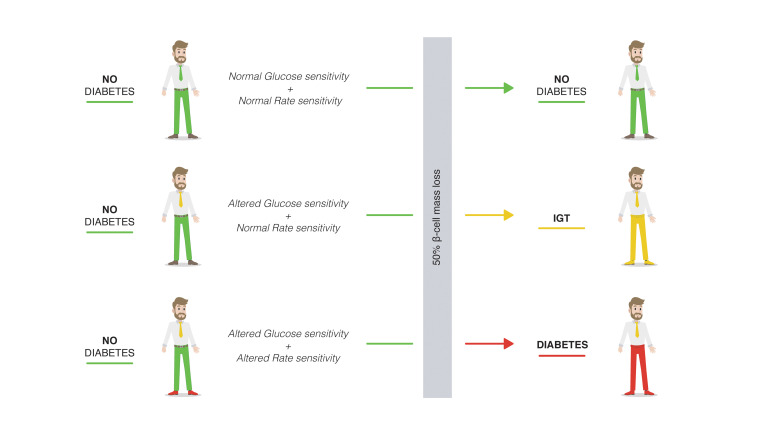
Our study demonstrates that preexisting defects in β cell function in nondiabetic subjects predict the risk of developing hyperglycemia after partial pancreatectomy, a model of acute β cell mass reduction. We found that only subjects with impaired first-phase insulin secretion and reduced βCGS became diabetic or developed IGT after acute β cell mass reduction, and only subjects with impaired rate sensitivity before surgery became diabetic, suggesting that these are the preexisting functional defects in the β cell secretory machinery that lead to hyperglycemia. Our results do not imply that loss of β cell mass is less important than β cell function. In fact, reduction of β cell mass is the trigger that reveals the pivotal role of first-phase insulin secretion in predicting the appearance of impaired glucose metabolism after partial pancreatectomy.
Our data are in line with previous studies reporting a rate of postoperative diabetes of about 10% to 25%. We found that the diabetes rate was about 27%, which demonstrates that reduction of β cell mass is not the dominant variable determining diabetes occurrence and that preexisting defects in the functional mass could be responsible for progression to diabetes.
Based on the insulin response to acute glucose stimuli before surgery, we observed 3 functional and clinical trajectories after acute reduction in β cell mass. Subjects with the highest βCGS and incremental first-phase insulin secretion before surgery remained NGT despite the reduction in β cell mass and reduction of first- and second-phase insulin secretion (evaluated following intravenous administration of glucose). Subjects who had lower βCGS and incremental first-phase insulin secretion developed IGT or became diabetic after surgery. Only subjects who had lower βCGS and incremental first-phase insulin secretion and, more importantly, reduced rate sensitivity (a measure of early phase insulin release) developed diabetes after surgery. This supports the hypothesis that the decrease in early phase insulin release is the key defect leading to hyperglycemia when competent functional islet mass is insufficient.
Our study design presents several advantages. First, the only variable modified was that of an acute and substantial reduction in β cell mass. Second, none of our subjects had DM before surgery. Third, before surgery, all individuals were evaluated not only through anamnesis and HbA1c, but also using the gold-standard OGTT, thus allowing us to exclude unknown diagnoses of diabetes (see Supplemental Figure 1). Interestingly, all had comparable glucose and insulin levels during OGTT before surgery; therefore, OGTT per se is not sufficient to truly identify the metabolic and hormonal effects of partial pancreatectomy. Only the mathematical modeling of first-phase ISR and glucose sensitivity allowed us to trace 3 different trajectories and to distinguish functional defects in a homogenous group of nondiabetic humans undergoing the same β cell mass reduction (7).
The importance of the role of first-phase insulin secretion in the pathogenesis of hyperglycemia is well known in both T1DM and T2DM (17, 18). Aging may exert a role in β cell dysfunction (19) and could have contributed to our results; however, there were no differences in age in the 3 groups studied. Earlier studies have been inconclusive regarding the reduction of first-phase insulin release in prediabetes, mainly due to difficulties in defining the first phase during OGTT (20, 21). Only studies performed with intravenous glucose can actually measure first-phase insulin secretion, while complex mathematical models are needed to estimate it during OGTT. Interestingly, Ferrannini et al. (22) found that rate sensitivity is not significantly reduced in IGT compared with normal individuals, suggesting that rate sensitivity is not the ideal parameter for determining initial loss of glucose tolerance. However, our data show that only subjects with decreased rate sensitivity before surgery became diabetic after surgery, suggesting that loss of rate sensitivity is a marker of worsened glucose tolerance after surgery.
It should be noted that preserved first-phase insulin secretion after pancreatic duodenectomy could be due to an increase in glucagon-like peptide-1 (GLP-1). In fact, in a previous study, we demonstrated that circulating GLP-1 levels increase after pancreaticoduodenectomy (23), and several other reports have suggested that the increase in GLP-1 following surgery is one of the factors leading to diabetes remission after bariatric surgery (24). Though the role of GLP-1 could be important in maintaining first-phase insulin secretion, it should be underlined that all our patients were subjected to the same type of surgery; therefore, similar changes in GLP-1 would be expected. However, a different incretin effect among the 3 groups cannot be excluded.
Some insights can be derived from the comparison between our model and procedures for diabetes remission, e.g., bariatric surgery and diets. It has been found that even if diabetic patients undergo the very same bariatric surgery, only those with higher first-phase insulin secretion experience diabetes remission (25). Interestingly, in this study, only patients with short diabetes duration had higher first-phase insulin secretion, again confirming that preservation of first-phase insulin secretion is more important than GLP-1. The role of the preservation of first-phase insulin secretion has also been confirmed in diabetes remission induced by diet in which the changes in GLP-1 secretion induced by bariatric surgery are not present. In addition, the different postoperative diabetes rate could also be influenced by differences in the ability to implement compensatory mechanisms of regeneration and neogenesis in the remaining pancreas. This has been demonstrated in rats after pancreatectomy, where β cell regeneration and/or appearance of new small islets seems to compensate for decreasing β cell mass. Exploring this possibility in humans is, however, unfeasible.
An elegant study by Ferrannini et al. (22) analyzed the changing parameters of β cell function during OGTT to explain the variability of 2-hour plasma glucose levels, shedding light on β cell dysfunction in the early stages of the natural history of diabetes. The authors concluded that there is a decrease in βCGS even in the NGT range and that this is associated with rising 2-hour plasma glucose concentrations. Being cross-sectional, the study could not distinguish the relative contribution of each of the determinants of glucose tolerance to the risk of diabetes occurrence. In contrast, our model allows us to establish the relative contribution of β cell mass and function to the prediction of diabetes.
In this context, trying to identify strategies to restore β cell function (namely, first-phase insulin secretion) rather than increasing β cell mass, could be pivotal in preventing and treating diabetes in a personalized medicine approach.
Although surgically induced hyperglycemia cannot be considered a true representation of the pathogenesis of T2DM, we believe that our study can provide an understanding of the functional defects underlying this disease. T2DM is the result of 3 main factors: insulin resistance, functional deficits in the secretion of insulin, and a reduction of β cell mass. Since changes in these variables are interrelated and they change continuously over the course of the disease, studying their time-course adaptation is unlikely to provide a solution to this debate, as we will only observe the variables changing interactively and adapting to new situations in order to maintain euglycemia, also as a response to other variables (aging, glucose toxicity, genes, etc.). We believe that a possible way to overcome this problem could be to modify only one of these variables to evaluate the effect on the others. With this method, we here demonstrate that β mass reduction is not sufficient to invariably determine hyperglycemia. In contrast, only subjects who already showed changes in first-phase insulin secretion developed diabetes. As previously reported, the acute removal of β cell mass inevitably accelerates a decline in β cell functional capacity, previously “stressed” by an attempt to compensate for increasing insulin demand. Since the surgical procedure is the same in all subjects, but only patients with previous islet remodeling and impaired β cell function develop hyperglycemia and diabetes, the true determinant of the appearance of diabetes is the already-present prediabetic functional milieu (i.e., loss of first phase) rather than surgery. In conclusion, β cell mass reduction per se is not responsible for the appearance of hyperglycemia. In our study, we found that in nondiabetic humans, β cell function and patterns of secretion differed substantially and that these differences were further amplified following acute β cell mass reduction. Therefore, only preexisting impairments in β cell function, i.e., reduced first-phase insulin release, predict impairment in glucose tolerance and diabetes after partial pancreatectomy.
Methods
OGTT.
A standard 75 g OGTT was performed with measurement of glucose, insulin, and C-peptide at 0, 30, 60, 90, and 120 minutes after glucose load. Based on the postsurgery OGTT results, we classified the patients as post-NGT (n = 11), post-IGT (n = 13), and post-DM (n = 9).
Hyperinsulinemic euglycemic clamp procedure.
The hyperinsulinemic euglycemic clamp test was performed after a 12-hour overnight fast using 40 mIU∙min-1∙m-2 insulin of body surface according to DeFronzo and colleagues (26). A primed-constant infusion of insulin was administered (Actrapid HM, Novo Nordisk). The constant rate for the insulin infusion was reached within 10 minutes to achieve steady-state insulin levels; in the meantime, a variable infusion of 20% glucose was started via a separate infusion pump and the rate was adjusted, on the basis of plasma glucose samples drawn every 5 minutes, to maintain plasma glucose concentration at each participant’s fasting plasma glucose level. During the last 20 minutes of the clamp procedure, plasma samples from blood drawn at 5- to 10-minute intervals were used to determine glucose and insulin concentrations. Whole-body peripheral glucose utilization was calculated during the last 30-minute period of the steady-state insulin infusion and was measured as the mean glucose infusion rate (as mg·kg-1·min-1).
HC procedure.
Plasma glucose was clamped at a stable level of 125 mg/dl above fasting blood glucose concentration. The HC was started with a bolus dose of 200 mg/mL dextrose (150 mg/kg) administered into the antecubital vein. Blood was drawn from a cannulated dorsal hand vein on the opposite arm. Every 5 minutes, venous plasma glucose was analyzed with a glucose analyzer and the infusion of 20% glucose was adjusted to achieve a stable glucose level of 125 mg/dl above the fasting value. Serum samples for insulin and C-peptide were drawn at 0, 2.5, 5, 7.5, 10, 15, 30, 60, 90, 120, 130, 140, and 150 minutes. At 120 minutes, a 5 g arginine bolus was administered to measure maximum C-peptide secretory capacity at a steady-state blood glucose concentration of 250 mg/dl. Arginine-stimulated β cell secretory capacity was calculated as Δ 130-minute C-peptide and 120-minute C-peptide levels.
Surgical procedures.
Pancreatoduodenectomy was performed according to the pylorus-preserving technique. Briefly, the pancreatic head, the entire duodenum, common bile duct, and gallbladder were removed en bloc, leaving a functioning pylorus intact at the gastric outlet. All adjacent lymph nodes were carefully removed. The continuity of the gastrointestinal tract was restored by an end-to-side pancreatojejunostomy. Further downstream, an end-to-side hepaticojejunostomy and an end-to-side pylorojejunostomy were performed. The volume of pancreas removed during the surgery was constant (~50%), as previously reported by Schrader et al. (27).
Calculations.
To better define the relation between glucose metabolism after acute islet mass reduction and preexisting metabolic defects, we divided subjects according to their glucose tolerance after surgery, as determined by postsurgery OGTT. According to the American Diabetes Association classification, subjects whose 2-hour postload glucose was below 140 mg/dl were defined as post-NGT, subjects whose 2-hour postload glucose was 140–199 mg/dl were defined as post-IGT, and subjects whose 2-hour postload glucose was higher than 200 mg/dl were defined as post-DM.
During OGTT and HC, insulin secretion was derived from C-peptide levels by deconvolution. βCGS, i.e., the slope of the relationship between insulin secretion and glucose concentration, was estimated from the OGTT by modeling, as previously described (13, 28). Rate sensitivity, also estimated from OGTT modeling, is a β cell–functional parameter that represents the dependence of the ISR on the rate of change in glucose concentration and is related to early insulin release.
Matsuda indexes (29) were calculated as indexes of whole-body insulin sensitivity based on insulin and glucose values obtained from the OGTT, while β cell function was evaluated by calculating the insulinogenic index as the change in insulin over the first 30 minutes divided by the change in glucose over the first 30 minutes.
Integrated β cell function was also measured using the oral disposition index, which provides an assessment of insulin secretion in relation to insulin sensitivity, calculated as the product of the insulinogenic index and the Matsuda index (30).
During HC, the first-phase insulin secretion response was calculated as the mean incremental insulin secretion between 0 and 5 minutes, when ISR had fallen from the initial peak to a nadir in all subjects. Second-phase insulin secretion was calculated as the increment in insulin secretion during the last 20 minutes of the HC above basal insulin secretion.
Statistics.
Continuous variables were summarized as mean ± SEM and categorical variables as frequencies and percentages, unless otherwise indicated. Normality of distribution was assessed by generation of histograms and quantile-quantile plots. Since samples did not deviate significantly from normal, differences in means across groups at baseline were tested by ANOVA. The relationship between variables was derived by linear regression analysis. Variables derived from OGTT and clamp were regressed against glucose tolerance status by using (a) prepancreatectomy values, (b) postpancreatectomy values, and (c) postpancreatectomy values adjusted for prepancreatectomy values. For measurement of glucose, insulin, and C-peptide, we evaluated third-level interactions by including a product term of time × pancreatectomy × glucose tolerance in the model. We compared the effects of time and pancreatectomy using a linear mixed model for repeated measures, with each parameter as the dependent variable and time (analyzed as a categorical variable), pancreatectomy, and the product term of time × pancreatectomy × glucose tolerance to investigate interaction effects. Linear and quadratic fits were used to explore the relationships between insulinogenic index and Matsuda index. A 2-tailed P value of less than 0.05 was considered statistically significant. Analyses were performed using Stata 15.1 (StataCorp).
Study approval.
The study protocol (ClinicalTrials.gov NCT02175459; Supplemental Figure 1) was approved by the Comitato Etico Fondazione Policlinico Universitario Agostino Gemelli IRCCS–Università Cattolica del Sacro Cuore (P/656/CE2010 and 22573/14), and all participants provided written informed consent, which was followed by a comprehensive medical evaluation.
Author contributions
TM generated the data and wrote the manuscript. PMF performed statistical analysis. AM, SA, and AG reviewed and edited the manuscript. UC, GQ, SM, FC, FI, and AP contributed to discussion and reviewed and edited the manuscript. CMAC, GQ, and GDG researched data. AM generated data. TM and AG are guarantors of this work and, as such, had full access to all the data in the study and take responsibility for the integrity of the data and the accuracy of data analyses.
Supplementary Material
Acknowledgments
We thank Stefano Del Prato for having inspired us to use this model to explain the pathogenesis of T2DM. We thank Serena Rotunno (Università Cattolica del Sacro Cuore) for assistance with the editing. This study was supported by grants from the Università Cattolica del Sacro Cuore (FondiAteneo Linea D.3.2, Fondi Ateneo Linea D.1, anno 2019, and Fondi Ateneo Linea D.1, anno 2020); the Italian Ministry of Education, University and Research (GR-2018-12365577) (to TM); a European Foundation for the Study of Diabetes Rising Star and Lilly and Astra Zeneca Awards (to TM); and the European Foundation for the Study of Diabetes Lilly and Astra Zeneca Awards (to FC). CMAC is the recipient of a fellowship prize from Associazione Medici Diabetologi (AMD).
Version 1. 04/27/2021
In-Press Preview
Version 2. 06/15/2021
Electronic publication
Footnotes
Conflict of interest: The authors have declared that no conflict of interest exists.
Copyright: © 2021, American Society for Clinical Investigation.
Reference information: J Clin Invest. 2021;131(12):e146788.https://doi.org/10.1172/JCI146788.
See the related Commentary at Reduced glucose-induced first-phase insulin release is a danger signal that predicts diabetes.
Contributor Information
Teresa Mezza, Email: teresa.mezza@unicatt.it.
Pietro Manuel Ferraro, Email: pietromanuel.ferraro@policlinicogemelli.it.
Gianfranco Di Giuseppe, Email: digiuseppegianfranco@gmail.com.
Simona Moffa, Email: simona.moffa@gmail.com.
Chiara M.A. Cefalo, Email: cefalo.chiara@gmail.com.
Francesca Cinti, Email: cinti_francesca@hotmail.com.
Flavia Impronta, Email: flavia.impronta@gmail.com.
Umberto Capece, Email: capeceumberto@gmail.com.
Giuseppe Quero, Email: giuseppequero@yahoo.it.
Alfredo Pontecorvi, Email: alfredo.pontecorvi@unicatt.it.
Andrea Mari, Email: andrea.mari@cnr.it.
Sergio Alfieri, Email: sergio.alfieri@policlinicogemelli.it.
Andrea Giaccari, Email: andrea.giaccari@unicatt.it.
References
- 1.Li L, et al. Metabolomics identifies a biomarker revealing in vivo loss of functional β-cell mass before diabetes onset. Diabetes. 2019;68(12):2272–2286. doi: 10.2337/db19-0131. [DOI] [PubMed] [Google Scholar]
- 2.Weir GC, et al. β-cell secretory dysfunction: a key cause of type 2 diabetes — Authors’ reply. Lancet Diabetes Endocrinol. 2020;8(5):370–371. doi: 10.1016/S2213-8587(20)30120-0. [DOI] [PubMed] [Google Scholar]
- 3.Weir GC, Bonner-Weir S. Islet β cell mass in diabetes and how it relates to function, birth, and death. Ann N Y Acad Sci. 2013;1281:92–105. doi: 10.1111/nyas.12031. [DOI] [PMC free article] [PubMed] [Google Scholar]
- 4.Weir GC, Bonner-Weir S. Five stages of evolving beta-cell dysfunction during progression to diabetes. Diabetes. 2004;53 Suppl 3:S16–S21. doi: 10.2337/diabetes.53.suppl_3.s16. [DOI] [PubMed] [Google Scholar]
- 5.Taylor R, et al. Understanding the mechanisms of reversal of type 2 diabetes. Lancet Diabetes Endocrinol. 2019;7(9):726–736. doi: 10.1016/S2213-8587(19)30076-2. [DOI] [PubMed] [Google Scholar]
- 6.Costes S, et al. β-Cell failure in type 2 diabetes: a case of asking too much of too few? Diabetes. 2013;62(2):327–335. doi: 10.2337/db12-1326. [DOI] [PMC free article] [PubMed] [Google Scholar]
- 7.Mezza T, et al. β-cell fate in human insulin resistance and type 2 diabetes: a perspective on islet plasticity. Diabetes. 2019;68(6):1121–1129. doi: 10.2337/db18-0856. [DOI] [PMC free article] [PubMed] [Google Scholar]
- 8.Saisho Y. Importance of beta cell function for the treatment of type 2 diabetes. J Clin Med. 2014;3(3):923–943. doi: 10.3390/jcm3030923. [DOI] [PMC free article] [PubMed] [Google Scholar]
- 9.Ferrannini E. The stunned beta cell: a brief history. Cell Metab. 2010;11(5):349–352. doi: 10.1016/j.cmet.2010.04.009. [DOI] [PubMed] [Google Scholar]
- 10.Weir GC, et al. Inadequate β-cell mass is essential for the pathogenesis of type 2 diabetes. Lancet Diabetes Endocrinol. 2020;8(3):249–256. doi: 10.1016/S2213-8587(20)30022-X. [DOI] [PMC free article] [PubMed] [Google Scholar]
- 11.Mezza T, et al. Insulin resistance alters islet morphology in nondiabetic humans. Diabetes. 2014;63(3):994–1007. doi: 10.2337/db13-1013. [DOI] [PMC free article] [PubMed] [Google Scholar]
- 12.Mezza T, et al. Increased beta cell workload modulates proinsulin/insulin ratio in humans. Diabetes. 2018;67(11):2389–2396. doi: 10.2337/db18-0279. [DOI] [PubMed] [Google Scholar]
- 13.Mezza T, et al. β-cell glucose sensitivity is linked to insulin/glucagon bihormonal cells in nondiabetic humans. J Clin Endocrinol Metab. 2016;101(2):470–475. doi: 10.1210/jc.2015-2802. [DOI] [PMC free article] [PubMed] [Google Scholar]
- 14.Menge BA, et al. Metabolic consequences of a 50% partial pancreatectomy in humans. Diabetologia. 2009;52(2):306–317. doi: 10.1007/s00125-008-1219-1. [DOI] [PubMed] [Google Scholar]
- 15.Kendall DM, et al. Effects of hemipancreatectomy on insulin secretion and glucose tolerance in healthy humans. N Engl J Med. 1990;322(13):898–903. doi: 10.1056/NEJM199003293221305. [DOI] [PubMed] [Google Scholar]
- 16.Mezza T, et al. Endocrine and metabolic insights from pancreatic surgery. Trends Endocrinol Metab. 2020;31(10):760–772. doi: 10.1016/j.tem.2020.07.003. [DOI] [PubMed] [Google Scholar]
- 17.Vardi P, et al. Predictive value of intravenous glucose tolerance test insulin secretion less than or greater than the first percentile in islet cell antibody positive relatives of type 1 (insulin-dependent) diabetic patients. Diabetologia. 1991;34(2):93–102. doi: 10.1007/BF00500379. [DOI] [PubMed] [Google Scholar]
- 18.Godsland IF, et al. Loss of beta cell function as fasting glucose increases in the non-diabetic range. Diabetologia. 2004;47(7):1157–1166. doi: 10.1007/s00125-004-1454-z. [DOI] [PubMed] [Google Scholar]
- 19.Mezza T, Kulkarni RN. The regulation of pre- and post-maturational plasticity of mammalian islet cell mass. Diabetologia. 2014;57(7):1291–1303. doi: 10.1007/s00125-014-3251-7. [DOI] [PubMed] [Google Scholar]
- 20.Gerich JE. The genetic basis of type 2 diabetes mellitus: impaired insulin secretion versus impaired insulin sensitivity. Endocr Rev. 1998;19(4):491–503. doi: 10.1210/edrv.19.4.0338. [DOI] [PubMed] [Google Scholar]
- 21.Cohrs CM, et al. Dysfunction of persisting β cells is a key feature of early type 2 diabetes pathogenesis. Cell Rep. 2020;31(1):107469. doi: 10.1016/j.celrep.2020.03.033. [DOI] [PubMed] [Google Scholar]
- 22.Ferrannini E, et al. Predominant role of reduced beta-cell sensitivity to glucose over insulin resistance in impaired glucose tolerance. Diabetologia. 2003;46(9):1211–1219. doi: 10.1007/s00125-003-1169-6. [DOI] [PubMed] [Google Scholar]
- 23.Muscogiuri G, et al. Removal of duodenum elicits GLP-1 secretion. Diabetes Care. 2013;36(6):1641–1646. doi: 10.2337/dc12-0811. [DOI] [PMC free article] [PubMed] [Google Scholar]
- 24.Salinari S, et al. First-phase insulin secretion restoration and differential response to glucose load depending on the route of administration in type 2 diabetic subjects after bariatric surgery. Diabetes Care. 2009;32(3):375–380. doi: 10.2337/dc08-1314. [DOI] [PMC free article] [PubMed] [Google Scholar]
- 25.Tomei S, et al. Obesity susceptibility loci in Qataris, a highly consanguineous Arabian population. J Transl Med. 2015;13:119. doi: 10.1186/s12967-015-0459-3. [DOI] [PMC free article] [PubMed] [Google Scholar]
- 26.DeFronzo RA, et al. Glucose clamp technique: a method for quantifying insulin secretion and resistance. Am J Physiol. 1979;237(3):E214–E223. doi: 10.1152/ajpendo.1979.237.3.E214. [DOI] [PubMed] [Google Scholar]
- 27.Schrader H, et al. Impaired glucose-induced glucagon suppression after partial pancreatectomy. J Clin Endocrinol Metab. 2009;94(8):2857–2863. doi: 10.1210/jc.2009-0826. [DOI] [PubMed] [Google Scholar]
- 28.Mari A, et al. Impaired beta cell glucose sensitivity rather than inadequate compensation for insulin resistance is the dominant defect in glucose intolerance. Diabetologia. 2010;53(4):749–756. doi: 10.1007/s00125-009-1647-6. [DOI] [PubMed] [Google Scholar]
- 29.Matsuda M, DeFronzo RA. Insulin sensitivity indices obtained from oral glucose tolerance testing: comparison with the euglycemic insulin clamp. Diabetes Care. 1999;22(9):1462–1470. doi: 10.2337/diacare.22.9.1462. [DOI] [PubMed] [Google Scholar]
- 30.Stumvoll M, et al. Use of the oral glucose tolerance test to assess insulin release and insulin sensitivity. Diabetes Care. 2000;23(3):295–301. doi: 10.2337/diacare.23.3.295. [DOI] [PubMed] [Google Scholar]
Associated Data
This section collects any data citations, data availability statements, or supplementary materials included in this article.


