Abstract
Melanoma dedifferentiation has been reported to be a state of cellular resistance to targeted therapies and immunotherapies as cancer cells revert to a more primitive cellular phenotype. Here, we show that, counterintuitively, the biopsies of patient tumors that responded to anti–programmed cell death 1 (anti–PD-1) therapy had decreased expression of melanocytic markers and increased neural crest markers, suggesting treatment-induced dedifferentiation. When modeling the effects in vitro, we documented that melanoma cell lines that were originally differentiated underwent a process of neural crest dedifferentiation when continuously exposed to IFN-γ, through global chromatin landscape changes that led to enrichment in specific hyperaccessible chromatin regions. The IFN-γ–induced dedifferentiation signature corresponded with improved outcomes in patients with melanoma, challenging the notion that neural crest dedifferentiation is entirely an adverse phenotype.
Keywords: Oncology
Keywords: Cancer immunotherapy, Cytokines
Introduction
Cancer immunotherapy has remarkably improved the treatment landscape for patients with advanced melanoma. Melanoma is the result of a malignant transformation of melanocytes, which develop from neural crest cells during embryogenesis (1, 2). The melanoma cancer cells arise from different stages of differentiation between the neural crest precursors and fully differentiated melanocytes (2–6). Melanomas are not only highly heterogeneous, but they also display a large degree of plasticity that is highlighted by the ability of the differentiated cancer cells to dedifferentiate into a more neural crest–like phenotype. Melanoma dedifferentiation is defined by the loss of melanosomal antigens such as the melanoma antigen recognized by T cells 1 (MART-1/melan-A) or gp100, with the concomitant gain of neural crest markers such as the nerve growth factor receptor (NGFR, a.k.a. CD271) or AXL (5, 7, 8). The expression of the melanosomal antigens is driven by the microphthalmia associated transcription factor (MITF), the master regulator of melanoma differentiation (9, 10). Therefore, the downregulation of MITF is a major feature of dedifferentiation. This phenotypic plasticity has been associated with therapeutic resistance to BRAF inhibitors, which is a feature of drug-resistant cells that persist after the majority of other cells have been eliminated by the targeted therapy (5, 6, 8, 11, 12). This plasticity has also been shown to be a resistance mechanism against melanocytic antigen-specific T cell adoptive cell transfer therapy in both mice (13) and humans (14). Furthermore, the proinflammatory cytokine TNF was shown to induce this dedifferentiation (13, 14). The TNF-induced dedifferentiation was reversible with the removal of immune stimulation (14), suggesting that epigenetic and transcriptomic mechanisms may be at play.
Despite the multitude of studies on melanoma plasticity, its role in the context of immune checkpoint blockade therapy has not been elucidated. In fact, indirect evidence has led to the postulation that dedifferentiation would be a state of resistance to immunotherapy for melanoma (15–17). Therefore, we investigated whether melanocytic dedifferentiation is associated with a therapeutic response or resistance to programmed cell death 1 (PD-1) blockade therapy in patients with advanced melanoma.
Results
Loss of melanocyte lineage markers is associated with a clinical response to immune checkpoint blockade.
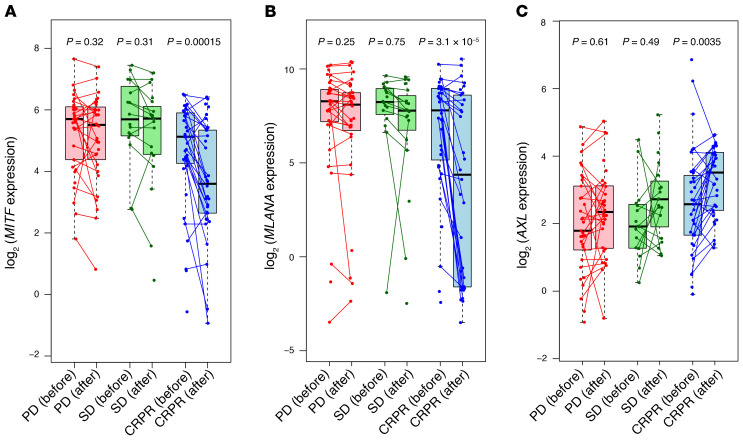
To study the effect of the melanocyte lineage differentiation state, we analyzed baseline and on-therapy biopsies from patients receiving immune checkpoint blockade (ICB) therapy in the CheckMate 038 clinical trial (18, 19). This was a prospective, multicenter, international, multicohort clinical trial designed to collect tumor biopsies from patients with metastatic melanoma treated with the anti–PD-1 antibody nivolumab as frontline therapy, or after progressing on therapy with the anti–cytotoxic T cell antigen 4 (anti–CTLA-4) antibody ipilimumab, or receiving the combination of both antibodies (18, 19). Of the 101 patients, 68 had paired biopsies, and of those paired biopsies, 27 were from patients with progressive disease (PD), 14 from patients with stable disease (SD), and 27 from patients with a complete response or a partial response (CRPR). On-therapy biopsies, collected from patients approximately 1 month after starting on ICB therapy, had notable downregulation of MITF and MART-1 (MLANA) and a concomitant upregulation of AXL only in the CRPR group. The biopsies from patients in the SD and PD groups did not display significant changes in MITF, MLANA, or AXL expression following treatment (Figure 1). This observation is at odds with the conventional view of dedifferentiation as a resistance mechanism (17), and indicates that dedifferentiation may serve as a marker of favorable response to immune checkpoint blockade. As the presence of IFN-γ signatures in biopsies is best correlated with a response to the anti–PD-1 therapy (19–21), we hypothesized that the dedifferentiation of these responding tumors may be mediated by continued exposure to T cells producing IFN-γ.
Figure 1. Human melanoma dedifferentiation is associated with a response to anti–PD-1 therapy.
(A) MITF, (B) MLANA, and (C) AXL gene expression levels in pre- and post-treatment biopsies from patients with PD, SD, or CRPR.
In vitro modeling of cytokine-induced melanoma dedifferentiation.
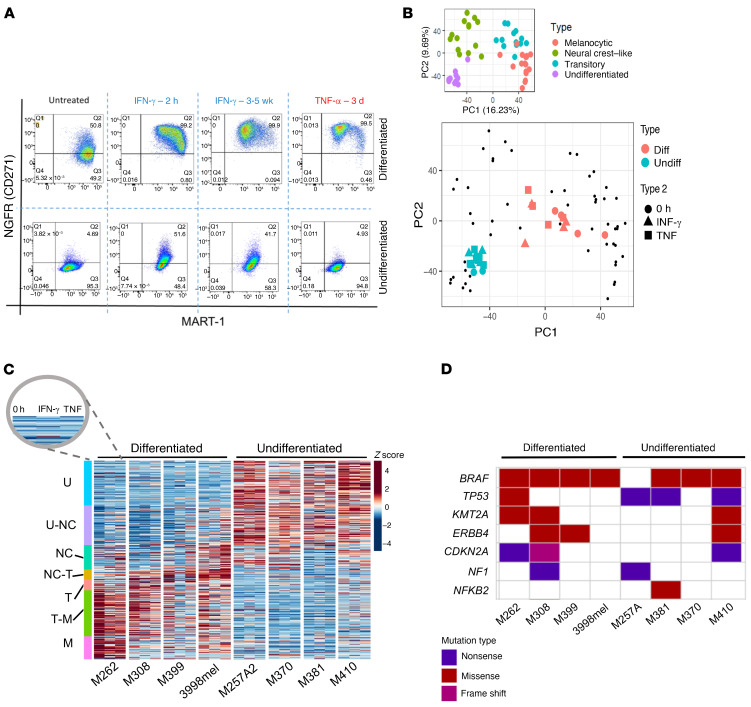
Previously, it has been reported that human melanoma cell lines can be categorized into 4 subtypes on the basis of their differentiation states: melanocytic, transitory, neural crest–like, and undifferentiated (6). Cell lines that are baseline differentiated, characterized by high expression of MART-1 and no expression of the neural crest marker NGFR, have an ability to become dedifferentiated upon exposure to TNF or a BRAF inhibitor (6, 13). To determine whether IFN-γ induces this same phenotypic change, we established an in vitro system to model the phenotypic plasticity. Four baseline differentiated human melanoma cell lines (M262, M308, M399, and 3998mel) were treated continuously with human recombinant IFN-γ, and the change in phenotype was compared with the dedifferentiation induced by 3 days of TNF treatment, which served as a positive control for melanoma dedifferentiation. Flow cytometry using fluorescent anti–MART-1 and anti-NGFR antibodies revealed dedifferentiation of these 4 cell lines over the course of 2 to 5 weeks (Figure 2A and Supplemental Figure 1A; supplemental material available online with this article; https://doi.org/10.1172/JCI145859DS1). The duration of continuous IFN-γ exposure needed to reach the maximal MART-1–low, NGFR-high state varied for each cell line but was comparable to the approximate 1-month time point at which the aforementioned biopsies were taken during the course of the patients’ anti–PD-1 therapy. In addition, in 4 human melanoma cell lines that were baseline undifferentiated (M257A2, M370, M381, and M410), neither cytokine induced dedifferentiation. Interestingly, continuous IFN-γ exposure led to what appears to be a redifferentiation of some of these cell lines. The cells increased NGFR levels with no change in MART-1 levels, a reversal of the last step of the previously described melanoma dedifferentiation trajectory from neural crest–like to undifferentiated (Figure 2A, Supplemental Figure 1A, ref. 6).
Figure 2. Human melanoma dedifferentiation is induced by exposure to IFN-γ.
(A) Flow cytometric data for MART-1 and NGFR in the human melanoma cell lines M262 (baseline differentiated) and M370 (baseline undifferentiated) in response to TNF or IFN-γ exposure. (B) Projection of cytokine-treated cell lines onto melanoma M series differentiation PCA (6). Diff, baseline differentiated; undiff, baseline undifferentiated. (C) Expression of melanoma differentiation genes for 0 hour, IFN-γ, and TNF across cell lines. U, undifferentiated at baseline, U-NC, undifferentiated neural crest–like, NC, neural crest–like, NC-T, neural crest–like transitory, T, transitory, T-M, transitory melanocytic, M, melanocytic. Colors represent z scores. (D) Common melanoma mutations across cell line studies. Nonsense or missense JAK/STAT mutations were not observed.
Concordant transcriptomic programs reflect the phenotypic plasticity driven by IFN-γ and TNF.
To study the mechanism of this cytokine-induced cellular plasticity, we performed whole-transcriptome RNA-Seq and assayed for transposase-accessible chromatin sequencing (ATAC-Seq) on the aforementioned 8 cell lines — 4 that were differentiated at baseline and dedifferentiated with IFN-γ exposure, and 4 that were undifferentiated at baseline and did not differentiate further with continuous IFN-γ exposure — as well as the same cell lines exposed to 3 days of TNF as a positive control (Figure 2A).
To assess the effect of cytokine treatment on the melanoma transcriptome, we projected all samples onto a previously defined principal component analysis (PCA) framework of 54 baseline human melanoma cell lines spanning the 4 defined differentiation states (6). As expected, the projection of the 8 cell lines segregated according to the baseline differentiation status, with the dedifferentiated samples from either cytokine shifting toward a more neural crest–like state within the defined dedifferentiation trajectory (Figure 2B). We also interrogated the gene expression profiles of our samples for the enrichment of previously defined gene signatures for various melanoma differentiation states, from melanocytic to undifferentiated. We observed a clear downregulation of the melanocytic subtype signature with either cytokine-driven dedifferentiation, with a concomitant enrichment of the neural crest or transitory subtype signatures (Figure 2C). We found no distinguishing patterns between the 2 groups of cell lines with regard to nonsense or missense mutations in well-studied relevant genes that may have contributed to the observed differences (Figure 2D). In addition, neither group harbored consequential mutations in genes that code for critical members of the IFN-γ response pathway, as previously reported in melanoma tumors (22, 23), suggesting that these cell lines all activate IFN-γ–dependent transcription factors upon stimulation (Supplemental Figure 1B and Supplemental Figure 2, A and B).
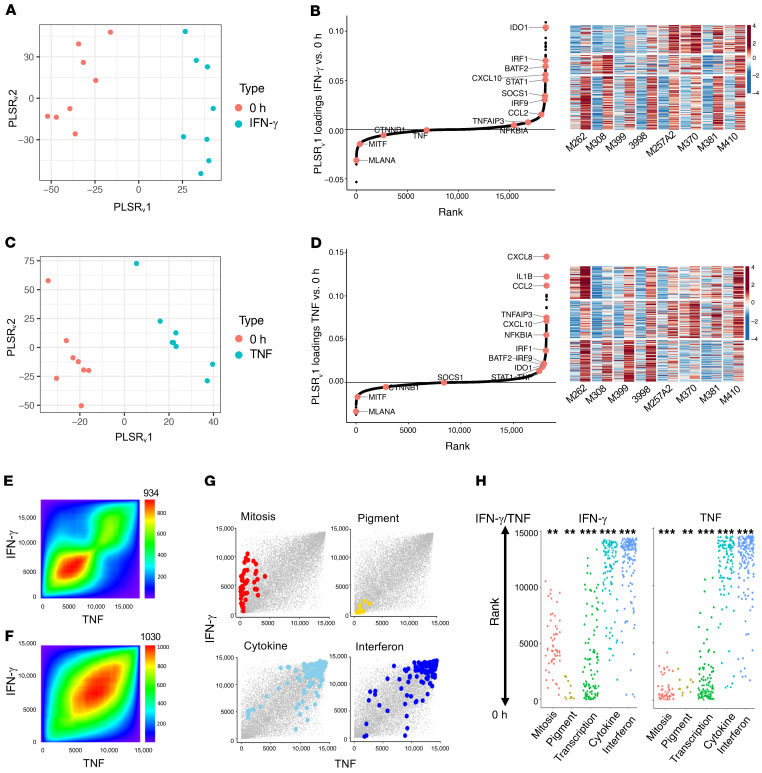
In order to identify commonly induced genes across all cell lines, we performed partial least squares regression (PLSR) on baseline versus cytokine-exposed cell lines. All 8 samples had clear cytokine responses regardless of their baseline differentiation status (Figure 3, A and C), which confirms that the difference in phenotype was not attributable to any lack of cytokine response in 1 group. Ranking of the genes induced by continued IFN-γ exposure across the 8 cell lines revealed upregulation of IFN regulatory factor 1 (IRF1), SOCS1, and STAT1 (Figure 3B and Supplemental Table 1). The K-means clustering of the top 300 upregulated genes revealed a cluster of genes that were commonly induced to similar levels in both baseline-differentiated and undifferentiated cell lines upon continued IFN-γ exposure (Figure 3B). It also revealed a distinct cluster of genes that were strongly induced in only the undifferentiated cell lines (Figure 3B), which suggests the induction of a transcriptional response from these cell lines despite their already dedifferentiated state. The clusters of genes highly upregulated in the dedifferentiating group were also upregulated to similar levels in the baseline undifferentiated group, which indicates that the IFN-γ downstream signaling was preserved regardless of the differentiation status and suggests that epigenetic differences not captured by the gene expression analysis may be responsible for the diverging plasticity. The ranking of genes induced by TNF across the 8 cell lines pointed to a much stronger upregulation of TNF, TNFAIP3, and NFKBIA in comparison with their rank in the IFN-γ analysis (Figure 3D and Supplemental Table 1). The K-means clustering of the top 300 upregulated genes revealed a cluster of genes that were much more strongly induced in the samples that dedifferentiated, indicating a transcriptional program induced by TNF that is unique to cells capable of the phenotypic switch. We additionally looked at the cross enrichment of 1 cytokine with the top 300 induced genes from the other. The TNF matrix with the top 300 IFN-γ–induced genes and the IFN-γ matrix with the top 300 TNF-induced genes showed similar levels of induction (Supplemental Figure 2, C and D).
Figure 3. IFN-γ and TNF stimulation induces the expression of common genes across cell lines to generate comparable MART-1–low/NGFR-high dedifferentiation states.
(A) Varimax-rotated PLSR on IFN-γ–exposed samples compared with 0-hour (untreated) samples. (B) Left: Genes contributing to a common IFN-γ response across samples. Right: K-means clustering of top 300 gene loadings. Left column shows untreated and right column shows after IFN-γ exposure for each cell line. (C) Varimax-rotated PLSR on TNF compared with untreated samples. (D) Left: Genes contributing to a TNF response across samples. Right: K-means clustering of top 300 gene loadings. Left column shows untreated and right column shows after TNF exposure for each cell line. (E) Overlap of IFN-γ– and TNF-induced gene expression by ranked loadings. (F) Concordant GO term overlap (NESs) between IFN-γ– and TNF-induced gene expression. The number shown at the top of E and F is the maximum –log10(P value) of the RRHO heatmap. (G and H) Enrichment of gene sets involving pigmentation, mitosis, transcription, IFN signaling, and cytokines following IFN-γ or TNF exposure. *P < 0.1, **P < 0.01, and ***P < 0.001, by signed KS test.
To determine whether the IFN-γ– and TNF-induced dedifferentiation states had similar gene expression profile changes, we performed rank-rank hypergeometric overlap analysis (24), which revealed substantial overlap in IFN-γ– and TNF-induced genes (Figure 3E), with an even higher degree of overlap at the gene set level (Figure 3F). These data indicate concordant gene programs despite the difference in the inducible expression of individual genes. Examination of the enrichment of the terms from gene set enrichment analysis (GSEA), or GSEA-squared (25), confirmed the loss of pigmentation with the gain of inflammatory signaling following IFN-γ and TNF exposures (Figure 3, G and H, and Supplemental Table 2).
TNF and IFN-γ induce dedifferentiation via distinct global chromatin landscape alterations.
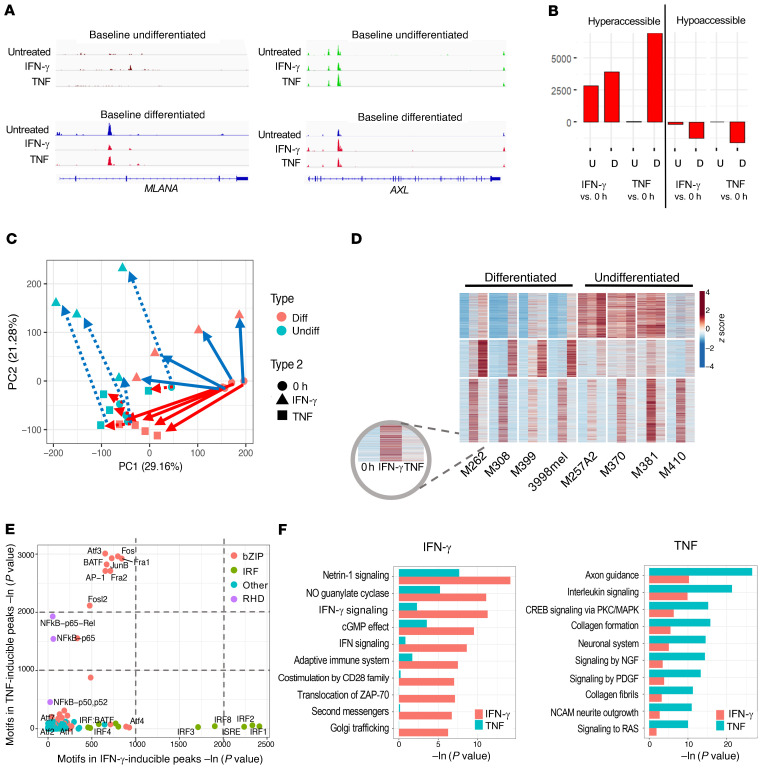
Evaluation of the ATAC-Seq tracks at the promoter of MLANA revealed no basal chromatin accessibility in undifferentiated cell lines as well as a decrease in chromatin accessibility of the differentiated cell lines upon IFN-γ– or TNF-induced dedifferentiation, consistent with the flow cytometric and RNA-Seq data (Figure 4A). ATAC-Seq tracks at the promoter of AXL also revealed the expected pattern, with no changes in the baseline undifferentiated cell lines upon cytokine exposure, as well as increased peaks in the baseline differentiated cell lines when they dedifferentiated upon cytokine exposure (Figure 4A). Pair-wise comparisons of cytokine-stimulated with unstimulated cell lines revealed between 2500 and 7000 peaks that were hyperaccessible following either IFN-γ or TNF exposure (Figure 4B). Interestingly, IFN-γ induced a similar number of hyperaccessible peaks for both the baseline differentiated and the undifferentiated cell lines, but TNF induced a large number of hyperaccessible peaks only in baseline differentiated cell lines (Figure 4B). PCA of all induced ATAC-Seq peaks showed that the baseline differentiated and the undifferentiated cell lines existed in 2 different epigenomic states. TNF exposure in undifferentiated cell lines caused minimal epigenetic changes but drove drastic changes toward the undifferentiated state in the baseline differentiated ones, consistent with the transcriptional response (Figure 4C). The baseline differentiation states and the shared phenotypic change due to IFN-γ and TNF exposure were best represented by PC1, whereas PC2 best defined the divergence in the effects of the 2 cytokines, revealing the IFN-γ–specific response. Despite inducing the comparable changes in NGFR and MART-1 status based on protein expression, exposure to either of the 2 cytokines resulted in distinctive chromatin alterations, which manifested as a shift along 1 or both axes of the PCA analysis. Of note, PC2 also supported the redifferentiation phenomenon (Figure 4C) observed in the flow cytometric data (Figures 2A and Supplemental Figure 1A).
Figure 4. IFN-γ, compared with TNF, alters the chromatin landscape in a stimulus-specific manner.
(A) Examples of hyperaccessible peaks upon cytokine stimulation. (B) Total number of hyper- and hypoaccessible peaks called for each listed comparison. U, undifferentiated at baseline; D, differentiated at baseline. (C) PCA of peaks differentially hyperaccessible from baseline after cytokine treatment. (D) K-means clustered heatmap of induced ATAC-Seq peaks across any stimulation condition for differentiated and undifferentiated melanomas (subcolumns are in the order 0 hour, IFN-γ, and TNF for each cell line). (E) Motif enrichment of IFN-γ– compared with TNF-induced genes. bZIP, basic leucine zipper domain; RHD, rel homology domain. (F) Top divergent GO terms of nearby genes for IFN-γ– versus TNF-specific peaks.
K-means clustering of accessible chromatin peaks induced by either cytokine revealed that the changes in chromatin accessibility fell into 3 main patterns: IFN-γ–inducible across the 2 baseline states, TNF-inducible, but only in the differentiated cell lines, and common to both IFN-γ and TNF, but only in the undifferentiated cell lines where these regions were open at baseline (Figure 4D and Supplemental Figure 3A). This suggests the presence of a high baseline signaling pathway that may be responsible for the lack of a further response to stimulation by TNF. Motif enrichment analysis of the ATAC peaks revealed distinct clusters of transcription factors whose binding sites were opened upon IFN-γ or TNF exposure. Notably, no common motifs were enriched to comparable levels in the IFN-γ– and TNF-induced peaks. The motifs of select IRF proteins were the most highly enriched following IFN-γ treatment, whereas the motifs of the ATF3, BATF, and AP-1 family factors were the most highly enriched following TNF treatment, even more so than those of NF-κB (Figure 4E and Supplemental Figure 3B). Both TNF and IFN-γ exposures led to largely hyperaccessible chromatin in intergenic regions that were associated with axon guidance and cell migration (Figure 4F). However, their effects were distinct, in that TNF opened chromatin regions near genes associated with MAPK pathway, neuronal system, and growth factor signaling, whereas IFN-γ generated stronger enrichment for chromatin regions near genes involved in the IFN response and antigen presentation (Figure 4F).
Motif enrichment analysis of hyperaccessible chromatin regions following IFN-γ and TNF exposure reveals regulators involved in dedifferentiation.
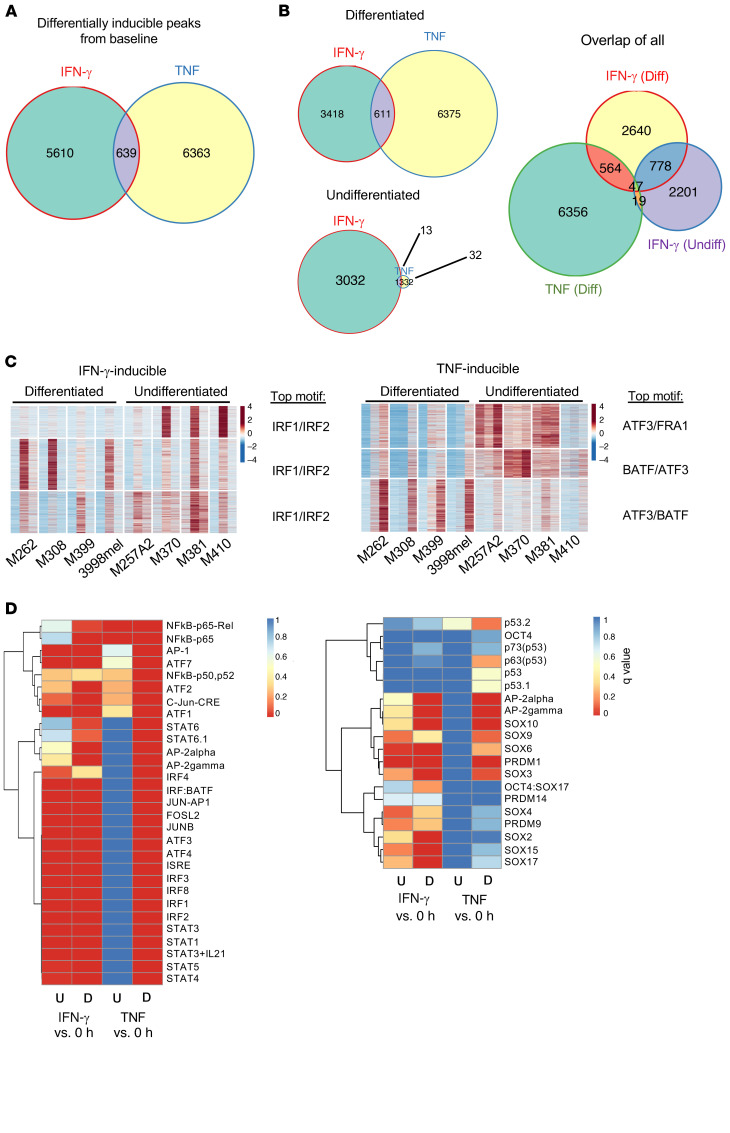
We next asked how the baseline differentiation states of the melanoma cell lines, their baseline epigenomic profiles, and signaling network affected their response to IFN-γ stimulation. Although similar numbers of peaks were found to be inducible by IFN-γ in baseline differentiated and undifferentiated cell lines, we detected minimal overlap in the induced regions, and neither of the inducible peaks overlapped significantly with TNF-inducible peaks (Figure 5, A and B). Thus, although both TNF and IFN-γ led to a parallel transition to the dedifferentiated phenotype defined by similar gene programs, their effects on the chromatin landscape were stimulus specific. Notably, the undifferentiated cell lines had minimal chromatin remodeling in response to TNF, despite the observed changes in gene expression. In addition, when exposed to continuous IFN-γ, these lines had levels of remodeling comparable to that of the baseline differentiated cell lines, although they did not undergo further phenotypic dedifferentiation. As the majority of the IFN-γ–induced peaks for the 2 groups did not overlap (Figure 5B), the overall response to IFN-γ seemed to depend on the cell line’s baseline epigenomic state.
Figure 5. The basal chromatin landscapes of differentiated and undifferentiated lines result in distinct epigenomic responses upon cytokine stimulation.
(A) Overlap of induced IFN-γ and TNF ATAC-Seq peaks. (B) Overlap of peaks separated by cell line baseline state. (C) Heatmap of differentially IFN-γ–inducible peaks for baseline differentiated and undifferentiated cell lines, with the top motif for each cluster listed (subcolumns are in the order 0 hour, IFN-γ, and TNF for each cell line), and heatmap of differentially TNF-inducible peaks for baseline differentiated and undifferentiated lines, with the top motif for each cluster listed. (D) Motif enrichment of IFN-γ– compared with TNF-inducible peaks for baseline differentiated and undifferentiated cell lines separately. Colors represent q values.
In order to dissect the peaks that may have been attributable to the differences in phenotypic plasticity, we used all the peaks that were significantly induced from baseline by either IFN-γ or TNF to perform K-means clustering (Figure 5C). Despite the evidence of cell line heterogeneity, the top transcription factors whose motifs were enriched in the induced peak regions were common across all 3 clusters for both cytokines. This suggests that, of all IRF1 or IRF2 binding sites throughout the genome that opened in response to IFN-γ, certain sites selectively opened in undifferentiated cell lines (Figure 5C). Similarly, of all ATF3 or BATF binding sites in the genome, certain sites opened only in the cell lines that dedifferentiated in response to TNF (Figure 5C).
Upon IFN-γ exposure, most IRF and STAT binding sites became hyperaccessible in baseline differentiated and undifferentiated groups except for STAT6. The binding motifs of STAT6 and AP-2 proteins were enriched in the peaks in dedifferentiating cells only, driven by either cytokine. Upon TNF exposure, the inducible peaks were highly enriched in IRF and STAT binding sites only in the dedifferentiating group y (Figure 5D). TNF is known to trigger MAPK pathways, which lead to the transcription factor activity of ATF and AP-1 proteins. Motif enrichment analysis revealed that the TNF stimulus led to the opening of the binding sites of AP-1 factors (Fosl1, Jun-AP, JunB, AP-1, c-Jun, JunD) following TNF-induced dedifferentiation, with no enrichment of these motifs in the inducible peaks of the undifferentiated cell lines following TNF exposure. On the contrary, the inducible peaks from all samples exposed to IFN-γ, regardless of baseline differentiation state, exhibited enrichment of the AP-1 family protein motifs (Figure 5D). In addition, PRDM1 was another factor whose motif had enrichment only in TNF-induced peaks, whereas the motif for Oct4:Sox17 was only enriched in IFN-γ–induced peaks. Altogether, these data show that the baseline epigenomic state of the melanoma cells was the determinant of the resultant differential chromatin landscape modifications following IFN-γ or TNF cytokine exposure.
Inferred regulator activity analysis suggests common regulator activity changes between TNF- and IFN-γ–induced dedifferentiation.
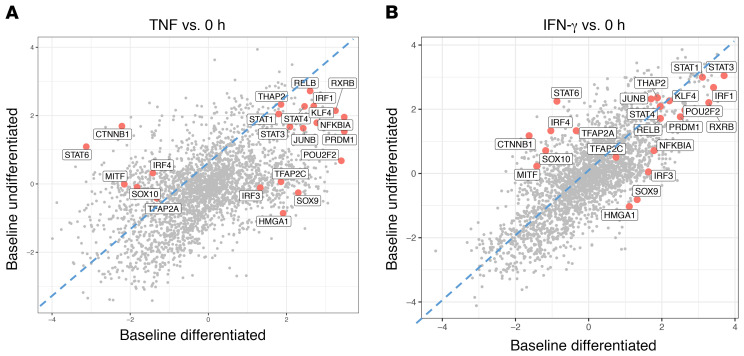
Given the similar binding motifs within families of transcription factors, such as within several IRFs, the NF-κB family proteins, and MAPK-activated transcription factors, we next explored the inferred activity of these candidate immune-signaling transcription factors. Using ARACNe (Algorithm for the Reconstruction of Accurate Cellular Network), which applies mutual information to connect regulators and target genes, we constructed reverse-engineered melanoma-specific, IFN-γ response–specific transcriptional networks. We next used VIPER (Virtual Inference of Protein Activity by Enriched Regulon) to infer the differential activity of over 9000 regulators in cytokine-treated versus baseline cell lines. In both TNF- and IFN-γ–exposed cell lines, the regulators TFAP2C (AP-2γ), SOX9, IRF3, and HMGA1 had high inferred activity only with dedifferentiation, confirming the ATAC-Seq data. On the other hand, MITF, β-catenin, and SOX10 had decreased inferred activity only in the dedifferentiating cell lines. In addition, the transcription factors PRDM1, NFKBIA, RXRB, and POU2F2 had positive changes in activity in both groups, albeit with higher activity in the dedifferentiating group (Figure 6, A and B). In addition, the comparison of this gene expression level–derived inferred activity of regulators between TNF and IFN-γ–exposed samples showed strong overlap of inferred activity changes in response to each cytokine (Supplemental Figure 4, A–D).
Figure 6. Differentiated and undifferentiated cell lines respond to cytokine stimulation with differences in inferred activity of both signal-dependent and lineage-determining transcription factors.
(A and B) VIPER analysis showing inferred transcription factor activity for baseline differentiated versus undifferentiated cell lines following (A) TNF or (B) IFN-γ exposure. Regulators such as PRDM1, HMGA1, and SOX9 had high inferred activity only in the baseline differentiated group.
Changes in lipid, ribosomal, mitochondrial, and adhesion processes distinguish the TNF- and IFN-γ–induced responses in baseline differentiated versus undifferentiated cell lines.
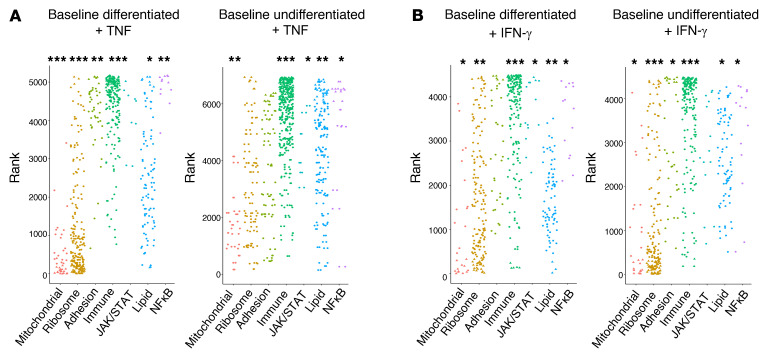
To increase our understanding of this new effect of IFN-γ on melanoma cells, we performed analysis of the molecular and cellular changes defining proinflammatory cytokine–driven dedifferentiation. We used GSEA-squared analysis on gene expression signatures for differentiated and undifferentiated cell line groups exposed to IFN-γ or TNF and looked for the enrichment of programs and processes of interest. All cell lines upregulated immune and inflammatory programs, but the undifferentiated cell lines did not change phenotype with TNF exposure. The differences in TNF-induced chromatin remodeling observed between differentiated and undifferentiated cell lines was correlated with the control of lipid, ribosomal, mitochondrial, and adhesion gene programs (Figure 7A). For IFN-γ, in both the differentiated and undifferentiated cell lines, immune response gene programs were commonly upregulated, while ribosomal and mitochondrial gene sets were downregulated. Consistent with differentiated and undifferentiated cell lines exhibiting a more equal magnitude of IFN-γ–induced chromatin accessibility changes, we also noted fewer divergent gene set categories between these 2 groups under IFN-γ exposure (Figure 7B).
Figure 7. Gene expression differences between differentiated and undifferentiated cell lines may be attributed to lipid, ribosomal, mitochondrial, and adhesion processes.
(A and B) Enrichment of gene set groups (C5: GO gene sets), based on ranked lists of differentially expressed genes, for TNF and IFN-γ.*P < 0.1, **P < 0.01, and ***P < 0.001, by signed KS test.
Enrichment of the IFN-γ–induced dedifferentiation signature during anti–PD-1 therapy is associated with response.
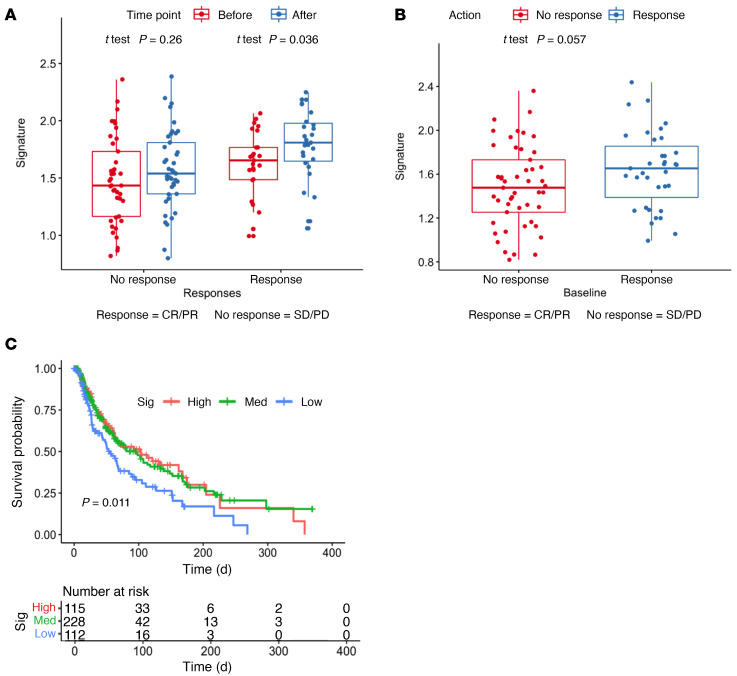
Dedifferentiation of melanoma has been considered a form of resistance to therapy and associated with worse survival of patients (5, 6, 8, 11, 12). However, because we observed the opposite correlation between a high AXL/MITF ratio in biopsies from patients who were responding to anti–PD-1 therapy, we sought to further investigate whether the full IFN-γ–driven dedifferentiation signature correlated with the therapeutic response. From the 7 signatures (4 main signatures, 3 transitional signatures) spanning the 4 previously defined melanoma subtypes obtained from a previous study (6), the melanocytic subtype was excluded, and the remaining genes were filtered for the genes with a log2 fold change of greater than 1 with IFN-γ treatment. These select upregulated genes henceforth comprised our IFN-γ–induced dedifferentiation signature (Supplementak Table 3), which was used to interrogate the CheckMate 038 biopsy cohort (19). An increase in the expression of the signature was found following anti–PD-1 therapy in biopsies of patients with an objective response (CRPR), with no significant changes from baseline among the nonresponding biopsies (Figure 8A). Therefore, patients’ biopsies taken while responding to PD-1 blockade therapy showed phenotypic dedifferentiation, whereas biopsies from nonresponding patients did not show a change in their differentiation state.
Figure 8. Enrichment of IFN-γ–induced dedifferentiation gene signatures in melanomas correlates with the response to anti–PD-1 and better overall survival.
(A) Enrichment of the dedifferentiation signature in the paired pre- and post-treatment biopsies (n = 68) from responders and nonresponders in the CheckMate 038 biopsy cohort. (B) Enrichment of the dedifferentiation signature in the baseline biopsies from the CheckMate 038 biopsy cohort, including the paired and unpaired biopsies (n = 101), from responders and nonresponders. (C) Correlation of baseline enrichment of the dedifferentiation signature (Sig) with overall survival in TCGA melanoma data set. med, medium.
Baseline dedifferentiation in melanoma is associated with a response to anti–PD-1 therapy and improves outcomes.
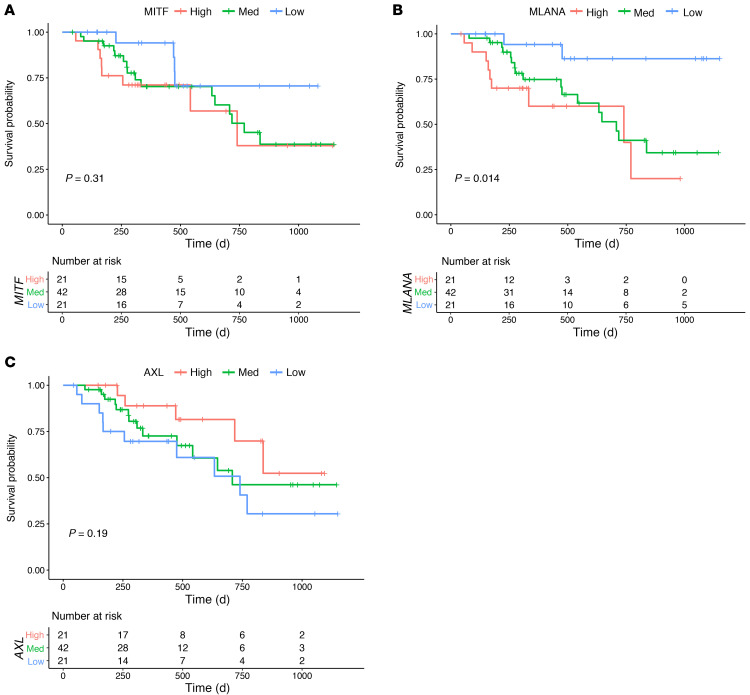
Finally, we analyzed whether the IFN-γ–induced dedifferentiation signature could be a baseline prognostic or predictive marker in the CheckMate 038 biopsy cohort, which is representative of advanced and metastatic melanoma samples, and in the melanoma The Cancer Genome Atlas (TCGA) repository, which is mainly representative of primary melanomas and lymph node metastases. We noted a significant spread in the expression of the IFN-γ–induced dedifferentiation signature at baseline in the CheckMate 038 biopsy cohort, but separation of these 101 baseline biopsies according to the response to therapy showed that the biopsies from patients who went on to respond were more likely to have an increased IFN-γ–induced dedifferentiation signature (P = 0.06, by Wilcoxon test, Figure 8B). Moreover, the IFN-γ–induced dedifferentiation signature also correlated positively with overall survival in TCGA melanoma data set. Patients whose melanomas had high or intermediate expression of the IFN-γ dedifferentiation signature displayed improved overall survival compared with those with low expression of the signature (Figure 8C). Finally, we confirmed the importance of the melanocytic differentiation state in patient outcomes by analyzing the 84 baseline biopsies from CheckMate 038 for the effect on patient survival of the expression levels of MITF and MLANA compared with AXL. We divided the data into 3 groups on the basis of the upper and lower quartiles of the log2 fragments per kilobase of exon per million fragments mapped (FPKM) expression level of each gene. Patients whose baseline biopsies had low expression of the melanocytic markers MITF (Figure 9A) and MLANA (Figure 9B) had improved survival, whereas the group with high AXL expression had improved survival (Figure 9C).
Figure 9. Survival plots.
Survival plots based on the analysis of (A) MITF, (B) MLANA, and (C) AXL. Analysis of the baseline biopsy samples (n = 84) from patients treated with nivolumab with or without ipilimumab in the CheckMate 038 trial. The graphs separate the upper and lower quartiles of the log2 FPKM of each gene.
Discussion
Here, we report what we believe to be a previously unobserved facet of IFN-γ, whereby continuous exposure to IFN-γ propelled melanoma cells toward an altered phenotype with diminished expression of melanosomal markers and increased expression of neural crest markers. Moreover, we demonstrate that melanoma cells exposed to IFN-γ and TNF reached 2 distinct epigenomic states of dedifferentiation, despite displaying similar phenotypic dedifferentiation. IFN-γ elicited pronounced remodeling of the chromatin landscape in all tested melanoma cell lines, regardless of the baseline differentiation status. We observed a number of regulators that have been implicated in melanocyte differentiation, and it is possible that the change in the activity of these regulators may facilitate the backward trajectory. For one, based on our VIPER analysis, β-catenin activity was inferred to be decreased in response to TNF- and IFN-γ–induced dedifferentiation, and Wnt/β-catenin signaling is known to play a role in human melanocyte development from neural crest cells (26). Activator protein 1 (AP-1) has been linked to dedifferentiation in the setting of TNF-induced dedifferentiation in mouse models (27), and we found that it was one of the top enriched motifs in the chromatin regions opened in TNF-dedifferentiated cells and also in IFN-γ–dedifferentiated cells, albeit to a much lesser degree. On the other hand, our analyses also revealed transcription factors with previously unknown involvement in the phenotypic plasticity of human melanomas.
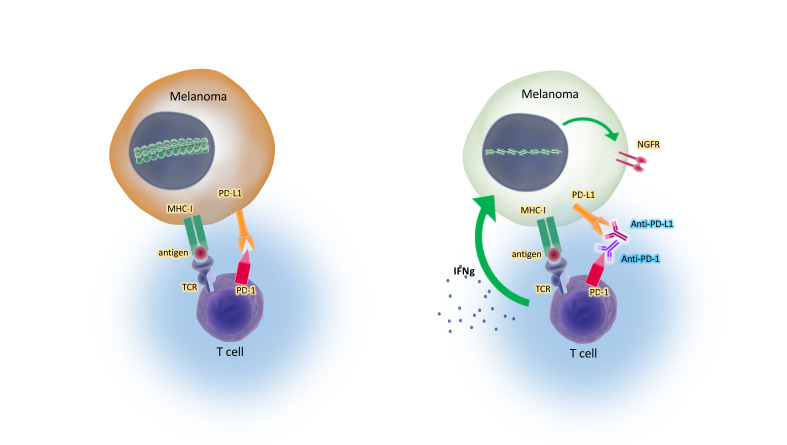
Contrary to the conventional belief that melanocytic dedifferentiation is a state of therapeutic resistance to targeted therapies and immunotherapies (5, 6, 8, 11, 12, 17), we show that the consequence of this phenotypic plasticity depends on the context of the therapy. While it is a resistance mechanism against adoptive cell transfer using T cells against melanosomal antigens (13, 14), we show that it is a surrogate marker for a positive response to immune checkpoint blockade therapy. Tumor infiltration by tumor-specific T cells triggers their T cell receptor (TCR) and downstream IFN-γ production upon antigen encounter, which is the mechanistic basis of responses to anti–PD-1 therapy. One of the advantages of IFN-γ signaling in cancer cells is the reactive expression of the PD-1 ligand 1 (PD-L1), which provides a means for the cancer cells to protect themselves from tumor antigen–specific T cell killing (28). These T cells continue to be present in specific regions of the tumor (29), and their production of IFN-γ is a favorable prognostic factor that can be detected by a transcriptome of IFN-γ response genes (19–21). Once the negative interaction between PD-1 and PD-L1 is released by checkpoint therapies, the antitumor T cells proliferate and produce increased IFN-γ, leading to an amplification of the antitumor immune response that mediates the clinical benefits (19, 28, 29). Therefore, our observation that responding melanoma biopsies undergo dedifferentiation is highly concordant with our discovery in cell culture model systems that continuous exposure to IFN-γ in differentiated melanomas leads to this phenotypic change. Moreover, in both the biopsies from patients treated with anti–PD-1 and TCGA melanoma database, we noted that the IFN-γ–induced dedifferentiation transcriptional signature was associated with improved outcomes. In both cases, it is likely that the dedifferentiation was an indirect reflection of IFN-γ produced by tumor antigen–specific T cells. However, since only melanomas that are originally phenotypically differentiated can undergo dedifferentiation upon chronic IFN-γ exposure, in these 2 series the baseline dedifferentiation group was likely to include both melanomas that were originally dedifferentiated independent of a T cell response, and originally differentiated melanomas that dedifferentiated upon T cell recognition and IFN-γ production. This dual mechanism leading to dedifferentiation resulted in difficulty in interpreting the patients’ biopsy data.
It has been shown that IFN-γ from skin-infiltrating CD8+ cytotoxic T cells can inhibit the expression of MITF in normal melanocytes (30), indicating that this phenotypic response to proinflammatory cytokines may be conserved from melanocytes to melanomas. Therefore, the ability to change the phenotype upon cytokine exposure may have biological advantages that are independent of the malignant transformation of melanocytes. The specific mechanism of how IFN-γ leads to the loss of MITF and gain of neural crest lineage markers is unknown; nonetheless, this study helps to elucidate the epigenetic landscape that characterizes the new phenotypic endpoint driven by IFN-γ and the transcriptional regulators that may be partaking in eliciting this change. In summary, melanoma dedifferentiation can be induced by chronic IFN-γ exposure and is associated with improved outcomes in patients with melanoma.
Methods
Patients’ biopsy samples and RNA-Seq.
The study CheckMate 038 (NCT01621490) was a multi-arm, multi-institutional, prospective study to investigate the effects of nivolumab (3 mg/kg every 2 weeks) as a single agent, or the combination of nivolumab (1 mg/kg every 3 weeks) plus ipilimumab (3 mg/kg every 3 weeks) given in 4 doses and followed by the single agent nivolumab (3 mg/kg every 2 weeks) (18, 19). Patients were treated until their disease progressed or for a maximum of 2 years, or they stopped therapy because of toxicities. Radiographic assessment of the patient’s response was performed approximately every 8 weeks until disease progression occurred. Progression was confirmed with a repeat CT scan at least 4 weeks later. Patients’ tumor response was defined according to Response Evaluation Criteria in Solid Tumors (RECIST), version 1.1. A response to therapy indicates the best overall response unless otherwise indicated. All patients underwent a baseline biopsy before commencing therapy (1–7 days before the first dose) and a repeat biopsy on cycle 1, day 29 (between days 23 and 29).
Baseline and on-therapy tumor tissue biopsies were stored with RNAlater (Ambion, Thermo Fisher Scientific) for subsequent RNA extraction using QIAGEN kits. Of 170 patients, 101 had a sufficient amount of RNA for RNA-Seq (Figure 1). The RNA-Seq library was prepared using an Illumina TruSeq Stranded mRNA kit. Sequencing was done on an Illumina HiSeq sequencer using paired-end sequencing of 50 bp for each mate pair. RNA-Seq reads were mapped using HISAT2, version 2.0.4 (31) and aligned to the hg19 genome using default parameters. Reads were quantified by HTSeq, version 0.6.1 (32) with the intersection–non-empty mode and counting ambiguous reads if they fully overlapped. Raw counts were then normalized to FPKM expression values.
Cell culture and in vitro cytokine stimulation.
Human melanoma cell lines (M series) were established from patients’ biopsies, and the human melanoma cell line 3998mel was provided by Alena Gros (Vall d’Hebron Institute of Oncology, Cellex Center, Barcelona, Spain) (33). Cells were cultured in RPMI 1640 with l-glutamine (Mediatech), 10% FBS (Omega Scientific), and 1% penicillin-streptomycin (Omega Scientific) followed by incubation in a water-saturated incubator at 37°C in 5% CO2. Cell lines were periodically authenticated to their early passages using the GenePrint 10 System (Promega). Human recombinant IFN-γ (MiliporeSigma) and human recombinant TNF (Peprotech) were each reconstituted in molecular-grade water to 0.5 mg/mL and diluted in 0.1% BSA in PBS to 0.1 mg/mL before applying to the cell culture media. The cytokines were stored at –80°C. For in vitro long-term IFN-γ experiments, cell lines were expanded and seeded onto 10 cm tissue culture–treated plates at 70% confluence. After 24 hours to allow the cells to adhere to the plates, new cell culture media containing 500 U/mL human recombinant IFN-γ protein were added. The cells were replenished with IFN-γ–containing media every 2 to 3 days. Cells were seeded onto multiple tissue culture plates and treated concurrently, so that a plate of cells could be harvested to perform flow cytometry each week without perturbing the rest of the cells and their ongoing exposure to IFN-γ. For in vitro TNF experiments, the dose and duration of exposure were kept the same as those for the previously reported study for use as a positive control (13). Therefore, media containing 1000 U/mL of human recombinant TNF were added to plates of seeded cells and kept unperturbed for 3 days until the cells were harvested for downstream experiments.
Flow cytometry.
Cells were trypsinized, washed with PBS, and pelleted by centrifugation at 4°C for 5 minutes at 1500 rpm. All subsequent steps were performed with the cells on ice. The Zombie Violet Fixable Viability Kit (BioLegend) was used according to the manufacturer’s instructions. Next, cells were incubated in FBS for 10 minutes to block unspecific binding. Cells were then incubated with anti-NGFR (phycoerythrin [PE]) antibody (BioLegend) in PBS for 20 minutes. Following a wash, Cytofix/Cytoperm Fixation and Permeabilization Solution (BD Biosciences) was used according to the manufacturer’s instructions to allow for subsequent intracellular MART-1 staining. All subsequent wash steps were performed using 1× Perm/Wash Buffer (BD Biosciences). Cells were incubated with anti–MART-1 (Alexa Fluor 647) antibody (Santa Cruz Biotechnology) for 20 minutes and washed. OneComp eBeads compensation beads (Thermo Fisher Scientific) were used for compensation. The samples were run on the FACSCelesta Flow Cytometer (BD Biosciences), and the data were analyzed with FlowJo software (TreeStar).
RNA-Seq.
RNA extraction was performed using the AllPrep DNA/RNA Mini Kit (QIAGEN). Library preparation was performed at UCLA’s Technology Center for Genomics and Bioinformatics (TCGB). RNA was sequenced on the HiSeq 3000 Sequencing System (Illumina) for a single-end, 50 bp run. Data quality was checked with Sequencing Analysis Viewer software (Illumina), and demultiplexing was performed using bcl2fastq2 Conversion Software, version 2.17 (Illumina). Raw FASTQ data files were aligned to the hg19 genome using HISAT2, version 2.0.4, with default parameters and counted using HTSeq, version 0.6.1. The raw counts were normalized to FPKM. DESeq2 was used to perform differential gene expression analysis. The raw RNA data were deposited in the NCBI’s Gene Expression Omnibus (GEO) database (GEO GSE152755).
Omni-ATAC library preparation and sequencing.
Cultured cells were harvested by trypsinization and were checked for greater than 90% viability. After the cells were counted, 50,000 cells were resuspended in 1 mL cold ATAC-Seq resuspension buffer (RSB) (10 mM Tris-HCl, pH 7.4, 10 mM NaCl, and 3 mM MgCl2 in water). Cells were centrifuged at 500 RCF for 5 minutes at 4°C in a fixed-angle centrifuge. Supernatant was carefully removed using 2-step pipetting to avoid the cell pellet. Cell pellets were then resuspended in 50 μL ATAC-Seq RSB containing 0.1% NP40, 0.1% Tween-20, and 0.01% digitonin by pipetting up and down 3 times. This cell lysis reaction was incubated on ice for 3 to 5 minutes, with the lysis time optimized for each sample. After lysis, 1 mL ATAC-Seq RSB containing 0.1% Tween-20 was added, and the tubes were inverted for mixing. Nuclei were then centrifuged for 10 minutes at 500 RCF at 4°C in a fixed-angle centrifuge. Supernatant was carefully removed with 2-step pipetting, and the nuclei were resuspended in 50 μL transposition mix, which consisted of 25 μL 2× tagment DNA (TD) buffer, 2.5 μL transposase (Illumina Nextera DNA Library Prep Kit), with 16.5 μL PBS, 0.5 μL 1% digitonin, 0.5 μL 10% Tween-20, and 5 μL water. Transposition reactions were incubated at 37°C for 1 hour in a thermomixer with shaking at 800 rpm. Reactions were cleaned up with Zymo DNA Clean and Concentrator columns and eluted in 10 μL nuclease-free water.
Following purification, the transposed DNA fragments were amplified using 1× NEBnext PCR Master Mix (New England BioLabs) and 1.25 μM Ad1_noMX primer and indexing primer (34) in nuclease-free water for a 50 μL reaction, with the following PCR conditions: 72°C for 5 minutes; 98°C for 30 seconds, followed by thermocycling at 98°C for 10 seconds, 63°C for 30 seconds, and 72°C for 1 minute, for 5 cycles. To reduce guanine-cytosine (GC) content and size bias, quantitative PCR (qPCR) was performed to determine the appropriate amount of amplification before saturation. To do this, a 5 μL aliquot of the PCR reaction was added to 10 μL of the above PCR cocktail with the final concentration of 0.6× SYBR Green (Thermo Fisher Scientific). The qPCR cycle was run at 98°C for 30 seconds followed by 20 cycles at 98°C for 10 seconds, 63°C for 30 seconds, and 72°C for 1 minute to determine the additional number of cycles needed for the remaining 45 μL reaction. The libraries were purified using a QIAGEN MinElute PCR Purification Kit. All libraries met the target concentration of 20 μL at 4 nM, determined by Qubit Fluorometric Quantitation (Thermo Fisher Scientific). Sequencing was performed on the NextSeq 500 (Illumina) for a paired-end 75 bp run, and at least 50 million paired reads were obtained for each sample. The raw ATAC data were deposited in the GEO database (GEO GSE154483).
Omni-ATAC data processing.
The raw FASTQ files were processed using the published ENCODE ATAC-Seq Pipeline (https://github.com/kundajelab/atac_dnase_pipelines). The reads were trimmed and aligned to hg38 using bowtie2. Picard was used to de-duplicate reads, which were then filtered for high-quality paired reads using SAMtools. All peak calling was performed using MACS2. The optimal irreproducible discovery rate (IDR) thresholded peak output was used for all downstream analyses, with a threshold P value of 0.05. Other ENCODE3 parameters were enforced with the flag --encode3. Reads that mapped to mitochondrial genes or blacklisted regions, as defined by the ENCODE pipeline, were removed. The peak files were merged using bedtools merge to create a consensus set of peaks across all samples, and the number of reads in each peak was determined using bedtools multicov (35). DESeq2 with default parameters was used to normalize read counts (36) and to determine the hyperaccessible and hypoaccessible peaks following cytokine exposure. Peaks were called as hyper- or hypoaccessible using an absolute (log2 fold change) of greater than 0.5 and an adjusted P value of less than 0.05.
PCA and PLSR and projections.
log2-transformed FPKMs of coding genes were used to perform unsupervised PCA. This method uncovers latent components, which are the linear combinations of the features that most strongly vary across the data sets. PCA was performed centered and unscaled using the prcomp function in R. Projections onto PCA frameworks were done using a custom script by multiplication of the original projected sample scores by the PCA rotation matrix. PCA of ATAC-Seq data was performed centered and unscaled using normalized counts of the union of all significantly induced peaks. PLSR is a supervised version of PCA that seeks to find the latent vectors that maximize the covariance of the input variables (e.g., gene expression) and the response (e.g., phenotypes). Varimax rotation of the PLSR loadings (PLSRv) was performed on 2 components, without Kaiser normalization, using the R package varimax in order to simplify the structure of the loading matrix.
Mutation analysis.
The patient-derived human melanoma cell lines were sequenced and characterized for their mutational status as previously described (7, 37, 38).
GSEA and gene ontology.
GSEA (39) and GSEA-squared were done on preranked lists of genes using the MSigDB C5 gene sets and Kolmogorov-Smirnov (KS) statistics. GSEA-squared was performed as previously described (25). Briefly, all individual words in the gene sets were collected and their frequencies tabulated. Words with frequencies of less than 5 or greater than 500 were excluded, and all gene sets were then ranked by their normalized enrichment score (NES) value. Keywords and their categories were further assigned by manual curation of the top of the ranked list of words.
Rank-rank hypergeometric overlap.
Rank-rank hypergeometric overlap (RRHO) was performed for gene expression data by taking the rank of varimax-rotated PLSR loadings and calculating the hypergeometric P values of the TNF day 0 (d0) versus IFN-γ d0 ranked lists using the online tool and the R package RRHO. RRHO for gene sets was performed after running GSEA on the ranked gene lists and ranking gene sets by their NES. A step size of 100 was used for genes and gene sets (24).
Motif enrichment analysis.
Differential peak analysis was first conducted using DESeq2 on normalized ATAC-Seq counts. Starting from the full consensus peak set, samples were divided into baseline differentiated and baseline undifferentiated groups, and hypo- and hyperaccessible peaks were called separately for TNF versus d0 and IFN-γ versus d0, at an adjusted P value of less than 0.05 and a log2 fold change of greater than 2, without independent filtering or Cook’s cutoff. Motif analysis was performed on each of these peak sets using HOMER against a whole-genome background and searching for motifs within ± 200 bp of the peak center. Raw -ln(P values) were plotted for TNF-induced versus IFN-γ–induced hyperaccessible motifs. The overlap of significantly differential peaks was calculated and plotted as Venn diagrams using the R package Vennerable.
ARACNe and VIPER analysis.
ARACNe (40) network connections were created using all genes, and then the network nodes were restricted to transcription factors by combining all transcription factor gene sets in the gene ontology (GO) analysis. A single network was built using melanoma RNA-Seq samples from the M series cohort (19). VIPER analysis (41) was performed using the R msviper function from the package viper, with a minimum network size of 10.
TCGA survival analyses.
Patient samples from TCGA were divided into groups of low (lower quartile), median (interquartile range), and high (upper quartile) on the basis of expression of the IFN-γ–induced dedifferentiation signature. Patient clinical annotations were obtained from TCGA skin cutaneous melanoma publication (42), and overall survival was determined using the “curated TCGA days to death or last fu.”
Statistics.
Analysis of the IFN-γ–induced dedifferentiation signature in biopsies from patients in the CheckMate 038 trial was performed using the Wilcoxon test. The Kaplan-Meier method was applied for TCGA survival analysis using the R survival package, and plots were generated using the ggsurv R package. Statistical significance was determined with the log-rank test.
Study approval.
The CheckMate 038 (NCT01621490) clinical trial protocol and its amendments were approved by the relevant local IRBs of the institutions where patients were enrolled, and the study was conducted in accordance with the Declaration of Helsinki and the International Conference on Harmonization Guidelines for Good Clinical Practice guidelines. Human melanoma cell lines (M series) were established from patients’ biopsies under UCLA IRB approval (no. 11–003254). All patients signed written informed consent prior to undergoing any procedures.
Author contributions
AR conceived and supervised the project. YJK and AR designed the experiments and interpreted the results. YJK conducted the research and analyzed the data. KMS and YJK decided on the bioinformatic approaches and analyses. KMS performed the ATAC-Seq and RNA-Seq bioinformatic analyses. JT performed RNA-Seq processing and bioinformatic analyses. JT, GAR, EM, and CSG performed analysis of the clinical biopsy cohort. DYT, ASC, KL, CS, DES, POS, AH, TGG, and CPS contributed technical and scientific expertise for experimental design and analysis. YJK, KMS, and AR wrote the manuscript with input from the co-authors. All authors reviewed and approved the manuscript.
Supplementary Material
Acknowledgments
We would like to thank Stephen T. Smale at UCLA for sharing his expertise and providing guidance. We also thank Hong Zhang at the TCGB Core Facility at UCLA for her helpful discussions on ATAC-Seq. We also thank Alena Gros for sharing the 3998mel cell line. YJK was supported by the NIH Ruth L. Kirschstein Institutional National Research Service Award F30 CA243248 and the NIH National Institute of General Medical Sciences (NIGMS) training grant T32-GM008042. KMS was supported by the NIH NIGMS training grants T32-GM008042 and T32-GM008185. JT was supported by the NIH grant T32-CA009120. GAR was supported by an Isabel and Harvey Kibel Fellowship award and an Alan Ghitis Fellowship Award for Melanoma Research. DYT was supported by a Young Investigator Award from the American Society of Clinical Oncology (ASCO), a grant from the Spanish Society of Medical Oncology for Translational Research in Reference Centers, and the V Foundation-Gil Nickel Family Endowed Fellowship in Melanoma Research. AH was funded by NIH grant R01AI132835. CPS is a recipient of a Parker Senior Fellow Award from the Parker Institute for Cancer Immunotherapy. TGG and AR were funded by NIH grant P01 CA244118. AR was funded by the Parker Institute for Cancer Immunotherapy, NIH grants R35 CA197633 and P30 CA016042, the Ressler Family Fund, and the Ken and Donna Schultz Fund.
Version 1. 04/29/2021
In-Press Preview
Version 2. 06/15/2021
Electronic publication
Footnotes
Conflict of interest: KL reports receiving speaking fees from Roche Tissue Diagnostics. CS has received grant support from Pfizer, AstraZeneca, BMS, Roche-Ventana, Boehringer-Ingelheim, and Ono. CS has consulted for Pfizer, Novartis, GlaxoSmithKline, MSD Pharmaceuticals, Bristol Meyers Squibb (BMS), Celgene, AstraZeneca, Illumina, Genentech, Roche-Ventana, GRAIL, Medicxi, and the Sarah Cannon Research Institute. CS is a shareholder of Apogen Biotechnologies, Epic Bioscience, and GRAIL, and has stock options in and is co-founder of Achilles Therapeutics. TGG has received an honorarium from Amgen and has consulting and equity agreements with Trethera Corporation. The laboratory of TGG has completed a research agreement with ImmunoActiva. AR has received consulting fees from Amgen, Bristol-Myers Squibb, Chugai, Genentech, Merck, Novartis, Roche, and Sanofi; has been a member of the scientific advisory boards of and holds stock in Advaxis, CytomX, Five Prime Therapeutics, Highlight Therapeutics, Kite-Gilead, and RAPT Therapeutics; is a current member of the scientific advisory boards of and holds stock in Apricity, Arcus Biosciences, Compugen, ImaginAb, IsoPlexis, Lutris Pharma, Merus, PACT Pharma, Rgenix, Synthekine and Tango Therapeutics; and has received research funding from Agilent and Bristol-Myers Squibb through Stand Up to Cancer (SU2C).
Copyright: © 2021, American Society for Clinical Investigation.
Reference information: J Clin Invest. 2021;131(12):e145859.https://doi.org/10.1172/JCI145859.
Contributor Information
Yeon Joo Kim, Email: YeonJooKim@mednet.ucla.edu.
Katherine M. Sheu, Email: katherinesheu@ucla.edu.
Jennifer Tsoi, Email: jenn.tsoi@gmail.com.
Gabriel Abril-Rodriguez, Email: GAbrilRodriguez@mednet.ucla.edu.
Egmidio Medina, Email: EgmidioMedina@mednet.ucla.edu.
Catherine S. Grasso, Email: catherine.grasso@cshs.org.
Davis Y. Torrejon, Email: DTorrejon@mednet.ucla.edu.
Ameya S. Champhekar, Email: AChamphekar@mednet.ucla.edu.
Kevin Litchfield, Email: Kevin.Litchfield@crick.ac.uk.
Charles Swanton, Email: Charles.Swanton@crick.ac.uk.
Daniel E. Speiser, Email: Daniel.speiser@unil.ch.
Philip O. Scumpia, Email: PScumpia@mednet.ucla.edu.
Alexander Hoffmann, Email: ahoffmann@g.ucla.edu.
Thomas G. Graeber, Email: tgraeber@mednet.ucla.edu.
Cristina Puig-Saus, Email: CPuigSaus@mednet.ucla.edu.
Antoni Ribas, Email: aribas@mednet.ucla.edu.
References
- 1.Yoshida H, et al. Distinct stages of melanocyte differentiation revealed by anlaysis of nonuniform pigmentation patterns. Development. 1996;122(4):1207–1214. doi: 10.1242/dev.122.4.1207. [DOI] [PubMed] [Google Scholar]
- 2.Restivo G, et al. low neurotrophin receptor CD271 regulates phenotype switching in melanoma. Nat Commun. 2017;8(1):1988. doi: 10.1038/s41467-017-01573-6. [DOI] [PMC free article] [PubMed] [Google Scholar]
- 3.Hoek KS, et al. In vivo switching of human melanoma cells between proliferative and invasive states. Cancer Res. 2008;68(3):650–656. doi: 10.1158/0008-5472.CAN-07-2491. [DOI] [PubMed] [Google Scholar]
- 4.Hoek KS, et al. Novel MITF targets identified using a two-step DNA microarray strategy. Pigment Cell Melanoma Res. 2008;21(6):665–676. doi: 10.1111/j.1755-148X.2008.00505.x. [DOI] [PubMed] [Google Scholar]
- 5.Tirosh I, et al. Dissecting the multicellular ecosystem of metastatic melanoma by single-cell RNA-seq. Science. 2016;352(6282):189–196. doi: 10.1126/science.aad0501. [DOI] [PMC free article] [PubMed] [Google Scholar]
- 6.Tsoi J, et al. Multi-stage differentiation defines melanoma subtypes with differential vulnerability to drug-induced iron-dependent oxidative stress. Cancer Cell. 2018;33(5):S1535–904. doi: 10.1016/j.ccell.2018.03.017. [DOI] [PMC free article] [PubMed] [Google Scholar]
- 7.Nazarian R, et al. Melanomas acquire resistance to B-RAF(V600E) inhibition by RTK or N-RAS upregulation. Nature. 2010;468(7326):973–977. doi: 10.1038/nature09626. [DOI] [PMC free article] [PubMed] [Google Scholar]
- 8.Muller J, et al. Low MITF/AXL ratio predicts early resistance to multiple targeted drugs in melanoma. Nat Commun. 2014;5:5712. doi: 10.1038/ncomms6712. [DOI] [PMC free article] [PubMed] [Google Scholar]
- 9.Tachibana M, et al. Ectopic expression of MITF, a gene for Waardenburg syndrome type 2, converts fibroblasts to cells with melanocyte characteristics. Nat Genet. 1996;14(1):50–54. doi: 10.1038/ng0996-50. [DOI] [PubMed] [Google Scholar]
- 10.Opdecamp K, et al. Melanocyte development in vivo and in neural crest cell cultures: crucial dependence on the Mitf basic-helix-loop-helix-zipper transcription factor. Development. 1997;124(12):2377–2386. doi: 10.1242/dev.124.12.2377. [DOI] [PubMed] [Google Scholar]
- 11.Konieczkowski DJ, et al. A melanoma cell state distinction influences sensitivity to MAPK pathway inhibitors. Cancer Discov. 2014;4(7):816–827. doi: 10.1158/2159-8290.CD-13-0424. [DOI] [PMC free article] [PubMed] [Google Scholar]
- 12.Rambow F, et al. Toward minimal residual disease-directed therapy in melanoma. Cell. 2018;174(4):843–855. doi: 10.1016/j.cell.2018.06.025. [DOI] [PubMed] [Google Scholar]
- 13.Landsberg J, et al. Melanomas resist T-cell therapy through inflammation-induced reversible dedifferentiation. Nature. 2012;490(7420):412–416. doi: 10.1038/nature11538. [DOI] [PubMed] [Google Scholar]
- 14.Mehta A, et al. Immunotherapy resistance by inflammation-induced dedifferentiation. Cancer Discov. 2018;8(8):935–943. doi: 10.1158/2159-8290.CD-17-1178. [DOI] [PMC free article] [PubMed] [Google Scholar]
- 15.Holzel M, Tuting T. Inflammation-induced plasticity in melanoma therapy and metastasis. Trends Immunol. 2016;37(6):364–374. doi: 10.1016/j.it.2016.03.009. [DOI] [PubMed] [Google Scholar]
- 16.Falletta P, et al. Translation reprogramming is an evolutionarily conserved driver of phenotypic plasticity and therapeutic resistance in melanoma. Genes Dev. 2017;31(1):18–33. doi: 10.1101/gad.290940.116. [DOI] [PMC free article] [PubMed] [Google Scholar]
- 17.Massi D, et al. Dedifferentiated melanomas: morpho-phenotypic profile, genetic reprogramming and clinical implications. Cancer Treat Rev. 2020;88:102060. doi: 10.1016/j.ctrv.2020.102060. [DOI] [PubMed] [Google Scholar]
- 18.Riaz N, et al. Tumor and microenvironment evolution during immunotherapy with nivolumab. Cell. 2017;171(4):934–949. doi: 10.1016/j.cell.2017.09.028. [DOI] [PMC free article] [PubMed] [Google Scholar]
- 19.Grasso CS, et al. Conserved interferon-γ signaling drives clinical response to immune checkpoint blockade therapy in melanoma. Cancer Cell. 2020;38(4):500–515. doi: 10.1016/j.ccell.2020.08.005. [DOI] [PMC free article] [PubMed] [Google Scholar]
- 20.Ayers M, et al. IFN-γ-related mRNA profile predicts clinical response to PD-1 blockade. J Clin Invest. 2017;127(8):2930–2940. doi: 10.1172/JCI91190. [DOI] [PMC free article] [PubMed] [Google Scholar]
- 21.Cristescu R, et al. Pan-tumor genomic biomarkers for PD-1 checkpoint blockade-based immunotherapy. Science. 2018;362(6411):eaar3593. doi: 10.1126/science.aar3593. [DOI] [PMC free article] [PubMed] [Google Scholar]
- 22.Zaretsky JM, et al. Mutations associated with acquired resistance to PD-1 blockade in melanoma. N Engl J Med. 2016;375(9):819–829. doi: 10.1056/NEJMoa1604958. [DOI] [PMC free article] [PubMed] [Google Scholar]
- 23.Shin DS, et al. Primary resistance to PD-1 blockade mediated by JAK1/2 Mutations. Cancer Discov. 2017;7(2):188–201. doi: 10.1158/2159-8290.CD-16-1223. [DOI] [PMC free article] [PubMed] [Google Scholar]
- 24.Plaisier SB, et al. Rank-rank hypergeometric overlap: identification of statistically significant overlap between gene-expression signatures. Nucleic Acids Res. 2010;38(17):e169. doi: 10.1093/nar/gkq636. [DOI] [PMC free article] [PubMed] [Google Scholar]
- 25.Balanis NG, et al. Pan-cancer convergence to a small-cell neuroendocrine phenotype that shares susceptibilities with hematological malignancies. Cancer Cell. 2019;36(1):17–34. doi: 10.1016/j.ccell.2019.06.005. [DOI] [PMC free article] [PubMed] [Google Scholar]
- 26.Bellei B, et al. Wnt/β-catenin signaling is stimulated by α-melanocyte-stimulating hormone in melanoma and melanocyte cells: implication in cell differentiation. Pigment Cell Melanoma Res. 2011;24(2):309–325. doi: 10.1111/j.1755-148X.2010.00800.x. [DOI] [PubMed] [Google Scholar]
- 27.Riesenberg S, et al. MITF and c-Jun antagonism interconnects melanoma dedifferentiation with pro-inflammatory cytokine responsiveness and myeloid cell recruitment. Nat Commun. 2015;6:8755. doi: 10.1038/ncomms9755. [DOI] [PMC free article] [PubMed] [Google Scholar]
- 28.Ribas A, Wolchok JD. Cancer immunotherapy using checkpoint blockade. Science. 2018;359(6382):1350–1355. doi: 10.1126/science.aar4060. [DOI] [PMC free article] [PubMed] [Google Scholar]
- 29.Tumeh PC, et al. PD-1 blockade induces responses by inhibiting adaptive immune resistance. Nature. 2014;515(7528):568–571. doi: 10.1038/nature13954. [DOI] [PMC free article] [PubMed] [Google Scholar]
- 30.Yang L, et al. Interferon-gamma inhibits melanogenesis and induces apoptosis in melanocytes: a pivotal role of CD8+ cytotoxic T lymphocytes in vitiligo. Acta Derm Venereol. 2015;95(6):664–670. doi: 10.2340/00015555-2080. [DOI] [PubMed] [Google Scholar]
- 31.Kim D, et al. Graph-based genome alignment and genotyping with HISAT2 and HISAT-genotype. Nat Biotechnol. 2019;37(8):907–915. doi: 10.1038/s41587-019-0201-4. [DOI] [PMC free article] [PubMed] [Google Scholar]
- 32.Anders S, et al. HTSeq — a Python framework to work with high-throughput sequencing data. Bioinformatics. 2015;31(2):166–169. doi: 10.1093/bioinformatics/btu638. [DOI] [PMC free article] [PubMed] [Google Scholar]
- 33.Gros A, et al. Prospective identification of neoantigen-specific lymphocytes in the peripheral blood of melanoma patients. Nat Med. 2016;22(4):433–438. doi: 10.1038/nm.4051. [DOI] [PMC free article] [PubMed] [Google Scholar]
- 34.Buenrostro JD, et al. Transposition of native chromatin for fast and sensitive epigenomic profiling of open chromatin, DNA-binding proteins and nucleosome position. Nat Methods. 2013;10(12):1213–1218. doi: 10.1038/nmeth.2688. [DOI] [PMC free article] [PubMed] [Google Scholar]
- 35.Quinlan AR, Hall IM. BEDTools: a flexible suite of utilities for comparing genomic features. Bioinformatics. 2010;26(6):841–842. doi: 10.1093/bioinformatics/btq033. [DOI] [PMC free article] [PubMed] [Google Scholar]
- 36.Love MI, et al. Moderated estimation of fold change and dispersion for RNA-seq data with DESeq2. Genome Biol. 2014;15(12):550. doi: 10.1186/s13059-014-0550-8. [DOI] [PMC free article] [PubMed] [Google Scholar]
- 37.Atefi M, et al. Effects of MAPK and PI3K pathways on PD-L1 expression in melanoma. Clin Cancer Res. 2014;20(13):3446–3457. doi: 10.1158/1078-0432.CCR-13-2797. [DOI] [PMC free article] [PubMed] [Google Scholar]
- 38.Wong DJ, et al. Erratum to: Antitumor activity of the ERK inhibitor SCH722984 against BRAF mutant, NRAS mutant and wild-type melanoma. Mol Cancer. 2014;13:194. doi: 10.1186/1476-4598-13-194. [DOI] [PMC free article] [PubMed] [Google Scholar]
- 39.Subramanian A, et al. Gene set enrichment analysis: a knowledge-based approach for interpreting genome-wide expression profiles. Proc Natl Acad Sci U S A. 2005;102(43):15545–15550. doi: 10.1073/pnas.0506580102. [DOI] [PMC free article] [PubMed] [Google Scholar]
- 40.Lachmann A, et al. ARACNe-AP: gene network reverse engineering through adaptive partitioning inference of mutual information. Bioinformatics. 2016;32(14):2233–2235. doi: 10.1093/bioinformatics/btw216. [DOI] [PMC free article] [PubMed] [Google Scholar]
- 41.Alvarez MJ, et al. Functional characterization of somatic mutations in cancer using network-based inference of protein activity. Nat Genet. 2016;48(8):838–847. doi: 10.1038/ng.3593. [DOI] [PMC free article] [PubMed] [Google Scholar]
- 42.Cancer Genome Atlas Network Genomic classification of cutaneous melanoma. Cell. 2015;161(7):1681–1696. doi: 10.1016/j.cell.2015.05.044. [DOI] [PMC free article] [PubMed] [Google Scholar]
Associated Data
This section collects any data citations, data availability statements, or supplementary materials included in this article.


