Abstract
Purpose:
We aimed to investigate the performance of high resolution-diffusion-weighted imaging (HR-DWI) using readout-segmented echo-planar imaging in visualizing malignant breast lesions and evaluating their extent, using pathology as a reference.
Methods:
This retrospective study included patients who underwent HR-DWI with surgically confirmed malignant breast lesions. Two radiologists blinded to the final diagnosis evaluated HR-DWI independently and identified the lesions, measuring their maximum diameters. Another radiologist confirmed if those lesions were identical to the pathology. The maximum diameters of the lesions between HR-DWI and pathology were compared, and their correlations were calculated using Spearman’s correlation coefficient. Apparent diffusion coefficient (ADC) values of the lesions were measured.
Results:
Ninety-five mass/64 non-mass lesions were pathologically confirmed in 104 females. Both radiologists detected the same 93 mass lesions (97.9%). Spearman’s correlation coefficient for mass lesions were 0.89 and 0.90 (P < 0.0001 and 0001) for the two radiologists, respectively. The size differences within 10 mm were 90.3% (84/93) and 94.6% (88/93) respectively. One radiologist detected 35 non-mass lesions (54.7%) and another radiologist detected 32 non-mass lesions (50.0%), of which 28 lesions were confirmed as identical. Spearman’s correlation coefficient for non-mass lesions were 0.59 and 0.22 (P = 0.0002 and 0.22), respectively. The mean ADC value of mass lesions and non-mass lesions were 0.80 and 0.89 × 10⁻³ mm2/s, respectively.
Conclusion:
Using HR-DWI, malignant mass lesions were depicted with excellent agreement with the pathological evaluation. Approximately half of the non-mass lesions could not be identified, suggesting a current limitation of HR-DWI.
Keywords: breast neoplasms, diffusion weighted magnetic resonance imaging, high resolution, non-mass lesions
Introduction
Dynamic contrast-enhanced magnetic resonance imaging (DCE-MRI) is a useful imaging tool for pre-treatment evaluation of known breast cancer or suspicious breast lesions with inconclusive results from other imaging modalities, with excellent correlation with pathology.1–3 DCE-MRI, with spatial resolution of <1 mm improves detectability and diagnostic confidence.4 However, its specificity is usually highly variable, which can be a problem.5,6 In addition, the use of DCE-MRI in the evaluation of breast cancer patients during neoadjuvant chemotherapy or in the screening of high-risk women involves repeated use of gadolinium contrast agents. Use of gadolinium contrast agent in cases with renal impairment carries the potential risk of nephrogenic systemic fibrosis.7 Furthermore, some gadolinium agents have been claimed to deposit in the brain.8 Although no evidence showed harm induced by its deposit, its long-term effects remain controversial.9–12
Diffusion-weighted imaging (DWI) is a non-contrast MRI sequence based on random Brownian motion of water molecules.13 Malignant tumors demonstrate higher restriction in diffusion of water molecules, which leads to high signal intensities on DWI and low apparent diffusion coefficient (ADC) values.14 Signal intensity and lesion detection on DWI are not affected by menopausal status or background parenchymal enhancement.15–18 DWI is commonly added to routine breast MRI sequences to increase specificity, although it is not included in BI-RADS (American College of Radiology [ACR], Reston, VA, USA) lexicon for MRI in its 2013 version.5,19 There are also attempts to apply DWI for breast screening.20,21
Single-shot echo-planar imaging (ss-EPI) is the most commonly used technique in DWI. However, with conventional ss-EPI, the need to acquire many lines of k-space data in each shot implies a long time to traverse k-space in the phase encoding (Ky) direction, which in turn leads to significant image distortions and piling-up artifacts at areas of relatively modest magnetic field variations, such as near the nipple, axilla, costophrenic sulci of the lungs, and near biopsy marker clips. In order to minimize the distortion on DWI, readout-segmented EPI (rs-EPI) has been developed. rs-EPI is a multi-shot sequence to reduce echo spacing and the time taken to traverse k-space in the phase-encoding direction, by sampling a subset of k-space points in the readout direction per shot. Another benefit of rs-EPI is the reduction of the T2* decay artifact (blurring) by shortening the time for readout. Navigator echoes for phase correction and motion corrections are also incorporated.22
Although acquisition time for rs-EPI is longer than that of ss-EPI, the advantage of rs-EPI over ss-EPI includes high diagnostic accuracy for mass lesions in the breast.23–25 Thanks to recent technical developments, evaluating breast lesions with high resolution-DWI (HR-DWI) using rs-EPI with nearly 1 mm spatial resolution is now feasible.26 A preliminary study using HR-DWI for breast lesions demonstrated detailed morphological features of 18 mass lesions, while underestimating the size of nine non-mass lesions.27 We hypothesized that HR-DWI may have potential to allow more accurate evaluation of breast lesions. We aimed to examine the performance of HR-DWI using rs-EPI in visualizing malignant breast lesions and their extent, using pathological information as a reference.
Materials and Methods
Study population
Our Institutional Review Board approved this retrospective study. The need for written informed consent was waived because this is a retrospective study using our clinical MR protocol including HR-DWI for pre-treatment evaluation of known breast cancer or suspicious breast lesions with inconclusive result from other imaging modalities. One hundred and four consecutive patients who underwent breast MRI for known or suspicious breast lesions between July 2015 and March 2018 were identified using radiology report database of our institution. Among them, those who subsequently underwent surgical treatment and were pathologically confirmed as having malignant lesions were included in this study. Patients who received neoadjuvant chemotherapy or hormonal therapy prior to surgery were excluded from the study.
MRI protocols
A 3T MRI system (MAGNETOM Prisma: Siemens Healthcare, Erlangen, Germany) with a dedicated 18-channel breast coil was used for image acquisition. Our routine protocol for patients with known or suspicious breast lesions included T2-weighted images (T2WI), T1-weighted images (T1WI), conventional DWI using ss-EPI (b = 0 and 1000 s/mm2), HR-DWI using rs-EPI (abbreviated as HR-DWI hereafter) (b = 0 and 850 s/mm2), dynamic contrast-enhanced T1WI, and high-resolution contrast-enhanced T1WI. We used readout segmentation of long variable echo-trains sequence for rs-EPI. A unilateral HR-DWI scan for known or suspected breast malignancy was performed in sagittal orientation. For HR-DWI, the scan protocol was designed to be nearly isovoxel, with voxel size as small as possible while maintaining a sufficient signal-to-noise ratio (SNR). Number of readout segments is five and signal averages is one for b = 0 s/mm2 and two for b = 850 s/mm2. Navigator echo was used to correct phase mismatch in each echo. The diffusion-encoding directions were three scan trace. The detailed sequences were shown in Table 1. For dynamic contrast-enhanced T1WI, three post-contrast acquisitions (at 0–1, 1–2, 5–6 min after gadolinium injection) were obtained. High-resolution contrast-enhanced T1WI was obtained 2–5 min after the intravenous administration of contrast agent. Sagittal reconstruction images were automatically created. ADC maps of the HR-DWI were constructed following the logarithmic equation:
| (1) |
where b1 and b2 are b-values and S1 and S2 are the signal intensities at the b1 and b2 values, respectively. ADC maps were automatically created from DWI at b = 0 and 850 s/mm2.
Table 1.
The detailed MR imaging protocols
| Sequence | T2WI | T1WI | DWI | HR-DWI | DCE-T1WI | HR-CE-T1WI |
|---|---|---|---|---|---|---|
| 2D turbo spin echo | 3D-VIBE | ss-EPI | rs-EPI | 3D-VIBE with fat suppression | 3D-VIBE with fat suppression | |
| Laterality | Bilateral | Bilateral | Bilateral | Unilateral | Bilateral | Bilateral |
| Orientation | Axial | Axial | Axial | Sagittal | Axial | Coronal |
| TR/TE (ms) | 5500–5660/70–79 | 5.0–5.5/2.46 | 6300/49–50 | 8300/48 | 3.8–4.0/1.4 | 4.6/1.80 |
| FOV (mm2) | 330 × 330 | 330 × 330 | 330 × 185 | 180 × 145 | 330 × 330 | 330 × 330 |
| Matrix | 448 × 448 | 384 × 384 (480 × 480) | 162 × 92 | 166 × 134 | 384 × 384 | 512 × 512 |
| Slice thickness (mm) | 3 | 1.5–2.5 | 3 | 1.5 | 1 | 0.8 |
| Slice number | 48 | 96 | 48 | 45 | 144 | 176 |
| b value (sec/mm2) | 0, 1000 | 0, 850 | ||||
| Total acquisition time (min:sec) | 1:30 | 1:00 | 1:06 | 5:15 | 1:00 | 2:26 |
| Parallel imaging acceleration factors | 3 | 3 | 2 | 2 | 3 | 3 |
3D-VIBE, 3D volumetric interpolated breath-hold examination; DCE-T1WI, dynamic contrast-enhanced T1WI; DWI, diffusion-weighted image; HR-CE-T1WI, high-resolution contrast-enhanced T1WI; HR-DWI, high resolution-DWI; rs-EPI, readout-segmented echo-planar imaging; ss-EPI, single-shot echo-planar imaging; T1WI, T1-weighted image; T2WI, T2-weighted image.
Image interpretation and analysis
Images were interpreted using a workstation (Aquarius Net Viewer; TeraRecon, Foster City, CA, USA). Two board-certified radiologists specialized in breast imaging (reader A with nine years and reader B with 20 years of experience, respectively) independently read HR-DWI and ADC maps. The image quality of rs-EPI was compared with that of ss-EPI in terms of distortion artifacts and were scored separately in 5-point scale; 0 = severe artifacts which may interfere with diagnostic information, 1 = intense artifact, 2 = moderate artifact, 3 = faint artifact, 4 = no artifact. In order to evaluate the diagnostic performance, reader A and B independently identified breast lesions equivalent to category 4 or 5 according to BI-RADS MRI lexicon. They had been informed that all the images were acquired from patients with malignant lesions, but were blinded to the final diagnosis including the number and location of lesions, and the detailed pathological information. Lesions with high signal intensity on HR-DWI and low ADC value were classified into mass lesions or non-mass lesions by two readers. In case of mixed lesions containing mass portions and non-mass potions, each reader evaluated mass portions as “mass lesions” and non-mass portions as “non-mass lesions” separately. Image analysis was performed on each lesion. Lesion conspicuity was scored with a 5-point scale based on signal contrast between lesions and breast tissue: 0 = not visible, 1 = poor, 2 = average, 3 = good, 4 = excellent (Fig. 1). To verify the location if the lesions pointed out by the two readers were identical, the location of each lesion was recorded by each reader. The maximum diameters in the image containing the largest area of each lesion were measured on HR-DWI in sagittal orientation in order to evaluate disease extent recognized on HR-DWI.
Fig. 1.
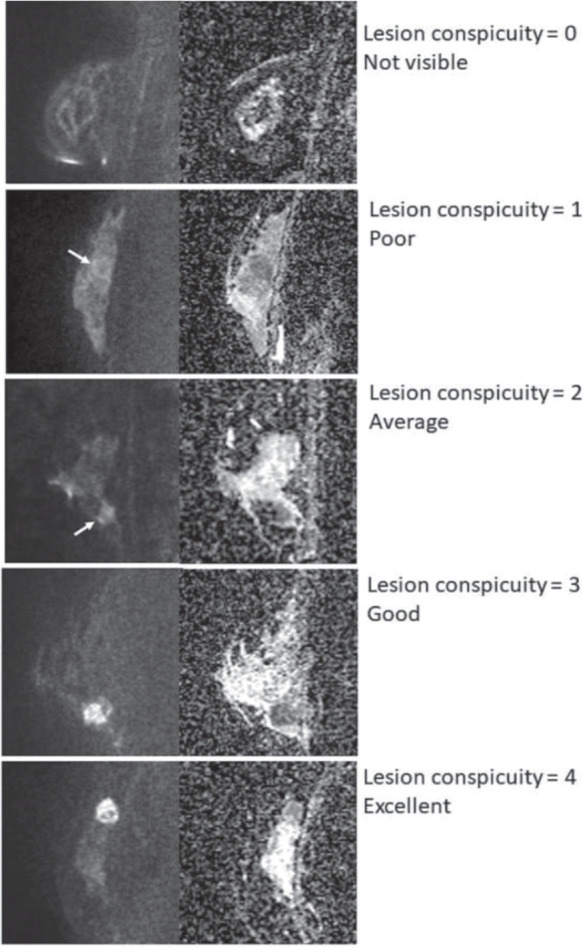
Lesion conspicuity score. Lesion conspicuity was scored with a 5-point scale based on signal contrast between lesions and breast tissue. All images represent malignant lesions (arrows).
Another breast radiologist, reader C, with 11 years of experience, who knew the final pathological results and had access to all the sequences confirmed whether the two readers had evaluated the same lesions or not and whether those lesions identified by the two readers agreed with the surgical specimen or not.
As an additional analysis, on ADC maps, regions of interest (ROIs) were placed by reader C in the part of the lesions where the diffusion appeared maximally restricted. The mean ADC values were measured by placing a maximum of three ROIs of 3 mm diameter on each lesion, and the lowest value was selected for the analysis. Care was taken not to place ROIs on areas of necrosis, or background fat tissue, by referring to all the sequences.
Pathological evaluation
The corresponding pathology for lesions detected on HR-DWI was confirmed with gross specimen. In order to compare with the lesions detected on HR-DWI by the two readers, the lesions were classified as mass lesions or non-mass lesions by reader C based on the digital images of gross specimen attached to the pathological report and consensus opinion with pathologists when it was difficult to determine, checking the individual slide if needed. Non-mass lesions detected on gross specimen were not necessarily intraductal component, and there were some ductal carcinomas in situ (DCIS) which formed mass lesions.
The small lesions which were not detected as mass lesion were included in non-mass lesions. The maximum diameter of the lesion was also measured based on the digital images of the gross specimen.
Statistical analysis
The image quality scores of ss-EPI and rs-EPI was compared using Wilcoxon signed-rank test. For pathologically confirmed malignant lesions, detectability, lesion conspicuity, recognized lesion size/extent, and ADC values on HR-DWI were evaluated.
The inter-reader variability between two readers for lesion diameter measured in HR-DWI was evaluated by calculating intraclass correlation coefficients (ICC). The level of ICC was defined as follows: very strong, r = 1.0–0.9; strong, r = 0.9–0.7; moderate, r = 0.7–0.5; and weak, r < 0.5.28 The correlation between lesion diameters on pathology and on HR-DWI was evaluated using Spearman’s correlation coefficient, due to non-normal distribution of lesion size. Lesions which both readers identified as suspicious were included in the analysis. The level of Spearman’s correlation coefficient was defined as follows: very strong, r = 1.0–0.8; moderately strong, r = 0.8–0.6; fair, r = 0.6–0.3; and poor, r < 0.3.29 Bland–Altman assessment was used to compare the agreement between lesion measurements on HR-DWI by two readers and pathological diameters, regarding mass lesions and non-mass lesions. All tests were two-sided with a significance level of P < 0.05. Statistical analysis was performed with JMP Pro 14 (SAS Institute, Cary, NC, USA) and STATA ver. 13.1 (Stata, College Station, TX, USA).
Results
Study population
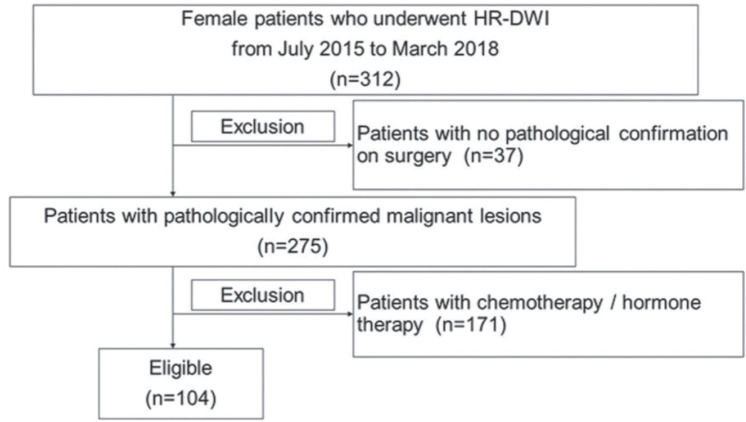
Out of 312 patients undergoing HR-DWI, 104 consecutive patients (all females, mean age 61.1 years; range 32–85 years) were finally included in the analysis. The detailed selection process is described in Fig. 2. Among the 104 patients, 94 patients had undergone DCE-MRI and 10 patients had undergone non-contrast MRI. Out of 10 patients who had non-contrast MRI, six patients had history of asthma, two patients had renal dysfunction, and two patients had allergic disease of unknown cause. Although these patients had no experience of using gadolinium-based agents, its use was not thought to be clinically indicated.
Fig. 2.
Study flowchart showing the patient selection process. HR-DWI, high resolution-diffusion-weighted imaging.
Ninety-five malignant mass lesions and 64 malignant non-mass lesions in 104 breasts were pathologically confirmed. The mean size and standard deviation (SD) of the mass lesions was 21.7 ± 15.0 mm (range: 5–100 mm), and the mean size and SD of the non-mass lesions was 29.4 ± 24.7 mm (range: 1–105 mm).
Image quality
The mean and SD of the scores for distortion artifacts on rs-EPI and ss-EPI were 3.4 ± 0.8 and 2.7 ± 0.9 (P < 0.001) for reader A and 3.3 ± 0.7 and 2.7 ± 0.7 (P < 0.001) for reader B, which were significantly lower (more severe distortion) on ss-EPI, compared with rs-EPI in two readers.
Mass lesions
Among the 95 mass lesions, there were 75 invasive carcinomas of no special type (NST), five mucinous carcinomas, two invasive lobular carcinomas (ILC), two carcinomas with apocrine differentiation, five other invasive carcinomas of special type, five DCIS, and one intraductal papillary carcinoma. Detailed lesion characteristics are summarized in Table 2.
Table 2.
Pathology of the lesions
| Mass (n = 95), n (%) | Non-mass (n = 64), n (%) | |
|---|---|---|
| Invasive carcinoma (NST) | 75 (78.9) | 22 (34.4) |
| Mucinous carcinoma | 5 (5.3) | 0 (0) |
| Invasive lobular carcinoma | 2 (2.1) | 5 (7.8) |
| Carcinoma with apocrine differentiation | 2 (2.1) | 0 (0) |
| Invasive papillary carcinoma | 1 (1.1) | 0 (0) |
| Invasive micropapillary carcinoma | 1 (1.1) | 0 (0) |
| Solid papillary carcinoma | 1 (1.1) | 0 (0) |
| Adenoid cystic carcinoma | 1 (1.1) | 0 (0) |
| Metaplastic carcinoma | 1 (1.1) | 0 (0) |
| Tubular carcinoma | 0 (0) | 2 (3.2) |
| Ductal carcinoma in situ | 5 (5.3) | 34 (53.1) |
| High nuclear grade | 4 (4.2) | 14 (21.9) |
| Intermediate nuclear grade | 1 (1.1) | 16 (25.0) |
| Low nuclear grade | 0 (0) | 4 (6.3) |
| Intraductal papillary carcinoma | 1 (1.1) | 0 (0) |
| Intra-mammary lymph node metastasis | 0 (0) | 1 (1.6) |
NST, no special type.
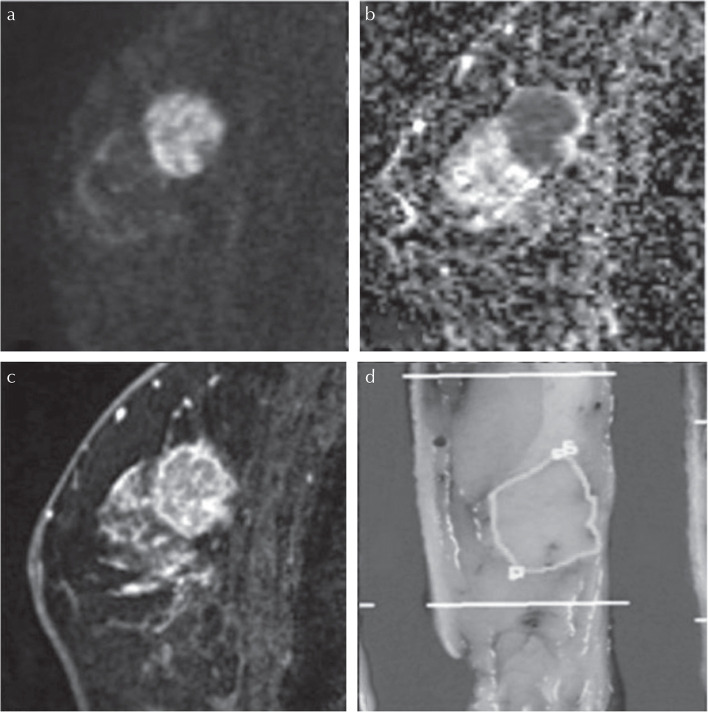
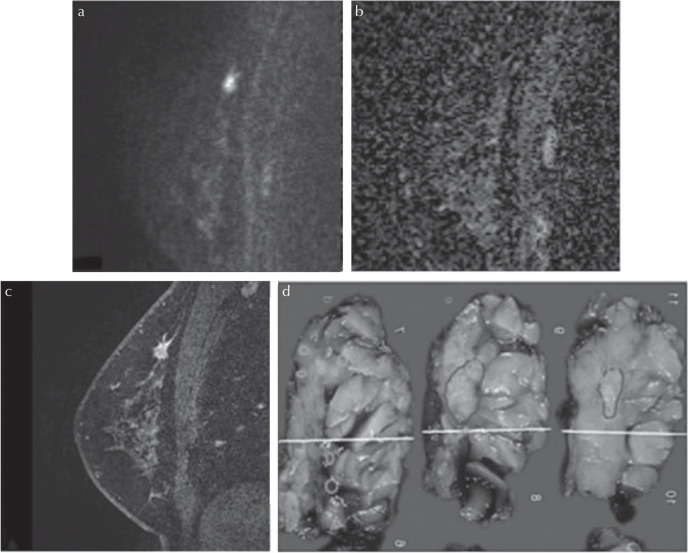
Both readers detected the same 93 out of 95 pathologically confirmed mass lesions on HR-DWI. Reader A and B classified 85 (91%) and 87 (94%) lesions as masses on HR-DWI, respectively. An example of a typical case of mass lesion is shown in Fig. 3. The two lesions, which both readers failed to detect, were located near the axilla (one lesion) or not detected due to poor fat suppression (one lesion). Mean conspicuity of mass lesions was scored as 3.5 ± 0.9 and 3.5 ± 0.8 for reader A and B, respectively.
Fig. 3.
Malignant mass lesion in a 68-year-old patient. (a) A lesion with high signal intensity on HR-DWI (b = 850 s/mm2) was detected. Both readers classified it as a mass lesion and measured it as 19 mm. (b) The lesion showed low ADC value. The mean ADC value of lesion was 0.669 × 10⁻³ mm2/s. (c) High-resolution contrast-enhanced T1WI showed a mass lesion with rim enhancement. (d) The diagnosis was invasive carcinoma (NST) with DCIS of intermediate nuclear grade. The pathological maximum diameter of the lesion was 22 mm. The lesion outlined in blue corresponds to invasive carcinoma (NST) and those outlined in yellow correspond to DCIS of intermediate nuclear grade. ADC, diffusion coefficient; DCIS, ductal carcinomas in situ; HR-DWI, high resolution-diffusion-weighted imaging; NST, no special type.
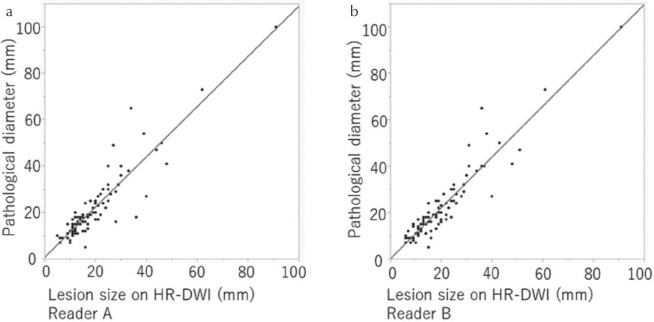
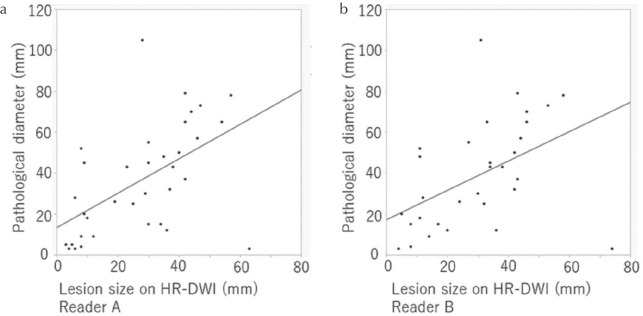
The ICC between lesion diameters measured by the two readers was 0.98 (n = 93), indicating very strong correlation. A scatterplot shows linear correlation between pathological diameters and the lesions diameters measured by the two readers on HR-DWI (Fig. 4). Spearman’s correlation coefficients were 0.89 (P < 0.0001) and 0.90 (P < 0.0001), respectively. Differences in size measured on HR-DWI and the pathology are shown in Table 3. Both readers tended to underestimate the size of mass lesions. Size differences of ≤10 mm were 90.3% (84/93) and 94.6% (88/93) for reader A and B, respectively, and size differences of ≤5 mm were 74.2% (69/93) and 77.4% (72/93) for reader A and B, respectively.
Fig. 4.
The scatterplot showing the correlation between pathological diameters of mass lesions and diameters measured on HR-DWI for reader A (a) and B (b). Lesions that each reader did not recognize as suspicious were excluded and finally the same 93 lesions detected by both readers were included. HR-DWI, high resolution-diffusion-weighted imaging.
Table 3.
Differences in lesion diameters between pathology and HR-DWI among mass lesions by two readers
| Difference in lesion diameters* | Reader A (n = 93), n (%) | Reader B (n = 93), n (%) |
|---|---|---|
| ≤−10 mm | 7 (7.5) | 4 (4.3) |
| <−10 mm, ≤−5 mm | 17 (18.3) | 17 (18.3) |
| <−5 mm, ≤0 mm | 49 (52.7) | 49 (52.7) |
| <0 mm, ≤5 mm | 15 (16.1) | 18 (19.4) |
| <5 mm, ≤10 mm | 1 (1.1) | 4 (4.3) |
| >10 mm | 4 (4.3) | 1 (1.1) |
Data are numbers of lesions, with percentage in parentheses unless indicated otherwise.
Differences in lesion diameters are calculated as “lesion diameter on HR-DWI” minus “lesion diameter on pathology”. HR-DWI, high resolution-diffusion-weighted imaging.
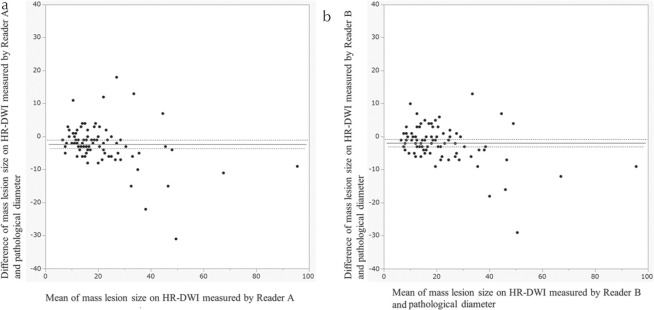
Bland–Altman plots for measured parameters are provided in Fig. 5, showing the agreement between lesion measurements on HR-DWI by two readers and pathological diameters. Size difference between HR-DWI and pathology was within 10 mm for mass lesions up to 40 mm in size. For lesions over 40 mm, HR-DWI tended to underestimate lesion size.
Fig. 5.
Bland–Altman plots of agreement between lesion diameters measured on HR-DWI by reader A (a) and reader B (b) and pathological diameter, regarding mass lesions. The horizontal straight line and the two dotted lines above/below it indicates the mean difference plus/minus 1.96 times the standard deviation of the differences respectively. HR-DWI, high resolution-diffusion-weighted imaging.
The mean and SD of ADC value in malignant mass lesions was 0.80 ± 0.24 × 10⁻³ mm2/s, which was calculated from the 93 out of 95 lesions where ROIs were able to be placed.
Non-mass lesions
Among 64 non-mass lesions, there were 22 invasive carcinomas (NST), five ILC, two tubular carcinomas, 34 DCIS and one intra-mammary lymph node metastasis from ipsilateral breast cancer. Detailed lesion characteristics are summarized in Table 2.
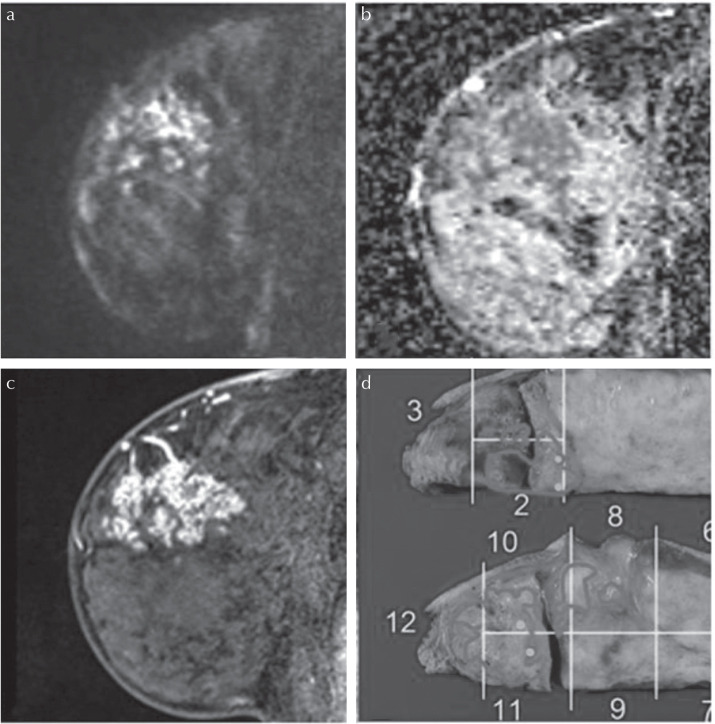
Out of 64 pathologically confirmed non-mass lesions, reader A detected 35 lesions (54.7%) and reader B detected 32 lesions (50.0%), of which 28 lesions (43.8%) were confirmed as identical. An example of a typical case of a malignant non-mass lesion is shown in Figs. 6 and 7. Both readers classified all the detected lesions as non-mass lesions on HR-DWI (100%). Lesion conspicuity of non-mass lesions was scored as 2.8 ± 0.8 and 2.9 ± 0.8 for reader A and B, respectively.
Fig. 6.
Malignant non-mass lesions in a 53-year-old patient. (a) A lesion with high signal intensity on HR-DWI (b = 850 s/mm2) was detected. Both readers classified it as a non-mass lesion and reader A measured it as 40 mm and reader B measured it as 42 mm. (b) The lesion showed low ADC value. The mean ADC value of the lesion was 0.779 × 10⁻³ mm2/s. (c) High-resolution contrast-enhanced T1WI showed a non-mass lesion with segmental distribution and clustered ring-pattern enhancement. (d) The diagnosis was high grade DCIS with invasion, and the depth of invasion was 2 mm. The pathological maximum diameter of the lesion was 50 mm. Lesions outlined in blue correspond to invasive carcinoma (NST) and those outlined in pink correspond to DCIS of high nuclear grade. ADC, apparent diffusion coefficient; DCIS, ductal carcinomas in situ; HR-DWI, high resolution-diffusion-weighted imaging; NST, no special type; T1WI, T1-weighted image.
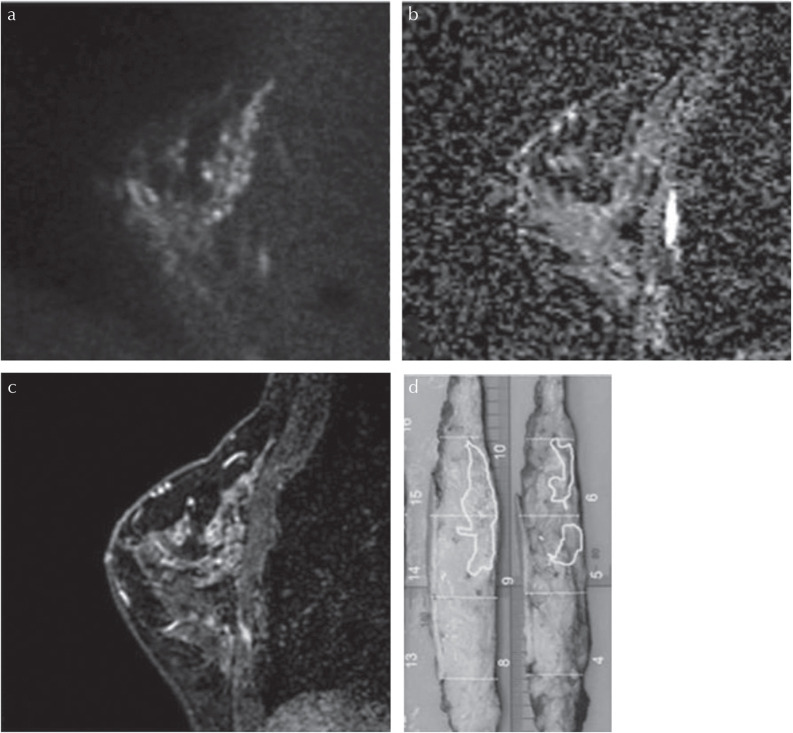
Fig. 7.
Malignant mixed-type lesions (lesions including mass and non-mass portions on pathology) in a 54-year-old patient. (a) A lesion with high signal intensity on HR-DWI (b = 850 s/mm2) was detected. Both readers classified it as a mass lesion. Reader A measured it as 12 mm and reader B measured it as 11 mm. (b) The lesion showed low ADC value. The mean ADC value of the lesion was 0.790 × 10⁻³mm2/s. (c) High-resolution contrast-enhanced T1WI showed a mass lesion with spiculated margins and rim enhancement. (d) The diagnosis was invasive carcinoma (NST) with DCIS of intermediate nuclear grade. The pathological diameter of the NST component forming mass lesion was 11 mm and its DCIS component forming non-mass lesion was 25 mm. Both readers could not detect the DCIS component and ADC values could not be measured. The lesion outlined in red corresponds to invasive carcinoma (NST) and those outlined in green correspond to DCIS of high nuclear grade. ADC, apparent diffusion coefficient; DCIS, ductal carcinomas in situ; HR-DWI, high resolution-diffusion-weighted imaging; NST, no special type; T1WI, T1-weighted image.
In some non-mass lesions, HR-DWI seemed to be superior to DCE-MRI as the lesions were difficult to distinguish from background parenchymal enhancement (BPE). The typical case is shown in Fig. 8.
Fig. 8.
Malignant non-mass lesions in a 47-year-old patient. (a) A lesion with high signal intensity on HR-DWI (b = 850 s/mm2) was detected. Both readers classified it as a non-mass lesion and reader A measured it as 47 mm and reader B measured it as 53 mm. (b) The lesion showed low ADC value. The mean ADC value of the lesion was 0.738 × 10⁻³ mm2/s. (c) High-resolution contrast-enhanced T1WI showed a non-mass lesion with segmental distribution and clumped-pattern enhancement. However, the lesion is difficult to distinguish from BPE especially in the lower part of the breast tissue. (d) The diagnosis was DCIS of intermediate nuclear grade. The pathological maximum diameter of the lesion was 73 mm. The discrepancy with lesion size in HR-DWI is suspected that the lesion extended widely in the horizontal direction. Lesions outlined in yellow correspond to DCIS of intermediate nuclear grade. ADC, apparent diffusion coefficient; BPE, background parenchymal enhancement; DCIS, ductal carcinomas in situ; HR-DWI, high resolution-diffusion-weighted imaging; T1WI, T1-weighted image.
The ICC between lesion diameters measured by the two readers was 0.92 (n = 28). A scatterplot shows the correlation between pathological diameters and the lesion diameters measured by the two readers (Fig. 9). Spearman’s correlation coefficients were 0.59 (P = 0.0002) and 0.22 (P = 0.22) respectively, indicating fair-to-poor correlation. Size differences of non-mass lesions between HR-DWI and pathology are shown in Table 4. Both readers tended to underestimate non-mass lesion size in lesions >10 mm.
Fig. 9.
The scatterplot showing the correlation between pathological diameters of non-mass lesions and diameters measured on HR-DWI for reader A (a) and B (b). Lesions which each reader did not recognize as suspicious were excluded, and finally 35 lesions detected by reader A and 32 lesions detected by reader B were included. HR-DWI, high resolution-diffusion-weighted imaging.
Table 4.
Differences in lesion diameters between pathology and HR-DWI among non-mass lesions by two readers
| Difference in lesion diameters* | Reader A (n = 35), n (%) | Reader B (n = 32), n (%) |
|---|---|---|
| ≤−10 mm | 17 (48.6) | 14 (43.8) |
| <−10 mm, ≤−5 mm | 3 (8.6) | 5 (15.6) |
| <−5 mm, ≤0 mm | 5 (14.3) | 2 (6.3) |
| <0 mm, ≤5 mm | 6 (17.1) | 5 (15.6) |
| <5 mm, ≤10 mm | 0 (0) | 4 (12.5) |
| >10 mm | 4 (11.4) | 2 (6.3) |
Data are numbers of lesions, with percentage in parentheses unless indicated otherwise.
Differences in lesion diameters are calculated as “lesion diameter on HR-DWI” minus “lesion diameter on pathology”. HR-DWI, high resolution-diffusion-weighted imaging.
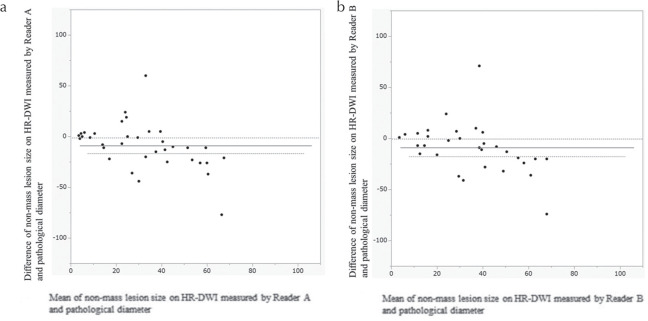
Bland–Altman plots for measured parameters are provided in Fig. 10, showing the agreement between lesion measurements on HR-DWI by two readers and pathological diameters. The size of non-mass lesions showed wider range compared with mass lesions.
Fig. 10.
Bland–Altman plots of agreement between lesion diameters measured on HR-DWI by reader A (a) and reader B (b) and pathological diameter, regarding non-mass lesions. The horizontal straight line and the two dotted lines above/below it indicates the mean difference plus/minus 1.96 times the standard deviation of the differences respectively. HR-DWI, high resolution-diffusion-weighted imaging.
The mean and SD of ADC value in malignant non-mass lesions was 0.89 ± 0.18 × 10⁻³ mm2/s, which was calculated from 39 out of 64 lesions where ROIs were able to be placed.
Discussion
Our study showed that malignant mass lesion estimates by two readers agreed with pathological findings in terms of maximum diameter. In approximately 90% of lesions, the discrepancy in diameter of tumors between HR-DWI and the pathological specimen was within 10 mm, suggesting favorable agreement. When more strict criteria of discrepancy within 5 mm were used, approximately 70% of lesions still fell into this category. These results indicate the satisfying performance of HR-DWI in estimating size of mass lesions.
While most previous papers focused on ADC values obtained from DWI, there are a few reports concerning morphological assessment of breast lesions using ss-EPI with an 1.5T MRI scanner.30,31 Another report showed the additive diagnostic value in analysis of breast lesion using rs-EPI (voxel size: 2.1 × 1.8 × 4.0 mm3) with a 3T MRI scanner.23 These previous reports pointed out the value of less-distorted DWI. Considering that DWI with rs-EPI has the advantage of less distortion compared with ss-EPI in our study, which aligned with the previous study,32 adding HR-DWI to routine study using DCE-MRI may be expected to provide more detailed information with improved image quality.
For non-mass lesions, approximately half of the malignant lesions were depicted clearly, with very strong inter-reader agreement. Certain non-mass lesions were difficult to identify on HR-DWI, probably because DCIS or invasive lesions which do not form masses are not clearly identifiable on macroscopic examination of the resected specimen.33 The correlation between diameters measured on HR-DWI and the pathology was not high. In case of large non-mass lesions, the measurement of the lesions performed on sagittal plane of HR-DWI may not reflect the maximum diameters measured on gross specimen. In addition, there is a possibility that whole lesion could not be visualized due to low cell density of peripheral part in such large non-mass lesions.
There have been few reports regarding assessment of non-mass lesions with DWI so far. Using conventional DWI, Radovic et al. included non-mass lesions in their study of morphological evaluation of breast cancer. However, they did not perform the statistical analysis for the smaller lesion subgroup (<2 cm) due to the lower number of complete observer agreements for this lesion size.30 In that respect, our study can be valuable evidence, performing detailed assessment of non-mass lesions with HR-DWI, including comparison with pathology.
The mean ADC values in our study were lower than in previous reports. It is true that the direct comparison is limited as these reports used different acquisition methods;19,23,34,35 however, there are some reports referring that ADC values obtained on rs-EPI was lower than that on ss-EPI.36,37 This discrepancy may be explained by the high spatial resolution of our protocol, which helps to delineate extent of the lesions and enabled us to place ROIs onto the lesions accurately without including ADCs of background mammary gland. Conversely, lower SNR due to a smaller excitation volume could also have caused ADC underestimation.38 Lower SNR may also be one of the reasons why ADC values of approximately 40% of the non-mass lesions were not able to be measured by reader C. Improvement in SNR is mandatory for quantitative evaluation in rs-EPI. Even though, ADC values shown in our study were within the range of ADC values of the malignant lesions reported in recently published literature carrying the consensus statement from the European Society of Breast Imaging (EUSOBI) international breast DWI working group.39
The results of our study suggest that HR-DWI using rs-EPI has a potential to evaluate malignant mass lesions with excellent agreement with pathological evaluation both in lesion detection and delineation, which may imply the potential to substitute DCE-MRI. However, some of the non-mass lesions were challenging to be evaluated on HR-DWI. Considering the risk of missing lesions, preoperative studies solely using HR-DWI seems out of the question at the moment. However, HR-DWI has theoretical potential benefit of evaluating treatment response during the course of neoadjuvant chemotherapy by reducing the use of gadolinium-based agents. In addition, this technique can potentially be used for the evaluation of patients with contraindications against the gadolinium-based agent, although challenging for non-mass lesions.
Our study has several limitations. First, this was a retrospective study with a preliminary investigation of a limited number of breast lesions. Second, only patients with malignant lesions were included in our study, thus the cancer prevalence is different from daily clinical situations, which may cause potential bias and limit generalizability. The detection of malignant lesions may not be as good as our study when applied to the general clinical population. In addition, the current analysis did not include those that were suspected malignancy on HR-DWI but proved to be benign lesions. Third, there were two mass lesions which were not detected by HR-DWI. One was located close to the axilla, where DWI is prone to have poor fat-suppression, and the other was an image with poor fat-suppression especially in the area of the lesion location. Fourth, a case of metaplastic carcinoma was considerably under-measured by 31 and 29 mm on HR-DWI by the two readers, respectively, in which rapid growth was confirmed clinically in the period between the MR scan and the operation. Fifth, we have not performed HR-DWI with ss-EPI but performed DWI with ss-EPI as a conventional method, resulting in direct comparison to be limited. As this study was based on clinical protocols, the additional scan with longer scan time was undesirable. With previous literature reporting higher quality of HR-DWI with rs-EPI compared to that with ss-EPI in evaluation of breast cancer,32 we only used rs-EPI for HR-DWI. Sixth, because of longer scanning time of the HR-DWI with rs-EPI, the coverage of the scan becomes low and limited to one side (unilateral breast). The different coverage between rs-EPI and ss-EPI prevented fair comparison regarding detectability and conspicuity of the lesion. We hope technical advancements such as simultaneous multi-slice imaging help to shorten scanning time and enables bilateral breast coverage.
Conclusion
In conclusion, HR-DWI using rs-EPI enabled visualization of malignant breast masses with excellent agreement with the pathological evaluation. Conversely, only half of the malignant non-mass lesions were identified on HR-DWI. These results suggest the current potential and limitations of HR-DWI in evaluating suspicious breast lesions.
Acknowledgments
We thank Dr. Libby Cone, MD, MA, from Edanz Group Japan for editing a draft of this manuscript. We thank Mr. Yuta Urushibata from Siemens Healthcare K.K. for the technical support in this work.
Footnotes
Conflicts of Interest
The authors declare that they have no conflicts of interest.
References
- 1.Amano G, Ohuchi N, Ishibashi T, Ishida T, Amari M, Satomi S. Correlation of three-dimensional magnetic resonance imaging with precise histopathological map concerning carcinoma extension in the breast. Breast Cancer Res Treat 2000; 60:43–55. [DOI] [PubMed] [Google Scholar]
- 2.Esserman L, Hylton N, Yassa L, Barclay J, Frankel S, Sickles E. Utility of magnetic resonance imaging in the management of breast cancer: evidence for improved preoperative staging. J Clin Oncol 1999; 17:110–119. [DOI] [PubMed] [Google Scholar]
- 3.Kuhl CK, Strobel K, Bieling H, et al. Impact of preoperative breast MR imaging and MR-guided surgery on diagnosis and surgical outcome of women with invasive breast cancer with and without DCIS component. Radiology 2017; 284:645–655. [DOI] [PubMed] [Google Scholar]
- 4.Kuhl CK, Schild HH, Morakkabati N. Dynamic bilateral contrast-enhanced MR imaging of the breast: trade-off between spatial and temporal resolution. Radiology 2005; 236:789–800. [DOI] [PubMed] [Google Scholar]
- 5.Zhang L, Tang M, Min Z, Lu J, Lei X, Zhang X. Accuracy of combined dynamic contrast-enhanced magnetic resonance imaging and diffusion-weighted imaging for breast cancer detection: a meta-analysis. Acta Radiol 2016; 57:651–660. [DOI] [PubMed] [Google Scholar]
- 6.Goto M, Ito H, Akazawa K, et al. Diagnosis of breast tumors by contrast-enhanced MR imaging: comparison between the diagnostic performance of dynamic enhancement patterns and morphologic features. J Magn Reson Imaging 2007; 25:104–112. [DOI] [PubMed] [Google Scholar]
- 7.Sadowski EA, Bennett LK, Chan MR, et al. Nephrogenic systemic fibrosis: risk factors and incidence estimation. Radiology 2007; 243:148–157. [DOI] [PubMed] [Google Scholar]
- 8.McDonald RJ, McDonald JS, Kallmes DF, et al. Intracranial gadolinium deposition after contrast-enhanced MR imaging. Radiology 2015; 275:772–782. [DOI] [PubMed] [Google Scholar]
- 9.Kang H, Hii M, Le M, et al. Gadolinium deposition in deep brain structures: relationship with dose and ionization of linear gadolinium-based contrast agents. AJNR Am J Neuroradiol 2018; 39:1597–1603. [DOI] [PMC free article] [PubMed] [Google Scholar]
- 10.Layne KA, Dargan PI, Archer JRH, Wood DM. Gadolinium deposition and the potential for toxicological sequelae - a literature review of issues surrounding gadolinium-based contrast agents. Br J Clin Pharmacol 2018; 84:2522–2534. [DOI] [PMC free article] [PubMed] [Google Scholar]
- 11.Kanda T, Ishii K, Kawaguchi H, Kitajima K, Takenaka D. High signal intensity in the dentate nucleus and globus pallidus on unenhanced T1-weighted MR images: relationship with increasing cumulative dose of a gadolinium-based contrast material. Radiology 2014; 270:834–841. [DOI] [PubMed] [Google Scholar]
- 12.Errante Y, Cirimele V, Mallio CA, Di Lazzaro V, Zobel BB, Quattrocchi CC. Progressive increase of T1 signal intensity of the dentate nucleus on unenhanced magnetic resonance images is associated with cumulative doses of intravenously administered gadodiamide in patients with normal renal function, suggesting dechelation. Invest Radiol 2014; 49:685–690. [DOI] [PubMed] [Google Scholar]
- 13.Woodhams R, Ramadan S, Stanwell P, et al. Diffusion-weighted imaging of the breast: principles and clinical applications. Radiographics 2011; 31:1059–1084. [DOI] [PubMed] [Google Scholar]
- 14.Partridge SC, DeMartini WB, Kurland BF, Eby PR, White SW, Lehman CD. Quantitative diffusion-weighted imaging as an adjunct to conventional breast MRI for improved positive predictive value. AJR Am J Roentgenol 2009; 193:1716–1722. [DOI] [PubMed] [Google Scholar]
- 15.Partridge SC, McKinnon GC, Henry RG, Hylton NM. Menstrual cycle variation of apparent diffusion coefficients measured in the normal breast using MRI. J Magn Reson Imaging 2001; 14:433–438. [DOI] [PubMed] [Google Scholar]
- 16.O’Flynn EA, Morgan VA, Giles SL, deSouza NM. Diffusion weighted imaging of the normal breast: reproducibility of apparent diffusion coefficient measurements and variation with menstrual cycle and menopausal status. Eur Radiol 2012; 22:1512–1518. [DOI] [PubMed] [Google Scholar]
- 17.Kim JY, Suh HB, Kang HJ, et al. Apparent diffusion coefficient of breast cancer and normal fibroglandular tissue in diffusion-weighted imaging: the effects of menstrual cycle and menopausal status. Breast Cancer Res Treat 2016; 157:31–40. [DOI] [PubMed] [Google Scholar]
- 18.Shin S, Ko ES, Kim RB, et al. Effect of menstrual cycle and menopausal status on apparent diffusion coefficient values and detectability of invasive ductal carcinoma on diffusion-weighted MRI. Breast Cancer Res Treat 2015; 149:751–759. [DOI] [PubMed] [Google Scholar]
- 19.Shi RY, Yao QY, Wu LM, Xu JR. Breast lesions: diagnosis using diffusion weighted imaging at 1.5T and 3.0T-systematic review and meta-analysis. Clin Breast Cancer 2018; 18:e305–e320. [DOI] [PubMed] [Google Scholar]
- 20.Yamada T, Kanemaki Y, Okamoto S, Nakajima Y. Comparison of detectability of breast cancer by abbreviated breast MRI based on diffusion-weighted images and postcontrast MRI. Jpn J Radiol 2018; 36:331–339. [DOI] [PubMed] [Google Scholar]
- 21.Bickelhaupt S, Laun FB, Tesdorff J, et al. Fast and noninvasive characterization of suspicious lesions detected at breast cancer X-ray screening: capability of diffusion-weighted MR imaging with MIPs. Radiology 2016; 278:689–697. [DOI] [PubMed] [Google Scholar]
- 22.Porter DA, Heidemann RM. High resolution diffusion-weighted imaging using readout-segmented echo-planar imaging, parallel imaging and a two-dimensional navigator-based reacquisition. Magn Reson Med 2009; 62:468–475. [DOI] [PubMed] [Google Scholar]
- 23.An YY, Kim SH, Kang BJ. Differentiation of malignant and benign breast lesions: added value of the qualitative analysis of breast lesions on diffusion-weighted imaging (DWI) using readout-segmented echo-planar imaging at 3.0 T. PLoS One 2017; 12:e0174681. [DOI] [PMC free article] [PubMed] [Google Scholar]
- 24.Baltzer PAT, Bickel H, Spick C, et al. Potential of noncontrast magnetic resonance imaging with diffusion-weighted imaging in characterization of breast lesions: intraindividual comparison with dynamic contrast-enhanced magnetic resonance imaging. Invest Radiol 2018; 53:229–235. [DOI] [PMC free article] [PubMed] [Google Scholar]
- 25.Bogner W, Pinker-Domenig K, Bickel H, et al. Readout-segmented echo-planar imaging improves the diagnostic performance of diffusion-weighted MR breast examinations at 3.0 T. Radiology 2012; 263:64–76. [DOI] [PubMed] [Google Scholar]
- 26.Delbany M, Bustin A, Poujol J, et al. One-millimeter isotropic breast diffusion-weighted imaging: evaluation of a superresolution strategy in terms of signal-to-noise ratio, sharpness and apparent diffusion coefficient. Magn Reson Med 2019; 81:2588–2599. [DOI] [PubMed] [Google Scholar]
- 27.Kataoka M, Kanao S, Iima M, et al. High resolution DWI with readout-segmented EPI and computed DWI as a potential alternative of high resolution dynamic contrast enhanced MRI in evaluating breast cancer. Proceedings of the 24th Annual Meeting of ISMRM, Singapore, 2016; 2737. [Google Scholar]
- 28.Koo TK, Li MY. A guideline of selecting and reporting intraclass correlation coefficients for reliability research. J Chiropr Med 2016; 15:155–163. [DOI] [PMC free article] [PubMed] [Google Scholar]
- 29.Chan YH. Biostatistics 104: correlational analysis. Singapore Med J 2003; 44:614–619. [PubMed] [Google Scholar]
- 30.Radovic N, Ivanac G, Divjak E, Biondic I, Bulum A, Brkljacic B. Evaluation of breast cancer morphology using diffusion-weighted and dynamic contrast-enhanced MRI: intermethod and interobserver agreement. J Magn Reson Imaging 2019; 49:1381–1390. [DOI] [PubMed] [Google Scholar]
- 31.Kul S, Metin Y, Kul M, Metin N, Eyuboglu I, Ozdemir O. Assessment of breast mass morphology with diffusion-weighted MRI: Beyond apparent diffusion coefficient. J Magn Reson Imaging 2018; 48:1668–1677. [DOI] [PubMed] [Google Scholar]
- 32.Kanao S, Kataoka M, Iima M, et al. High-resolution diffusion-weighted MRI of the breast using readout-segmented EPI and single-shot EPI. Imaging Med 2017; 9:185–190. [Google Scholar]
- 33.Bane A. Ductal carcinoma in situ: what the pathologist needs to know and why. Int J Breast Cancer 2013; 2013:914053. [DOI] [PMC free article] [PubMed] [Google Scholar]
- 34.Imamura T, Isomoto I, Sueyoshi E, et al. Diagnostic performance of ADC for Non-mass-like breast lesions on MR imaging. Magn Reson Med Sci 2010; 9:217–225. [DOI] [PubMed] [Google Scholar]
- 35.Iima M, Le Bihan D, Okumura R, et al. Apparent diffusion coefficient as an MR imaging biomarker of low-risk ductal carcinoma in situ: a pilot study. Radiology 2011; 260:364–372. [DOI] [PubMed] [Google Scholar]
- 36.Yamaguchi K, Nakazono T, Egashira R, et al. Diagnostic performance of diffusion tensor imaging with readout-segmented echo-planar imaging for invasive breast cancer: correlation of ADC and FA with pathological prognostic markers. Magn Reson Med Sci 2017; 16:245–252. [DOI] [PMC free article] [PubMed] [Google Scholar]
- 37.Wisner DJ, Rogers N, Deshpande VS, et al. High-resolution diffusion-weighted imaging for the separation of benign from malignant BI-RADS 4/5 lesions found on breast MRI at 3T. J Magn Reson Imaging 2014; 40:674–681. [DOI] [PMC free article] [PubMed] [Google Scholar]
- 38.Dietrich O, Heiland S, Sartor K. Noise correction for the exact determination of apparent diffusion coefficients at low SNR. Magn Reson Med 2001; 45:448–453. [DOI] [PubMed] [Google Scholar]
- 39.Baltzer P, Mann RM, Iima M, et al. Diffusion-weighted imaging of the breast-a consensus and mission statement from the EUSOBI International Breast Diffusion-Weighted Imaging working group. Eur Radiol 2020; 30:1436–1450. [DOI] [PMC free article] [PubMed] [Google Scholar]


