Abstract
Purpose
To develop and evaluate fully automatic scan range delimitation for chest CT by using deep learning.
Materials and Methods
For this retrospective study, scan ranges were annotated by two expert radiologists in consensus in 1149 (mean age, 65 years ± 16 [standard deviation]; 595 male patients) chest CT topograms acquired between March 2002 and February 2019 (350 with pleural effusion, 376 with atelectasis, 409 with neither, 14 with both). A conditional generative adversarial neural network was trained on 1000 randomly selected topograms to generate virtual scan range delimitations. On the remaining 149 topograms the software-based scan delimitations, scan lengths, and estimated radiation exposure were compared with those from clinical routine. For statistical analysis an equivalence test (two one-sided t tests) was used, with equivalence limits of 10 mm.
Results
The software-based scan ranges were similar to the radiologists’ annotations, with a mean Dice score coefficient of 0.99 ± 0.01 and an absolute difference of 1.8 mm ± 1.9 and 3.3 mm ± 5.6 at the upper and lower boundary, respectively. An equivalence test indicated that both scan range delimitations were similar (P < .001). The software-based scan delimitation led to shorter scan ranges compared with those used in clinical routine (298.2 mm ± 32.7 vs 327.0 mm ± 42.0; P < .001), resulting in a lower simulated total radiation exposure (3.9 mSv ± 3.0 vs 4.2 mSv ± 3.3; P < .001).
Conclusion
A conditional generative adversarial neural network was capable of automating scan range delimitation with high accuracy, potentially leading to shorter scan times and reduced radiation exposure.
Keywords: Adults and Pediatrics, CT, Computer Applications-Detection/Diagnosis, Convolutional Neural Network (CNN), Lung, Radiation Safety, Segmentation, Supervised learning, Thorax
© RSNA, 2021
Summary
Fully automatic scan range delimitation is possible in chest CT by using a trained conditional generative adversarial neural network.
Key Points
■ Fully automatic scan range delimitation at chest CT was feasible with high accuracy and showed excellent agreement with the delimitations made by two expert radiologists in consensus (mean Dice score coefficient, 0.99 ± 0.01; mean absolute differences, 1.8 and 3.3 mm at the upper and lower boundaries, respectively).
■ Software-based scan range delimitation led to shorter scan ranges compared with those of radiographers in clinical routine (298.2 mm ± 32.7 vs 327.0 mm ±42.0; P < .001).
■ When radiation dose was simulated with the scan ranges determined by the software and radiographers, the radiation doses were lower than that of radiographers (3.9 mSv ± 3.0 vs 4.2 mSv ± 3.3; P < .001).
Introduction
CT has become widely used for a variety of diagnostic tasks since its integration in clinical workflows, with 219 CT scans per 1000 inhabitants in the United States in 2019 and with rising trends (1). Because the radiation from CT imaging is comparatively high and is the main source of human-made radiation exposure (2), CT imaging requires careful planning to limit radiation exposure. The delimitation of the scan range is crucial because radiation dose is dependent on the length of the CT examination.
The examination range is typically delimited manually by a radiographer in the CT topogram (also known as scout view), which is a digital overview image acquired with low radiation exposure in anteroposterior and/or lateral orientation. Whereas unnecessarily large CT examinations can result in increased radiation exposure, an examination that does not completely cover the area of interest may not depict all pathologic abnormalities and could therefore result in the need for a second scan, which exposes the patient to yet more radiation. Therefore, radiographers tend toward a generous delimitation of the scan range, and recent studies reported overscanning in 23% to 95% of chest CT examinations in clinical routine (3–5).
Because sufficient scan range delimitation is crucial and manual definition of the scan range is time-consuming and subject to high intra- and interreader variability (5), an automated definition of the scan range for CT imaging would be of great interest. Several challenges must be overcome when computer algorithms are used for automated scan range delimitation. Because topograms are obtained with a low radiation dose, these images are naturally noisy and of low contrast. In addition, in the presence of pathologic abnormalities (eg, pleural effusion and atelectasis), important anatomic markers such as the diaphragm are difficult or even impossible to delimit.
Deep learning methods recently produced excellent results in the field of medical imaging, with performances close to that of humans (6,7), thereby demonstrating that these methods can cope with obstacles such as noisy image quality.
Therefore, our study aimed to develop and evaluate fully automatic scan range delimitation for routine chest CT by using deep learning.
Materials and Methods
Patients
Ethical approval for this retrospective study was granted by the local ethics committee (19–8999-BO), and informed consent was waived.
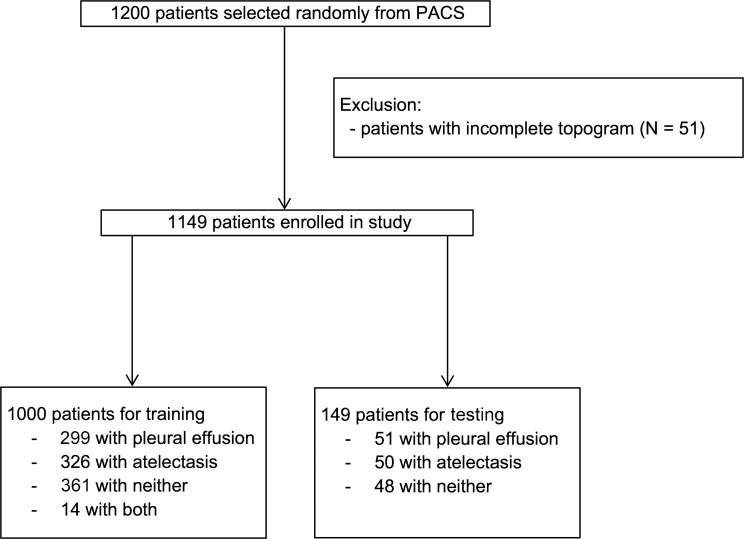
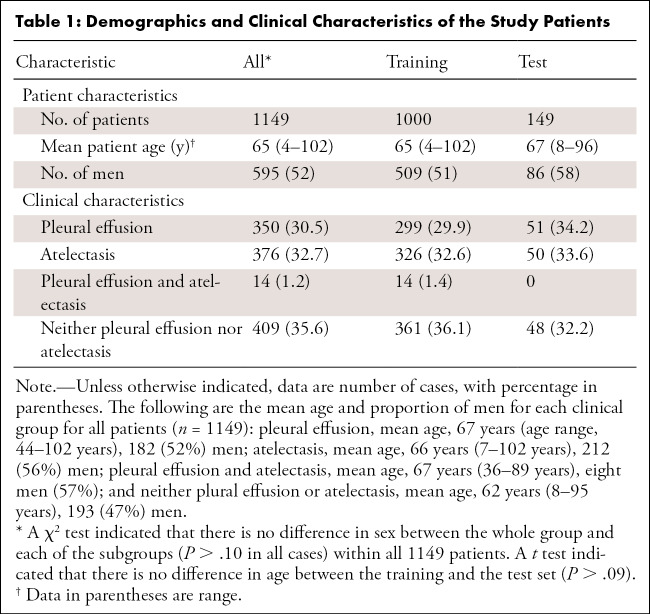
Because pleural effusions and atelectasis are the conditions that most influence the ability to demarcate important anatomic markers in chest topograms, a single full-text search was performed in our radiologic information system at the University Hospital Essen (Germany) to select CT reports containing the keywords “atelectasis” or “pleural effusion” or “no pleural effusion and no atelectasis”. From this query, 1200 CT scans acquired between March 2002 and February 2019 were randomly chosen and exported from the picture archiving and communication system in anonymized form. Patients were considered eligible and included if they were older than 18 years and if a topogram corresponding to the CT scan was available. Thereafter, images were checked by two radiologists in consensus regarding whether each topogram covered the entire thorax from the base of the neck to below the diaphragm; topograms that did not fulfill this requirement were excluded (n = 51) (Fig 1). Together, these criteria resulted in a dataset of 1149 CT scans (mean age, 65 years ± 16; 595 men), of which 350 showed pleural effusion, 376 atelectasis, 409 neither pleural effusion nor atelectasis (but may show other pathologic abnormalities such as lung infiltrates or tumors), and 14 scans showed both pleural effusion and atelectasis (Table 1).
Figure 1:
Patient inclusion and exclusion flowchart. PACS = picture archiving and communication system.
Table 1:
Demographics and Clinical Characteristics of the Study Patients
Topogram Acquisition
The selected CT scans were performed on various Siemens CT scanners (Siemens Healthineers) (Table E1 [supplement]). All topograms were acquired in inspiration in anteroposterior direction with a tube voltage of 120 kV and tube currents between 20 mA and 100 mA. The topograms were then exported as PNG files.
Scan Range Delimitation
The scan ranges previously delimited by the radiographers in the topograms were revised by using a custom-tailored software developed in Python and corrected by two expert radiologists (K.N. and M.S.K., with 15 and 3 years of experience, respectively) in consensus, whereby the aim was to limit the scan range from the apices of the lungs to just below the costophrenic recesses with a safety margin of 15 mm at the upper boundary (anatomically superior) and 20 mm at the lower boundary (anatomically inferior). Therefore, every topogram had two annotations: one made by the radiographers in clinical routine, and one made by the two expert radiologists (Fig 2).
Figure 2:
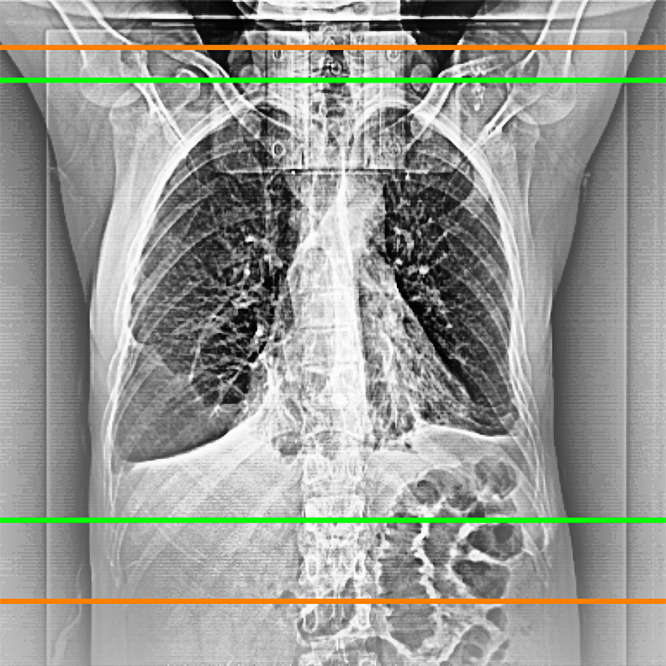
Example of a scan range limitation of radiologists (green) and radiographers (orange).
Software Development
From the 1149 annotated topograms, 1000 were randomly selected for training the deep learning algorithm, whereas the remaining 149 datasets were preserved for subsequent testing of the performance of the final algorithm. Only the radiologists’ annotations were used to train the algorithm.
A conditional generative adversarial neural network (8), which is an image-to-image network, was trained. This network was chosen because it was shown to produce high-quality output, is robust to train, and does not easily overfit. The training procedure followed best practices in machine learning. First, a fivefold cross-validation was applied to the training dataset to estimate the performance of the neural network by computing Dice scores. Then a final network was retrained with all training data, which was subsequently evaluated once on the holdout test dataset. More details regarding the training procedure are in Appendix E1 (supplement). All experiments were conducted on a workstation that was not connected to the network used for clinical routine. The network was developed using Python (version 3.6) and PyTorch (version 1.0; pytorch.org) (11).
Evaluation of the Deep Learning Algorithm
By using a dataset of 149 patients (51 patients, pleural effusion; 50 patients, atelectasis; and 48 patients, neither pleural effusion nor atelectasis), which had not been used to train the algorithm, the quality of the final model was evaluated in three ways.
First, a comparison of the software-generated scan ranges with the radiologists’ scan range annotations was performed because a high overlap between these would indicate a successful training of the deep learning algorithm. For this purpose, Dice scores measuring the relative overlap of the regions were calculated. Moreover, absolute differences between the annotated and the software-generated scan range boundaries and the resulting scan lengths were calculated and compared by using a Bland-Altman–type analysis (12) and an equivalence test.
Second, the clinical usefulness of the final model was evaluated by comparing the software-generated scan ranges with the true lung boundaries (ground truth) within the acquired CT scan. For this assessment in all 149 CT scans, the section position in which the tip of the lung was no longer visible and the section position in which the cost-diaphragmatic recesses were just no longer visible were recorded, whereby the specification was based on sections with a thickness of 5 mm. A boundary at either end was considered correct if it showed larger than necessary margins because a larger scan range would not have an effect on diagnosis. However, if a boundary was too short and thus parts of the lung were not depicted in the CT scan, the range was considered erroneous. Here, a boundary was considered too short if it was shorter than at least 10 mm of the ground truth boundaries, which corresponded to twice the section thickness of the CT scans.
Third, the scan ranges defined by the radiographers in clinical routine were compared with those of the neural network.
To understand whether the results depended on pathologic abnormalities masking important anatomic structures in the topograms, subgroup analysis was performed in patients with pleural effusion, with atelectasis, or without either.
Robustness of the Neural Network
To assess the robustness of the trained neural network, each of the 149 scans was randomly deformed 10 times and evaluated a second time by the neural network. Four basic types of deformations that are common in clinical routine were used: horizontal and vertical shifts (ranging between –10 and 10 pixels), rescaling (–5% to 5%), and adding Poisson noise. The differences between the imaging ranges were calculated for the upper and lower scan range boundaries.
Estimation of Radiation Dose
A commercially available radiation dose tracking software (Radimetrics, version 2.9A; Bayer Healthcare) was used, as previously described, to calculate the effective dose as defined by International Commission on Radiological Protection publication 103 (25) of the acquired CT scans and to simulate the dose that would have resulted if the software-based imaging boundaries had been used (4). In short, this software first matches a virtual phantom to the topogram of the patient and then uses Monte Carlo simulations to estimate the organ doses and the effective dose (13). Because radiation exposure could be associated with the risk of thyroid cancer (14), the radiation dose to the thyroid gland was estimated in addition to the effective dose.
Statistical Analysis
The determination of a minimum sample size for a successful training of a neural network strongly depends on the complexity and quality of the data and the nature of the problem.
Unfortunately, to the authors’ knowledge, there is no comprehensive theory that would determine a lower bound estimate of the sample size for a given problem. Although initial steps are being taken in this direction (15), the problem is still not understood in its entirety (16). For example, the U-Net is able to produce segmentations with high accuracy even for training sets with only a few dozen examples (9), whereas the ChestNet has been trained on a dataset with more than 650 000 images for a network to achieve accuracy similar to that of a human radiologist (17). For this reason, we decided to use a medium and manageable dataset of 1000 images, which we believe covers the actual complexity of the data well enough for our purposes.
For the evaluation of the final model, a power analysis of a one-sided t test with β power of .9, an α significance level of .025, and an expected difference of at least 5 mm and variance of 10 mm resulted in a minimum sample size of 100.
Paired t tests for equivalence were conducted to assess whether the software-generated scan ranges are equivalent to the radiologists’ annotations (18). Here equivalence boundaries were taken to be 5 mm, corresponding to the section thickness. Additionally, paired two-sided Wilcoxon signed rank tests were used to assess statistical difference. A P value less than .05 was considered to indicate a statistically significant difference. No adjustments were performed for multiple testing. Descriptive values were reported as reported means ± standard deviations. Statistical analyses were conducted by using R 3.4.4 and by using the TOSTER package (version 0.3.4) (19).
Results
Software-generated Scan Ranges versus Radiologists’ Scan Range Delimitations
The correlation of the software-generated and the radiologists’ scan range delimitations measured by the Dice score was 0.99 ± 0.01 for all patients and all subgroups.
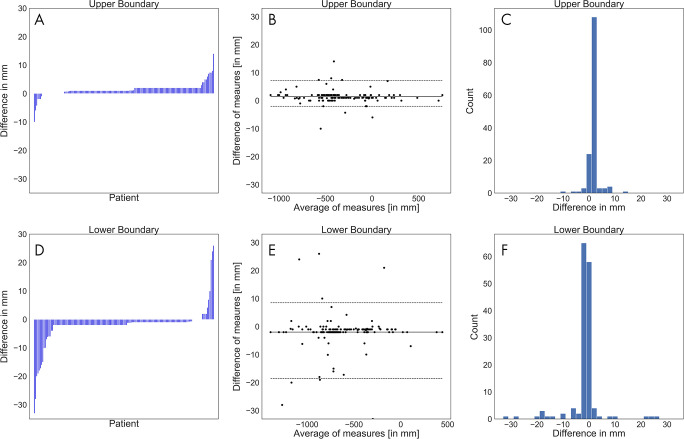
The annotations at both boundaries were close (Figs 3–4). The mean absolute difference between the software-generated and the radiologists’ scan range annotation was 1.8 mm ± 1.9 at the upper boundary and 3.3 mm ± 5.6 at the lower boundary (Fig 3). The Bland-Altman plot revealed a mean difference of 1.4 mm and −2.8 mm for the upper and lower boundary, respectively, showing that there is no large bias between the two scan ranges. A Shapiro-Wilk test indicated that the differences are not normally distributed (P < .001), and the 2.5% and 97.5% quantiles were used as limits of agreement; these were, respectively, 7.2 mm and –2.0 mm for the upper boundary and 8.5 mm and –18.5 mm for the lower boundary. This indicates that the expected difference between the measured scan ranges is less than 10 mm except at the lower boundary, where the software-generated scan ranges are slightly shorter. A linear regression to predict the difference from the average of measures revealed that at both boundaries the slope is not different from 0 (P > .1; ie, there is no systematic difference visible).
Figure 3:
A, D, Waterfall plots, B, E, Bland-Altman plots, and, C, F, histograms of the differences between the software-generated scan ranges and the radiologists’ scan ranges for each patient. A positive difference indicates that the radiologists’ scan range was longer. A, The differences at the upper boundary were sorted and plotted as bars. B, The average of both measurements at the upper boundary were plotted against their differences. The solid line marks the mean of differences, and the dashed lines mark the limits of agreement based on the 2.5% and 97.5% quantiles. C, The differences at the upper boundary were plotted by counts with a bin width of 2 mm. D, The differences at the lower boundary were sorted and plotted as bars. E, The average of both measurements at the lower boundary were plotted against their differences. The solid line marks the mean of differences, and the dashed lines mark the limits of agreement based on the 2.5% and 97.5% quantiles. F, The differences at the lower boundary were plotted by counts with a bin width of 2 mm.
Figure 4:
Scan range delimitations of the radiologists (green) and the network (blue) show that, A, the software-generated scan range is shorter (Dice score, 0.94), B, the scan ranges are close (Dice score, 0.99), and, C, the software-generated scan range is longer (Dice score, 0.96).
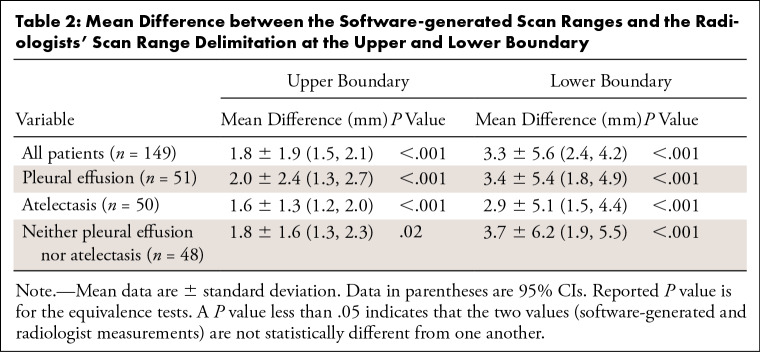
An equivalence test showed that the boundary difference between the software and the radiologists was not different when using an equivalence limit of 5 mm (P < .001) on any of the subgroups of the test dataset (Table 2).
Table 2:
Mean Difference between the Software-generated Scan Ranges and the Radiologists' Scan Range Delimitation at the Upper and Lower Boundary
The mean length of the software-generated scan ranges was 298 mm ± 33 and 302 mm ± 33 for the radiologists’ scan range delimitation. Subgroup equivalence test analysis revealed that software-generated scan ranges were not different than those of the radiologists for all test patients (P = .001), patients with pleural effusion (P = .03), and patients with atelectasis (P = .02); however, for patients with neither pleural effusion nor atelectasis, the software-generated range was shorter (300 mm ± 31 vs 304 mm ± 32; P = .11) (Table 3).
Table 3:
Software-generated Scan Ranges versus Radiologists' Scan Range Delimitation
Software-generated Scan Ranges versus True Lung Boundaries
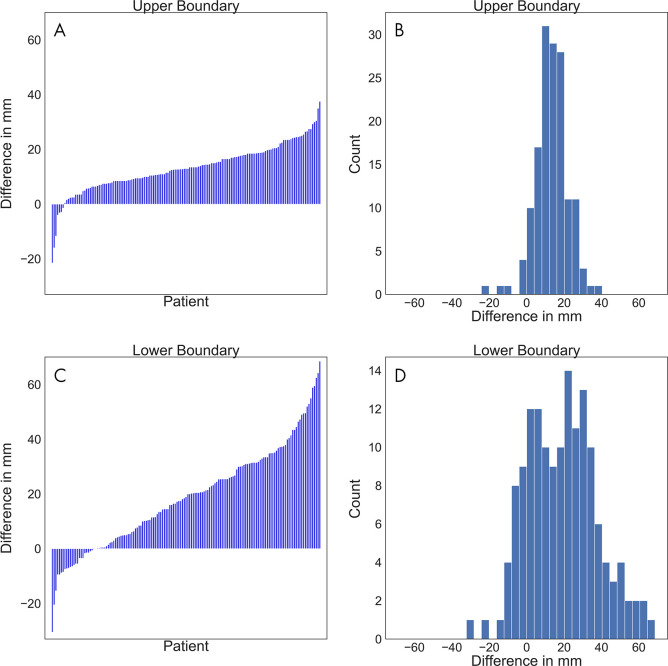
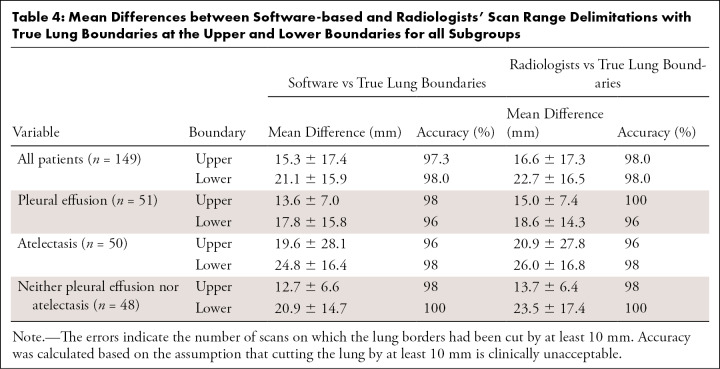
Comparison of the software-generated scan range limits and the radiologists’ annotations with the true lung boundaries (ground truth) showed a mean difference at the upper boundary of 15.3 mm ± 17.4 for the neural network and 16.6 mm ± 17.3 for the radiologists. Additionally, it showed a mean difference at the lower boundary of 21.1 mm ± 15.9 for the neural network and 22.7 mm ± 16.5 for the radiologists (Fig 5). An equivalence test indicated that the software-generated scan ranges and those of the radiologists were equivalent at both boundaries (P < .001). Subgroup analysis showed the largest differences between software-generated imaging range boundaries and true lung boundaries in patients with atelectasis at the upper and lower boundaries. The smallest differences were observed at the upper boundary in patients who had neither pleural effusion nor atelectasis, and at the lower boundary in patients with pleural effusions (Table 4).
Figure 5:
A, C, Waterfall plots and, B, C, histograms show the differences between the software-generated scan ranges and the ground truth scan ranges for each patient. A positive difference indicates that the generated scan range was longer. A, The differences at the upper boundary were sorted and plotted as bars. B, The differences at the upper boundary were plotted by counts with a bin width of 2 mm. C, The differences at the lower boundary were sorted and plotted as bars. D, The differences at the lower boundary were plotted by counts with a bin width of 2 mm.
Table 4:
Mean Differences between Software-based and Radiologists’ Scan Range Delimitations with True Lung Boundaries at the Upper and Lower Boundaries for all Subgroups
When considering a scan range boundary that is at least 10 mm shorter than the ground truth (true lung boundary on the CT scan) as clinically unacceptable, the neural network showed an accuracy of 97.3% (145 of 149) for all patients at the upper boundary, which had only one less error than the radiologists’ annotations (98.0%; 146 of 149). On the lower boundary the performance of the neural network and the radiologists was the same (accuracy, 98.0%; 146 of 149). Subgroup analysis showed highest accuracy (100%; 49 of 49) at the upper and at the lower boundary in patients who had neither pleural effusion nor atelectasis. The lowest accuracy was observed at the upper boundary in patients with atelectasis (96%; 48 of 50) and at the lower boundary in patients with pleural effusions (96.1%; 49 of 51) (Table 4).
Software-generated Scan Ranges versus Radiographers’ Scan Range Delimitation
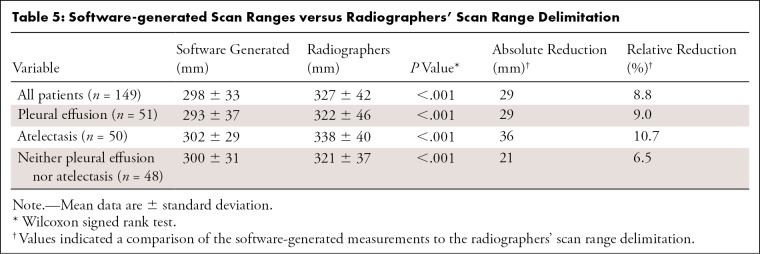
Comparison of the software-generated scan ranges with those of the radiographers showed shorter scan ranges for the software approach for the entire test population (298.2 mm ± 32.7 vs 327.0 mm ± 42.0; P < .001) and all subgroups (Table 5). In percentage terms, software-generated scan range delimitation led to a relative reduction in scan length by 8.8%, with the greatest reduction achieved in patients with atelectasis (10.7%). For the entire test dataset, the shortening of the scan range was 12.1 mm ± 16.7 at the upper scan field border and 20.9 mm ± 18.7 at the lower border (P < .001).
Table 5:
Software-generated Scan Ranges versus Radiographers' Scan Range Delimitation
Robustness of the Neural Network
Transformed images resulted in similar scan ranges, with a mean difference of −0.4 mm ± 2.2 at the upper boundary (P = .002) and −7.6 mm ± 3.7 at the lower boundary (P = .15).
Estimation of Radiation Dose
Simulated radiation dose of the software-generated scan ranges was lower than that of the radiographers (3.925 mSv ± 3.0 vs 4.176 mSv ± 3.3; P < .001), corresponding to a mean dose reduction of 6.0%. There was also a reduction in radiation exposure to the thyroid (3.84 mSv ± 7.3 vs 4.667 mSv ± 9.3; P < .001). The relative reduction was higher (17.7%). The reduction is also statistically significant across all subgroups for both total radiation dose and dose to the thyroid (P < .001 in all cases).
Discussion
Currently, CT is the largest source of human-made radiation exposure, dependent on scan length. Therefore, the exact definition of the scan range is important. Our results show that software-based, fully automatic determination of the scan range is feasible in chest CT with high accuracy and robustness. Furthermore, our results suggest that the neural network approach could allow for a reduction in radiation dose compared with the radiographers’ scan range delimitation because of a shortening of the scan range.
For automatic scan range delimitation, a conditional generative adversarial neural network, which is a special type of image-to-image network, was trained to mimic the radiologists’ annotations by using scan range delimitations made by two expert radiologists. The overall agreement between the software-based scan ranges and those of the radiologists was excellent, even though, based on an equivalence test with an equivalence limit of 10 mm and the Bland-Altman analysis, the software-based scan ranges were slightly shorter. This demonstrates the successful training of the neural network and the potential of this approach.
Although deep learning methods have recently produced excellent results in the field of medical imaging, few studies have investigated automatic scan range delimitation in CT. In 2019 Huo et al (20) introduced a neural network based on the U-Net framework for segmentation of the lung region at chest CT. They reported a high correlation of their software-generated scan ranges and the manual scan range delimitations with a Dice score of 0.976, a finding similar to that of our study. In contrast to our study, however, which deliberately included a high proportion of patients with pathologic abnormalities that make segmentation of the lung region difficult (pleural effusions and atelectasis), Huo et al (20) analyzed only chest CT examinations performed in the context of lung cancer screening. Because of the exclusive use and analysis of CT scans with an extremely low prevalence of acute thoracic pathologic abnormalities, the study by Huo et al (20) does not allow a determination of whether their software-based scan range delimitation is feasible in daily clinical routine with a higher prevalence of thoracic pathologic abnormalities. A different approach was investigated by Zhang et al (21), who used a Markov random field in detecting multiple predefined landmarks (eg, apex of the lung and tracheal bifurcation), which were then used for scan range delimitation. A disadvantage of this approach is that it requires the precise manual annotation of a large number of anatomic landmarks for training. Moreover, in patients with thoracic pathologic abnormalities, some landmarks may not be delimitable in the topogram, which may impair the scan range delimitation. Unfortunately, the validation of their model was not very extensive and was performed on only 36 cases, and no information was given regarding whether any pathologic abnormalities were present in their datasets. As a result, it is unclear whether their approach is suitable for daily clinical routine. Thus, our study overcomes the limitations that arose in these previous studies to show that automatic scan range delimitation is also possible in the presence of thoracic pathologic abnormalities that impede lung segmentation.
Our study showed that a significant reduction in the scan lengths is possible in chest CT while maintaining high accuracy. Whereas the software-based scan range delimitation led to an average scan length of 298 mm ± 33 in our study, the average scan length in clinical routine as determined by the radiographers was 327 mm ± 42, which corresponds to a difference of almost 10%. Recently, several studies focused on the topic of overscanning at chest CT, whereby overscanning was defined as a scan larger than the upper and lower lung border with a 2-cm safety margin for each border. Schwartz et al (4), who analyzed the incidence of overscanning among six hospitals, found that it occurred in 221 of 600 (36.8%) chest CT scans, most frequently at the lower scan boundary (147 of 600), while observing great differences between the six hospitals (incidence of overscanning, 7%–65%). An even greater frequency of overscanning was reported by Cohen et al (3), who evaluated 1118 chest CT scans and observed overscanning in 81% and 95% at the upper and lower boundary, respectively. However, Colevray et al (5) reported overscanning in only 23% of patients, which highlighted the great differences between different hospitals in determining the scan range. However, because an unnecessarily long scan range leads to unnecessary radiation exposure, these studies show the clinical need for improved scan range delimitation.
Clearly, more accurate scan ranges result in reduced total radiation exposure. Accordingly, we observed a reduction of 6% when our software was used. This reduction was lower than expected, because the scan range length was reduced by nearly 10%. The reason for this difference likely results from the fact that radiation exposure in modern CT examination is not uniformly distributed over the chest and is lower around the neck. Thus, more accurate scan range delimitations at the upper border do not correspond to a similarly high reduction in total radiation dose. Increased accuracy at the upper border has a more profound effect on the radiation exposure of the thyroid gland, where we consequently observed an increased reduction in radiation dose (18%). Because there are large differences in the definition of the scan field between different hospitals (3–5), it must be noted that the dose saving by our software strongly depends on the previous habits of scan field definition and may be much higher in individual cases. However, because radiation exposure is harmful in principle, the dose reduction achieved by using our software is desirable. This is especially true because patients often undergo multiple CT examinations over the years, which can result in high cumulative radiation doses (22).
The neural network produced results similar to those of radiologists, and it seems possible that a deployment in clinical routine can be successful. The predictions of the network were robust, and the prediction time for each scan range was less than a few seconds (Appendix E1 [supplement]). However, because in some cases the software-based imaging boundaries had been too narrow and small parts of the lungs were not included in the scan range, supervision by the radiographers would be necessary, and the usefulness of the model would depend on their choices. In practical terms, deployment of our software in clinical use could be achieved by integrating it as an additional module on the CT scanner. As soon as a topogram is acquired, this module would generate a scan range and suggest it to the radiographer. The radiographer could then decide to use, correct, or discard the proposal.
There were limitations within our study. It should be noted that our study was conducted at a single site, which limits the generalizability of the results, especially the comparison of the software-based scan ranges to those of the radiographers. In addition, all examinations were performed by using Siemens CT scanners, which limited the transferability to other vendors. However, we deliberately used topograms acquired with various Siemens CT scanners, from an older four-section CT scanner to a modern high-end dual-source CT scanner, to ensure that the impression and quality of the topograms varied. As a consequence of using partly old CT datasets, only CT datasets with a section thickness of 5 mm were available, which impeded the comparison of the software-based scan boundaries with the true lung boundaries. Therefore, further analysis of CT scans acquired at other sites with CT scanners from other vendors should be conducted. Moreover, because reliability is key for a successful deployment, a thorough analysis of the influence of patient characteristics and pathologic abnormalities other than those we explicitly considered (ie, patients with atelectasis or pleural effusion) on the software-generated scan ranges should be conducted. Whereas such patients (eg, with lung infiltrations) were in our patient collective, they were not the focus of our study and they may have a larger than expected influence on the network predictions. Our test for robustness showed minimal but statistically significant variations at the upper scan range boundary, which could be an effect of the shifting and rescaling that pushed the upper border at the first line of the topogram. Because such scan ranges were rarely present in the training set, it is plausible that the predictions of the neural network were not good enough for these cases. However, it can be expected that a larger training dataset composed of more such cases might help to reduce this kind of error. Finally, it should be noted that we adapted an off-the-shelf conditional generative adversarial neural network architecture for this study (10); however, the use of a more optimized model (23) or an alternative architecture (eg, Fast–region-based convolutional neural network, or Fast-RCNN; 24) may increase performance.
In summary, our study showed that automatic scan range delimitation in chest CT using a conditional generative adversarial neural network was feasible and showed a performance comparable to that of two expert radiologists in consensus. Because software-based scan range delimitation led to shorter scan ranges compared with radiographers’ scan range delimitation, the software described in our study could enable dose reduction for chest CT in clinical routine.
Acknowledgments
Acknowledgment:
We are grateful to NVIDIA for the donation of the NVIDIA Titan V via the Academic GPU Grant Program.
Footnotes
Disclosures of Conflicts of Interest: A.D. Activities related to the present article: disclosed no relevant relationships. Activities not related to the present article: institution received grant from NVIDIA (graphics card used in this project was part of the "GPU Grant Program" from NVIDIA). The proposed project was and is in no way related to the study. NVIDIA had and has no influence on any part of the study. Other relationships: disclosed no relevant relationships. M.S.K. disclosed no relevant relationships. M.C.S. disclosed no relevant relationships. N.G. disclosed no relevant relationships. L.U. Activities related to the present article: disclosed no relevant relationships. Activities not related to the present article: institution received grant from Siemens Healthineers and German Cancer Foundation; author received payment for lectures from Bayer Healthcare and Siemens Healthineers. Other relationships: disclosed no relevant relationships. K.N. disclosed no relevant relationships.
References
- 1.Computed tomography (CT) exams (indicator). Health at a Glance 2020. OECD Eref. http://data.oecd.org/healthcare/computed-tomography-ct-exams.htm. Published 2020. Accessed December 5, 2020.
- 2.Wiest PW, Locken JA, Heintz PH, Mettler FA Jr. CT scanning: a major source of radiation exposure. Semin Ultrasound CT MR 2002;23(5):402–410. [DOI] [PubMed] [Google Scholar]
- 3.Cohen SL, Ward TJ, Makhnevich A, Richardson S, Cham MD. Retrospective analysis of 1118 outpatient chest CT scans to determine factors associated with excess scan length. Clin Imaging 2020;62(76):80. [DOI] [PMC free article] [PubMed] [Google Scholar]
- 4.Schwartz F, Stieltjes B, Szucs-Farkas Z, Euler A. Over-scanning in chest CT: Comparison of practice among six hospitals and its impact on radiation dose. Eur J Radiol 2018;102(49):54. [DOI] [PubMed] [Google Scholar]
- 5.Colevray M, Tatard-Leitman VM, Gouttard S, Douek P, Boussel L. Convolutional neural network evaluation of over-scanning in lung computed tomography. Diagn Interv Imaging 2019;100(3):177–183. [DOI] [PubMed] [Google Scholar]
- 6.Ardila D, Kiraly AP, Bharadwaj S, et al. End-to-end lung cancer screening with three-dimensional deep learning on low-dose chest computed tomography. Nat Med 2019;25(6):954–96.[Published correction appears in Nat Med 2019;25(8):1319.]. [DOI] [PubMed] [Google Scholar]
- 7.Walsh SLF, Calandriello L, Silva M, Sverzellati N. Deep learning for classifying fibrotic lung disease on high-resolution computed tomography: a case-cohort study. Lancet Respir Med 2018;6(11):837–845. [DOI] [PubMed] [Google Scholar]
- 8.Mirza M, Osindero S. Conditional Generative Adversarial Nets. arXiv:1411.1784 [cs, stat] [preprint]. https://arxiv.org/abs/1411.1784. Posted November 6, 2014. Accessed February 1, 2019. [Google Scholar]
- 9.Ronneberger O, Fischer P, Brox T. U-Net: Convolutional Networks for Biomedical Image Segmentation. arXiv:1505.04597 [cs] [preprint]. https://arxiv.org/abs/1505.04597. Posted May 18, 2015. Accessed January 17, 2019. [Google Scholar]
- 10.Wang TC, Liu MY, Zhu JY, Tao A, Kautz J, Catanzaro B. High-Resolution Image Synthesis and Semantic Manipulation with Conditional GANs. In: 2018 IEEE/CVF Conference on Computer Vision and Pattern Recognition, Salt Lake City, UT, June 18–23, 2018. Piscataway, NJ: IEEE, 2018; 8798–8807. [Google Scholar]
- 11.Paszke A, Gross S, Massa F, et al. PyTorch: An Imperative Style, High-Performance Deep Learning Library. arXiv:1912.01703 [cs, stat] [preprint]. http://arxiv.org/abs/1912.01703. Posted December 3, 2019. Accessed December 13, 2019. [Google Scholar]
- 12.Altman DG, Bland JM. Measurement in Medicine: The Analysis of Method Comparison Studies. J R Stat Soc Ser D Stat 1983;32(3):307–317. [Google Scholar]
- 13.Guberina N, Forsting M, Suntharalingam S, et al. Radiation Dose Monitoring in the Clinical Routine. Rofo 2017;189(4):356–360. [DOI] [PubMed] [Google Scholar]
- 14.Little MP, Lim H, Friesen MC, et al. Assessment of thyroid cancer risk associated with radiation dose from personal diagnostic examinations in a cohort study of US radiologic technologists, followed 1983-2014. BMJ Open 2018;8(5):e021536. [DOI] [PMC free article] [PubMed] [Google Scholar]
- 15.Du SS, Wang Y, Zhai X, Balakrishnan S, Salakhutdinov R, Singh A. How Many Samples are Needed to Estimate a Convolutional or Recurrent Neural Network?. arXiv:1805.07883 [cs, stat] [preprint]. http://arxiv.org/abs/1805.07883. Posted May 21, 2018. Accessed January 21, 2021. [Google Scholar]
- 16.Sejnowski TJ. The unreasonable effectiveness of deep learning in artificial intelligence. Proc Natl Acad Sci U S A 2020;117(48):30033–30038. [DOI] [PMC free article] [PubMed] [Google Scholar]
- 17.Majkowska A, Mittal S, Steiner DF, et al. Chest Radiograph Interpretation with Deep Learning Models: Assessment with Radiologist-adjudicated Reference Standards and Population-adjusted Evaluation. Radiology 2020;294(2):421–431. [DOI] [PubMed] [Google Scholar]
- 18.Schuirmann DJ. A comparison of the two one-sided tests procedure and the power approach for assessing the equivalence of average bioavailability. J Pharmacokinet Biopharm 1987;15(6):657–680. [DOI] [PubMed] [Google Scholar]
- 19.Lakens D. Equivalence Tests: A Practical Primer for t Tests, Correlations, and Meta-Analyses. Soc Psychol Personal Sci 2017;8(4):355–362. [DOI] [PMC free article] [PubMed] [Google Scholar]
- 20.Huo D, Kiehn M, Scherzinger A. Investigation of Low-Dose CT Lung Cancer Screening Scan "Over-Range" Issue Using Machine Learning Methods. J Digit Imaging 2019;32(6):931–938. [DOI] [PMC free article] [PubMed] [Google Scholar]
- 21.Zhang W, Mantlic F, Zhou SK. Automatic landmark detection and scan range delimitation for topogram images using hierarchical network. In: Dawant BM, Haynor DR, eds.Proceedings of SPIE: medical imaging 2010—image processing.Vol 7623.Bellingham, Wash:International Society for Optics and Photonics,2010;762311. [Google Scholar]
- 22.Rehani MM, Yang K, Melick ER, et al. Patients undergoing recurrent CT scans: assessing the magnitude. Eur Radiol 2020;30(4):1828–1836. [DOI] [PubMed] [Google Scholar]
- 23.Park T, Liu MY, Wang TC, Zhu JY. Semantic Image Synthesis with Spatially-Adaptive Normalization. arXiv:1903.07291 [cs] [preprint]. http://arxiv.org/abs/1903.07291. Posted March 18, 2019. Accessed May 28, 2020. [Google Scholar]
- 24.Ren S, He K, Girshick R, Sun J. Faster R-CNN: Towards Real-Time Object Detection with Region Proposal Networks. IEEE Trans Pattern Anal Mach Intell 2017;39(6):1137–1149. [DOI] [PubMed] [Google Scholar]
- 25.2007 recommendations of the International Commission on Radiological Protection. ICRP publication 103. Ann ICRP 2007;37:1–332. [DOI] [PubMed] [Google Scholar]


