

Abstract
We develop a significance test that determines whether the component of uncertainty due to the finite number of stepped mode-stirring samples or the component due to the lack of spatial uniformity dominates for a particular chamber set-up and stirring sequence, as well as expressions for uncertainty for both cases. The significance test is illustrated with a measurement example comparing unloaded and loaded chambers for the measurement of a large-form-factor machine-to-machine device transmitting the W-CDMA protocol. Based on this example, we illustrate a method that allows users to estimate the minimum number of stepped mode-stirring samples needed to ensure that the component of uncertainty due to spatial uniformity dominates for a given chamber set-up, allowing use of a simplified expression for uncertainty.
Index Terms—: measurement uncertainty, over-the-air testing, reverberation chamber, wireless system
I. Introduction
We apply the significance test procedure outlined in the Guide to Uncertainty in Measurement [1] to determine which of two different equations may be used for finding the random, reverberation-chamber-specific component of uncertainty in an estimate of total radiated power (TRP). One equation is applied when the uncertainties related to the finite number of mode-stirring samples and lack of spatial uniformity are comparable, as may be the case for unloaded and lightly loaded chamber configurations. Such configurations are commonly used for electromagnetic susceptibility and emissions measurements, as documented in IEC 61000-4-21 [2]. These tests have been developed with a focus on presenting a known field to the device under test (DUT) (see also [3]), measuring radiated emissions, and/or characterizing antenna parameters such as efficiency or reflection coefficient. These tests are typically performed with continuous-wave signals.
The second equation is applied when the uncertainty due to lack of spatial uniformity dominates, as is common in loaded chambers used for wireless test. Such tests typically involve the reception and demodulation of digitally modulated communication signals, termed “over-the-air” (OTA) tests by the wireless community [5, 6]. In addition to total radiated power (TRP) for modulated signals, other parameters of interest include receiver sensitivity (known as total isotropic sensitivity (TIS) or total received sensitivity (TRS)), bit-error rate, and data throughput [7–12].
These latter metrics require that the channel conditions presented to the DUT are similar to those for which the receiver was designed, allowing verification that the receiver will operate as expected in a realistic channel. This may require broadening the coherence bandwidth (the range over which frequency components of the received signal are significantly correlated) of the channel presented by the reverberation chamber to the wireless device under test [13–15]. The coherence bandwidth for a given chamber set-up is often broadened by loading the chamber with RF absorbing material. Large-form-factor machine-to-machine (M2M) devices made of lossy materials such as plastics or foam may also increase chamber loading [16–18].
Loading has the effect of reducing the amplitude and phase variation of the channel presented to the DUT, which better replicates the channel in which many receivers were designed to operate. However, loading also reduces the mode density in the chamber, hence, reducing the number of uncorrelated measurement samples for a given set-up. Loading also reduces the spatial uniformity of the power density within the chamber.
Both the reduction in the number of uncorrelated samples and the reduction of the spatial uniformity in the chamber may affect the uncertainty in an estimate of total radiated power or other power-based quantities of interest. For a reverberation chamber set-up providing ideal, randomly distributed fields (e.g., those with a large number of modes and mode-stirring mechanisms available for the measurement), the uncertainty ideally decreases by , where N is the number of uncorrelated samples [19]. In this “ergodic-mode” case [20], the uncorrelated stirring samples acquired by various stirring mechanisms including antenna, mechanical paddle, frequency, polarization stirring, contribute equally to the uncertainty and may be interchanged for the calculation of uncertainty.
However, because loading increases correlation between samples, a stirring sequence that provides a sufficient number of samples to meet a given uncertainty threshold in an unloaded chamber may not provide enough samples under loaded conditions. As discussed in [3, 21], for this case, mode-stirring samples based on an antenna’s location within the chamber (e.g., antenna stirring for antennas whose size is negligible relative to the chamber size) and those based on other stirring mechanisms may contribute in different ways to uncertainty. In [3, 21], analytic expressions were developed for finding the uncertainty as a function of the average K factor (the ratio of stirred energy to unstirred energy for a given chamber set-up) and the number of samples given known levels of correlation.
The present work has a different focus: When the unstirred energy in “non-ergodic” modes contributes significantly to the estimate of the quantity of interest, uncertainty in the estimate of that quantity due to lack of spatial uniformity may dominate. In this case, it may be possible to utilize a simplified expression for uncertainty.
For the wireless community, the overall increase in uncertainty due to loading is a necessary trade-off for the measurement of modulated signals. While it is not necessary to load the chamber for TRP measurements, it is often done for expediency to avoid the necessity of two chamber calibration measurements.
Much of the prior work on uncertainty in reverberation-chamber measurements of modulated-signal wireless devices has focused on how specific non-idealities in the set-up affect the spatial uniformity itself. Such work includes the study of a non-zero K factor [3, 15, 21–23], the related issue of number of uncorrelated samples [24–29], and antenna polarization imbalance and the differences between multiple receive antennas [3, 15, 30]. In [31], the variability of the average received power was derived from an analytic model of the modal structure in the chamber for unloaded and loaded conditions under CW excitation. The work here augments these studies by assessing the relative importance of the uncertainty due to the finite number of stepped mode-stirring samples and the lack of spatial uniformity. This is especially important in experiment design for modulated-signal measurements of power-based metrics under conditions where the chamber is loaded with RF absorbing material.
In Section II, we provide an expression for TRP that is consistent with the over-the-air test methodology that is being developed by industry [5, 6]. The expression, derived from flow-graph models in Appendix A, takes into account impedance mismatch between the antennas and the chamber, and the antenna efficiencies. Formulas for de-embedding connecting cables are provided in Appendix B. Our methods are based on “stepped mode-stirring” with samples collected under static, stepped conditions.
In Section III, we derive general expressions for the components of uncertainty due to the limited number of stepped mode-stirring samples and lack of spatial uniformity. A significance test is developed that accounts for the combined effect of these two components. Section IV provides an example where the significance test is applied to measured data for a lossy, large-form-factor M2M wireless device. We compute uncertainty for unloaded and loaded cases, illustrating that, for this set-up, even though there is a significant increase in uncertainty for the loaded case, the total uncertainty does not exceed common thresholds. Finally, we provide an example of the use of the significance test in determining the minimum number of stepped mode-stirring samples required to ensure that utilization of the expression for uncertainty due to lack of spatial uniformity is valid for a given chamber set-up.
While the present work focuses on uncertainty in TRP measurements for cellular wireless devices, the technique for finding the relative significance of various components of uncertainty can be extended to other quantities of interest and other types of wireless devices in a straightforward way.
II. Estimation of Total Radiated Power from Measurement
A. Chamber Configuration
Figure 1 shows a representative configuration for a total radiated power measurement in a reverberation chamber consisting of (a) the DUT measurement and (b) the measurement of the chamber’s reference power transfer function (the “reference measurement”). The reference measurement estimates the loss in the chamber set-up. In Fig. 1, a metallic paddle rotates and stops at various angles where each mode-stirring sample is acquired by the measurement (receive) antenna. The mechanical paddle randomizes the fields by changing the boundary conditions within the chamber. In Fig. 1(a) power samples are measured at each mode-stirring step. Other types of mode stirring could be used [3, 19, 28], including platform stirring, where the DUT is physically moved within the chamber, and polarization stirring, where measurement antennas having different polarizations are utilized.
Fig. 1:

Typical reverberation chamber set-up for measuring radiated power for a wireless cellular device under test. In (a), a base station emulator ensures that the DUT transmits at full power and may also be used to measure the received power. In (b), a VNA connected at the reference planes performs a reference measurement that compensates for the loss in the chamber set-up.
The power samples for the DUT measurement are acquired with a base-station emulator, spectrum analyzer, or other vector receiver. Sampling and averaging the received power from different mode-stirring positions yields an estimate of the total average received power, to within some uncertainty.
For test of a wireless device, the reference measurement is often carried out with a vector network analyzer that acquires S parameter data as a function of frequency over the same stepped mode-stirring sequence as was used for the DUT measurement. These samples are also averaged over the stepped mode-stirring position. Additional averaging is often carried out over the occupied bandwidth of the signal to improve the estimate of the chamber set-up’s transfer function.
To further improve the estimate of the chamber’s reference power transfer function in the presence of non-uniformly distributed fields within the chamber, reference measurements are typically repeated at various locations within the chamber [2, 3] and the mean of these measurements is then used. The standard deviation of these measurements may be used to estimate the component of uncertainty due to lack of spatial uniformity of the fields.
In the following, the same measurement antenna and chamber configuration are utilized for the DUT and reference measurements. RF absorbing objects, including DUTs, must be in place in the chamber during the reference measurement so that this loss will be calibrated out. Procedures for de-embedding of additional cables and adapters not used in the reference measurements and impedance mismatch correction are described in the Appendix.
B. “Within” and “Between” Measurement Samples
We next develop an expression for TRP from stepped mode-stirring samples that occur “within” a given stepped mode-stirring sequence and those that occur “between” antenna locations in the chamber. The within measurements include the various stirring mechanisms such as paddle, antenna position, polarization, or source stirring. They are used to determine the uncertainty due to the finite number of stepped mode-stirring samples.
The between measurements consist of multiple, independent realizations of the mode-stirring sequence carried out at different locations within the chamber. They are used to form an estimate of the reference power transfer function and spatial uniformity for a particular chamber configuration. These locations are typically chosen to cover the working volume of the chamber set-up. Note that the “chamber configuration” includes a given set of antennas and connecting cables, a repeatable stepped stirring sequence, and fixed locations for the absorbing objects within the chamber.
We use notation that allows us to readily identify the relevant components of uncertainty. Specifically, we define:
NW “within” samples of a given stirring sequence, where . Each element wi consists of a single measurement at the ith stepped mode-stirring position.
NB “between” reference- or DUT-antenna locations . Each element bj corresponds to a different placement of the reference or DUT antenna during a measurement. In the present work, the antenna locations must be spatially uncorrelated.
In the following, we assume that the working volume of the chamber set-up has been chosen to minimize factors such as antenna placement near metallic surfaces [32] and antenna placement near absorbing objects [16–18]. Without loss of generality, we also assume that the chamber configuration (including wall loss, loading and antenna type) will provide a sufficient number of uncorrelated samples to achieve a desired level of uncertainty [24–29] and that uncorrelated samples are used. (Correlated samples can be used if a model is available [3, 21] that accounts for the increased uncertainty.) We consider only uncorrelated samples in the development below. Finally, we assume that the stirring sequence utilizes stepped-mode stirring so that Doppler shift and other effects introduced by continuous mode stirring may be neglected. We then focus on determining the TRP and the uncertainties related to the number of mode-stirring samples and spatial uniformity.
C. Total Radiated Power from the DUT
The objective is to estimate PTRP, the total power radiated by the DUT in free space, and its associated uncertainty from measurement. We define PMeas as the average power measured by the receiver at the reference plane indicated in Fig. 1(a) over the occupied bandwidth of the modulated signal. It is typically necessary to average this measurement over many transmitted symbols or frames to obtain a valid estimate. A flow graph model for this measurement is given in Appendix A. Based on this model, the ensemble average over all NW mode-stirring positions and NB antenna locations may be given by
| (1) |
where 〈GDUT〉 represents the power transfer function of the chamber for the DUT measurement, ηM is the efficiency of the measurement antenna, and ΓRX is the reflection coefficient of the base-station emulator or spectrum analyzer receiver assembly (including cable, if used). The term ΓM corresponds to the free-space reflection coefficient of the measurement antenna as defined in Appendix A. We define 〈GDUT〉 as a gain so that a reduction in power is denoted with a decreasing value of 〈GDUT〉.
The chamber gain for the DUT measurement 〈GDUT〉 is often estimated from the chamber reference measurement 〈GR〉. This reference power transfer function may be estimated from S parameter measurements as
| (2) |
where ensemble averages have been carried out at NF frequencies with NW stepped mode-stirring samples conducted at NB antenna locations for reference measurements. Refer to Appendix A for a detailed derivation of this expression. Note that some derivations refer to the product ηX (1 − |ΓX|2) as “total efficiency.” Expressions for choices of reference plane other than those shown in Fig. 1(b) are derived in Appendix B.
Typically, the DUT antenna that excites 〈GDUT〉 will not be identical to the reference antenna that excites 〈GR〉. This means that the ratio of unstirred energy to stirred energy (the K factor) could be different for the reference and DUT measurements. This, in turn, could result in different correlations and uncertainties. To minimize this effect, current practice is to select a reference antenna that produces a K factor that is similar to that of the DUT. For example, omnidirectional reference antennas are often used to estimate chamber gain 〈GR〉 for cellular device testing.
Substituting (2) into (1) yields the total radiated power of the DUT from measurement as
| (3) |
Or, in terms of measured quantities PMeas and S21,Ref,
| (4) |
The DUT measurement is often made at a single location, that is, NB = 1 for this term. Equation (4) is similar to (E.1) for radiated power in [2], with corresponding to PAveRec, ηR = ηTX, and the term corresponding to the Chamber Validation Factor (CVF) in [2], although the CVF is not averaged over frequency.
The uncertainties associated with the reference measurement are typically used to estimate the DUT measurement uncertainty by assuming that the chamber conditions for the reference measurement are similar to those of the DUT measurement. This requires that the chamber loading remains in place for both the DUT and reference measurements and that the reference antenna be of a similar type to that of the DUT.
III. Uncertainty in Total Radiated Power Measurements
Standard uncertainties of the measured quantities PMeas, |S21,Ref|2, ΓM, and ΓRX can be obtained from repeat measurements in the chamber. The uncertainty in ηR may be obtained from manufacturer’s specifications. Other sources of uncertainty such as VNA calibration errors and drift would also be included in a complete error analysis [3, 18].
We next find the uncertainties associated with the number of stepped mode-stirring samples NW and the spatial uniformity assessed at NB reference antenna locations. We then demonstrate how to apply these uncertainties to a single DUT measurement. We assume independence of our uncorrelated samples, as is common practice [24–29].
A. Number of Stepped Mode-Stirring Samples and Lack of Spatial Uniformity
We denote the standard uncertainty due to the stepped mode-stirring samples by sW, because it originates within a given mode-stirring sequence. We denote the standard uncertainty due to the lack of spatial uniformity in the chamber by sB, because it originates between reference antenna locations in the chamber. For convenience, we write this uncertainty in terms of the variable GRef, with the assumption that uncertainties in the antenna efficiencies do not contribute to this component of uncertainty.
We identify sW and sB using a sum of squares (SS) approach based on the decomposition of
| (5) |
which can be written as
In particular,
| (6) |
which has NB(NW − 1) degrees of freedom. Likewise
| (7) |
with NB − 1 degrees of freedom. Note that the term NW in the numerator arises from the decomposition of the sum of squares.
To determine whether the variation in the “between” measurements is significant when compared to the variation in the “within” measurements, a significance test may be used. The outcome of the significance test allows us to determine the correct expression for the standard uncertainty to use in our estimate of the total uncertainty in the TRP measurement. As we show below, in many reverberation-chamber measurements, the “between” effect dominates.
B. Calculating Uncertainty from a Significance Test
The statistic for identifying statistically significant differences between the measurement locations is based on an F distribution, which is formed from the ratio of two variances [1]
| (8) |
with NB − 1 and NB(NW − 1) degrees of freedom. The uncertainty associated with reference measurement will be calculated in one of two ways, depending on the outcome of this test.
1). Case 1: “Between differences” are not significant
If the test is not significant, that is,
| (9) |
where is the α percentile (e.g. 95%) of the F distribution with n1 and n2 degrees of freedom, then the uncertainty squared of the reference value is given as the weighted average of sB2 and sW2
| (10a) |
| (10b) |
with NBNW − 1 degrees of freedom.
2). Case 2: “Between differences” are significant
If the test is significant, that is,
| (11) |
then the uncertainty squared in the reference value is given as
| (12) |
with NB − 1 degrees of freedom. Note that (10) may considerably underestimate when (11) applies [1].
C. Expanded Uncertainty in the DUT Measurement
By loading the chamber identically for the reference and DUT measurements, we assume that the uncertainty in a single measurement of GR will be approximately the same as that of a single measurement of PMeas. The uncertainty squared is given by
| (13) |
with the degrees of freedom corresponding to from (10b) or (12).
Note that the square root of is sometimes used in the literature as a metric to describe the uncertainty due to spatial uniformity [3, 18]. This is equivalent to uDUT if the between differences are significant.
To find the expanded uncertainty U95 corresponding to a 95 % confidence level, the coverage factor k95 is determined from the degrees of freedom corresponding to or . The number of degrees of freedom is then used to calculate the coverage factor k95 as recommended in Appendix B3 of [1]. That is, k95 = t95(υ), where t95(υ) is the two-sided 95th percentile of the Student’s t-distribution having υ degrees of freedom. Note that, depending on the number of measured samples of NB and NW, υ can be small. This would make the coverage factor larger than two. Finally, U95 is found as
| (14a) |
or
| (14b) |
The above discussion is based on analysis-of-variance techniques for Gaussian random variables. Although each individual measurement of GR or PTRP is not Gaussian distributed, the analysis is based on the frequency averaged values and, by the Central Limit Theorem, is expected to meet the model requirement approximately.
IV. Example: Uncertainty for Unloaded and Loaded Chambers
A. Measurement Set-up
The large-form-factor device was a trash compactor with wireless machine-to-machine communications capability, having a metal housing and a solar panel on top [18]. Residing below the solar panel are the communications hardware and an integrated antenna. The device is shown on the left side of Fig. 2. The chamber was loaded with six RF absorber blocks to broaden its coherence bandwidth for measurement of a wideband code-division-multiple-access (W-CDMA) signal with a bandwidth approximately equal to the chip rate of 3.84 MHz. The number of absorber blocks was determined empirically. For this experiment, the trash compactor was configured to transmit in the Personal Communications Service (PCS) frequency band of 1.85 GHz to 2.0 GHz.
Fig. 2:
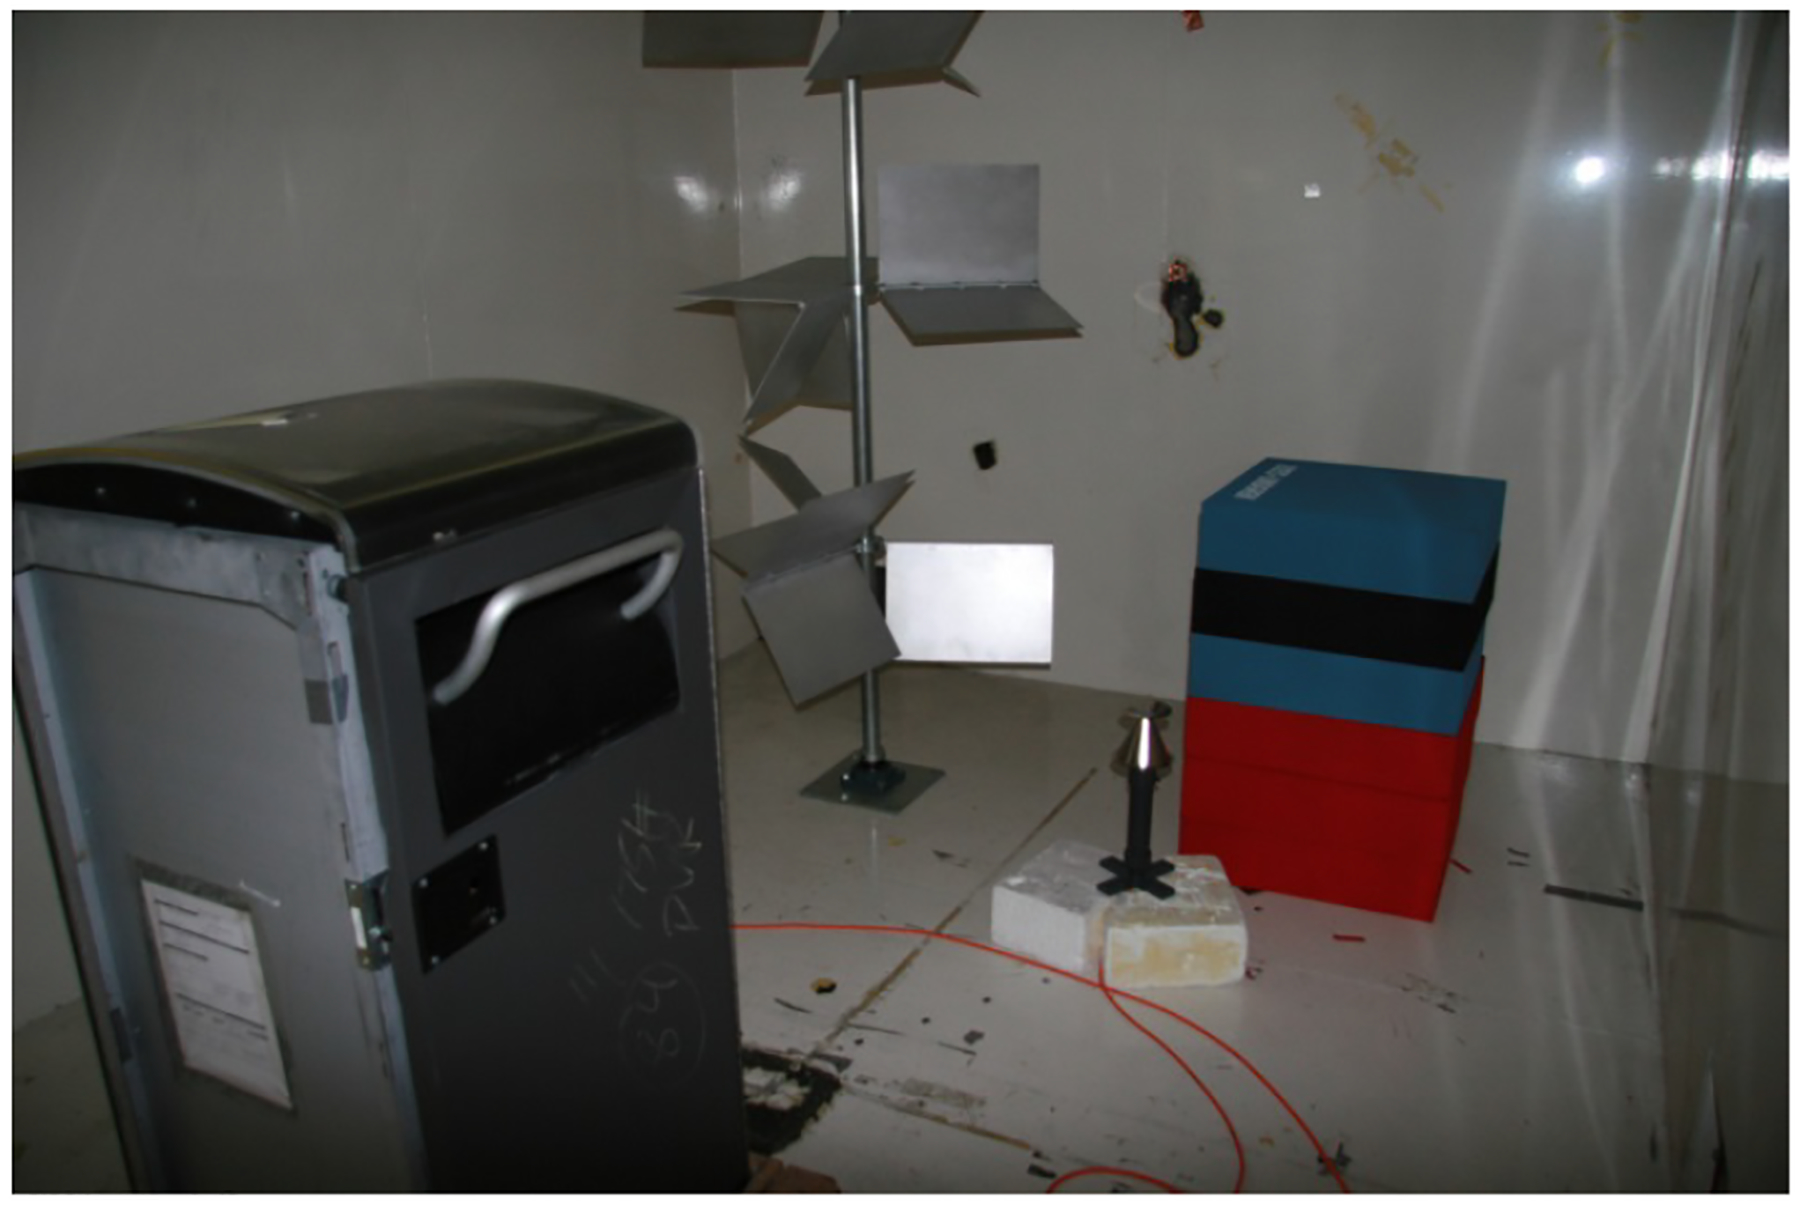
Interior of a large reverberation chamber configured to measure the total radiated power from a machine-to-machine trash compactor. Six absorber blocks load the chamber to broaden its coherence bandwidth for measurement of a W-CDMA signal. The omnidirectional reference antenna is seen near the absorber. The directional measurement antenna is out of view behind the trash compactor.
Our test set-up included a large reverberation chamber with interior dimensions 4.6 m × 3.1 m × 2.8 m having one mechanical mode stirrer that traces out a cylinder with a radius of approximately 0.50 m and a height of 2.10 m. The loaded condition, shown in Fig. 2, consisted of a stack of RF absorber (360 cm × 60 cm × 15 cm) plus the machine-to-machine trash compactor (1.28 m × 0.70 m × 0.58 m). The Q of the unloaded chamber was ~11,000 and was ~1,290 for the loaded chamber. An omnidirectional discone reference antenna and a directional, dual-ridge guide measurement antenna were used.
The VNA was set to acquire NF = 145 frequency points spaced by 140 kHz across the 150 MHz PCS band. We measured the S parameters with the calibration reference planes at the input ports to the antennas, as shown in Fig. 1(b). As discussed above, we averaged over frequency to provide a better estimate of the reference power transfer function.
For the unloaded reverberation chamber, the stirring sequence consisted of NW_unloaded = 72 uncorrelated paddle-angle samples for a single reference antenna location, where our correlation threshold was 0.5. The coherence bandwidth for this set-up was calculated to be 0.45 MHz and, for the PCS band, independent frequencies. For the loaded reverberation chamber, the stirring sequence provided NW_loaded = 43 uncorrelated samples, with a coherence bandwidth of 4.46 MHz and independent frequencies. The stirring sequence was repeated NB = 9 times by moving the reference antenna to three locations in the chamber, each spaced more than 2 λ apart from the others, and making measurements at three orthogonal antenna orientations. These nine measurements were confirmed to be uncorrelated by use of the complex cross correlation function [28].
B. Significance Test Results
To perform the significance test, we measured the S parameters at each of the nine reference antenna locations and calculated the chamber’s reference power transfer function for the unloaded and loaded cases. We then determined the degrees of freedom and calculated the within and between uncertainties from (5) – (7) above. We also computed these uncertainties normalized by the mean power, which we refer to as sW_norm and sB_norm. This quantity is sometimes referred to as the coefficient of variation. Finally, we found the test statistic for significance from (8) as the ratio of sB2 to sW2. These values appear in Table I. Recall that these values are unitless because they are based on S-parameter measurements.
Table I.
Standard uncertainty squared for unloaded and loaded reverberation chamber set-ups. The statistic for testing the existence of a between-location effect is given in the last row.
| Unloaded Chamber | Loaded Chamber | |
|---|---|---|
| sW2 | 1.84e-07 | 2.58e-08 |
| sB2 | 1.66e-06 | 5.93e-07 |
| 9.02 | 22.98 |
The relative uncertainty in an ideal, unloaded reverberation chamber with perfect mode stirring (no unstirred energy and exponentially distributed power samples), no correlation between measurements, and no measurement noise may be given by [19]
| (15) |
where the tilde represents a non-measurement-based quantity. The value of should be the same at all NB locations in the chamber, so there is no need to evaluate (15) at the NB antenna locations. This value is calculated from the number of uncorrelated paddle positions and frequency components that were averaged to obtain the value of GR at each NB antenna location.
For loaded chambers, we additionally must include the effect of the K factor in the uncertainty, derived, for example, in equation (17) of [21]. The larger the K factor, the worse the expected agreement between the uncertainty in (15) and the measured uncertainty. Because we have based our estimate of GR on uncorrelated paddle angles and frequency components, we eliminate correlations from (17) of [21] and estimate this component of uncertainty as
| (16) |
or from the formula of [3], which was largely based on heuristics:
| (17) |
In Table II, we compare the uncertainties derived from (15) – (17) to our measured uncertainty normalized by [21], that is, . The average K factors for our set-up, derived from measurement, are given in Table IV. The relative difference is given by where corresponds to the values from (15) – (17).
Table II.
Relative uncertainty and relative difference between measurement (uW, norm) and Model (with Tilde)
Table IV.
Reference power transfer function and standard uncertainties due to lack of spatial uniformity in the reference DUT measurements.
| Unloaded Chamber | Loaded Chamber | |||
|---|---|---|---|---|
| Linear | Decibels | Linear | Decibels | |
| K | 0.0724 | −11.40 | 0.337 | −4.72 |
| 7.38e-03 | −21.32 | 8.18e-04 | −30.87 | |
| uRef | 5.05e-05 | -- | 3.91e-05 | -- |
| uDUT | 1.52e-04 | -- | 1.17e-04 | -- |
| uRef,norm | 6.84e-03 | 0.030 | 0.048 | 0.20 |
| uDUT,norm | 0.020 | 0.088 | 0.14 | 0.58 |
We see that for both the unloaded and loaded chambers, is significantly lower than the value of uW, norm derived from measurement. The estimate of uncertainty from (16) is closer to uW, norm because the K factor can be significant, even for an unloaded chamber, when omnidirectional antennas are used. Finally, note that the estimate of uncertainty from (17) tends to be higher than that from (16) for both unloaded and loaded cases.
Percentiles of the F distribution for the 90 %, 95 % and 99 % confidence levels are shown in Table III, where α = (NB − 1), (7), and β = NB(NW − 1), (6).
Table III.
Percentiles of the F-Distribution for the “between” (α) and “within” (β) degrees of freedom for various confidence levels.
| Unloaded Chamber α = 8, β = 639 | Loaded Chamber α = 8, β = 378 | |
|---|---|---|
| F0.90,α,β | 1.68 | 1.69 |
| F0.95,α,β | 1.95 | 1.96 |
| F0.99,α,β | 2.54 | 2.56 |
The test statistic calculated from measurement in Table I was greater than the table values of the F-Distribution for the unloaded and loaded cases and for all confidence levels, indicating that the between effect dominates the uncertainty for both the unloaded and loaded cases. Thus, for this chamber configuration, (12) and (13) should be used to find the uncertainty in the reference and DUT measurements, respectively. The resulting values are shown in Table IV in both linear units and decibels. Table IV shows both the absolute uncertainty and the “coefficient of variation,” given by uRef,norm or uDUT,norm. For the latter, the uncertainty is normalized by . The decibel representation was found as
| (18) |
Note that, in Table IV, the uncertainties for the unloaded case are significantly smaller than for the loaded case, following the trends discussed in [16]. This indicates that, if desired, a user could reduce the uncertainty in a TRP measurement by reducing or eliminating loading. As mentioned in the Introduction, loading is often needed for measurements that require demodulation of the received signal, resulting in a necessarily higher uncertainty.
The expanded uncertainty for the reference measurement would be found from (14a), with υ = NB −1 = 8 degrees of freedom, giving k95 = t95(υ) = 2.31. Assuming that the DUT is exposed to a complete stepped mode-stirring sequence at a single antenna location, the expanded DUT uncertainty would be given by (14b).
The TRP from the trash compactor was measured for the loaded chamber configuration. The contributions to the combined uncertainty for this measurement were presented in [18] and found to be 1.36 dB for the PCS band, within the current CTIA limits of 2.2 dB. The TRP performance of the transceiver in the top panel of the trash compactor was previously measured in an anechoic chamber. The difference between the TRP measured in the reverberation chamber and that of the anechoic chamber was approximately 0.2 dB.
C. Use of the Significance Test in Experiment Design
The significance test described in Section III.B can be used to estimate the number of stepped mode-stirring samples or reference-antenna positions for which the between uncertainty dominates for a given chamber set-up. This can be useful in experiment design to find the minimum number of mode-stirring positions needed to obtain a desired level of uncertainty for a stepped mode-stirring sequence, for example. As illustrated below, each chamber set-up will provide different results.
In Figs. 3(a) and (b), we calculate the test statistic from (8) for various numbers of stepped mode-stirring samples (solid curve) and compare this to the 95th percentile of the F Distribution for the unloaded and loaded cases, respectively. The 95th percentile, , was calculated for the degrees of freedom corresponding to nine antenna locations and various numbers of stepped mode-stirring samples. This is plotted with the dashed curve.
Fig. 3:
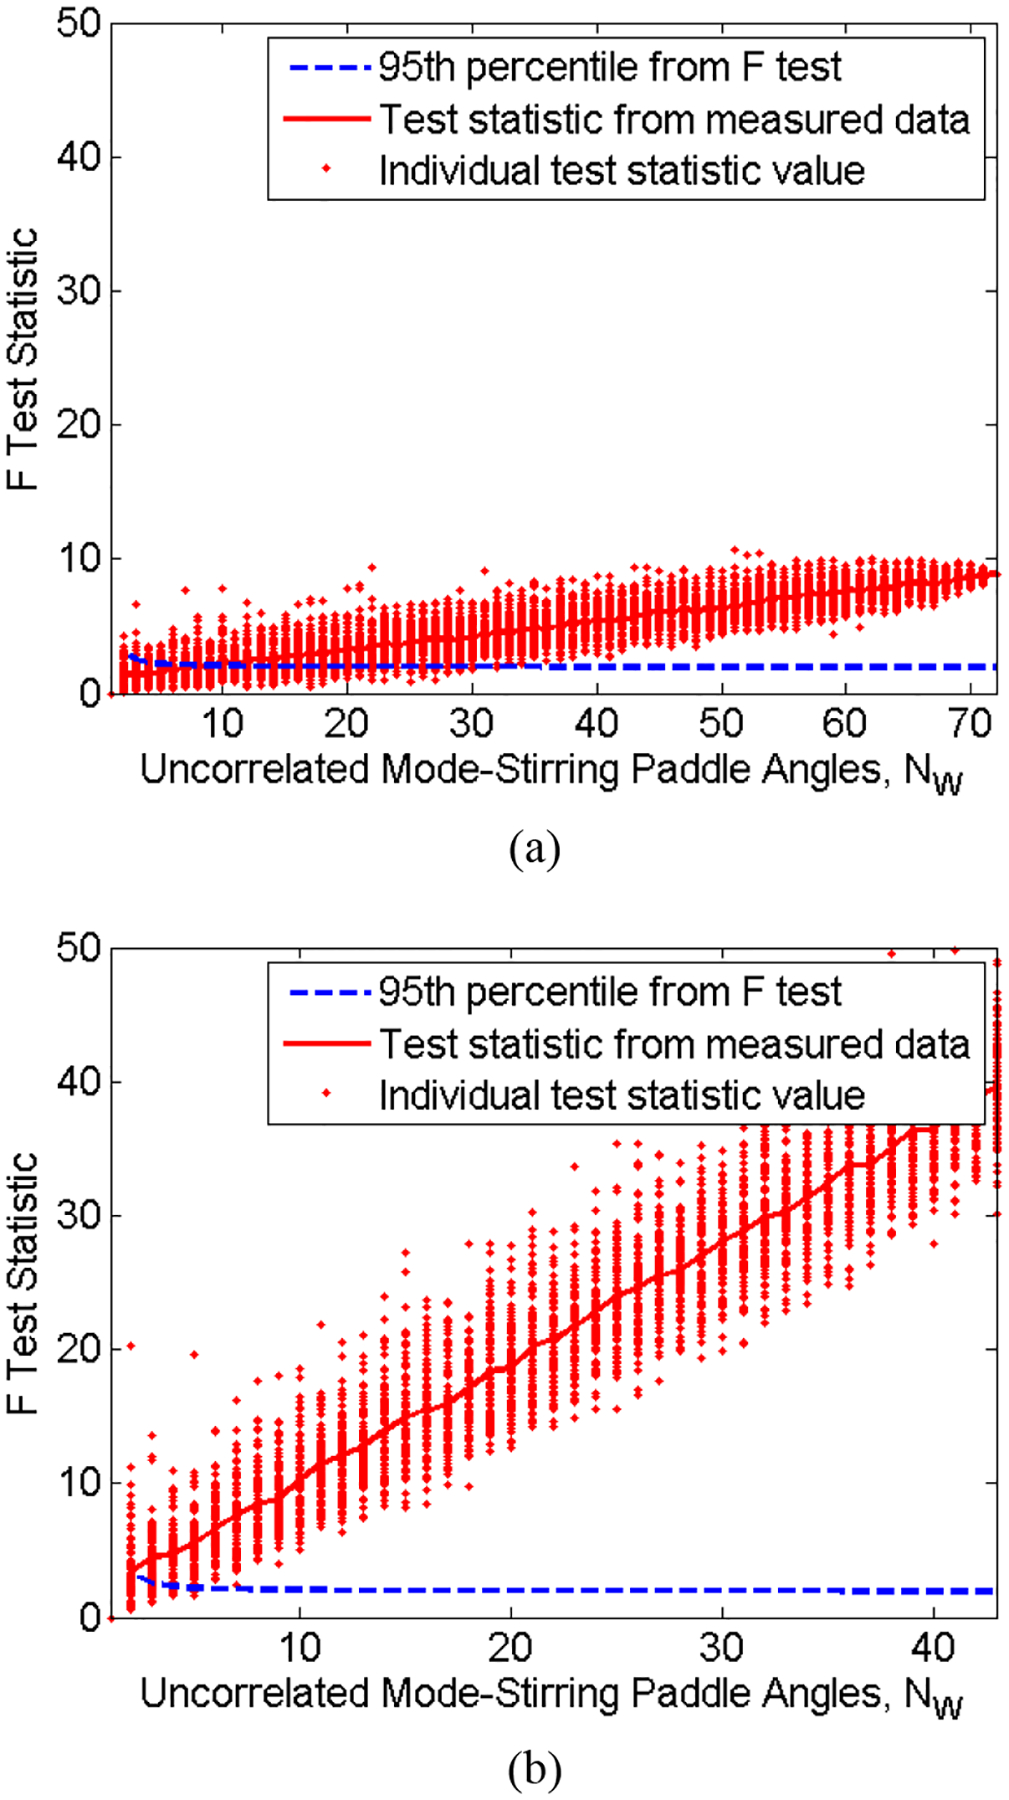
The test statistic from (8) based on an estimate of for increasing values of NW for the (a) unloaded and (b) loaded reverberation chamber set-ups described in Section IV.A. The red dots represent the test statistic for each of 100 combinations of the measured data and the solid red line corresponds to the average. The 95th percentile of the F distribution is shown by the dashed line.
To generate the test statistic curve, we averaged multiple realizations of processed data, where for each realization we randomly selected the number of stepped mode-stirring samples from our set of measured data. This approach smooths the test statistic for the reverberation chamber set-up that we used. The dot symbols in Figs. 3(a) and 3(b) represent each individual realization.
As expected, for small numbers of stepped mode-stirring samples, the within effect is more pronounced, shown where the solid curve falls below the F Distribution 95th percentile values. Because the unloaded chamber provides a high level of spatial uniformity and a wider range of |S21,Ref| values, the uncertainty due to a limited number of stepped mode-stirring samples is more significant for the unloaded case than for the loaded case. In fact, if fewer than 30 paddle angles were used, it could be concluded that the within effect dominates. Conversely, for the loaded case, the between effect dominates even for very few within samples. This agrees with results from Table I, where we see that the between uncertainty is approximately an order of magnitude higher than the within uncertainty for the loaded case.
We have plotted the same metrics in Figs. 4(a) and (b). However, in Fig. 4, we study the effect of the number of antenna locations NB on the test statistic. When all of the 100 combinations are considered, the solid line illustrates that the between uncertainty dominates for values of NB and the use of (7) is indicated for finding the measurement uncertainty in the reference measurement. However, if the metric is formed from fewer than six (unloaded) or four (loaded) antenna locations, the individual measurements show it is possible to conclude that the within effect dominates. These examples illustrate that it is prudent to study multiple combinations of measured data in the design of a reverberation chamber measurement if use of (7) is desired to assess the random component of uncertainty.
Fig. 4:
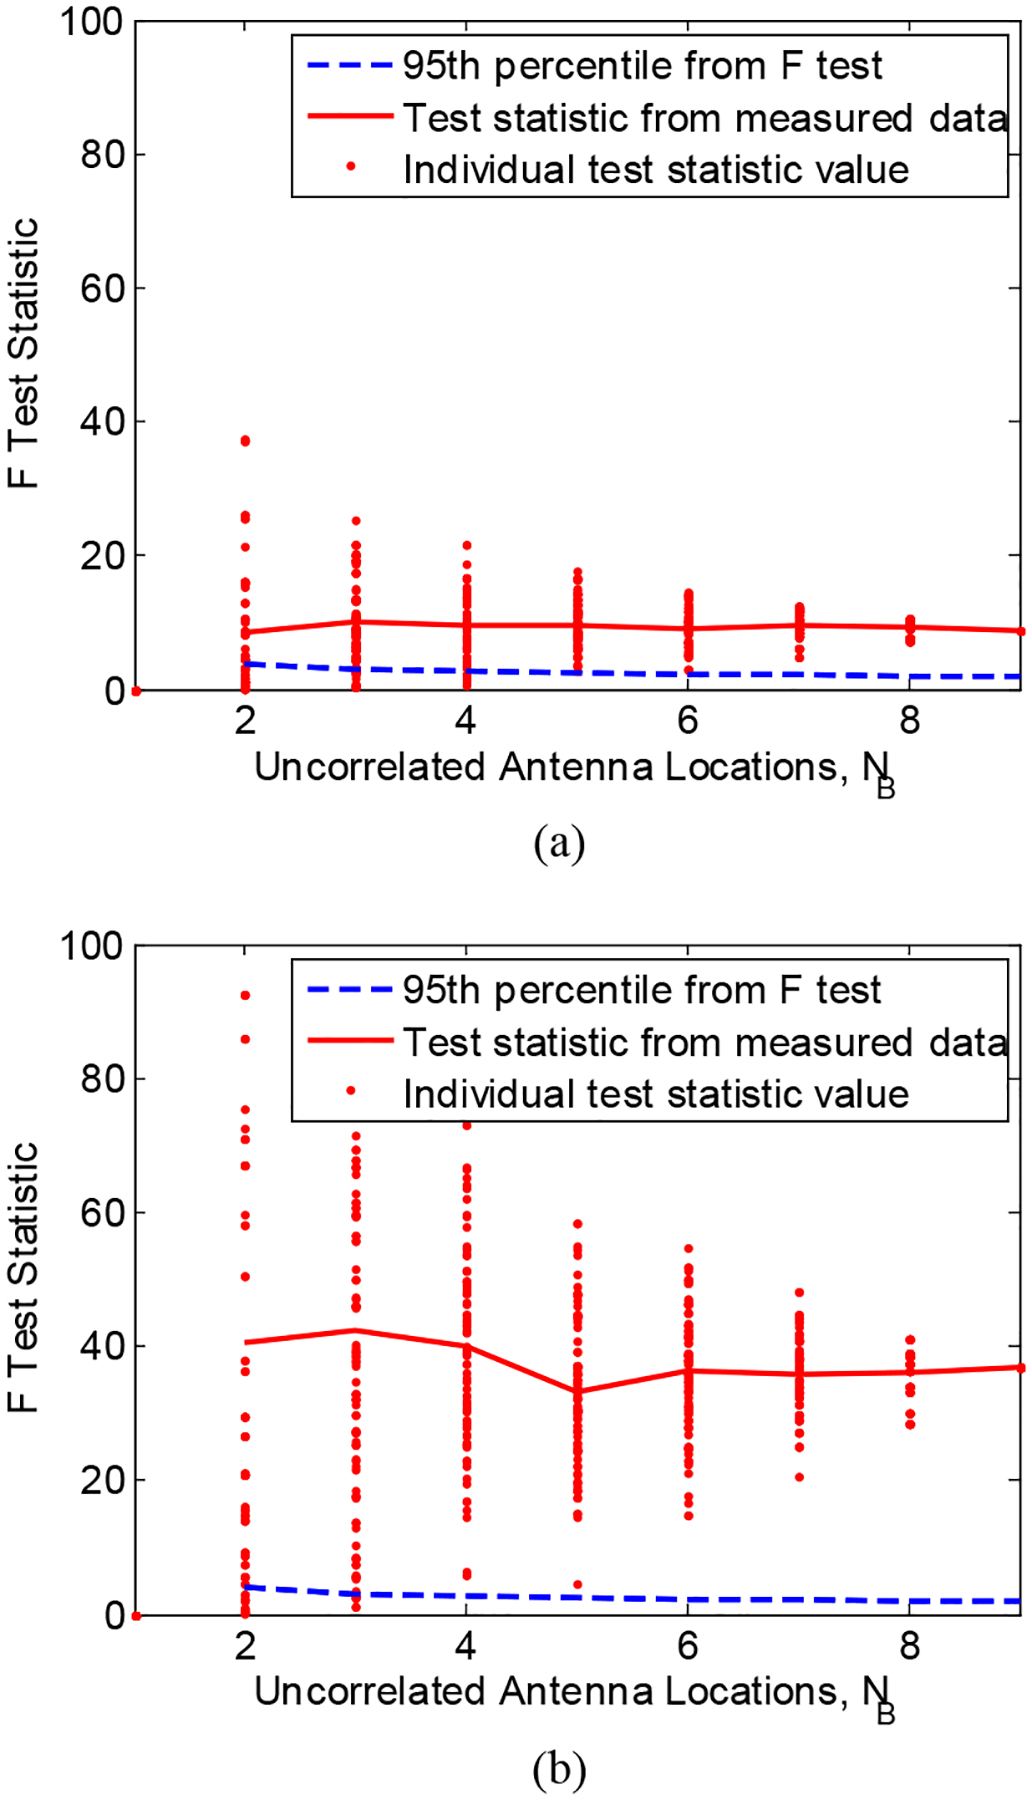
The test statistic from (8) based on an estimate of for increasing values of NB for the (a) unloaded and (b) loaded reverberation chamber set-ups described in Section IV.A. The red dots represent the test statistic for each of 100 combinations of the measured data and the solid red line corresponds to the average. The 95th percentile of the F Distribution is shown by the dashed line.
V. Summary and Conclusion
We presented expressions for determining the total radiated power and the related the random component of uncertainty from measurements made in reverberation chambers. Our expressions were derived from fundamental wave parameters by use of flow-graph models. The flow-graph models were extended to allow de-embedding of cable assemblies in the measurement set-up. We then presented a significance test to determine the correct form of uncertainty based on the number of stepped mode-stirring samples and the lack of spatial uniformity in a given chamber set-up.
The significance test was used to determine the correct expression for uncertainty in an estimate of a chamber’s reference power transfer function for an unloaded chamber set-up and a heavily loaded set-up. The loaded set-up was configured to measure the TRP of a large-form-factor M2M device transmitting a W-CDMA signal in the PCS band. Finally, we demonstrated use of the significance test in experiment design to ensure that the simple expression for uncertainty due to lack of spatial uniformity may be used. For this, we determined the number of uncorrelated, stepped, mode-stirring measurements required to form a mode-stirring sequence for a given set-up.
For the chamber set-up we tested, the uncertainty due to lack of spatial uniformity clearly dominated over the uncertainty due to limited number of stepped mode-stirring samples. However, this may not always be the case. For example, when the chamber configuration we studied was not heavily loaded, the uncertainty due to a limited number of stepped mode-stirring samples was on the order of that due to lack of spatial uniformity, as shown in Fig. 3(a) for NW less than ~30. As well, when the reference power transfer function was found for only a few antenna locations, the user could incorrectly draw the conclusion that the uncertainty due to the limited number of stepped mode-stirring samples was on the order of the uncertainty due to lack of spatial uniformity. Test procedures could be developed that incorporate standardized environments for wireless-device test, as was done in [2] for electromagnetic compatibility testing, but to date, such standards do not exist.
Future work will incorporate expressions for uncertainty involving correlated samples, expand the present work to continuous mode stirring, and study the impact of the different radiation characteristics of the reference and DUT antennas on uncertainty.
Acknowledgment
Many useful technical discussions with NIST colleagues include those with Paul Hale, Jeffrey Jargon, John Ladbury, and William Young, as well as past NIST researchers Dr. Ryan Pirkl, University of Texas Applied Research Lab, and Ansgar Kirk, Institute of Electrical Engineering and Measurement Technology, Leibniz Universität Hannover, Germany. CTIA technical experts provided the impetus for this work, including Michael Foegelle and Edwin Mendivil of ETS-Lindgren, Christian Lötbäck Patané and John Kvarnstrand of Bluetest, AB, David Sánchez-Hernández of EMITE, and Scott Prather of AT&T Wireless. The authors are grateful to BigBelly Solar for the use of the trash compactor.
Appendix A: Flow-Graph Models for Reverberation-Chamber Measurements
Figure A.1(a) shows a flow-graph representation of a generic reverberation-chamber measurement, where bg represents the available source power of the VNA for the reference measurement and b2 represents the measured quantity at the reference plane. For this choice of reference plane, the diagram may be used to derive the relationship between the output and the input quantities as [33–35]
| (A.1) |
for a single stepped mode-stirring sample and ϵ represents receiver noise. Because measurements are made well above the noise floor, ϵ is neglected in the following.
Figure A.1:

(a) Flow-graph representation of a general reverberation chamber measurement set-up for a single mode-stirring sample. (b) Flow graph for estimating the chamber gain from a reference measurement. (c) The measured S21 is the cascade of S parameters of the two antennas and the chamber gain.
In (A.1), Γg and ΓRX are the reflection coefficients of the source and calibrated receiver (for example, the base-station emulator in Fig. 1(a)), respectively, and the measured S parameters include the reflection coefficients of the antennas and the effects of the antenna efficiencies ηant1 and ηant2. The wave variables in (A.1) have units of the square root of a watt, and are normalized so that the average power Px,y transmitted across a reference plane is given by with a reference impedance of 50 Ω.
Because flow-graph models are only applicable to linear, time-invariant circuits, measurements made in the reverberation chamber must be conducted so that both requirements are met. The reverberation chamber provides a linear transmission environment, however when a signal excites the chamber a finite charging time occurs before the mode structure achieves steady state. The charging time was modeled as a double exponential function in [36], and was measured in that work to be less than 25 ns for a large reverberation chamber under various loading conditions. For the reference measurement, the VNA is set to acquire the S parameters only after a delay of at least the charging time, in our case, 10 μs.
A. Model for Antenna Efficiency
As shown in Fig. A.1(b), to find the chamber’s power transfer function, , the antennas are de-embedded from an S parameter measurement of the chamber set-up (See Fig. 1(b) in the main text). We estimate the free-space efficiency ηx of each antenna x = M or R as
| (A.2) |
where
B. Model for the Reference Measurement
Assuming that reflections from the chamber back into the antennas average to zero and using the notation from Fig. A.1(c) and, we may write the S parameter representation for the reference antenna as
| (A.3) |
for the chamber as
| (A.4) |
and for the measurement antenna as
| (A.5) |
From (A.5)
and
| (A.6) |
From (A.4)
and
| (A.7) |
From (A.3)
and
| (A.8) |
With
then
| (A.9) |
Assuming the S parameter measurements of each element in (A.3) – (A.5) are independent and substituting the antenna efficiency from (A.2)
| (A.10) |
We assume that the ensemble average of the measured reflection parameters corresponds to the free-space reflection coefficient of the measurement antenna. . Then, for a single mode-stirring sample,
| (A.11) |
which leads to (3) in the main text. Note that ΓX represents the loss in the antenna and the term (1 − |ΓX|2) represents the power reflected by the antenna. Other choices of reference plane are discussed in Appendix B.
C. Model for the DUT Measurement
The flow graph of Fig. A.2 was derived from the diagram of Fig. A.1(a) for the DUT measurement. The wave variable a1,DUT corresponds to the signal emanating from the DUT’s antenna. In this diagram, we assume that the radiated power is not affected by signals that are rereflected from the chamber back into the DUT’s antenna. This may not be a valid assumption depending on the DUT’s impedance matching network. However, for the case studied here, agreement between reverberation-chamber-based and anechoic-chamber-based measurements of TRP was within the measurement uncertainty, indicating that rereflections did not significantly alter the measurement of output power.
Figure A.2:
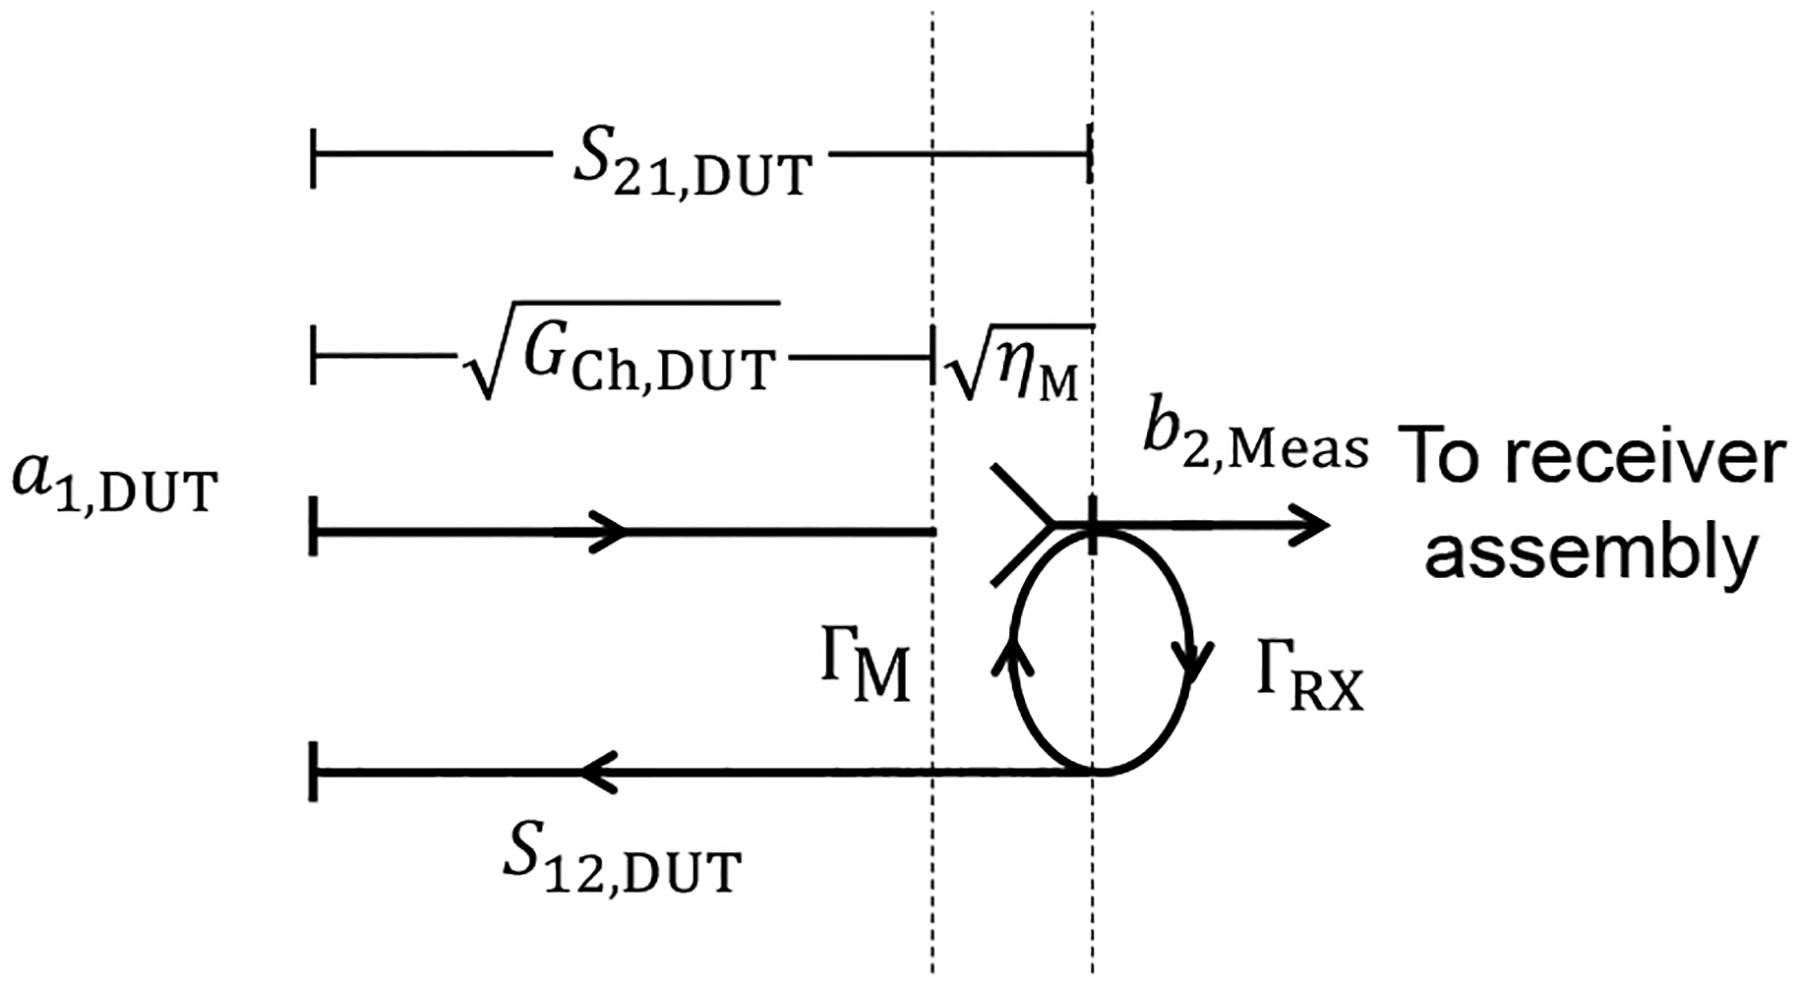
Flow-graph representation of DUT measurement shown in Fig. 1(a), where and .
From (A.1) and the flow graph in Fig. A.2, we write the measured wave variable b2,Meas at the input of the receiver assembly for a single stepped mode-stirring sample as
| (A.12) |
where S21,DUT is the linear transmission parameter of the reverberation chamber for the DUT measurement, which, for DUTs with integrated antennas, is typically not directly measureable. ΓRX is the reflection coefficient of the receiver assembly, and ΓM is the free-space reflection coefficient of the measurement antenna, as defined above.
Figure B.1:
Flow diagram representing the addition of a cable between the excitation and the reference antenna in Fig. A.1(a).
For a single mode-stirring sample, and . We rewrite (A.12) in terms of power-like quantities as
| (A.13) |
With chamber gain GDUT = S21,DUT2/ηM(1 − |ΓM|2), we have1
| (A.14) |
Substituting GCh = GR from (A.11) for GDUT in expression (A.14) and taking the ensemble average leads to the expression for TRP in (4) of the text.
Appendix B: Flow-Graph Models for De-embedding Cables and Other Components
Figures A.1 and A.2 illustrate flow diagrams for measurements where the calibration reference planes are located at the antenna port(s). As mentioned in Appendix A, for the reference measurement, the reference plane may also be located at the output of a cable and/or other components inserted between the measurement antenna and the VNA, as long as they remain in place for both the reference and DUT measurements. If it is necessary to insert additional cables and/or components for the reference or DUT measurements, procedures for de-embedding the loss and mismatch due to these additional components are described below. In the following, the term “cable” could refer to cables or other passive components such as power splitters, couplers, and switches.
Figure B.2:

Flow diagram representing the addition of a cable between the measurement antenna and the receiver in Fig. A.1(a).
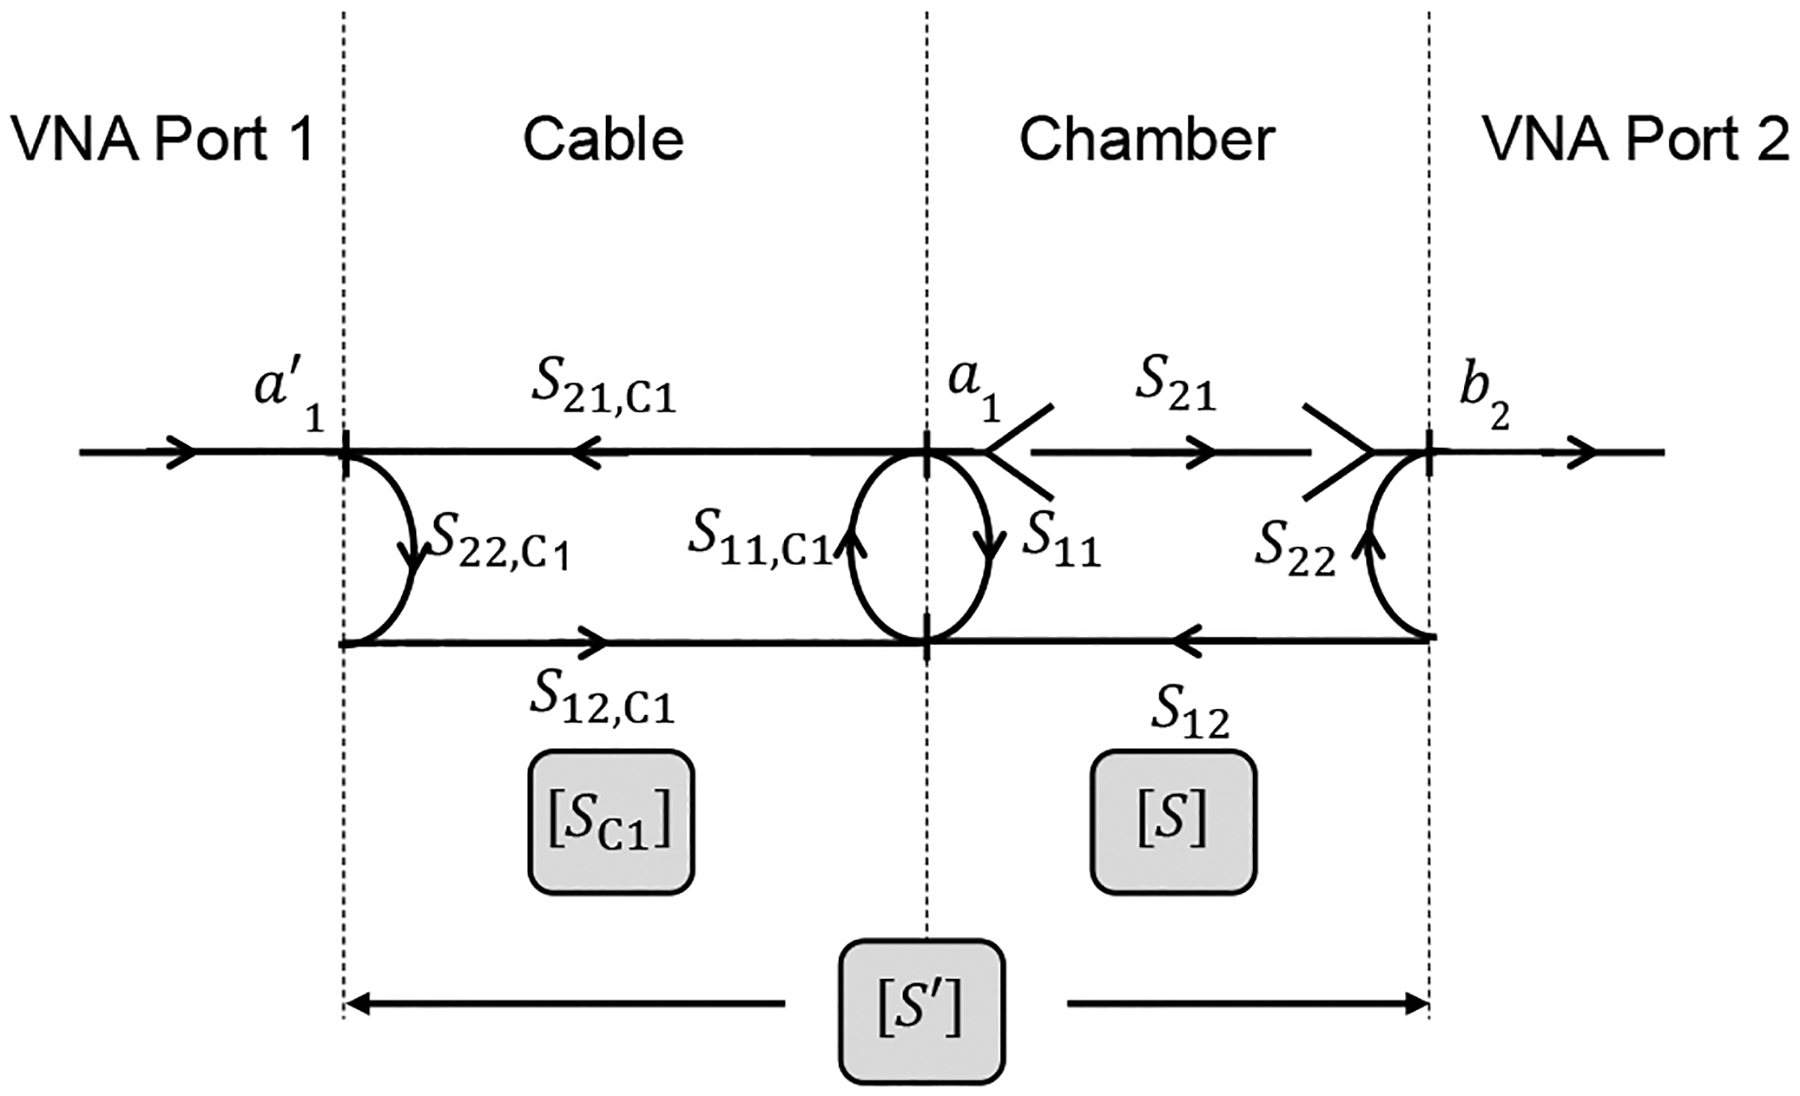
A. Cable Connected to the Transmit Antenna
A flow diagram illustrating this configuration is shown in Fig. B.1. For the reference measurement, the VNA measures [S′] and the S parameters of the cable, [SC1], while [S] is required to find the reference power transfer function. Let be the transmission matrix (see, e.g., [38]) of [S], the transmission matrix of [SC1], and the transmission matrix of [S′]. Then
| (B.1) |
To find , invert its transmission matrix, and compute
| (B.2) |
Once is converted back to S parameters, equations (3) and (4) may be used as written.
B. Cable Connected to the Receive Antenna During DUT Measurement Only
Sometimes the reference measurement is carried out at the measurement antenna reference plane (see Fig. 1(b)), and, subsequently, an additional cable is inserted between this reference plane and the receiver. For this case, the S parameters of the cable [SC2] may be measured and cascaded with those of the chamber [S] to obtain [S′]. This is represented in Fig. B.2, and may be written in terms of transmission parameters as
| (B.3) |
In this way, the chamber/cable assembly [S′] is the same for the reference and DUT measurements, and equations (3) and (4) may be used as written.
C. Cable Connected to the Measurement Antenna During Reference Measurement Only
The flow graph for this situation is the same as that shown in Fig. B.2. However, here, the S parameters of the cable [SC2] and the cascade of the chamber and cable [S′] have been measured with a VNA and we wish to remove the effects of [SC2]. This may be accomplished with transmission parameters as follows
| (B.4) |
The S parameter matrix corresponding to the chamber only is then found from and used in (3).
Footnotes
A power meter calibrated with its calibration factor Kb [37] will measure PMeas. A power meter calibrated with only its efficiency will measure PMeas (1 − |ΓM|2).
Contributor Information
Kate A. Remley, National Institute of Standards and Technology, Boulder, CO 80305 USA..
Chih-Ming Wang, National Institute of Standards and Technology, Boulder, CO 80305 USA..
Dylan F. Williams, National Institute of Standards and Technology, Boulder, CO 80305 USA..
Joop Aan Den Toorn, National Institute of Standards and Technology, Boulder, CO 80305 USA. He is with Eindhoven University of Technology, the Netherlands..
Christopher L. Holloway, National Institute of Standards and Technology, Boulder, CO 80305 USA..
References
- [1].Joint Committee for Guides in Metrology, “Evaluation of Measurement Data—Guide to the Expression of Uncertainty in Measurement,” International Bureau of Weights and Measures (BIPM): Sèvres, France, September 2008. (Available from: http://www.bipm.org/en/publications/guides/gum.html). [Google Scholar]
- [2].Joint Task Force IEC SC77B-CISPR/A, Electromagnetic Compatibility (EMC)—Part 4.21: Testing and Measurement Techniques—Reverberation Chamber Test Methods, IEC 61000-4-21, Geneva, Switzerland, August. 2003. [Google Scholar]
- [3].S Kildal P, Chen X, Orlenius C, Franzen M, and Lötbäck Patané C, “Characterization of reverberation chambers for OTA measurements of wireless devices: physical formulations of channel matrix and new uncertainty formula,” IEEE Trans. Antennas and Propagat, vol. 60, no. 8, August. 2012, pp. 3875–3891. [Google Scholar]
- [4].Crawford ML and Koepke G, “Design, evaluation, and use of a reverberation chamber for performing electromagnetic susceptibility/vulnerability measurements, NIST Technical Note 1092, April 1986.
- [5].3rd Generation Partnership Project, “Technical Specification Group Radio Access Networks; Universal Terrestrial Radio Access (UTRA) and Evolved Universal Terrestrial Radio Access (E-UTRA); Verification of radiated multi-antenna reception performance of User Equipment (UE), rel. 12, 3GPP TR 37.977 v1.3.0, November. 2013. [Google Scholar]
- [6].CTIA Certification, “Test Plan for Wireless Device Over-the-Air Performance—Method of Measurement for Radiated RF Power and Receiver Performance, Large-Form-Factor Integrated Device Addendum (in process),” December. 2014.
- [7].Orlenius C, Kildal P-S, and Poilasne G, “Measurements of total isotropic sensitivity and average fading sensitivity of CDMA phones in reverberation chamber,” IEEE AP-S Int. Symp. Dig, Washington, D.C., July. 3–8, 2005, vol. 1A, pp. 409–412. [Google Scholar]
- [8].Delangre O, De Doncker P, Horlin F, Lienard M, Degauque P, “Reverberation chamber environment for testing communication systems: applications to OFDM and SC-FDE,” Proc. 68th IEEE Vehic. Technol. Conf., Calgary, Canada, Sept. 2008, pp 1–5. [Google Scholar]
- [9].Monebhurrun V and Letertre T, “Total radiated power measurements of WiFi devices using a compact reverberation chamber,” Proc. 20th Int. Zurich Symp. EMC, 2009, pp. 65–68. [Google Scholar]
- [10].Floris SJ, Remley KA, and Holloway CL, “Bit error rate measurements in reverberation chambers using real-time vector receivers,” IEEE Ant. Wireless Prop. Lett, vol. 9, 2010, pp. 619–622. [Google Scholar]
- [11].Rudander JH, Khuda I, Kildal P-S, and Orlenius C, “Measurements of RFID tag sensitivity in reverberation chamber,” IEEE Ant. Wireless Prop. Lett, vol. 10, 2011, pp. 1345–1348. [Google Scholar]
- [12].Kildal P-S, Orlenius C, and Carlsson J, “OTA testing in multipath of antennas and wireless devices with MIMO and OFDM,” Proc. IEEE, vol. 100, no. 7, July 2012, pp. 2145–2157. [Google Scholar]
- [13].Chen X, Kildal P-S, Orlenius C, Carlsson J, “Channel sounding of loaded reverberation chamber for over-the-air testing of wireless devices - coherence bandwidth versus average mode bandwidth and delay spread”, IEEE Ant. Wireless Propagat. Lett, vol. 8, 2009, pp. 678–681. [Google Scholar]
- [14].Remley KA, Floris SJ, Shah HA, and Holloway CL, “Static and dynamic propagation-channel impairments in reverberation chambers,” IEEE Trans. Electromagnetic Compat, vol. 53, no. 3, August. 2011, pp. 589–599. [Google Scholar]
- [15].Chen X, Kildal P-S, and Lai S-H, “Estimation of average Rician K-Factor and average mode bandwidth in loaded reverberation chamber,” IEEE Antennas Wireless Propagat. Lett,” vol. 10, 2011, pp. 1437–1440. [Google Scholar]
- [16].van de Beek S, Remley KA, Holloway CL, Ladbury JM, and Leferink F, “Characterizing large-form-factor devices in a reverberation chamber,” EMC EUROPE Int. Symp. Electromagnetic Compat Dig., 2–6 Sept. 2013, pp. 375–380. [Google Scholar]
- [17].Burger WTC, Remley KA, Holloway CL, and Ladbury JM, “Proximity and antenna orientation effects for large-form-factor devices in a reverberation chamber,” IEEE Int. Electromagnetic Compat. Symp. Dig., 5–9 Aug. 2013, pp. 671–676. [Google Scholar]
- [18].Aan Den Toorn J, Remley KA, Holloway CL, Ladbury J-M, and Wang C-M, “Proximity-effect test for lossy wireless-device measurements in reverberation chambers,” IET Sci., Meas., and Technol, vol. 9, no. 5, 2015, pp. 540–546. [Google Scholar]
- [19].Kostas JG and Boverie B, “Statististical model for a mode-stirred chamber,” IEEE Trans. Electromagn. Compat, vol. 33, no. 4, November. 1991, pp. 366–370. [Google Scholar]
- [20].Arnaut LR and West PD, “Evaluation of the NPL untuned stadium reverberation chamber using mechanical and electronic stirring techniques,” NPL Report CEM 11, August. 1998. [Google Scholar]
- [21].A Remley K, J Pirkl R, A Shah H, and Wang C-M, “Uncertainty from choice of mode-stirring technique in reverberation-chamber measurements,” IEEE Trans. Electromagnetic Compat, vol. 55, no. 6, December. 2013, pp. 1022–1030. [Google Scholar]
- [22].Chen X, Kildal P-S, and Carlsson J, “Characterization and modeling of measurement uncertainty in a reverberation chamber with a rotating mode stirrer,” Proc. EMC Europe 2014, Gothenburg, Sweden, September. 1–4, 2014, pp. 296–300. [Google Scholar]
- [23].Wang C-M, Remley KA, Kirk AT, Pirkl RJ, Holloway CL, Williams DF, and Hale PD, “Parameter estimation and uncertainty evaluation in a low Rician K-Factor reverberation-chamber environment,” IEEE Trans. Electromagnetic Compat, vol. 56, no. 5, October. 2014, pp. 1002–1011. [Google Scholar]
- [24].Hallbjörner P, “A model for the number of independent samples in reverberation chambers,” Microw. Opt. Technol. Lett, vol. 33, 2002, pp 25–28. [Google Scholar]
- [25].Madsen K, Hallbjörner P, and Orlenius C, “Models for the number of independent samples in reverberation chamber measurements with mechanical, frequency, and combined stirring,” IEEE Antennas Wireless Propagat. Lett, vol. 3, 2004, pp. 48–51. [Google Scholar]
- [26].Besnier P, “Controling (sic) measurement reproducibility and uncertainty in reverberation chambers,” IEEE EMC Symp. Dig, vol. 2, 8–12 August. 2005, pp. 562–565. [Google Scholar]
- [27].Lemoine C, Besnier P, and Drissi M, “Estimating the effective sample size to select independent measurements in a reverberation chamber,” IEEE Trans. Electromagn. Compat, vol. 50, no. 2, May 2008, pp. 227–236. [Google Scholar]
- [28].Pirkl RJ, Remley KA, Lötbäck Patané C, “Reverberation chamber measurement correlation,” IEEE Trans. Electromagnetic Compat, vol. 54, no. 3, June 2012, pp. 533–545. [Google Scholar]
- [29].Chen X, “Experimental investigation of the number of independent samples and the measurement uncertainty in a reverberation chamber,” IEEE Trans. Electromagnetic Compat, vol. 55, no. 5, October. 2013, pp. 816–824. [Google Scholar]
- [30].Chen X and Kildal P-S, “Frequency-dependent effects of platform and wall antennas on measurement uncertainty in reverberation chambers.” Proc. EuCAP 2010, pp. 1–3. [Google Scholar]
- [31].Monsef F and Cozza A, “Variability and confidence intervals of the power measured in a reverberation chamber,” IEEE Trans. Electromagnetic Compat, vol. 56, no. 5, October. 2014, pp. 1238–1241. [Google Scholar]
- [32].Hill DA, “Boundary fields in reverberation chambers,” IEEE Trans. Electromagnetic Compat, vol. 47, no. 2, May 2005, pp. 281–290. [Google Scholar]
- [33].Kerns DM, and Beatty RW, Basic Theory of Waveguide Junctions and Introductory Microwave Network Analysis. Oxford: Pergamon Press, 1967. [Google Scholar]
- [34].Kerns DM, Plane-Wave Scattering-Matrix Theory of Antennas and Antenna-Antenna Interactions. Boulder, CO: National Bureau of Standards, 1981, vol. 162, National Bureau of Standards Monograph. [Google Scholar]
- [35].Williams DF, Clement TS, Hale PD, and Dienstfrey A, “Terminology for high-speed sampling-oscilloscope calibration,” 68th ARFTG Conf. Dig., Nov. 30-Dec. 1, 2006, pp. 1–6. [Google Scholar]
- [36].Holloway CL, Shah HA, Pirkl RJ, Remley KA, Hill DA, and Ladbury J, “Early time behavior in reverberation chambers and its effect on the relationships between coherence bandwidth, chamber decay time, RMS delay spread, and the chamber buildup time,” IEEE Trans. Electromagnetic Compat, vol. 54, no. 4, August. 2012, pp. 714–725. [Google Scholar]
- [37].Agilent Technologies, “Fundamentals of RF and microwave power measurements (Part 1),” Application Note 1449–1, April. 17, 2003. [Google Scholar]
- [38].Pozar DM, Microwave Engineering, Addison-Wesley: Reading, MA, 1990, p. 235. [Google Scholar]