Abstract
Protein therapeutics are vitally important clinically and commercially, with monoclonal antibody (mAb) therapeutic sales alone accounting for $115 billion in revenue for 2018.[1] In order for these therapeutics to be safe and efficacious, their protein components must maintain their high order structure (HOS), which includes retaining their three-dimensional fold and not forming aggregates. As demonstrated in the recent NISTmAb Interlaboratory nuclear magnetic resonance (NMR) Study[2], NMR spectroscopy is a robust and precise approach to address this HOS measurement need. Using the NISTmAb study data, we benchmark a procedure for automated outlier detection used to identify spectra that are not of sufficient quality for further automated analysis. When applied to a diverse collection of all 252 1H,13C gHSQC spectra from the study, a recursive version of the automated procedure performed comparably to visual analysis, and identified three outlier cases that were missed by the human analyst. In total, this method represents a distinct advance in chemometric detection of outliers due to variation in both measurement and sample.
Keywords: Nuclear Magnetic Resonance (NMR), biopharmaceuticals, chemometrics, monoclonal antibody (mAb), NISTmAb, spectral similarity metric, higher order structure
1. Introduction
1.1. Protein Therapeutics and their Higher Order Structure
Protein therapeutics are vitally important clinically and commercially, with monoclonal antibody (mAb) therapeutic sales alone accounting for $115 billion in revenue for 2018, a year-on-year increase of 11%.[1] Growth in protein therapeutics (biologics) is outpacing that of small-molecule drugs, and the development, production, and delivery of biologics presents unique challenges.[3] A typical small molecule drug such as ibuprofen can be manufactured by controlled, reproducible chemical reaction of purified components, and the resultant molecule can be characterized completely according to its fixed covalent structure (i.e. its network of chemical bonds). By contrast, a protein therapeutic is generally manufactured using living cells suspended in a culture medium with more than 50 components[4], and the expressed protein must be characterized not only according to its amino acid sequence, which defines its primary structure, but also according to a hierarchy of higher order structure (HOS).[5] HOS includes the protein’s conformational motifs over short spans of adjacent amino acids (secondary structure), the protein’s three-dimensional fold (tertiary structure), and its possible formation of complexes and aggregates of two or more proteins (quaternary structure), all of which can change with differing biomanufacturing, storage, and delivery conditions.[6] Monitoring this HOS of biologics is critical, since misfolding or aggregation can lead to loss of efficacy or harmful immunogenicity.[7]
Characterization of HOS is further complicated by post-translational modifications (PTM), which are chemical changes to the amino acids during or after protein synthesis.[8] PTMs are a natural consequence of protein expression in a living cell, and are commonly an outcome or requirement of protein function, such as glycan carbohydrate groups covalently linked to mAbs.[9] A biologic may also include intentional synthetic modifications to adjust the activity, stability, or other properties of the therapeutic,[10], [11] or to link a drug payload, which the biologic will deliver to a target.[12] PTMs can also result from unintended chemical changes such as oxidation induced during protein purification or storage.[13] A typical biologic may have dozens or hundreds of potential PTM sites; some PTMs may be essential to therapeutic activity, some PTMs alone or in combination can harm activity or cause detrimental immune responses, and many PTMs may have no observable therapeutic consequence.[14], [15] As a result of natural variations in living cells in response to growth conditions, and the many possibilities for unintended PTMs during subsequent steps such as protein purification, biologics are complex heterogeneous mixtures that vary from lot to lot, making HOS characterization both more critical and more challenging.
1.2. Spectral Fingerprinting: Characterization of Higher Order Structure by NMR
As a result of the intricate combination of chemical structure and conformation as it relates to biologic safety and efficacy, there are many stages in the biologic life cycle where monitoring HOS can be valuable, including during development, formulation design, optimization of manufacturing protocols, and quality control during production.[7] NMR spectroscopy can play a unique role in the characterization of biologics, since NMR can reveal information over the entire hierarchy of protein conformation, including amino acid sequence and PTMs, protein secondary structure, tertiary fold, and intermolecular interaction, while providing this information at atomic level resolution.
The central idea of NMR fingerprinting is simple: a change in HOS will cause a systematic change in the corresponding NMR spectra, so that observed changes in spectra can be analyzed to reveal changes in HOS. These spectral changes can be identified visually, or quantified and characterized numerically according to spectral similarity metrics. Several approaches to characterizing HOS by one-dimensional (1D) and two-dimensional (2D) NMR have been demonstrated[2], [16]–[25], with the additional advantage that NMR methods can be applied to biologics quantitatively and non-destructively, often with little or no special sample preparation, and in the presence of excipients as formulated.[18], [26], [27] In particular, 2D 1H,13C NMR has been shown to be a powerful tool to probe HOS for molecules as large as intact mAbs, even at natural isotopic abundance. [19], [28], [29] In the current work, we present a method for automated classification of nuclear magnetic resonance (NMR) spectra to enable characterization of HOS, and we employ the method to identify outliers in related collections of spectra.
2. Materials and Methods
2.1. The NISTmAb Interlaboratory NMR Study
The outlier detection method was developed and tested using data from the NISTmAb Interlaboratory NMR Study.[2] This study was an international effort between 26 organizations to evaluate the performance of 2D heteronuclear NMR as used to characterize the HOS of proteins, with the aim of supporting the use of NMR to characterize biologic therapeutics. The 450 spectra produced by the study are publicly available to support continued development and adoption of NMR as a tool for HOS characterization.[30] In the study, each participating lab measured a series of NMR spectra on two kinds of solution-state protein samples with ~98% sequence identity. Both samples were based on the NISTmAb (NIST primary sample PS-8670), an IgG1κ reference mAb.[31], [32] An overlay of representative 2D 1H,13C gHSQC (gradient-selected heteronuclear single quantum coherence)[33] spectra for the two samples is shown in Figure 1. As described in Figure 1, each study spectrum has a study identifier (ID), consisting of a unique index number followed by series of fields encoding sample and measurement details.
Figure 1.
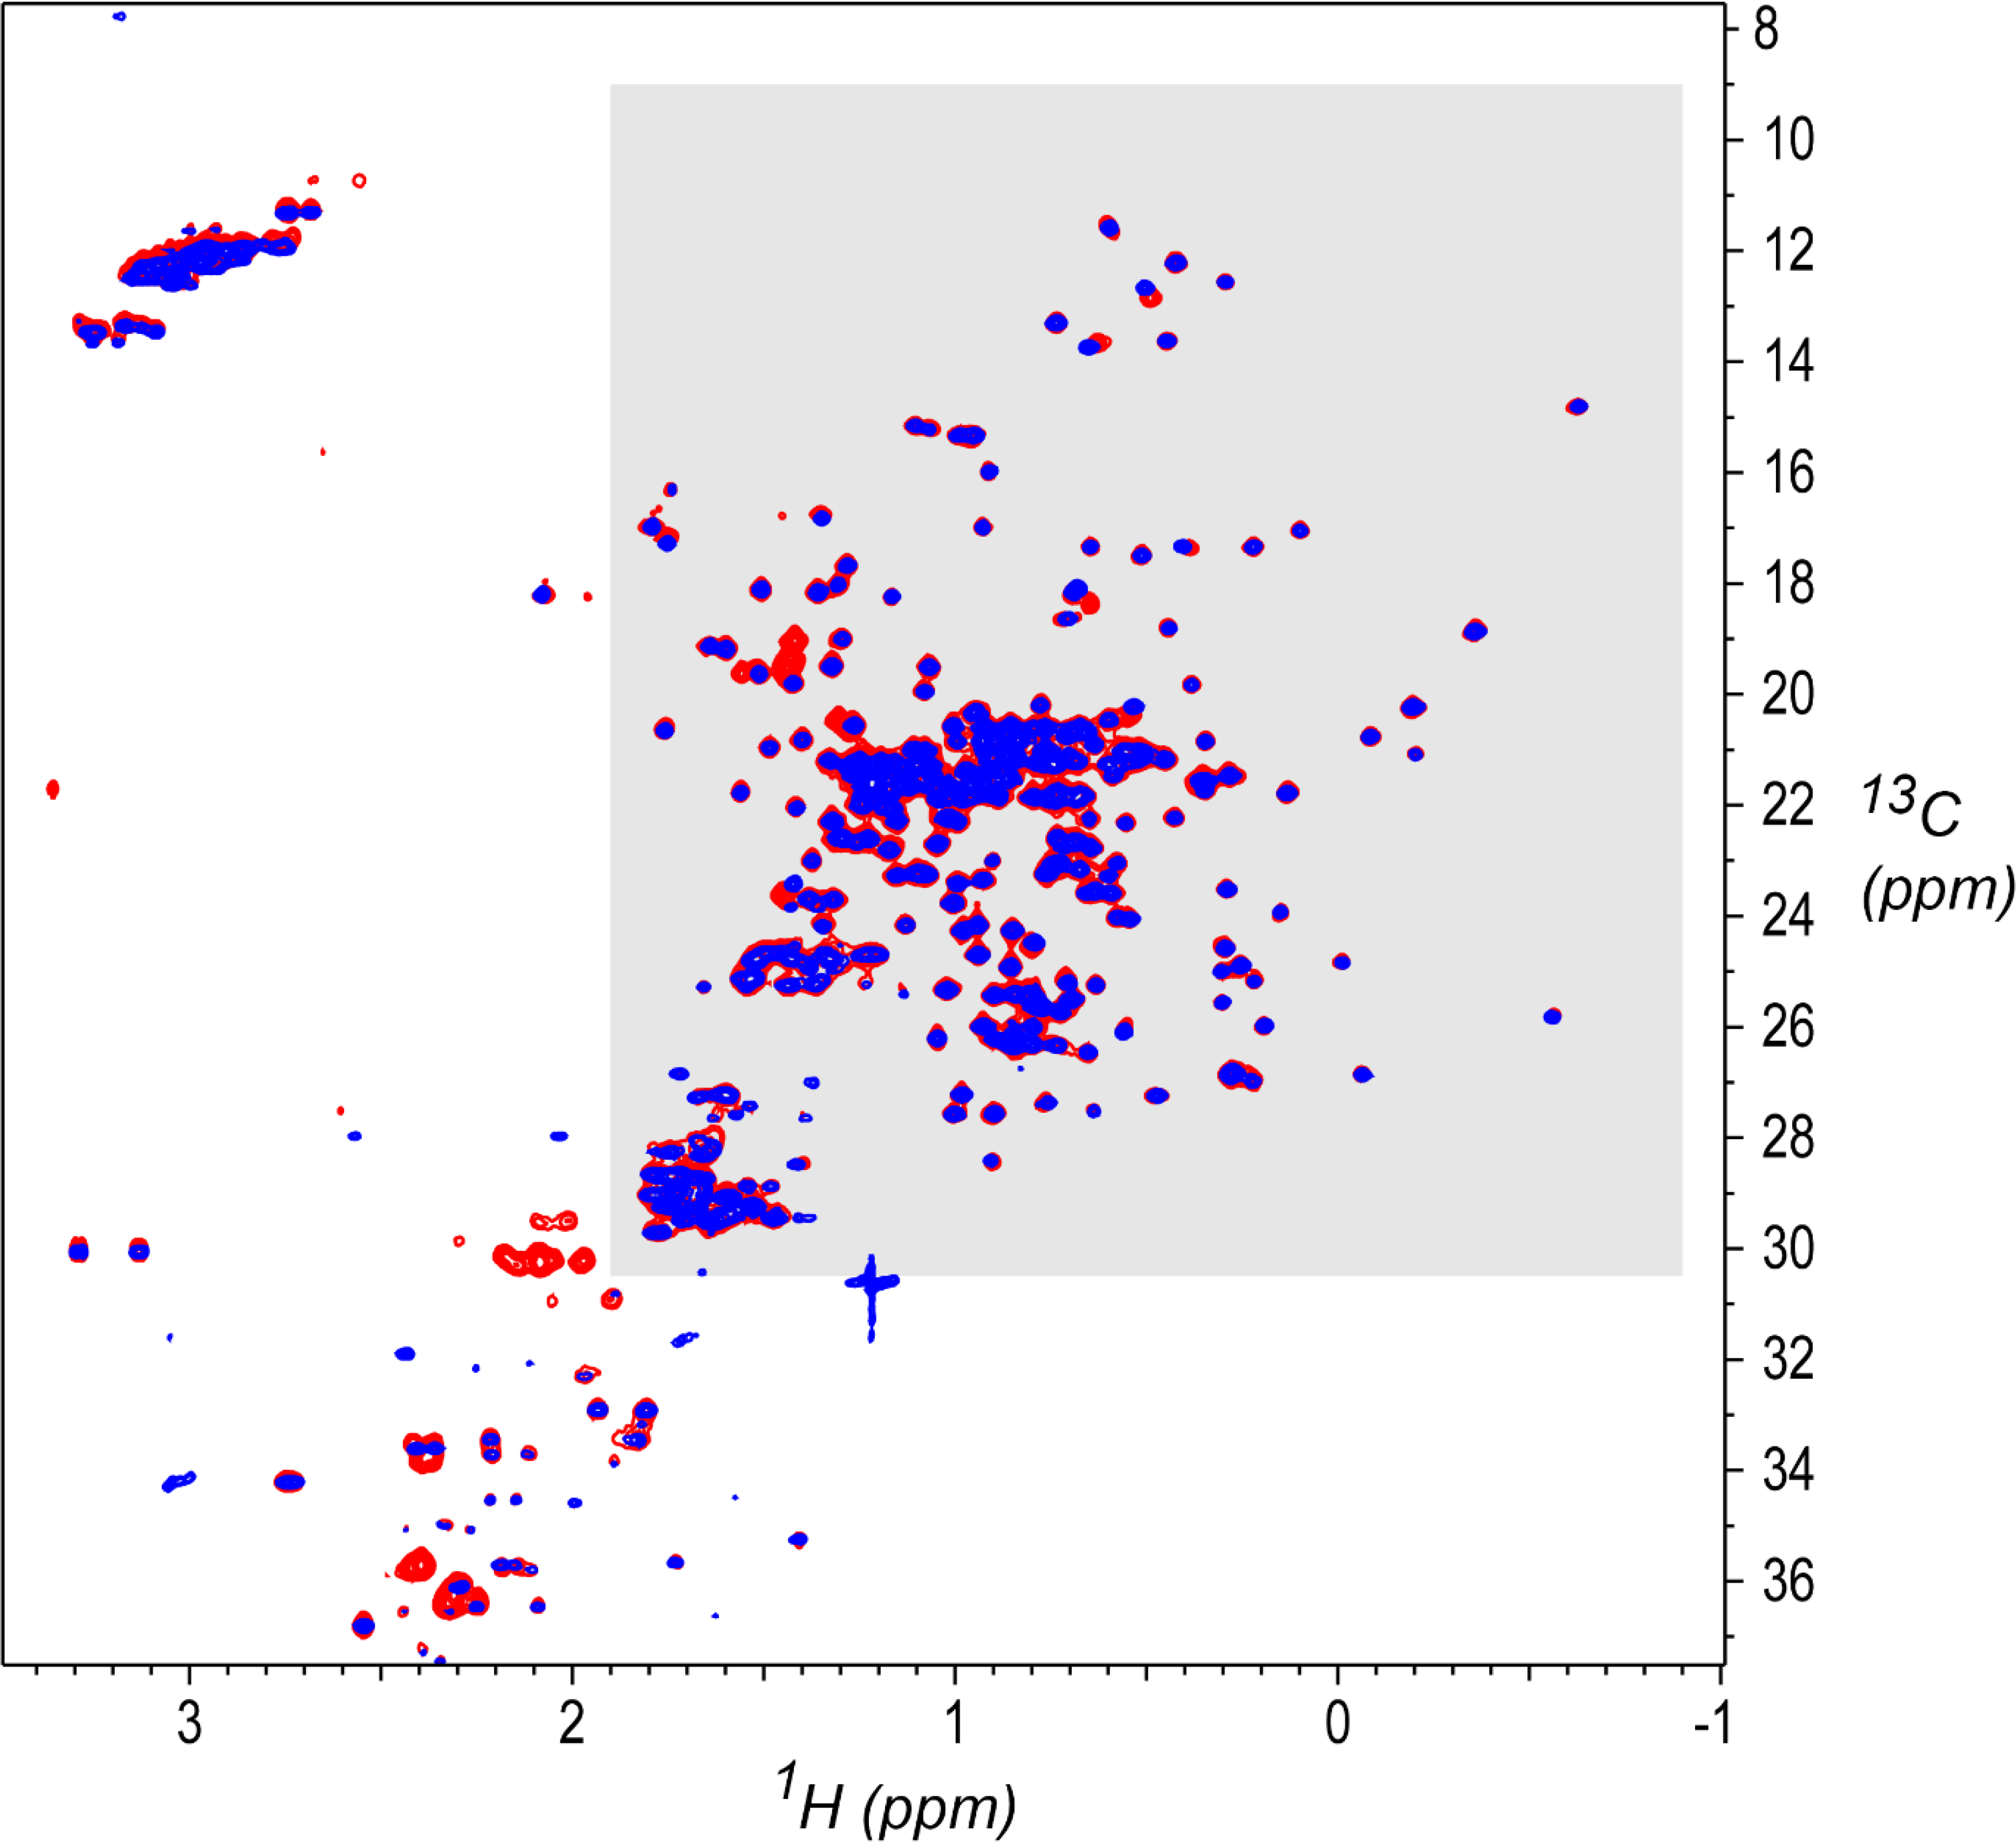
1H,13C gHSQC[33] spectral overlay for a System Suitability Sample (red, study ID 001-D2C-S-U-900–8822-010–37C) and a NIST-Fab sample (blue, study ID 004-D3A-F-U-900–7425-015–37C).[2] The study IDs encode the sample and measurement details in a series of fields separated by dashes, in this order from left to right: unique study index number, experiment code (as given in Table 1), sample (F for NIST-Fab, S for System Suitability Sample), NMR sampling type (U for Uniform, N for Non-Uniform), spectrometer frequency in MHz, laboratory ID, spectrum ID within that laboratory, and measurement temperature. Contour levels start at 2.5% of maximum intensity. The region shaded in gray, consisting primarily of protein sidechain methyl signals, was used for the outlier analysis in the present work (1H 1.9 ppm to −0.9 ppm, 13C 30.5 ppm to 9.0 ppm). Spectra were acquired as detailed by Brinson et al.,[2] and processed as described there by NMRPipe.[38]
The first of the study samples, denoted “NIST-Fab”, was a purified Fab domain derived from enzymatic cleavage of the NISTmAb. The Fab domain consists of two amino acid chains, called the light and heavy chains. The second study sample, denoted “SSS” (System Suitability Sample), was an isotopically-labeled construct with the identical sequence as the NIST-Fab sample, but with four additional amino acids at the N-termini of the two chains, for a total of 450 amino acids (Figure S1). The NISTmAb study includes data from seven different NMR field strengths, two brands of instruments, multiple temperatures, and several NMR measurement protocols, including conventional uniformly sampled (US) and non-uniformly sampled (NUS) acquisition. An interesting aspect of the study was that all spectra submitted by participants were retained, even if the measurement failed in some way due to setup problems or hardware malfunction. Furthermore, while all study participants submitted spectra that were measured according to recommended study protocols, participants were free to submit additional spectra with measurement parameters of their own choosing. Of the 375 2D 1H,13C spectra generated by the study, many are not ideal, and some are not directly comparable with others. So, these non-ideal outlier spectra must be identified before further analysis.
2.2. Characterizing NMR Spectra by Peak Position Metrics
The study results as first presented by Brinson et al. include characterization of interlaboratory precision via combined chemical shift deviation (CCSD) statistics, which encode differences in tables of chemical shifts (NMR peak positions) between a given spectrum and a reference spectrum, and principal component analysis (PCA) implemented on weighted peak tables.[2] These analyses confirmed that chemical shift values of a given peak are truly robust spectral parameters, since the resonance position is remarkably consistent regardless of experimental protocol, with the 1H,13C spectra measured in the study at 26 different labs having chemical shifts reproduced to better than six parts per billion. Since NMR spectral signals are sharper with increasing field strength, measurements on the same sample at different field strengths will yield spectra with slightly different peak heights and lineshapes. Even spectra of the same sample measured on the same instrument can have variations in lineshape due to instrument hardware and setup details. By contrast, unlike lineshape, peak position is tolerant even of selection of the pulse program involved to collect the 2D spectral fingerprint. In all these measurement variations, peak chemical shift values are exquisitely reproducible, so that analyses of peak position tables are able to capture the information that is most directly comparable under differing measurements.
Despite its demonstrated robustness, analysis of peak positions has disadvantages: it requires extensive and subjective analysis by a human expert, it is typically limited to well-resolved peaks, and it may not capture all of the relevant HOS information encoded in the spectrum. The peak table workflow involves mapping a reference peak list onto each new spectrum, where an initial correspondence of reference peaks to nearest peaks in the new spectrum is performed automatically, and results are visually inspected and manually adjusted by the operator. The process may take tens of minutes even for a skilled operator, and since it is limited to resolved peaks, not all peak position information is retained. In the case of the NISTmAb interlaboratory study, coverage of identifiable reference peaks ranged from 67% at 500 MHz to 91% at 900 MHz. More significantly, analysis of peak position alone does not encode differences in peak height and lineshape, and critically, it does not account for the absence of expected peaks or the appearance of new peaks. Therefore, while remarkably robust,[34] peak position metrics are not sufficient to characterize every type of spectral difference.
2.3. Characterizing Spectra by Direct Analysis of the Spectral Data Matrix
As an alternative to peak table approaches such as CCSD, the matrix of spectral intensities can be used directly as input for methods such as Principal Component Analysis (PCA), and these methods have already been applied to 2D 1H,13C spectra of biotherapeutics, revealing subtle HOS-related differences in spectra that would be difficult to discern by eye.[24], [29] This spectral matrix approach has several advantages: it does not depend on well-resolved peaks, it can be conducted without the need for the extensive and subjective interaction required for peak table approaches, and critically, it is also sensitive to spectral changes that peak position approaches cannot detect, including appearance of new peaks, or HOS-related changes in the lineshape of existing peaks.
The principal deficit of spectral matrix approaches is that subtle but global variations in spectra due to measurement details can overwhelm the variations in spectra due to small changes in HOS. As demonstrated in the interlaboratory study, peak positions are largely invariant with respect to measurement details, and peak positions can be determined successfully even when parts of the spectrum are distorted or contain artifacts, provided that the peaks of interest are unobscured. By contrast, peak heights and lineshapes are expected to vary with measurement details such as NMR field strength, but even small measurement differences at the same field strength can result in systematic differences large enough to affect chemometric results and obscure HOS characterization. These measurement differences can include acquisition details that are usually considered minor, such as changes in shimming protocol, use of non-uniform sampling, and changes to the digital resolution of the indirect dimension, although this later issue can be addressed by spectral processing. In addition, hardware defects can distort lineshapes and introduce artifacts, degrading performance of spectral matrix analysis. Since analysis methods that use the matrix of spectral data directly will potentially be affected by any distortion or artifact in the analysis region, it becomes more critical to employ carefully controlled and consistent measurement protocols, and likewise beneficial to employ an outlier detection procedure sensitive enough to detect any distortion that could affect chemometric results.
2.4. Interactive Classification of Outliers
To establish a rough benchmark for the automated outlier detection, spectra were first scored by a quick subjective visual inspection of contour plots, generally using less than 30 seconds per spectra. A score of zero was assigned to spectra which had the expected quality and were free of defects, and so were suitable for further analysis by direct spectral matrix methods. A score of one was assigned to spectra that were deemed to have intermediate quality, still suitable for further analysis, but not ideal in some way, for example if they had the appearance of lower than usual signal to noise, or minor local phase or baseline distortions. A score of two was assigned to spectra that exhibited pervasive systematic distortions, and so should be classified as outliers. Examples of spectra with scores 0, 1, and 2 are shown in Figure 2. As noted above, criteria for being able to use a spectrum for CCSD analysis are different than for direct analysis of the spectral matrix, and the interactive outlier classification was performed with the expectation that small but pervasive artifacts and distortions would make a spectrum unusable.
Figure 2.
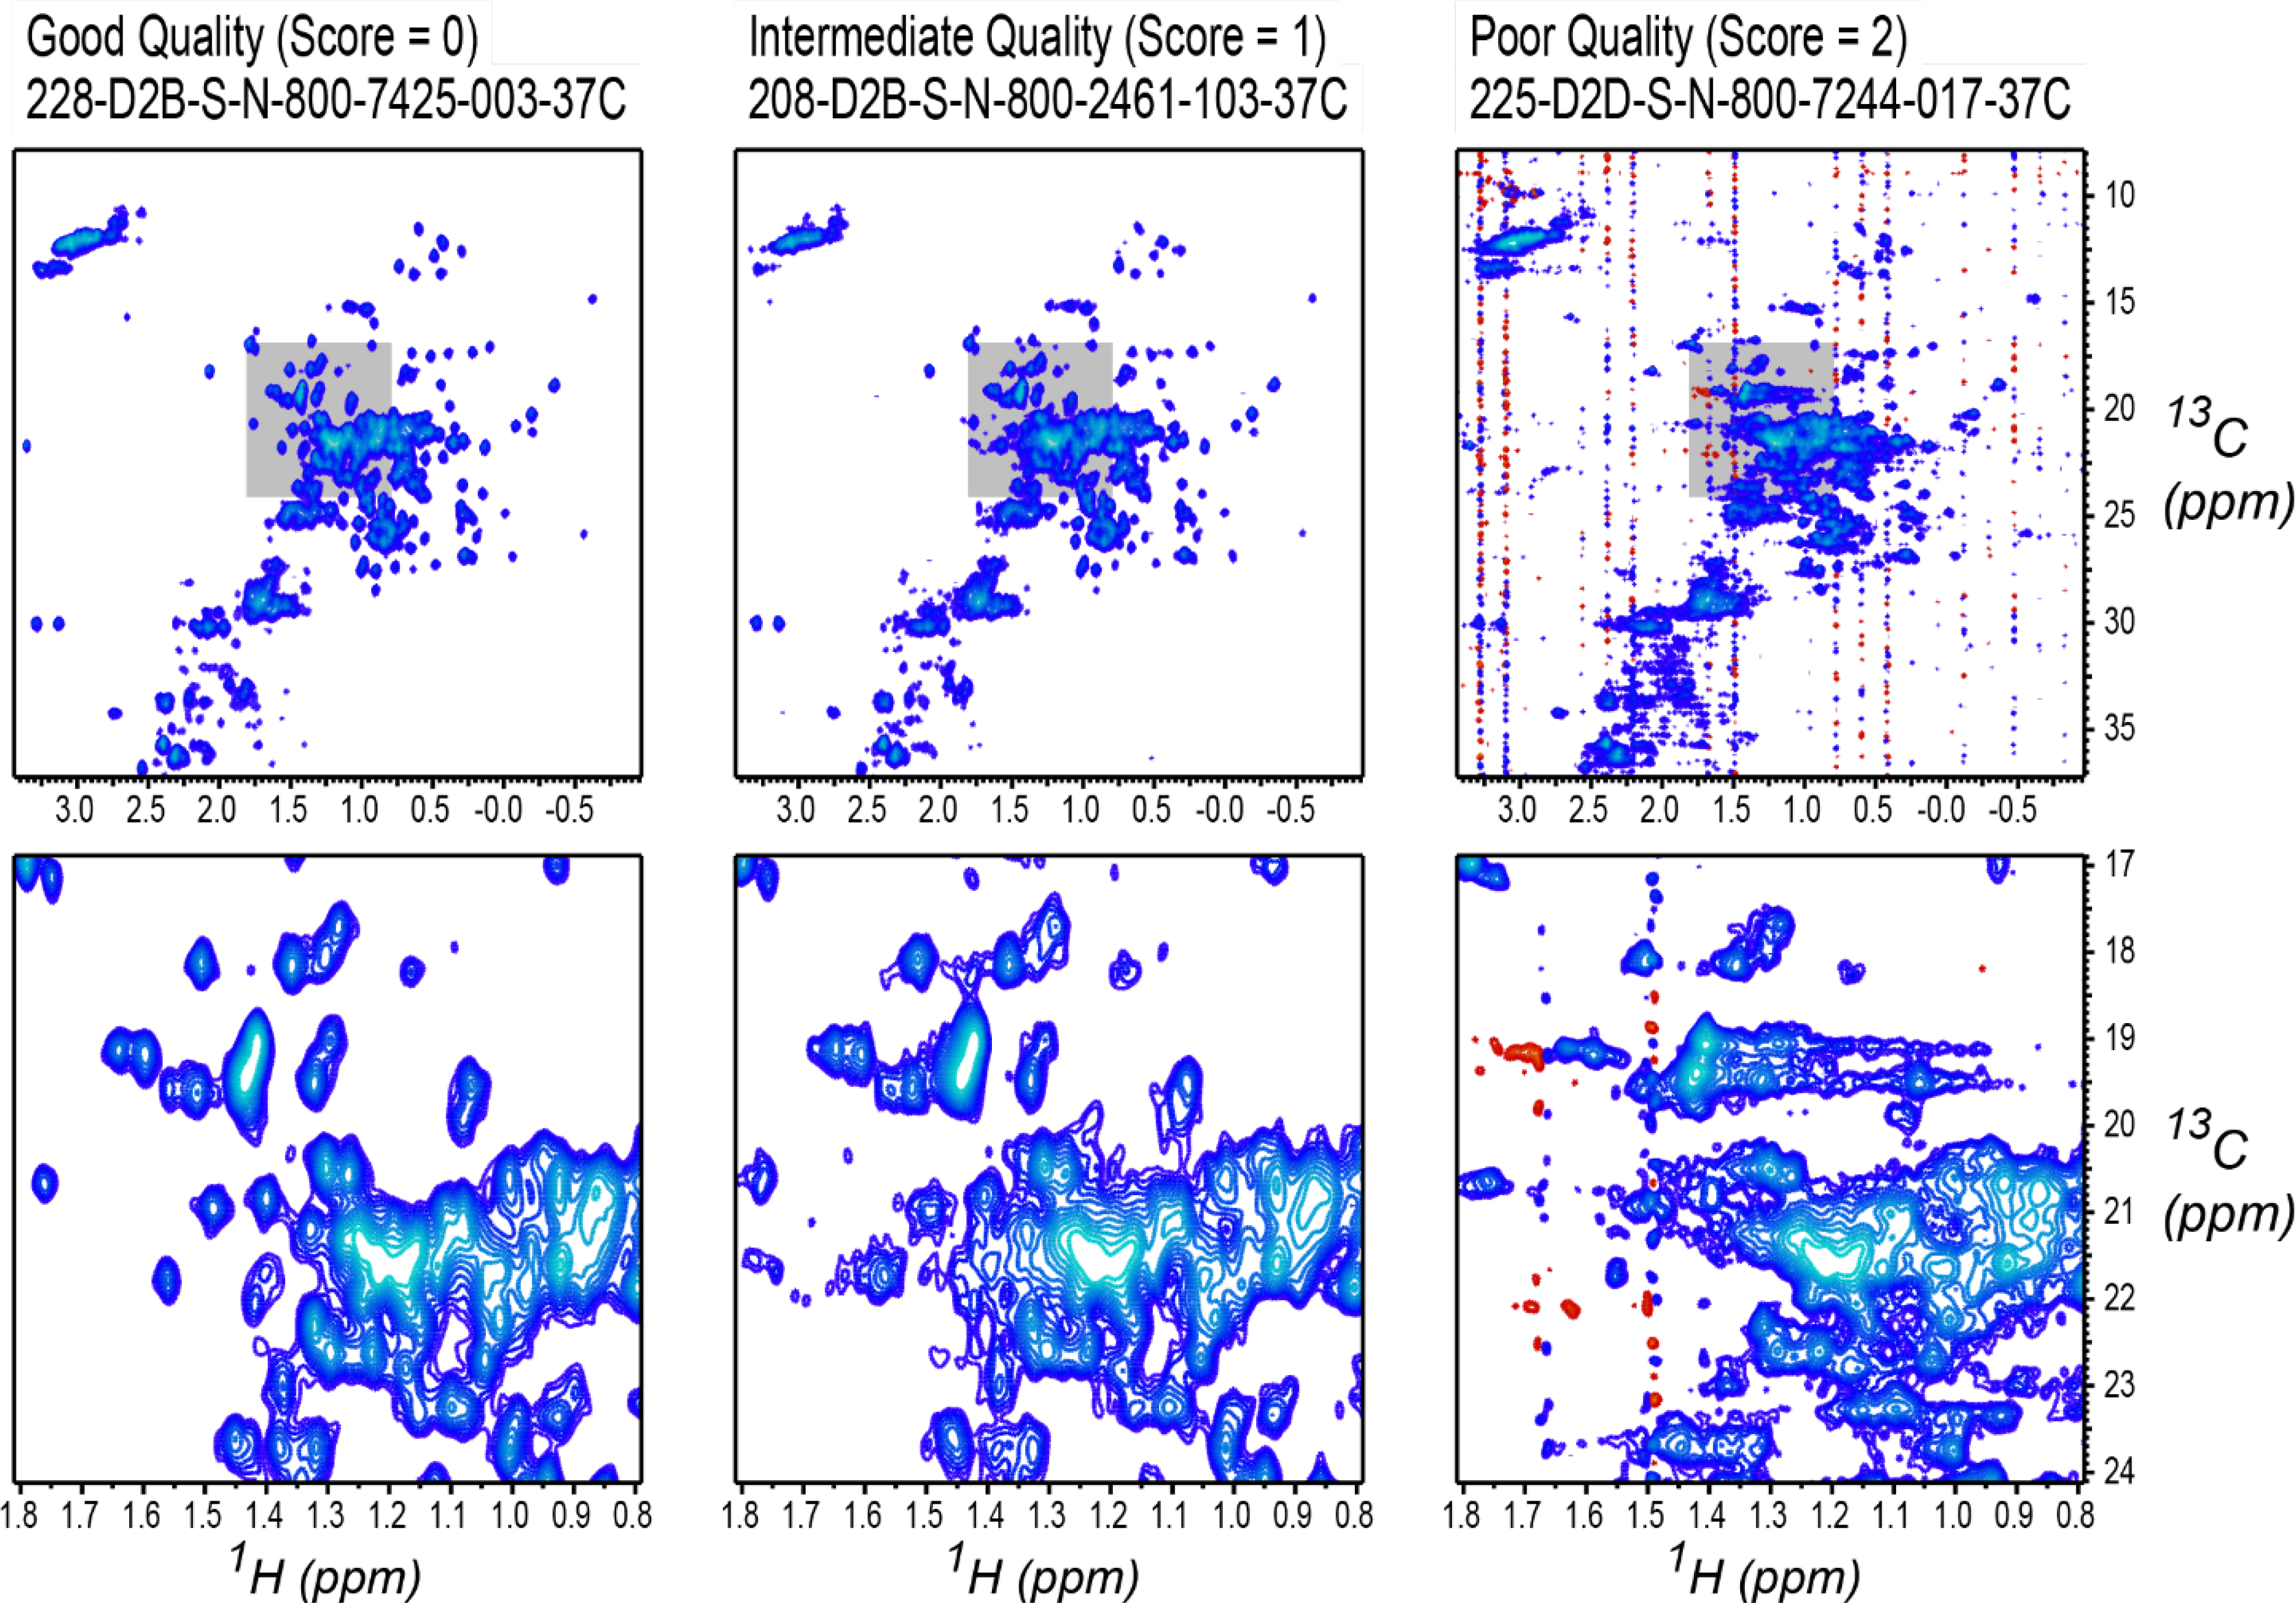
Examples of interactively scored spectra, drawn with a region of interest highlighted in gray (top row) and with the region shown in expanded view (bottom row). Spectra are labeled with their study titles, as described in the study data package,[30] and are drawn with contour levels starting at 2.5% of maximum intensity. Left column: study spectrum 7425–003, which was assigned score 0 because it has the expected appearance. Middle column: study spectrum 2461–103, which was assigned score 1 because it has the appearance of slightly worse than expected signal to noise. Right column: study spectrum 7244–017, which was assigned score 2 because it has pervasive artifacts in the form of vertical streaks throughout the spectrum.
3. Theory and Calculation
3.1. Chemometric Outlier Detection for 2D NMR Spectra
The outlier analysis builds on methods developed for a previous multilaboratory study on 1D 1H NMR spectra of metabolites.[35] In this previous work, the detection procedure was applied both to identify individual outlier spectra, and also to classify laboratories as outliers according to the aggregated quality of all measurements from a given laboratory. As with the current work, the central concept of the previous work was that outlier detection is based on an average metric of dissimilarity between a given spectrum and all others in its group.
In the present work, the 2D spectra, which have both positive and negative intensities, are first converted to grayscale images. As shown in Figure 3, as an intermediate step in grayscale conversion, spectra are first represented as color images using a display mode commonly employed for visual inspection of NMR data, with positive intensities drawn in shades of blue, and negative intensities drawn in shades of red. Conversion is performed according to two thresholds, here 2.5% of the maximum NMR intensity and 35% (2.5% times contour spacing 1.310) of that intensity. As shown in Figure S2, this is typical of the intensity range displayed in a contour plot of the data. The NMR intensity is mapped to color values using the following expressions for the red and blue intensities:
| [Eqn 1] |
where j and k are 2D indices, Ijk is the matrix of spectral intensities, and and are the intensities of the red and blue channels. These are converted to grayscale matrix xjk using the factor of 0.11 for blue and 0.3 for red, a common grayscale conversion scheme having the added benefit of heavily weighting negative NMR intensities, an advantage here since the study spectra are expected to have all-positive signals in the analysis region. The color image is converted to greyscale by applying the mapping,
| [Eqn 2] |
After applying this mapping, every matrix x is subsequently normalized so that it sums to 1, a requirement for the distance measure performed next.
Figure 3.
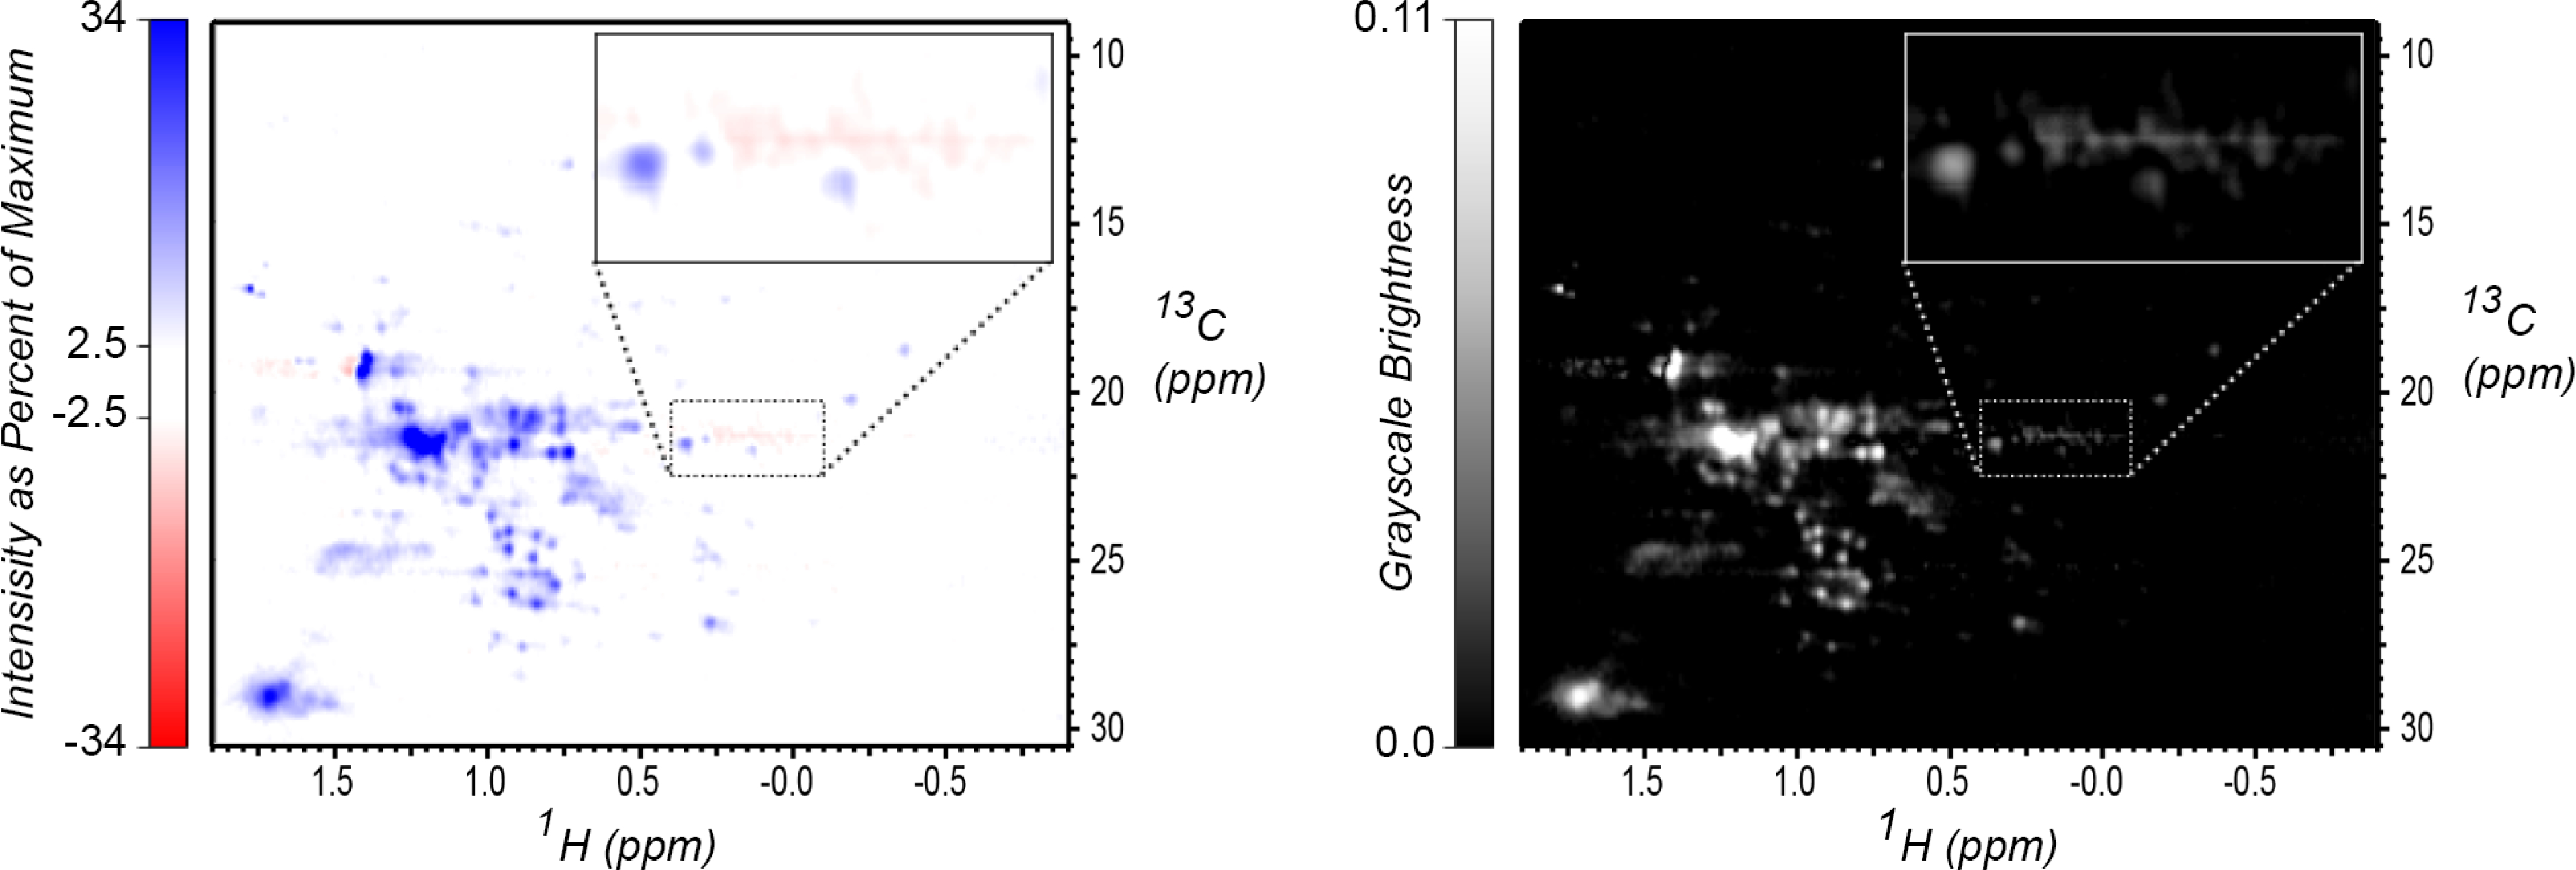
Mapping of two-color spectral display to grayscale. Left: Image representation of an NMR spectrum using a red/blue color map, with zero intensity drawn as white instead of black for clarity. Right: Grayscale brightness based on red and blue channel intensity and the grayscale conversion function described in the text. In both plots, a region with negative artifacts is highlighted and drawn in expanded view in the inset; the choice of grayscale conversion function is intended to emphasize negative intensities, since in these spectra, no negative features are expected.
3.2. Classification Using the Kullback-Liebler Metric for Spectral Dissimilarity
The converted, normalized grayscale images are compared using the symmetric Kullback-Liebler (KL) divergence[36], dKL, which for two data matrices x and y is given by:
| [Eqn 3] |
This metric is chosen because it strongly penalizes spectra that contain features not present in other spectra from the same population. So, as an initial step, the spectra are grouped into populations expected to be similar enough for direct comparison. Within each group, the KL statistic is calculated for each pair of spectra. Then, for each spectrum, the mean of the KL divergence to all other spectra in its population is calculated,
| [Eqn 4] |
Di,k is the mean distance of spectrum i to the other spectra in subpopulation k, and Nk is the number of spectra in population k. This set of means is fit to a lognormal distribution, and then each spectrum is judged according to how far it is from the mean of this distribution. A threshold is chosen for each population, here the 95% confidence limit, and spectra beyond this threshold are classified as outliers. Each spectrum is assigned a logarithmic Z-score calculated by
| [Eqn 5] |
where μ and σ are the mean and standard deviations of subpopulation k. This makes the 95% confidence limit equivalent to a Z-score of about 5.2. Because some of the subpopulations are small, we define a support fraction f, which determines the maximum number of outliers that can be removed as n = floor[Nk(1 – f)] (e.g. if the population contains 7 samples, at most one could be removed). If more spectra exceed the 95% confidence threshold than n, only the n spectra with the largest Z-scores are removed.
Some details that can be varied include how the spectra are divided into subpopulations for direct comparison, the threshold for classifying a spectrum as an outlier, and whether a single-pass or a recursive outlier detection is used. In the single pass method, statistics are computed once, and all spectra with scores over the specified threshold are removed as outliers (subject to the support fraction). In the recursive method, outliers are removed one at a time, with statistics recomputed after each outlier is removed. A Flowchart for the recursive variation is shown in Figure 4. Because the recursive method is more aggressive in removing outliers, a support fraction of 0.85 was used to minimize false positives and a support fraction of 0.6 (effectively 0) for all other cases. To ensure that egregious outliers are always removed, a final pass is conducted which removes spectra outside the 99% confidence interval (those with Z-scores greater than about 10).
Figure 4.
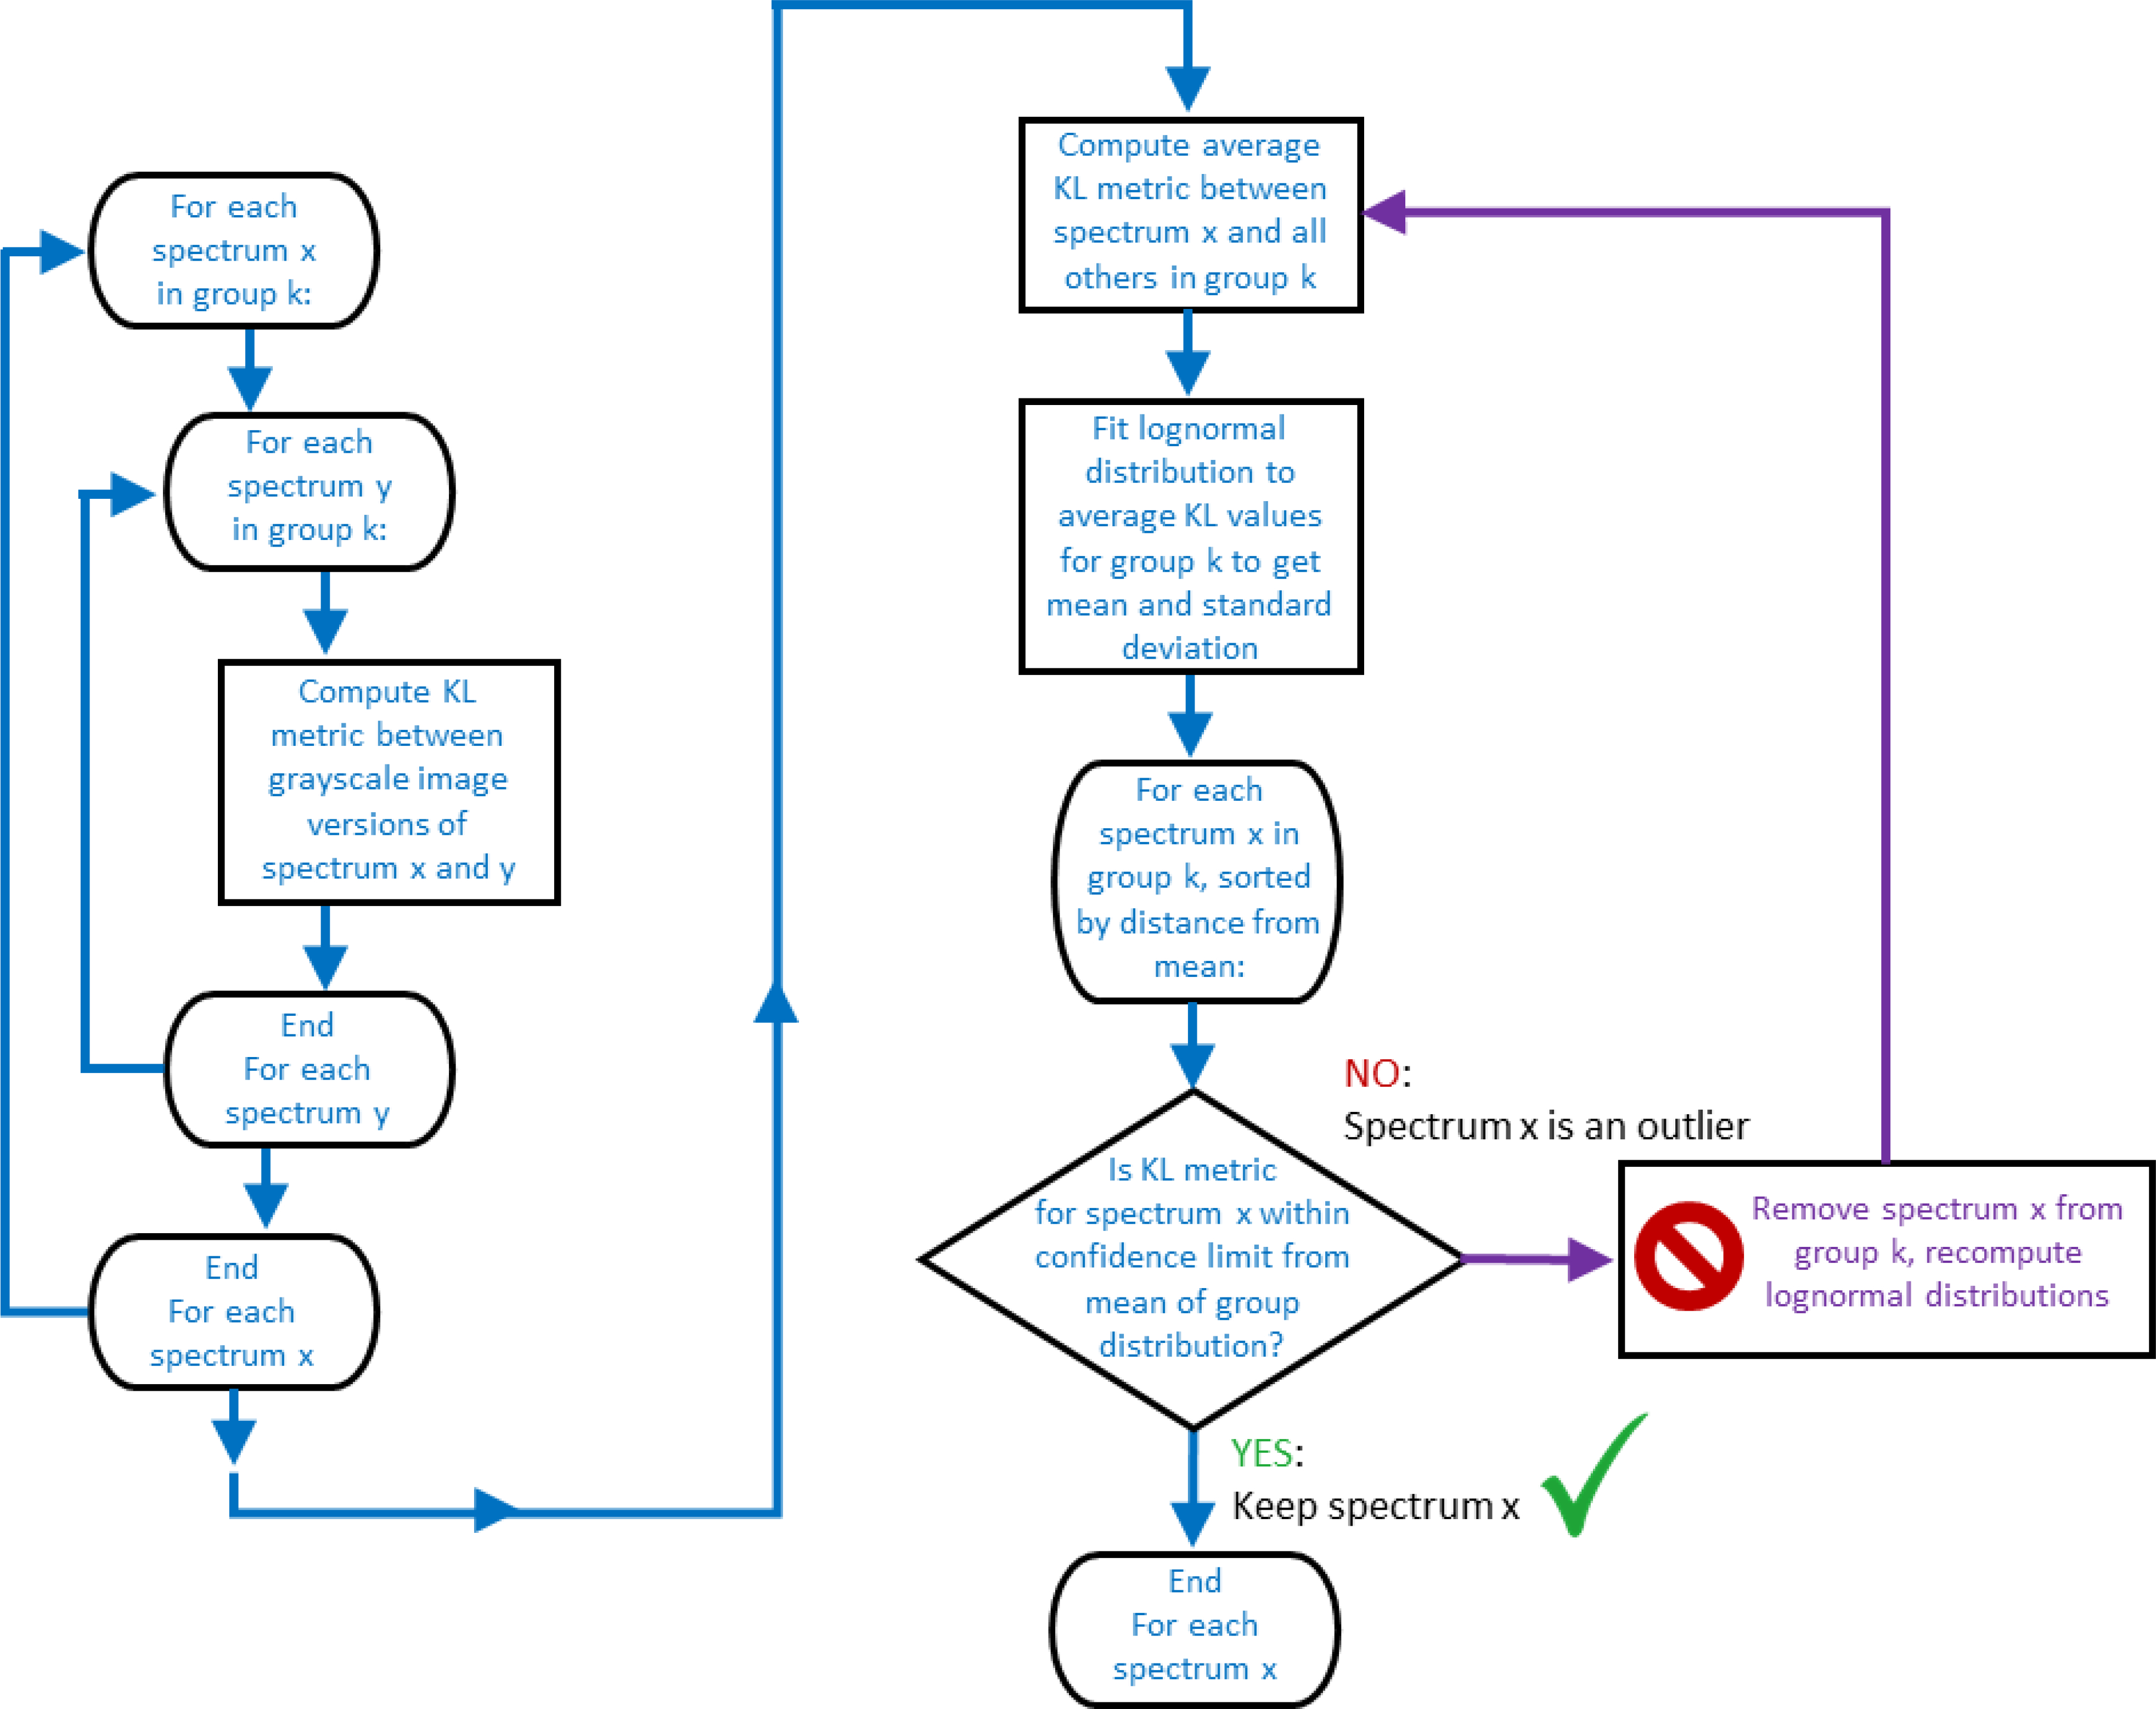
Conceptual flowchart of the recursive version of the outlier classification procedure. All of the outlier classification methods start by computing the KL metric between each pair of spectra x and y in group k, and using these values to find the average KL metric between each spectrum x and all others in group k. This collection of average KL values is fit to a lognormal distribution, which results in a mean value and standard deviation for the distribution, and from these, a confidence limit is calculated. Then, in a recursive loop, the spectrum with the largest average KL value is tested to see if it is beyond the confidence limit from the distribution mean. If it is not, the spectrum is not an outlier, and recursive iterations stop. However, if the spectrum with the largest average KL value is beyond the confidence limit, it is classified as an outlier, removed from the group, new distribution parameters are calculated with the remaining spectra, and the recursive loop is repeated to test for additional outliers.
4. Results and Discussion
4.1. Application to the Interlaboratory Study Data
Of the 375 1H,13C study spectra, the largest directly comparable group were all gHSQC spectra measured at 37 °C using the recommended study protocols. These 252 spectra were subjected to outlier detection. As given in Table 1, each spectrum has an experiment code that indicates the sample type and acquisition parameters used. The spectra were grouped into populations based on experiment code, since it is expected that spectra measured on the same sample with similar acquisition parameters should be most directly comparable. To account for expected spectral differences in resolution due to NMR field strength, these populations were further subdivided into high-field (800 MHz and greater), mid-field (700 MHz and 750 MHz), and low-field (all others), as shown in Table 2. This yielded 21 groups of 6 to 20 spectra each.
Table 1.
Experiment codes for 1H,13C gHSQC spectra[33] used in the outlier analysis. Taken from Brinson et al.[2]
| Experiment Code | Number of Spectra (Total = 252) | Sample | NMR Acquisition Type | Comments |
|---|---|---|---|---|
| D2A | 39 | SSS | Uniform | Field-independent acquisition: 128 total points in the 13C dimension |
| D2B | 32 | SSS | Non-Uniform | 50% Non-Uniform Sampling of D2A |
| D2C | 41 | SSS | Uniform | Field-dependent acquisition: 25 ms acquisition in the 13C dimension |
| D2D | 31 | SSS | Non-Uniform | 50% Non-Uniform Sampling of D2C |
| D2E | 26 | SSS | Non-Uniform | Twice the scans per increment, 50% Non-Uniform Sampling of D2C |
| D3A | 47 | NIST-Fab | Uniform | Field dependent acquisition: 25 ms acquisition in 13C dimension |
| D3B | 36 | NIST-Fab | Non-Uniform | 50% Non-Uniform Sampling of D3A |
Table 2.
Spectral groupings for the outlier analysis.
| Group Name (500–600 MHz) | Number of Spectra | Group Name (700–750 MHz) | Number of Spectra | Group Name (800–950 MHz) | Number of Spectra |
|---|---|---|---|---|---|
| D2A – Low Field | 19 | D2A – Mid Field | 8 | D2A – High Field | 12 |
| D2B – Low Field | 13 | D2B – Mid Field | 6 | D2B – High Field | 13 |
| D2C – Low Field | 20 | D2C – Mid Field | 7 | D2C – High Field | 13 |
| D2D – Low Field | 14 | D2D – Mid Field | 6 | D2D – High Field | 11 |
| D2E – Low Field | 11 | D2E – Mid Field | 6 | D2E – High Field | 9 |
| D3A – Low Field | 25 | D3A – Mid Field | 9 | D3A – High Field | 14 |
| D3B – Low Field | 18 | D3B – Mid Field | 7 | D3B – High Field | 11 |
Spectra were analyzed using three variations of the outlier detection procedure: the single pass detection and recursive detection describe above, and detection using a single meta-distribution for all spectra. In the single-distribution method, distributions and Z-scores were calculated for each of the 21 classes, the populations of Z-scores were combined into a superpopulation, a lognormal distribution was fit to this superpopulation (a Z-score of Z-scores), and outlier detection was performed using this superpopulation distribution. Examples of distributions and their parameters for the 21 classes are shown in Figures 5 and 6. The outlier detection methods were implemented in python[37], and the python workbooks and NMRPipe-format[38] input data are available for download.[30] The results of the interactive outlier detection are summarized in Table 3, and results of automated detection in Tables 4, 5, and 6.
Figure 5.
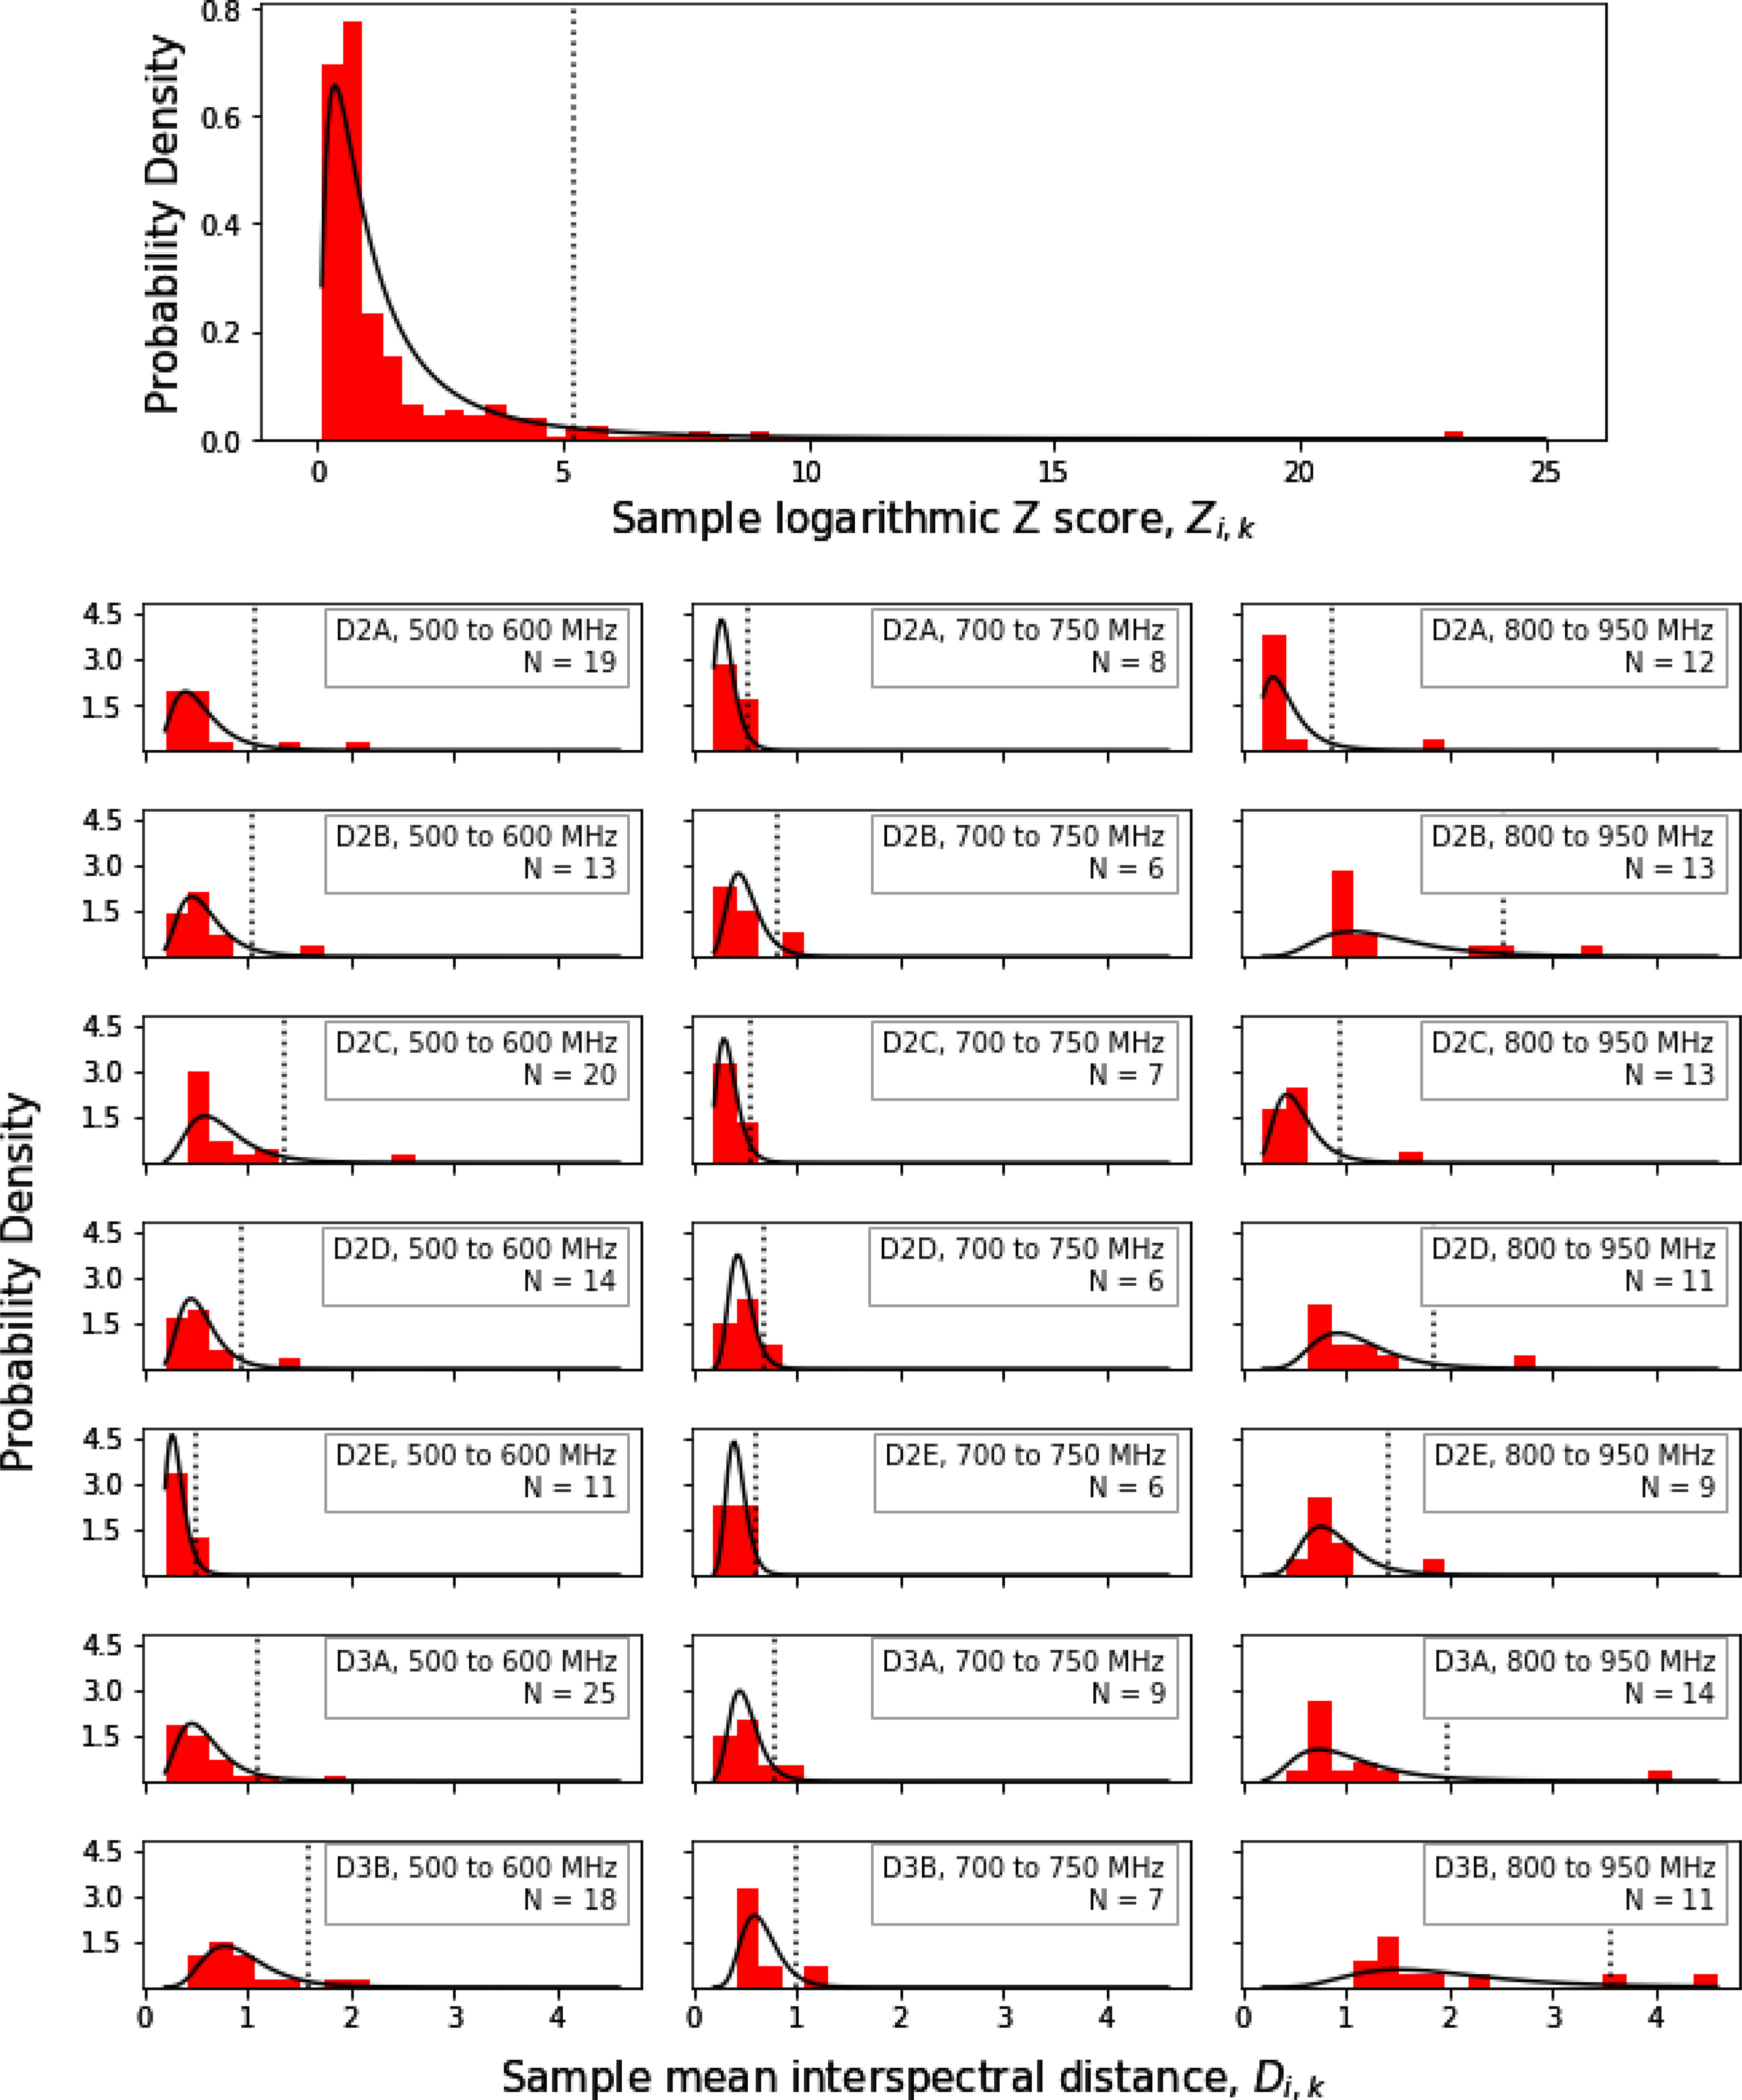
Example probability distributions for classes used for the outlier detection procedure. The topmost graph shows the distribution for all spectra, the other graphs show the distributions for each of the 21 classes used. The red histograms show the actual distribution of the measured data, and the black curves show the fit of the histograms to lognormal distributions. In a given distribution, spectra which fall to the right of the dashed line, representing the 95% confidence limit of the distribution, are classified as outliers.
Figure 6.
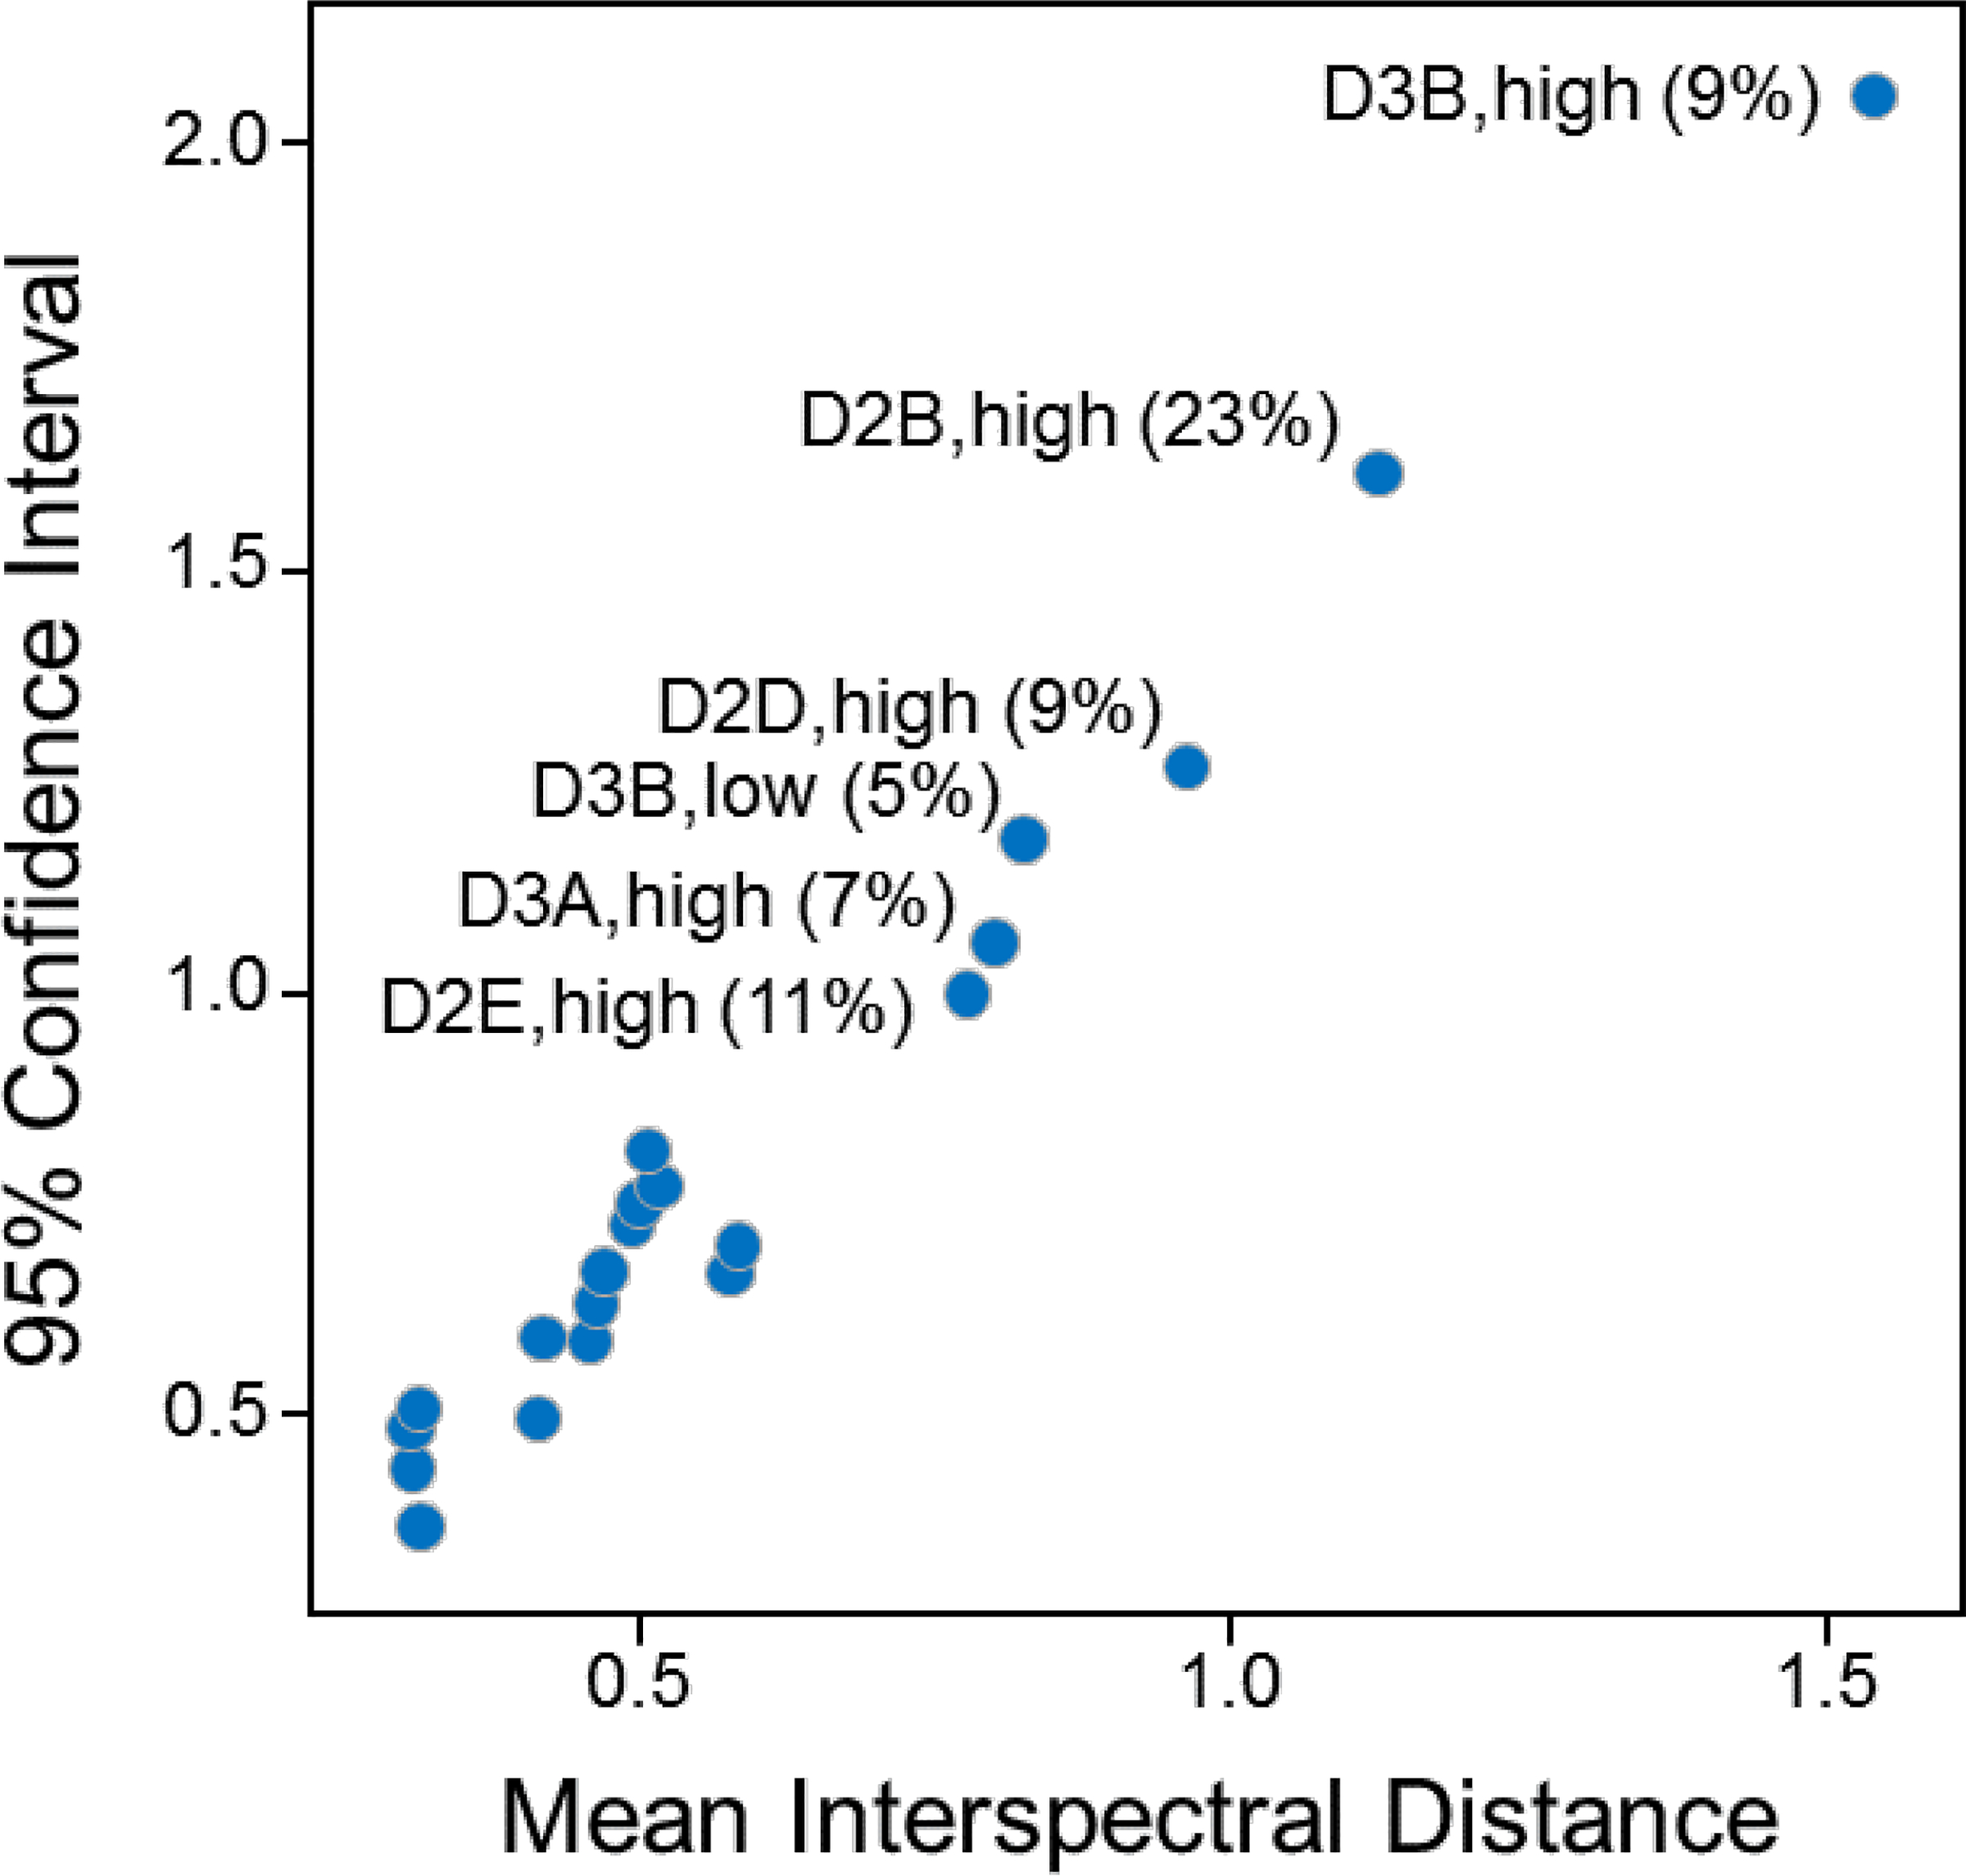
Example probability distribution parameters for classes used in the outlier detection procedure, with selected points labeled with the class name and percentage of visually identified outliers in that class. The presence of outliers in a class will tend to increase the mean interspectral distance and the width of the confidence interval, as for the class D2B,high which has three visually identified outliers out of 13 spectra, as listed in Table 3.
Table 3.
Interactively determined outlier counts with group size N for the spectral groups, with entries for groups having one or more interactive outliers highlighted in red.
| Group Name (500–600 MHz) | Outliers/N | Group Name (700–750 MHz) | Outliers/N | Group Name (800–950 MHz) | Outliers/N |
|---|---|---|---|---|---|
| D2A – Low Field | 1/19 | D2A – Mid Field | 0/8 | D2A – High Field | 1/12 |
| D2B – Low Field | 0/13 | D2B – Mid Field | 0/6 | D2B – High Field | 3/13 |
| D2C – Low Field | 1/20 | D2C – Mid Field | 0/7 | D2C – High Field | 1/13 |
| D2D – Low Field | 0/14 | D2D – Mid Field | 0/6 | D2D – High Field | 1/11 |
| D2E – Low Field | 0/11 | D2E – Mid Field | 0/6 | D2E – High Field | 1/9 |
| D3A – Low Field | 0/25 | D3A – Mid Field | 0/9 | D3A – High Field | 1/14 |
| D3B – Low Field | 1/18 | D3B – Mid Field | 0/7 | D3B – High Field | 1/11 |
Table 4.
Results of interactive and automated outlier detection for spectra interactively classified as outliers, or interactively classified as acceptable when one or more of the automated methods classified the spectrum as an outlier. Cases where the automated result differed from the interactive result are highlighted in red.
| Index | Spectrum Study Title | Interactive Score | Outlier Determination, Non-Recursive Method | Outlier Determination, Single Population Method | Outlier Determination, Recursive Method |
|---|---|---|---|---|---|
| 42 | 042-D2A-S-U-800–7244–013–37C | 2 | TRUE | TRUE | TRUE |
| 43 | 043-D2C-S-U-800–7244–016–37C | 2 | TRUE | TRUE | TRUE |
| 44 | 044-D3A-F-U-800–7244–019–37C | 2 | TRUE | TRUE | TRUE |
| 88 | 088-D2A-S-U-600–1894–102–37C | 2 | TRUE | TRUE | TRUE |
| 89 | 089-D2C-S-U-600–1894–104–37C | 2 | TRUE | TRUE | TRUE |
| 211 | 211-D2B-S-N-800–6211–403–37C | 2 | TRUE | TRUE | TRUE |
| 212 | 212-D2B-S-N-800–6211–405–37C | 2 | FALSE | FALSE | FALSE |
| 224 | 224-D2B-S-N-800–7244–015–37C | 2 | FALSE | FALSE | TRUE |
| 225 | 225-D2D-S-N-800–7244–017–37C | 2 | TRUE | TRUE | TRUE |
| 226 | 226-D2E-S-N-800–7244–018–37C | 2 | TRUE | TRUE | TRUE |
| 227 | 227-D3B-F-N-800–7244–020–37C | 2 | TRUE | TRUE | TRUE |
| 353 | 353-D3B-F-N-600–8822–067–37C | 2 | TRUE | TRUE | TRUE |
| 31 | 031-D2A-S-U-800–2461–102–37C | 0 | FALSE | FALSE | TRUE |
| 49 | 049-D2C-S-U-750–2974–004–37C | 0 | TRUE | TRUE | TRUE |
| 69 | 069-D3A-F-U-700–8473–007–37C | 0 | TRUE | TRUE | TRUE |
| 173 | 173-D3A-F-U-500–8179–307–37C | 0 | FALSE | FALSE | TRUE |
| 233 | 233-D2D-S-N-750–2974–005–37C | 0 | TRUE | TRUE | FALSE |
| 234 | 234-D2E-S-N-750–2974–006–37C | 0 | TRUE | TRUE | FALSE |
Table 5.
Tally of potential false positive classifications, where spectra are classified as outliers by one of the automated methods, but not by interactive scoring, with entries for groups with one potential false positive classifications highlighted in red.
| Group Name (500–600 MHz) | Outliers/N | Group Name (700–750 MHz) | Outliers/N | Group Name (800–950 MHz) | Outliers/N |
|---|---|---|---|---|---|
| D2A – Low Field | 0/19 | D2A – Mid Field | 0/8 | D2A – High Field | 1/12 |
| D2B – Low Field | 0/13 | D2B – Mid Field | 0/6 | D2B – High Field | 0/13 |
| D2C – Low Field | 0/20 | D2C – Mid Field | 1/7 | D2C – High Field | 0/13 |
| D2D – Low Field | 0/14 | D2D – Mid Field | 1/6 | D2D – High Field | 0/11 |
| D2E – Low Field | 0/11 | D2E – Mid Field | 1/6 | D2E – High Field | 0/9 |
| D3A – Low Field | 1/25 | D3A – Mid Field | 1/9 | D3A – High Field | 0/14 |
| D3B – Low Field | 0/18 | D3B – Mid Field | 0/7 | D3B – High Field | 0/11 |
Table 6.
Results of interactive and automated outlier detection for spectra interactively classified as intermediate quality (score = 1). Cases where the automated result differed from the interactive result are highlighted in red.
| Index | Spectrum Study Title (N = 26) | Interactive Score | Outlie Determination, Non-Recursive Method, Outliers = 8 | Outlie Determination, Single Population Method, Outliers = 8 | Outlie Determination, Recursive Method, Outliers = 13 |
|---|---|---|---|---|---|
| 33 | 033-D3A-F-U-800–2461–106–37C | 1 | FALSE | FALSE | TRUE |
| 90 | 090-D3A-F-U-600–1894–107–37C | 1 | TRUE | TRUE | TRUE |
| 129 | 129-D2C-S-U-600–6324–019–37C | 1 | FALSE | FALSE | FALSE |
| 131 | 131-D2A-S-U-600–7244–04–37C | 1 | TRUE | TRUE | TRUE |
| 132 | 132-D2C-S-U-600–7244–007–37C | 1 | FALSE | FALSE | TRUE |
| 133 | 133-D2C-S-U-600–7244–009–37C | 1 | FALSE | FALSE | TRUE |
| 134 | 134-D3A-F-U-600–7244–010–37C | 1 | TRUE | TRUE | TRUE |
| 175 | 175-D2A-S-U-500–9966–002–37C | 1 | FALSE | FALSE | TRUE |
| 176 | 176-D2C-S-U-500–9966–004–37C | 1 | FALSE | FALSE | TRUE |
| 208 | 208-D2B-S-N-800–2461–103–37C | 1 | FALSE | FALSE | FALSE |
| 209 | 209-D2D-S-N-800–2461–105–37C | 1 | FALSE | FALSE | FALSE |
| 210 | 210-D3B-F-N-800–2461–107–37C | 1 | FALSE | FALSE | TRUE |
| 215 | 215-D2B-S-N-800–6211–409–37C | 1 | FALSE | FALSE | FALSE |
| 216 | 216-D2D-S-N-800–6211–410–37C | 1 | FALSE | FALSE | FALSE |
| 217 | 217-D2E-S-N-800–6211–411–37C | 1 | FALSE | FALSE | FALSE |
| 218 | 218-D3B-F-N-800–6211–412–37C | 1 | FALSE | FALSE | FALSE |
| 220 | 220-D2D-S-N-800–6272–008–37C | 1 | FALSE | FALSE | FALSE |
| 221 | 221-D2E-S-N-800–6272–009–37C | 1 | FALSE | FALSE | FALSE |
| 222 | 222-D2D-S-N-800–6272–010–37C | 1 | FALSE | FALSE | FALSE |
| 223 | 223-D3B-F-N-800–6272–014–37C | 1 | FALSE | FALSE | FALSE |
| 266 | 266-D2B-S-N-700–8473–003–37C | 1 | TRUE | TRUE | FALSE |
| 269 | 269-D3B-F-N-700–8473–008–37C | 1 | TRUE | TRUE | TRUE |
| 341 | 341-D2B-S-N-600–7244–006–37C | 1 | TRUE | TRUE | TRUE |
| 342 | 342-D2D-S-N-600–7244–008–37C | 1 | TRUE | TRUE | TRUE |
| 343 | 343-D3B-F-N-600–7244–011–37C | 1 | TRUE | TRUE | TRUE |
| 359 | 359-D2B-S-N-600–9963–003–37C | 1 | FALSE | FALSE | FALSE |
For conducting the automated classifications, we desired a result free of “false negative” classifications, cases where a spectrum was visually classified as distorted, but was not classified as an outlier by the automated procedure. Very bad spectra are easy to identify by eye, so all spectra with interactive score = 2 are definitely outliers, as with the example in the right panels of Figure 2. Ideally, an automated method should successfully identify all score = 2 spectra as outliers. Likewise, spectra with an interactive score = 0 should not be classified as outliers, and spectra with interactive score = 1, the intermediate quality spectra, could acceptably be assigned to either class, good or outlier, by the automated method. Table 4 tallies results for two cases: all spectra that were interactively classified as outliers (12 spectra with score = 2), or automatically classified as outliers when interactive classification listed the spectrum as acceptable (6 spectra with score = 0).
4.2. Results on the Interlaboratory Study Data
As shown in Table 4, the recursive outlier detection gave the best results, detecting 11 of the 12 interactively classified outlier spectra, with the one error being misclassification of a D2B high-field spectrum (212-D2B-S-N-800–6211-405–37C). However, as was shown in Table 3, the D2B high field class, which contains 13 spectra, has 3 of its members interactively classified as outliers, making it the only group with more than one interactively classified outlier, and also the group with the largest fraction of outliers (23%, while the others vary from 5% to 11%). Since the method was set to allow deletion of no more than 15% of a given group’s spectra, it was not possible to identify all three outliers in this group.
Table 6 tallies those cases where interactive analysis classified the spectrum as intermediate quality (score = 1), along with the classification results from the automated methods. As noted above, these spectra could acceptably be assigned to either class, good or outlier, by an automated method, and so we do not analyze these cases in detail in the present work. It can be noted though, as shown in Table 6, that the recursive method is more sensitive than the other two automated methods, declaring more of these spectra to be outliers than the other two methods (13 outliers out of 26 for the recursive method, compared to 8 out of 26 for the other two methods).
4.3. Evaluation of Potential False Positive Results
The 16 spectra classified as outliers by either interactive analysis or the automated recursive method are shown in Figure 7. To provide context, the positions of these 16 spectra in a Principal Component Analysis (PCA) score plot for all 252 spectra are shown in Figure 8. The recursive method produced four potential “false positives” (spectra 31, 49, 69 and 173) that were interactively classified as good (score = 0), but nevertheless classified as outliers by the automated procedure.
Figure 7.
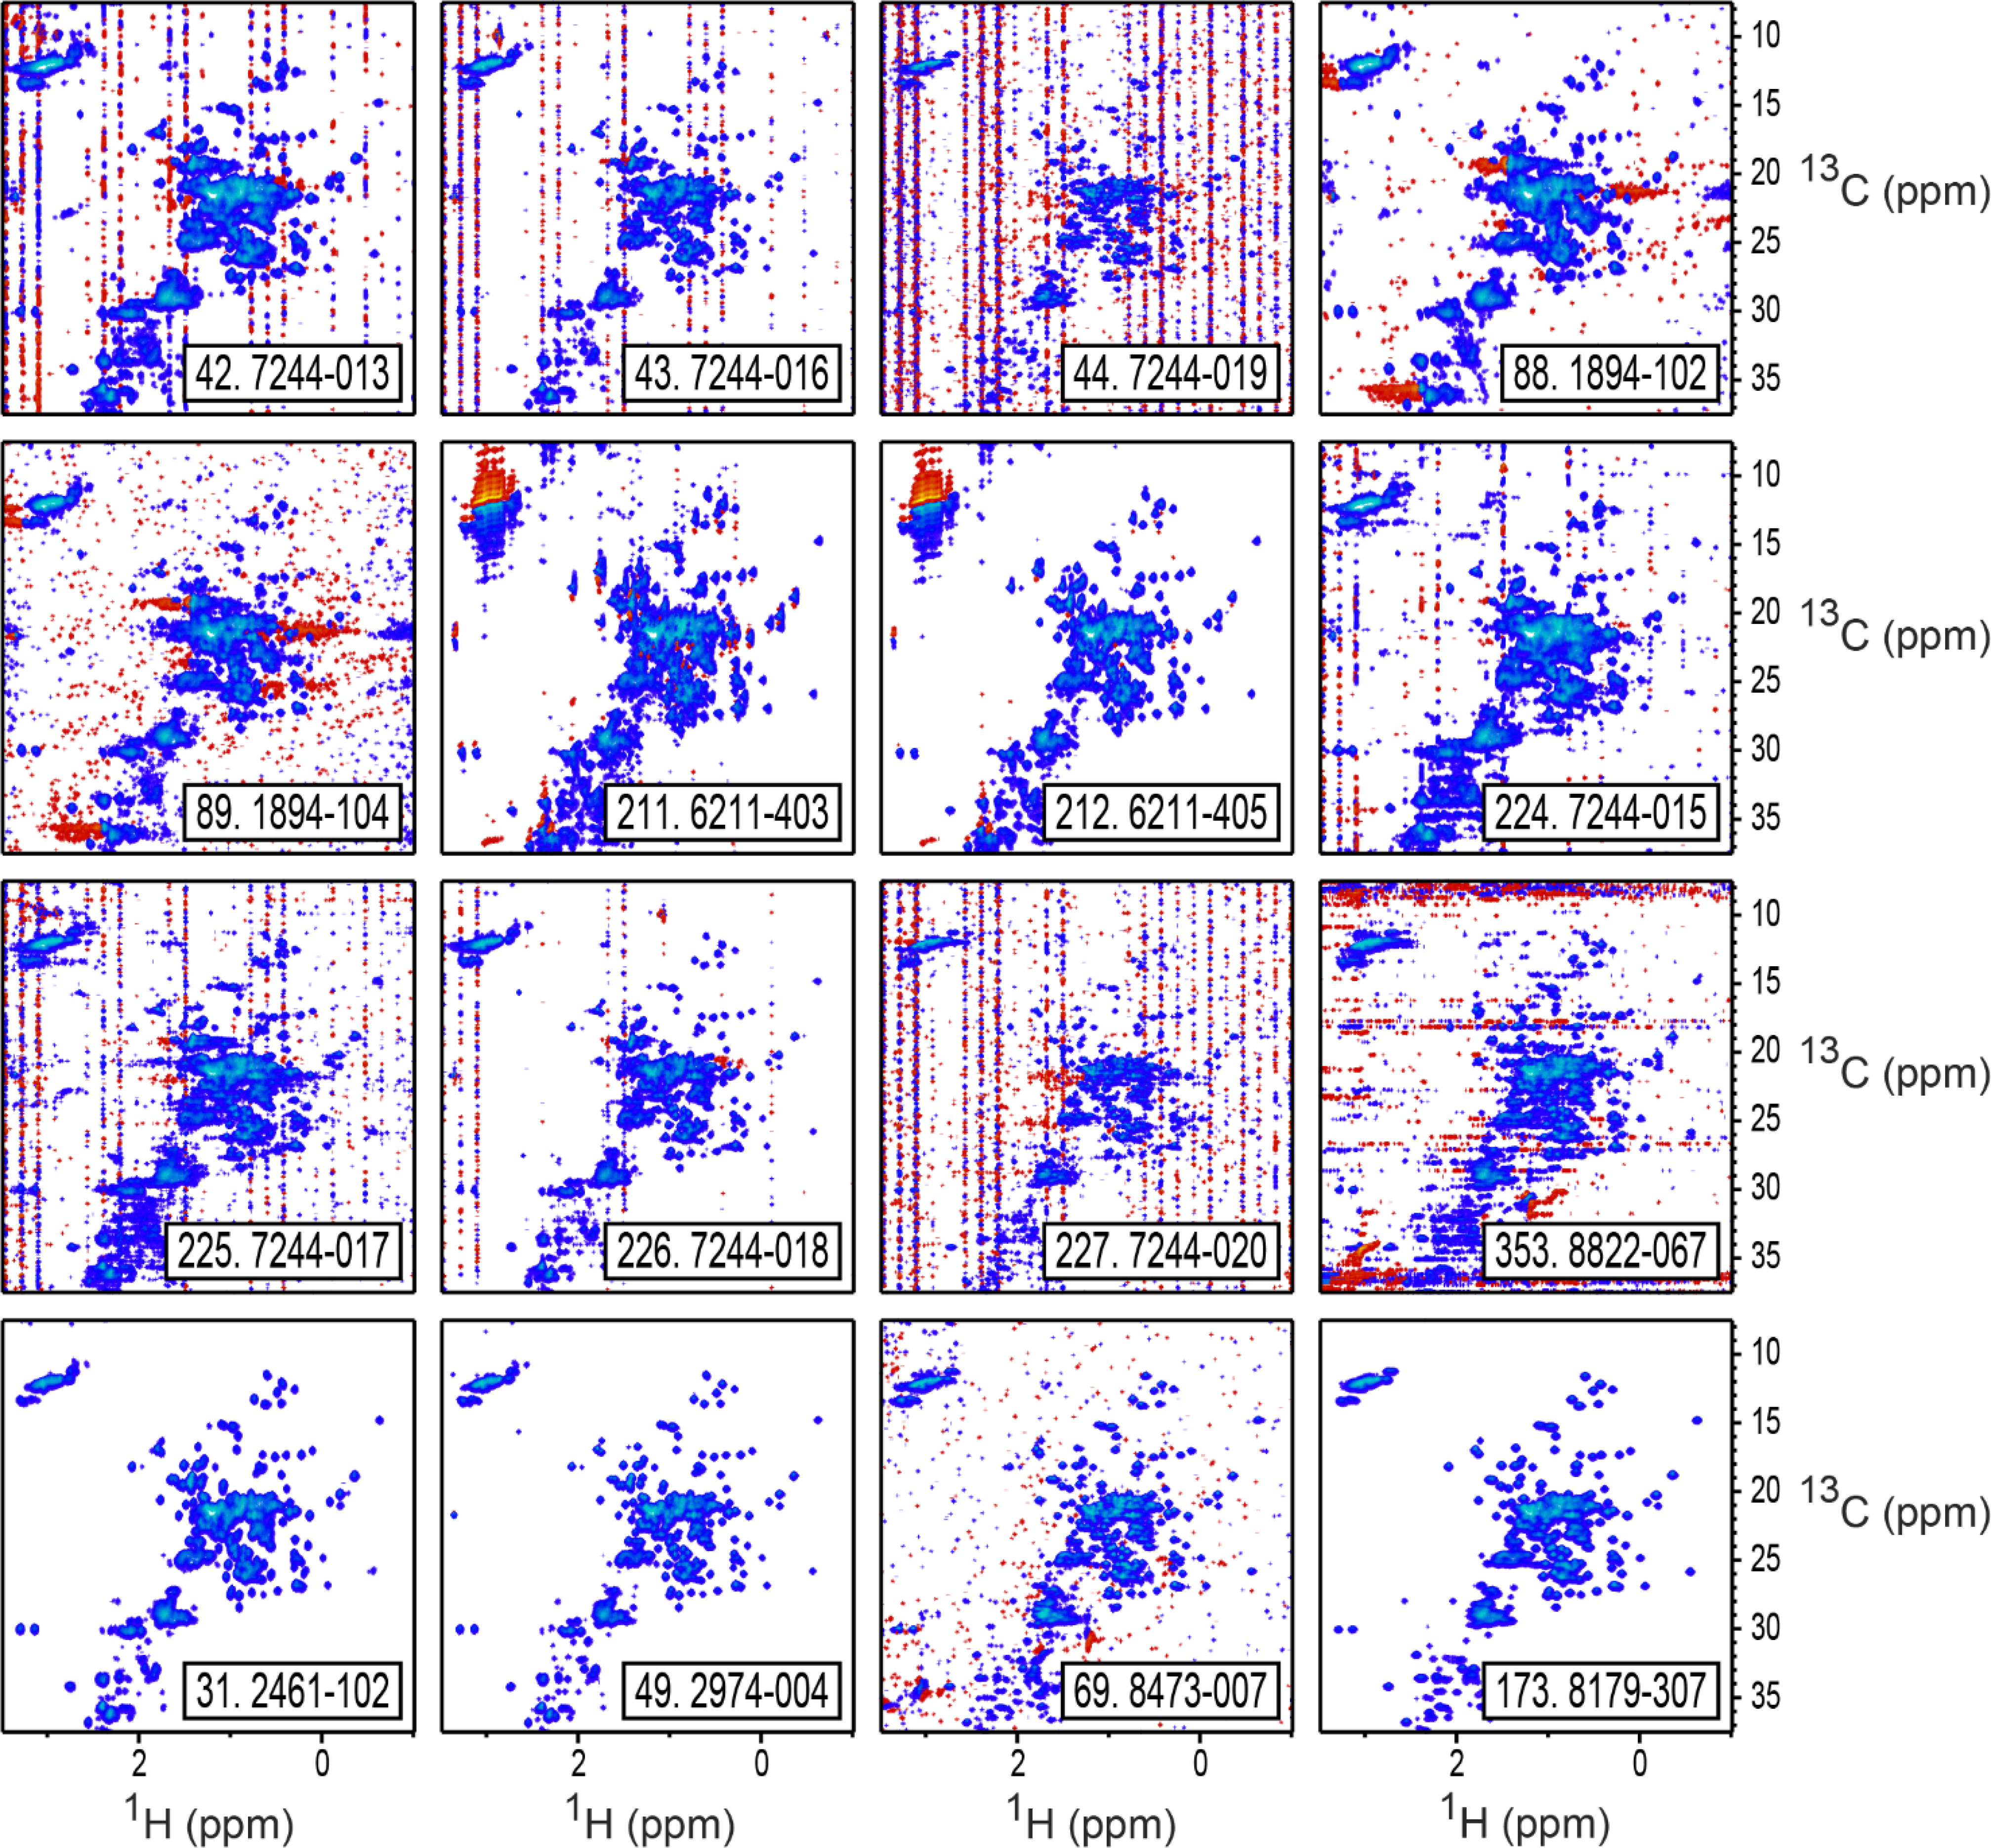
The 16 spectra classified as outliers either interactively or by the automated recursive method, as listed in Table 4. Contour levels start at 2.0% of maximum intensity, with positive intensities drawn in in blue shades, and negative intensities drawn in red shades. Spectra are labeled with their study index number and their laboratory and spectrum IDs. The bottom four spectra (31, 49, 69, and 173) are those that were classified as outliers only by the automated method, and not interactively. As shown here, spectrum 69 has worse than expected signal to noise, and should have been interactively classified as an outlier.
Figure 8.
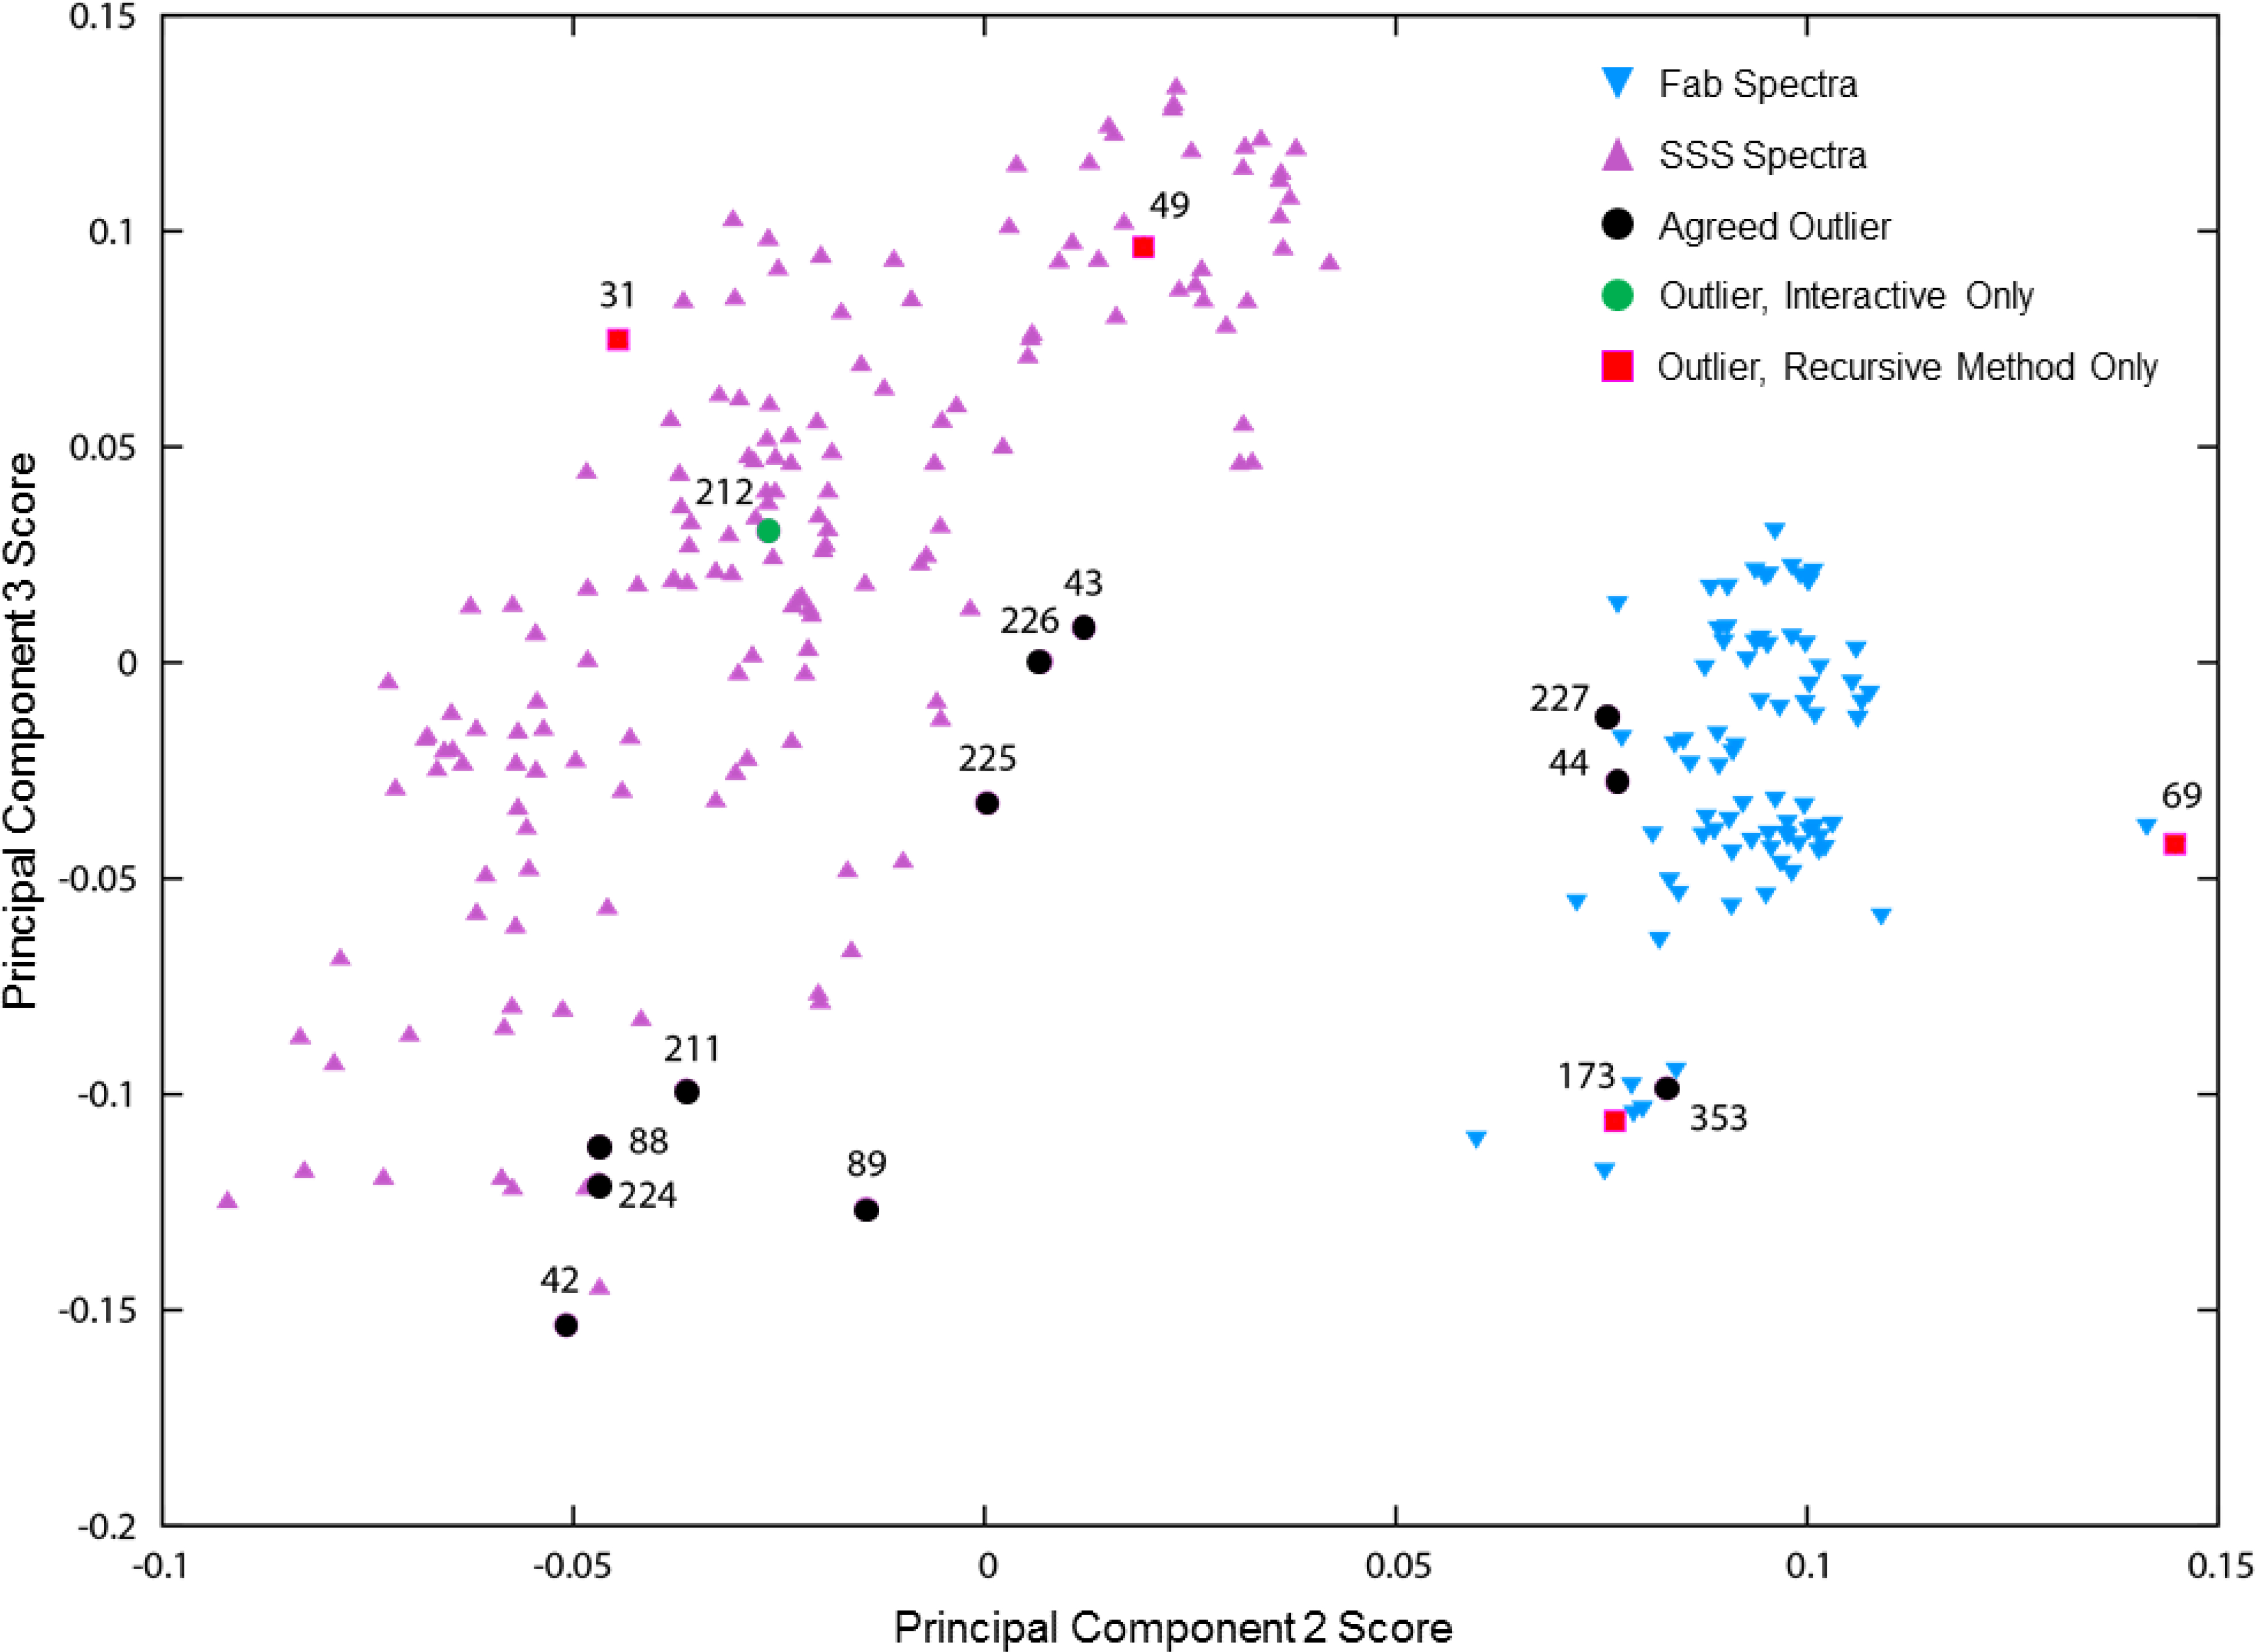
Principal Component Analysis (PCA) of all 252 spectra in the outlier analysis, labeled with the study index numbers of spectra classified as outliers either interactively or by the automated recursive method, as listed in Table 4. Agreed outliers are those classified as outliers by both interactive analysis and the recursive method. The PCA results cleanly separate spectra of the two samples, Fab and System Suitability Sample (SSS). Interestingly, most of the outliers tend to occur in the outer portions of these two clusters. PCA results were computed with the specView utility of NMRPipe[38], using the region of spectral intensities from 1H 1.9 ppm to −0.9 ppm, 13C 30.5 ppm to 9.0 ppm. Region were scaled to uniform maximum intensity, and used for PCA without binning and without centering (subtraction of the average).
Spectrum 69 (069-D3A-F-U-700–8473-007–37C) looks reasonable at higher contour levels, but when viewed at the lower contour levels of Figure 7, obviously has worse signal to noise than expected. Interestingly, spectrum 69 is also an “extreme” spectrum in the PCA results, having the largest component 2 score of any spectra in the PCA plot of Figure 8. On closer inspection, as shown in Figure 9A, spectrum 69 has small systematic distortions in lineshape. We therefore judge this to be an interactive misclassification (that is, this spectrum is a true outlier) not a misclassification by the recursive algorithm. Thus, in this case, the automated method highlighted an error in the interactive result. The remaining three spectra, 31 (031-D2A-S-U-800–2461-102–37C), 49 (049-D2C-S-U-750–2974-004–37C), and 173 (173-D3A-F-U-500–8179-307–37C), all show good quality contour plots with no conspicuous artifacts, so having these spectra classified as outliers is initially surprising.
Figure 9.
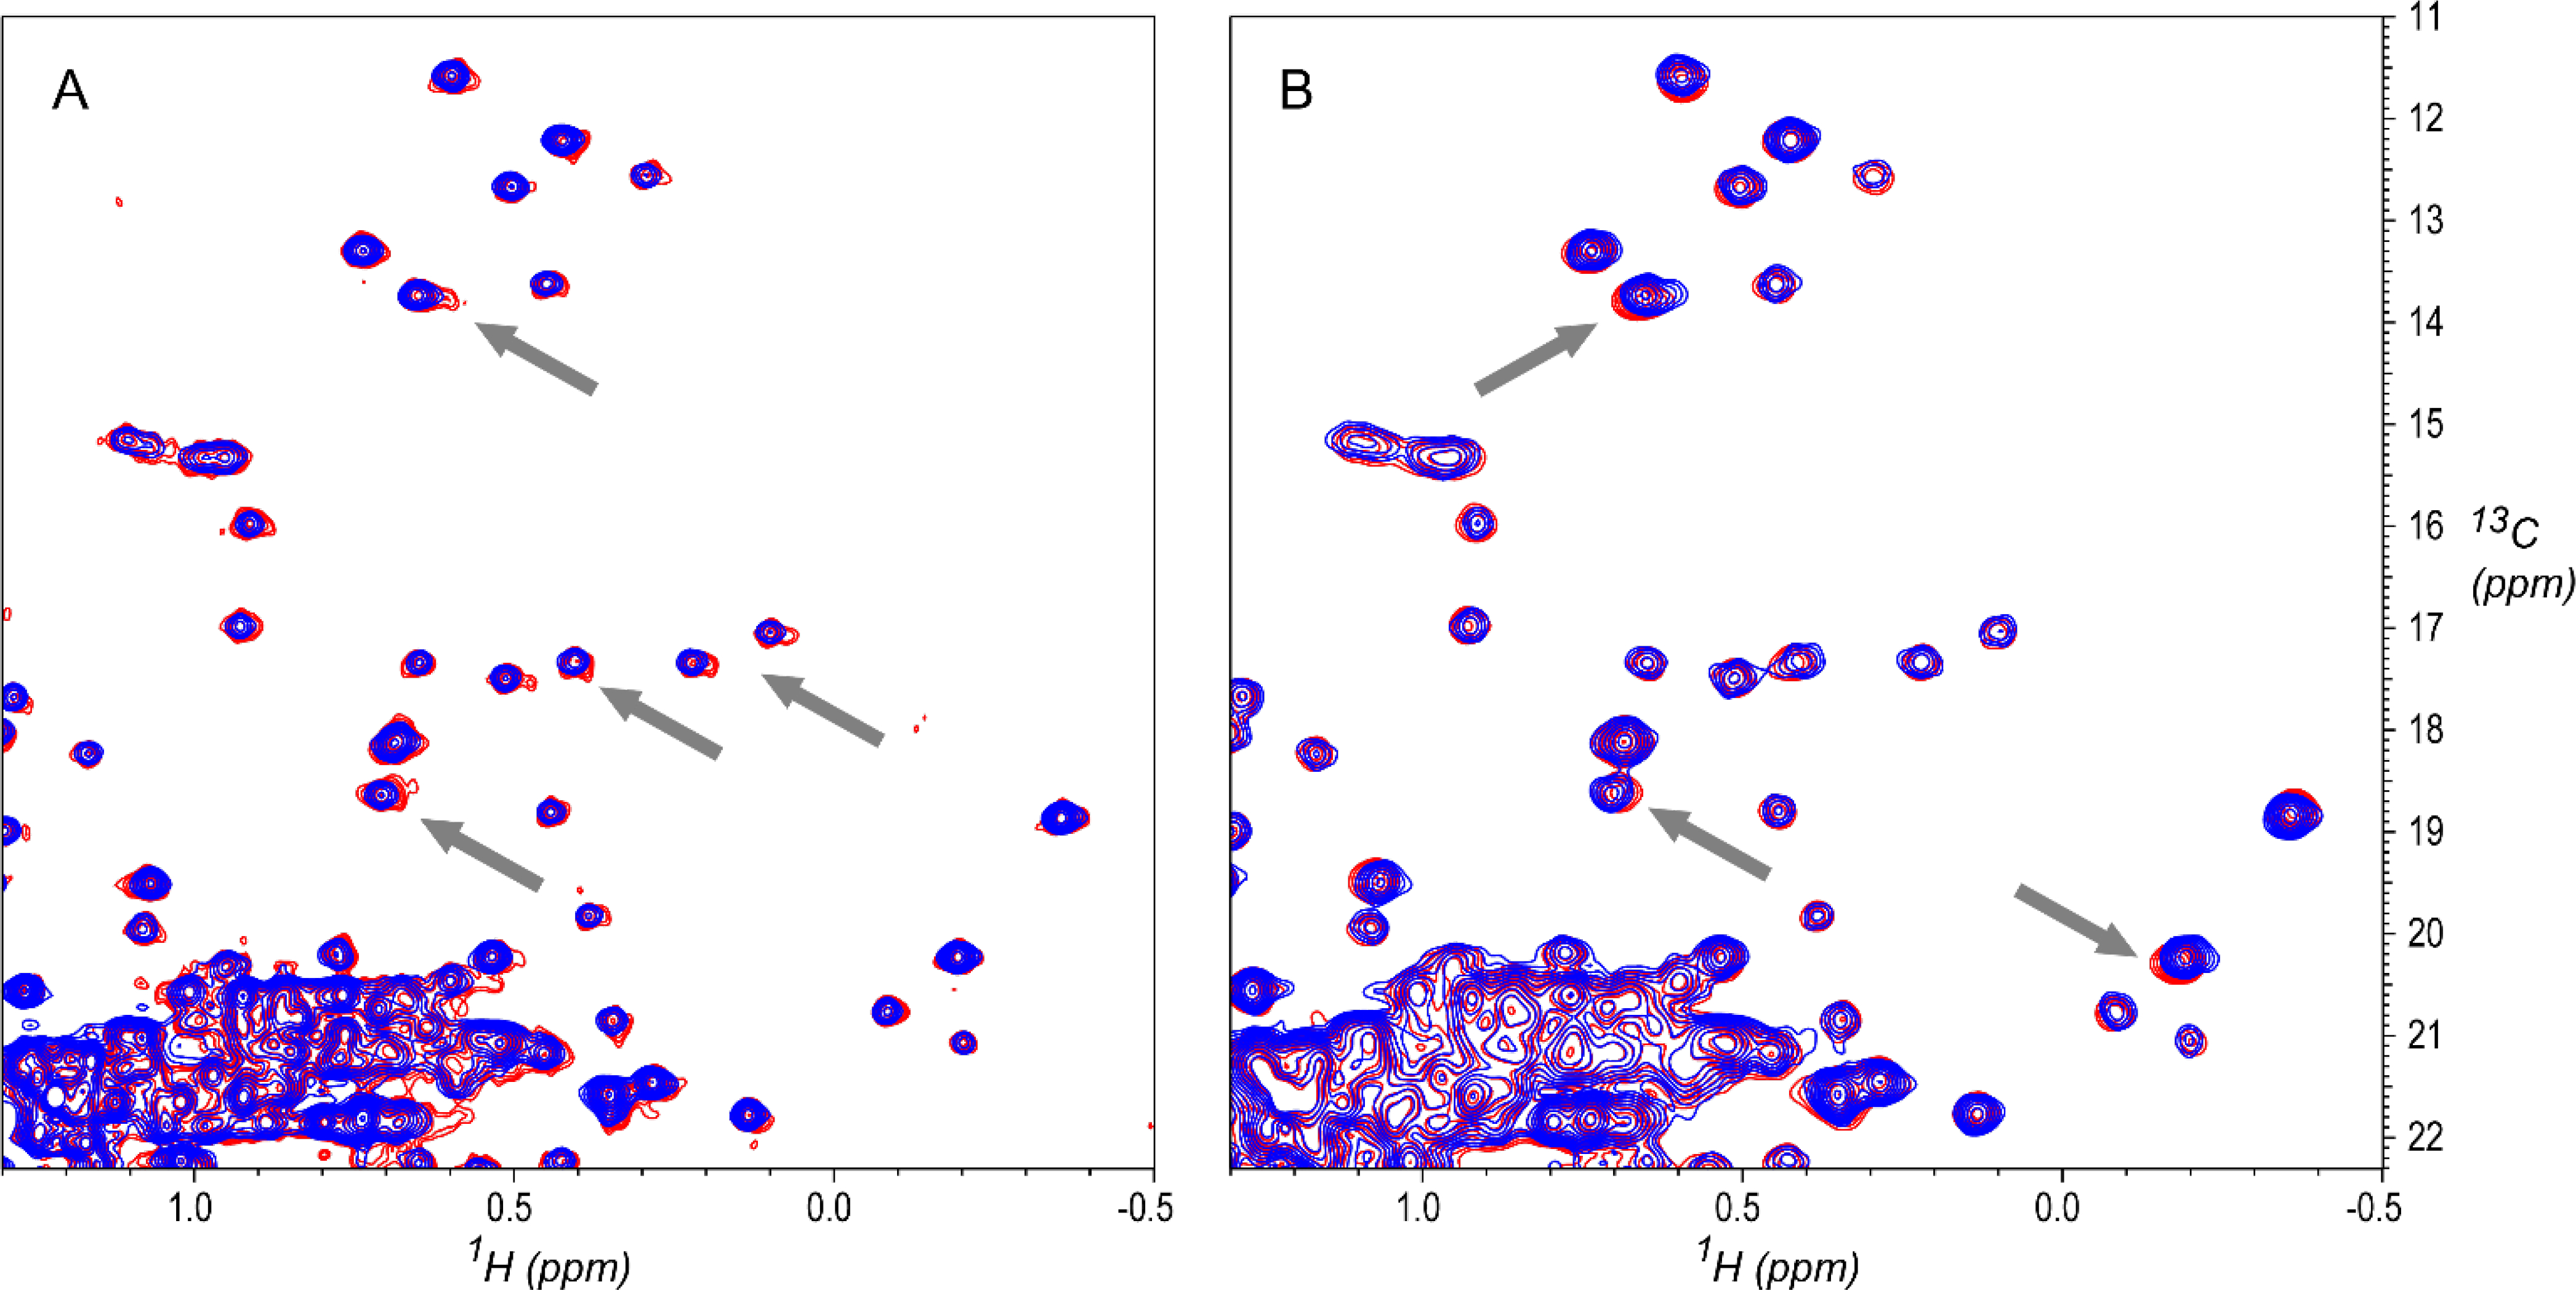
A: Overlay of outlier spectrum 69 (D3A-F-U-700–8473-007–37C) and a reference spectrum 76 (D3A-F-U-700–8543-007–37C). Spectrum 69 has small systematic lineshape distortions (examples at gray arrows). Spectrum 69 is also seen as an outlier in PCA results, with the largest component 2 score in the PCA plot of Figure 8. B: Overlay of outlier spectrum 173 (D3A-F-U-500–8179-307–37C, red) and a reference spectrum 177 (D3A-F-U-500–9966-006–37C, blue), showing changes in peak positions that are characteristic of different measurement temperatures (gray arrows). Spectrum 173 is one of several identified by Brinson et al. as a temperature outlier (a spectrum recorded at the wrong temperature).[2] Contours are drawn starting at 2.5% of maximum intensity.
In the PCA plot of Figure 8, spectrum 173 is near outlier spectrum 353 (353-D3B-F-N-600–8822-067–37C), in a sub-cluster away from the main body of the Fab spectra cluster. Brinson et al. have also identified spectrum 173 as one of the outliers of the study, as attributed to improper measurement temperature, with attendant changes in peak positions as shown in Figure 9B.[2] So, while spectrum 173 shows good visual quality, it is a true outlier due to measurement error, and does not belong in a group of spectra measured at 37 °C. In this case, the automated method highlighted an error in the initial labeling of the spectrum (e.g., it does not belong in the D3A low field class).
Spectrum 31 (031-D2A-S-U-800–2461-102–37C) is in class D2A,high with 12 spectra, one of which was visually identified as an outlier (spectrum 42, 042-D2A-S-U-800–7244-013–37C). Close inspection shows systematic intensity differences between spectrum 31 and the other six 800 MHz spectra in this class, as shown in Figure 10 and in Figures S3 and S4. Figure 10 shows an overlay plot of spectrum 31 and a representative spectrum (spectrum 28, 028-D2A-S-U-800–2146-002–37C), where many peaks in the methylene region of spectrum 31 are attenuated, and there is some evidence of changes in the methionine methyl region. These are signatures of the early stages of sample degradation and aggregation, where decreases in protein tumbling rates will broaden signals from the less mobile sidechain methylene groups more than signals from rapidly reorienting methyl groups. Figure S3 shows PCA results for the 12 spectra in this class, with both spectra 42 and 31 showing up as outliers having the largest component 2 and 3 scores respectively. Systematic variation is further highlighted by intensity versus intensity correlation plots, which can also be revealing of spectra differences.[39][40] As shown in Figure S4, which compares representative spectrum 28 versus the other six 800 MHz spectra in the class, the correlation plot for spectrum 28 versus known outlier spectrum 42 shows obvious systematic differences, and also gives the lowest correlation coefficient. The correlation plot for spectrum 31 also exhibits systematic differences, and has a lower correlation coefficient than for all the remaining 800 MHz spectra in this class. Lab 2461, the source of spectrum 31, had several problematic cases, with three other spectra classified as insufficient for CCSD analysis by Brinson et al. due to pulse program error.[2] Four spectra from this source were visually classified as intermediate quality, and two of these four were classified as outliers by the automated recursive method, as listed in Table 6. Accordingly, spectrum 31 is a true outlier, likely due to slight sample deterioration, representing another case where the automated method uncovered a systematic difference that was not initially apparent by visual inspection, nor, in previous analyses, was it discovered from PCA of peak positions.[2]
Figure 10.
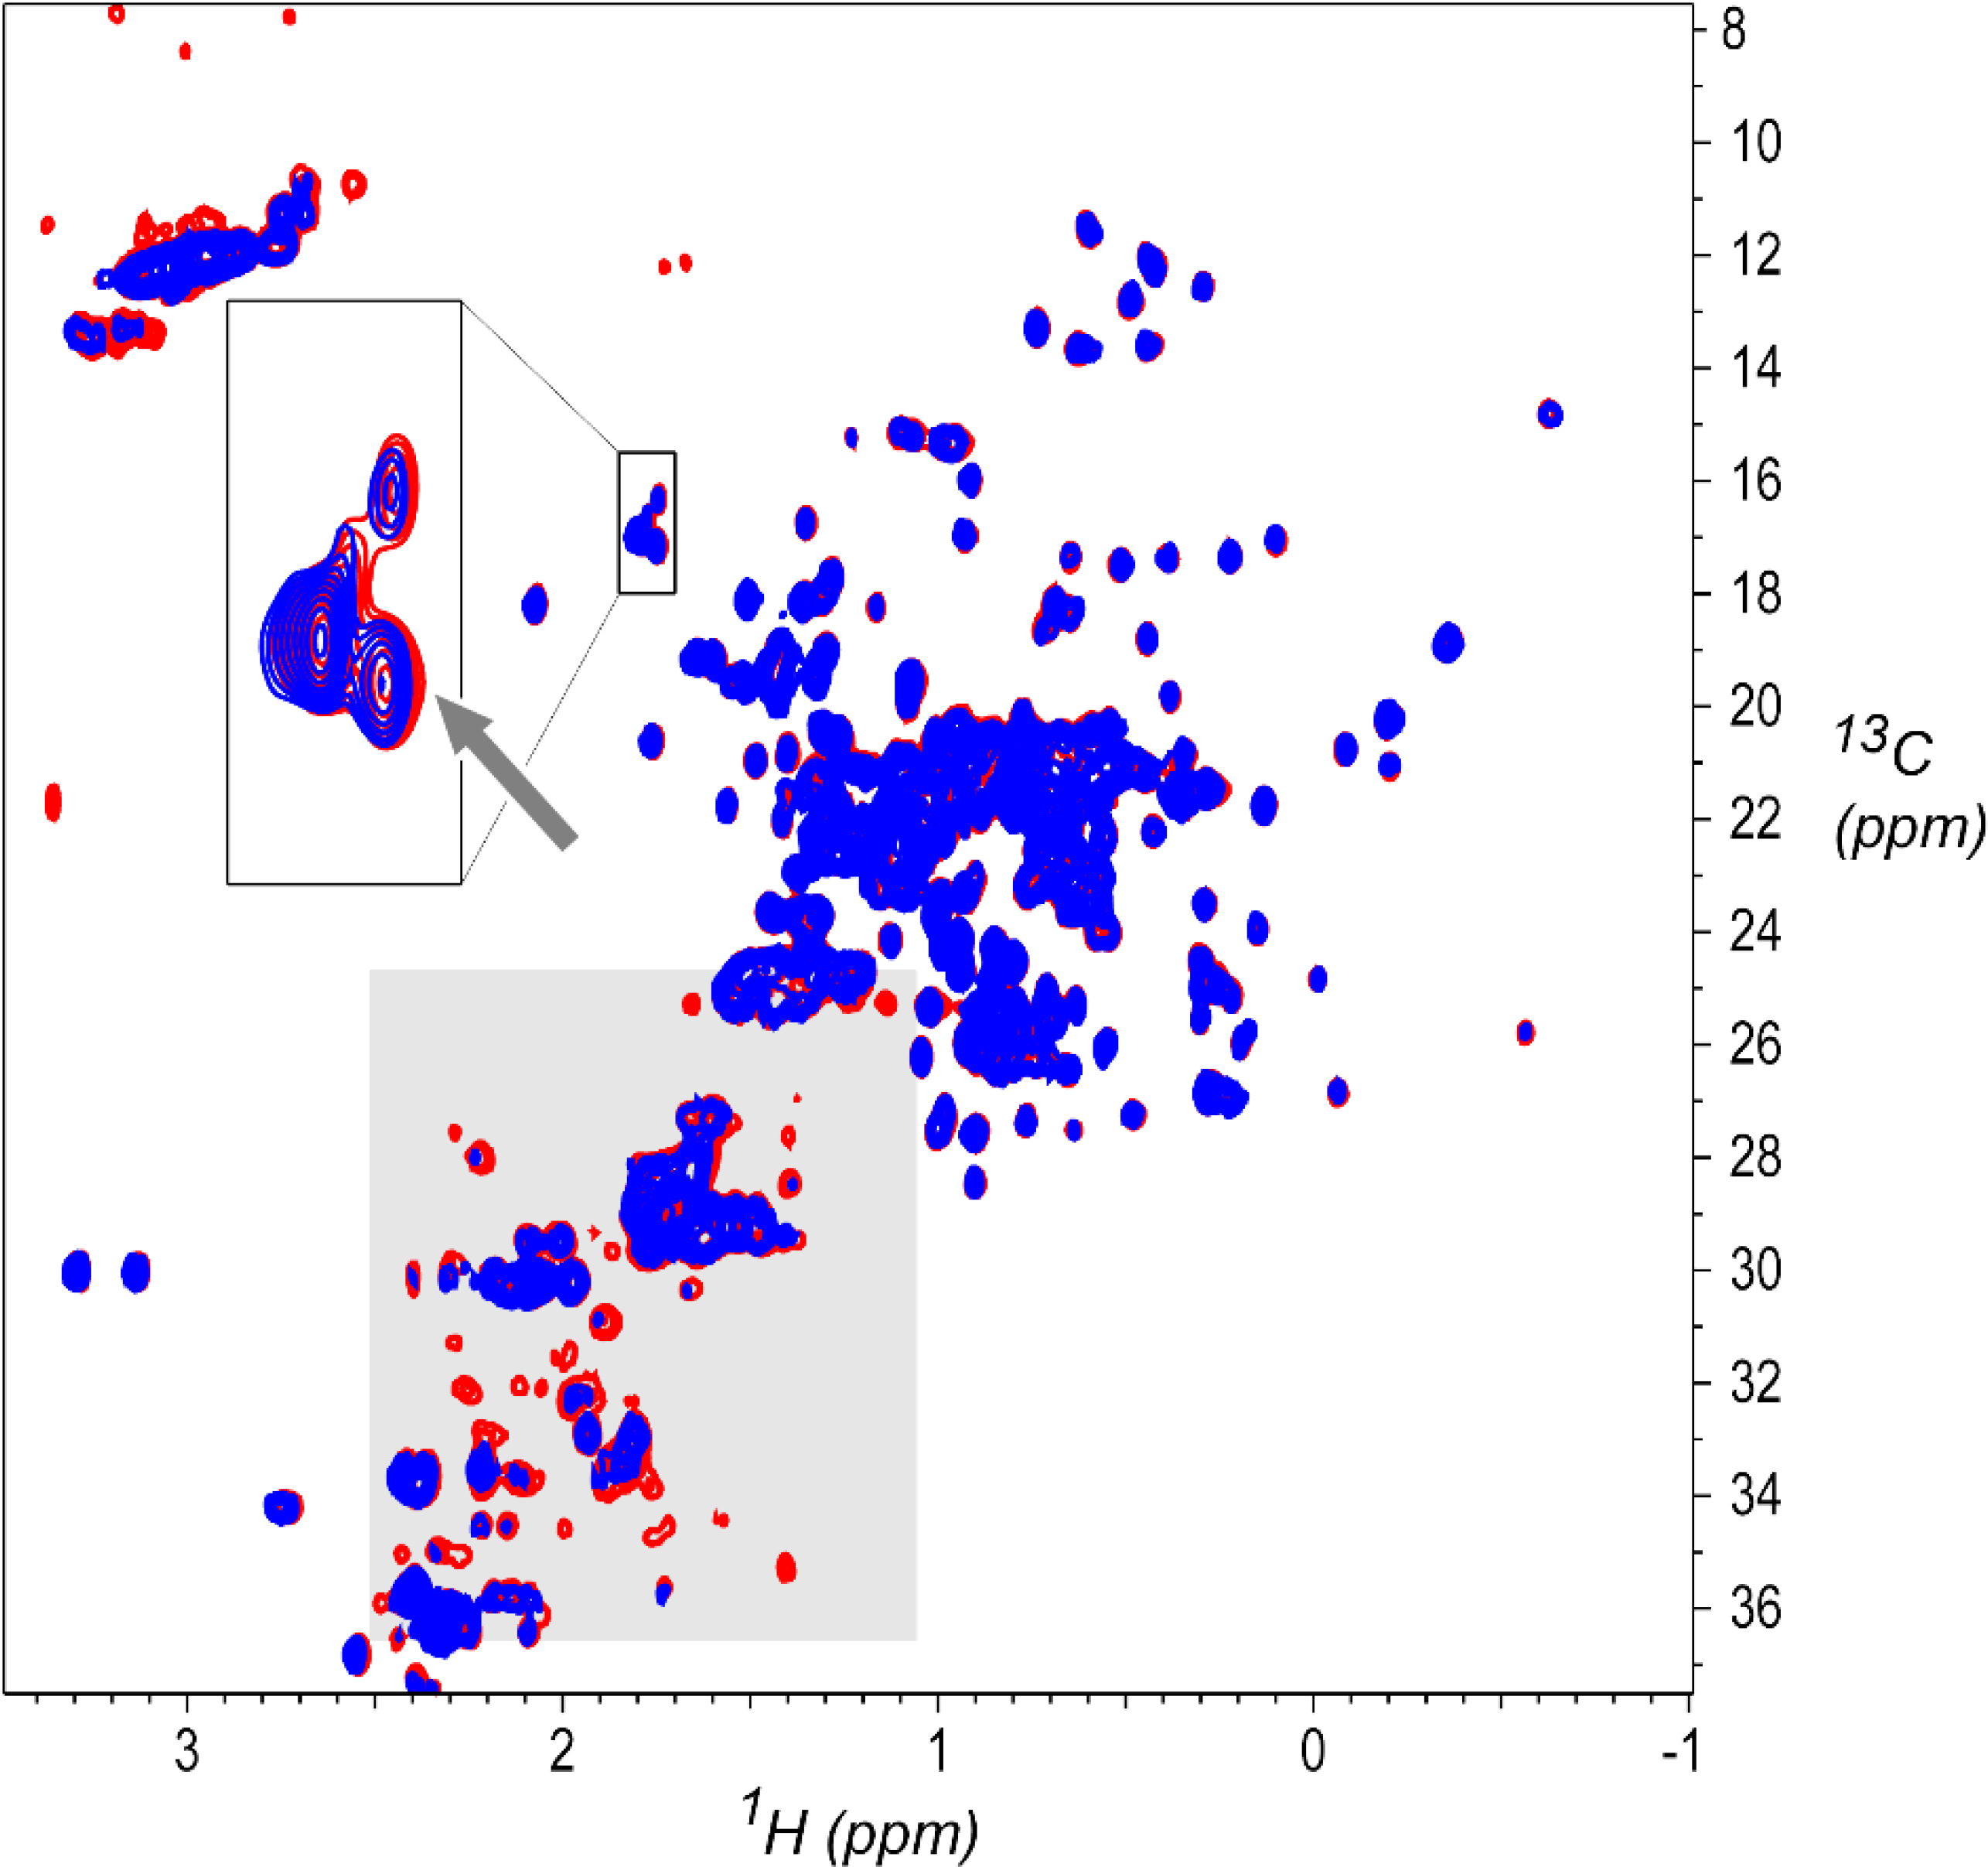
Overlay plot of potential outlier spectrum 31 (D2A-S-U-800–2461-102–37C, blue) and a representative spectrum from the same class (spectrum 28 D2A-S-U-800–2146-002–37C, red). The methylene region, shaded in gray, shows that peaks in spectrum 31 are attenuated, and there is some evidence of changes in the methionine methyl signals (gray arrow) expanded in the inset at the upper left. Contours are drawn starting at 2.5% of maximum intensity.
As with spectrum 31, spectrum 49 (049-D2C-S-U-750–2974-004–37C, in class D2C,mid with 7 spectra) shows good signal to noise, and no unexpected visual differences from the other spectra in this class; overlays of spectra 31 and the other six spectra are shown in Figure S5. This spectrum is therefore judged to be a true false positive result from the recursive classification method. The seven midfield classes have only six to nine spectra each. Because the outlier detection method depends on building a representative probability distribution for each group, and extracting a reliable mean and standard deviation, it is expected that the method will be less reliable for group sizes that are too small to represent the expected range of variation in spectra. The false positive classification of spectrum 49 is attributed to the small size of its class, where only one other 750 MHz spectrum is included.
4.5. Increasing the Group Sizes to Eliminate False Negative and False Positive Results
As described, the outlier detection requires that a group of spectra contains a limited fraction of outliers and a sufficient number of non-outliers to allow fitting of a representative lognormal distribution. When applied to the initial 21 groups, the automated recursive method produced one false negative classification for spectrum 212 in group D2B,high, and one false positive classification for spectrum 49 in class D2C,mid. In both cases, the classification error is attributed to insufficient number of non-outlier spectra, and this can be demonstrated by performing the classification on larger versions of these two problematic groups.
The D2B experimental protocol is a non-uniformly sampled (NUS) version of the D2A protocol, meaning that the NMR data measured in a D2B experiment is a subset of the data measured in a corresponding D2A experiment. It is therefore possible to resample and reprocess D2A NMR data so that it corresponds more closely to D2B protocol data. For demonstration purposes, we created a “D2AB,high” group, consisting of the original 13 D2B,high spectra augmented with 10 additional non-outlier D2A,high spectra, resampled and reprocessed to correspond with the D2B protocol. When this new, larger group is analyzed, spectrum 212 is now correctly classified as an outlier, along with previously identified outliers 211 and 224. The results for group D2AB,high are summarized in Table ST1.
Likewise, protocol D2E is a NUS version of protocol D2C, and for demonstration purposes, we created a new “D2CE” group, consisting of all 7 D2C,mid spectra, resampled and reprocessed to match the D2E protocol, combined with all 6 D2E,mid spectra. When this new, larger group is analyzed, none of the spectra are classified as outliers, eliminating the false positive classification of spectrum 49. The results for group D2CE,mid are summarized in Table ST2.
4.6. Limits of Applicability for the Outlier Detection Method
The single false positive was correctly reclassified when the group size was expanded from 7 to 13. The single false negative result occurred in a group of 13 spectra with 23% outliers, and this case was correctly reclassified when 10 additional spectra were included so that the fraction of known outliers was 13%, below the set detection limit of 15%. This suggests a rule of thumb that within the 15% outlier detection fraction, group sizes of around 10 to 15 spectra or more would be most appropriate for applying the automated outlier detection method to types of 1H,13C spectra measured in the study. Outlier analysis of the interlaboratory study data, which is extremely diverse, is somewhat different than typical use cases in a biopharma environment, where all data would more likely be measured using a single protocol at the same NMR field strength, or even on the same instrument. The specific requirements for number of measurements and the accuracy of classification will depend on the nature of the classification task and the expected variability in the spectra, and in practice would be verified by multiple measurements for a given use case.
5. Conclusions
We have described an automated, objective spectral outlier classification method that can be applied to 2D spectra used for characterization of biotherapeutics such as mAbs. The method uses the symmetric Kullback-Liebler divergence as a measure of spectral similarity. We benchmarked the method on 21 groups of spectra drawn from a collection of all 252 1H,13C gHSQC measurements from the NISTmAb International Multilaboratory NMR Study presented in 2019.[2] Groups were assigned by measurement details and NMR field strength so that spectra within a group are directly comparable. A recursive version of the automated outlier detection performed better than visual analysis, producing one false positive classification and one false negative classification, but identifying three outlier cases due to measurement or sample that were missed by the human analyst. It was further demonstrated that the false positive and false negative cases were due to insufficient group size, with best results achieved when groups contain 10 to 15 or more non-outliers, and less than 15% outliers total.
Since the automated method works directly on the matrix of spectral intensities, it is well suited to determine whether spectra are of sufficient quality for further direct analysis of the spectral matrix such as by PCA. As with PCA, the automated outlier classification method is sensitive to spectral differences that cannot readily be judged by eye. In addition, the details and parameters of the automated method can be varied to reduce false positive or false negative classifications, according to the needs of a given task. Since the outlier detection is in practice a method for deciding whether or not a given spectrum belongs to a group, this outlier detection method can be re-purposed for other types of supervised classification, and this will be explored in future work. In total, this automated method represents a distinct advance in chemometric detection of outliers due to variation of both measurement and sample.
Supplementary Material
Abbreviations
- 1D
one-dimensional
- 2D
two-dimensional
- CCSD
combined chemical shift deviation
- Fab
monoclonal antibody Fab domain
- gHSQC
gradient-selected heteronuclear single quantum coherence spectrum
- HOS
high order structure
- KL
Kullback-Liebler divergence
- mAb
monoclonal antibody
- NMR
nuclear magnetic resonance spectroscopy
- NIST
National Institute of Standards and Technology
- NUS
non-uniformly sampled
- PCA
principal component analysis
- PLS
partial least squares regression
- PTM
post-translational modification
- US
uniformly sampled
Footnotes
Declaration of Interest
The authors have no competing interests to declare.
NIST Disclaimer
Certain commercial equipment, instruments, and materials are identified in this paper in order to specify the experimental procedure. Such identification does not imply recommendation or endorsement by the National Institute of Standards and Technology, nor does it imply that the material or equipment identified is necessarily the best available for the purpose.
References
- [1].“Monoclonal Antibody Market 2019–2025 Growth, Key Players, Size, Demands and Forecasts - Reuters.” [Online]. Available: https://www.reuters.com/brandfeatures/venture-capital/article?id=101636. [Accessed: 27-Sep-2019].
- [2].Brinson RG et al. , “Enabling adoption of 2D-NMR for the higher order structure assessment of monoclonal antibody therapeutics,” MAbs, vol. 11, no. 1, pp. 94–105, January. 2019. [DOI] [PMC free article] [PubMed] [Google Scholar]
- [3].Lagassé HAD et al. , “Recent advances in (therapeutic protein) drug development.,” F1000Research, vol. 6, p. 113, 2017. [DOI] [PMC free article] [PubMed] [Google Scholar]
- [4].Ling WL, “Development of protein-free medium for therapeutic protein production in mammalian cells: recent advances and perspectives,” Pharm. Bioprocess, vol. 3, no. 3, pp. 215–226, June. 2015. [Google Scholar]
- [5].Aubin Y et al. , “Higher order structure of proteins in biopharmaceutical development,” Pharmacopeial Forum, vol. 43, no. 6, November. 2017. [Google Scholar]
- [6].Berkowitz SA, Engen JR, Mazzeo JR, and Jones GB, “Analytical tools for characterizing biopharmaceuticals and the implications for biosimilars,” Nat. Rev. Drug Discov, vol. 11, no. 7, pp. 527–540, July. 2012. [DOI] [PMC free article] [PubMed] [Google Scholar]
- [7].Orphanou C and Gervais D, “Higher-order structure and conformational change in biopharmaceuticals,” J. Chem. Technol. Biotechnol, vol. 93, no. 9, pp. 2477–2485, September. 2018. [Google Scholar]
- [8].Walsh G, “Post-translational modifications of protein biopharmaceuticals,” Drug Discov. Today, vol. 15, no. 17–18, pp. 773–780, September. 2010. [DOI] [PubMed] [Google Scholar]
- [9].Higel F, Seidl A, Sörgel F, and Friess W, “N-glycosylation heterogeneity and the influence on structure, function and pharmacokinetics of monoclonal antibodies and Fc fusion proteins,” Eur. J. Pharm. Biopharm, vol. 100, pp. 94–100, March. 2016. [DOI] [PubMed] [Google Scholar]
- [10].Courtois F, Schneider CP, Agrawal NJ, and Trout BL, “Rational Design of Biobetters with Enhanced Stability,” J. Pharm. Sci, vol. 104, no. 8, pp. 2433–2440, August. 2015. [DOI] [PubMed] [Google Scholar]
- [11].Courtois F, Agrawal NJ, Lauer TM, and Trout BL, “Rational design of therapeutic mAbs against aggregation through protein engineering and incorporation of glycosylation motifs applied to bevacizumab,” MAbs, vol. 8, no. 1, pp. 99–112, January. 2016. [DOI] [PMC free article] [PubMed] [Google Scholar]
- [12].Anderl J, Faulstich H, Hechler T, and Kulke M, “Antibody–Drug Conjugate Payloads,” in Methods in molecular biology (Clifton, N.J.), vol. 1045, 2013, pp. 51–70. [DOI] [PubMed] [Google Scholar]
- [13].Vulto AG and Jaquez OA, “The process defines the product: what really matters in biosimilar design and production?,” Rheumatology (Oxford), vol. 56, no. suppl_4, pp. iv14–iv29, 2017. [DOI] [PMC free article] [PubMed] [Google Scholar]
- [14].Li W et al. , “Structural Elucidation of Post-Translational Modifications in Monoclonal Antibodies,” 2015, pp. 119–183. [Google Scholar]
- [15].Jefferis R, “Posttranslational Modifications and the Immunogenicity of Biotherapeutics,” J. Immunol. Res, vol. 2016, pp. 1–15, April. 2016. [DOI] [PMC free article] [PubMed] [Google Scholar]
- [16].Aubin Y, Gingras G, and Sauvé S, “Assessment of the Three-Dimensional Structure of Recombinant Protein Therapeutics by NMR Fingerprinting: Demonstration on Recombinant Human Granulocyte Macrophage-Colony Stimulation Factor,” Anal. Chem, vol. 80, no. 7, pp. 2623–2627, April. 2008. [DOI] [PubMed] [Google Scholar]
- [17].Chen K, Freedberg DI, and Keire DA, “NMR profiling of biomolecules at natural abundance using 2D 1H–15N and 1H–13C multiplicity-separated (MS) HSQC spectra,” J. Magn. Reson, vol. 251, pp. 65–70, February. 2015. [DOI] [PMC free article] [PubMed] [Google Scholar]
- [18].Poppe L, Jordan JB, Lawson K, Jerums M, Apostol I, and Schnier PD, “Profiling Formulated Monoclonal Antibodies by 1 H NMR Spectroscopy,” Anal. Chem, vol. 85, no. 20, pp. 9623–9629, October. 2013. [DOI] [PubMed] [Google Scholar]
- [19].Arbogast LW, Brinson RG, and Marino JP, “Mapping Monoclonal Antibody Structure by 2D 13 C NMR at Natural Abundance,” Anal. Chem, vol. 87, no. 7, pp. 3556–3561, April. 2015. [DOI] [PubMed] [Google Scholar]
- [20].Arbogast LW, Brinson RG, and Marino JP, “Application of Natural Isotopic Abundance 1H–13C- and 1H–15N-Correlated Two-Dimensional NMR for Evaluation of the Structure of Protein Therapeutics,” 2016, pp. 3–34. [DOI] [PubMed] [Google Scholar]
- [21].Panjwani N, Hodgson DJ, Sauvé S, and Aubin Y, “Assessment of the Effects of pH, Formulation and Deformulation on the Conformation of Interferon Alpha-2 by NMR,” J. Pharm. Sci, vol. 99, no. 8, pp. 3334–3342, August. 2010. [DOI] [PubMed] [Google Scholar]
- [22].Hodgson DJ, Ghasriani H, and Aubin Y, “Assessment of the higher order structure of Humira®, Remicade®, Avastin®, Rituxan®, Herceptin®, and Enbrel® by 2D-NMR fingerprinting,” J. Pharm. Biomed. Anal, vol. 163, pp. 144–152, January. 2019. [DOI] [PubMed] [Google Scholar]
- [23].Chen K, Long DS, Lute SC, Levy MJ, Brorson KA, and Keire DA, “Simple NMR methods for evaluating higher order structures of monoclonal antibody therapeutics with quinary structure,” J. Pharm. Biomed. Anal, vol. 128, pp. 398–407, September. 2016. [DOI] [PMC free article] [PubMed] [Google Scholar]
- [24].Japelj B, Ilc G, Marušič J, Senčar J, Kuzman D, and Plavec J, “Biosimilar structural comparability assessment by NMR: from small proteins to monoclonal antibodies,” Sci. Rep, vol. 6, no. 1, p. 32201, October. 2016. [DOI] [PMC free article] [PubMed] [Google Scholar]
- [25].Ghasriani H et al. , “Precision and robustness of 2D-NMR for structure assessment of filgrastim biosimilars,” Nat. Biotechnol, vol. 34, no. 2, pp. 139–141, February. 2016. [DOI] [PMC free article] [PubMed] [Google Scholar]
- [26].Arbogast LW, Delaglio F, Tolman JR, and Marino JP, “Selective suppression of excipient signals in 2D 1H–13C methyl spectra of biopharmaceutical products,” J. Biomol. NMR, vol. 72, no. 3–4, pp. 149–161, December. 2018. [DOI] [PubMed] [Google Scholar]
- [27].Taraban MB, DePaz RA, Lobo B, and Yu YB, “Water Proton NMR: A Tool for Protein Aggregation Characterization,” Anal. Chem, vol. 89, no. 10, pp. 5494–5502, May 2017. [DOI] [PubMed] [Google Scholar]
- [28].Marino JP et al. , “Emerging Technologies To Assess the Higher Order Structure of Monoclonal Antibodies,” 2015, pp. 17–43. [Google Scholar]
- [29].Arbogast LW, Delaglio F, Schiel JE, and Marino JP, “Multivariate Analysis of Two-Dimensional 1 H, 13 C Methyl NMR Spectra of Monoclonal Antibody Therapeutics To Facilitate Assessment of Higher Order Structure,” Anal. Chem, vol. 89, no. 21, pp. 11839–11845, November. 2017. [DOI] [PMC free article] [PubMed] [Google Scholar]
- [30].“nistmab-nmr home page | Institute for Bioscience and Biotechnology Research.” [Online]. Available: https://www.ibbr.umd.edu/groups/nistmab-nmr. [Accessed: 11-Feb-2019].
- [31].Schiel JE and Turner A, “The NISTmAb Reference Material 8671 lifecycle management and quality plan,” Anal. Bioanal. Chem, vol. 410, no. 8, pp. 2067–2078, March. 2018. [DOI] [PMC free article] [PubMed] [Google Scholar]
- [32].“NIST Monoclonal Antibody Reference Material 8671 | NIST.” [Online]. Available: https://www.nist.gov/programs-projects/nist-monoclonal-antibody-reference-material-8671. [Accessed: 11-Feb-2019].
- [33].Grzesiek S and Bax A, “The importance of not saturating water in protein NMR. Application to sensitivity enhancement and NOE measurements,” J. Am. Chem. Soc, vol. 115, no. 26, pp. 12593–12594, December. 1993. [Google Scholar]
- [34].“INTERNATIONAL CONFERENCE ON HARMONISATION OF TECHNICAL REQUIREMENTS FOR REGISTRATION OF PHARMACEUTICALS FOR HUMAN USE ICH HARMONISED TRIPARTITE GUIDELINE VALIDATION OF ANALYTICAL PROCEDURES: TEXT AND METHODOLOGY Q2(R1).”
- [35].Sheen DA, Rocha WFC, Lippa KA, and Bearden DW, “A scoring metric for multivariate data for reproducibility analysis using chemometric methods,” Chemom. Intell. Lab. Syst, vol. 162, pp. 10–20, March. 2017. [DOI] [PMC free article] [PubMed] [Google Scholar]
- [36].Kullback S and Leibler RA, “On Information and Sufficiency,” Ann. Math. Stat, vol. 22, no. 1, pp. 79–86, March. 1951. [Google Scholar]
- [37].Sheen David A., “interlab: A Python Module for Analyzing Interlaboratory Comparison Data,” J. Res. Natl. Inst. Stand. Technol, vol. 124, 2019. [DOI] [PMC free article] [PubMed] [Google Scholar]
- [38].Delaglio F, Grzesiek S, Vuister G, Zhu G, Pfeifer J, and Bax A, “NMRPipe: A multidimensional spectral processing system based on UNIX pipes,” J. Biomol. NMR, vol. 6, no. 3, pp. 277–293, November. 1995. [DOI] [PubMed] [Google Scholar]
- [39].Amezcua CA and Szabo CM, “Assessment of Higher Order Structure Comparability in Therapeutic Proteins Using Nuclear Magnetic Resonance Spectroscopy,” J. Pharm. Sci, vol. 102, no. 6, pp. 1724–1733, June. 2013. [DOI] [PubMed] [Google Scholar]
- [40].Arbogast LW, Brinson RG, Formolo T, Hoopes JT, and Marino JP, “2D 1HN, 15N Correlated NMR Methods at Natural Abundance for Obtaining Structural Maps and Statistical Comparability of Monoclonal Antibodies,” Pharm. Res, vol. 33, no. 2, pp. 462–475, February. 2016. [DOI] [PubMed] [Google Scholar]
Associated Data
This section collects any data citations, data availability statements, or supplementary materials included in this article.


