

Abstract
Objective:
To assess whether per capita buprenorphine distribution varies by regional racial/ethnic composition, Medicaid expansion status, and time period.
Methods:
Our unit of analysis -- three-digit ZIP codes (“ZIP3s”) -- was classified into quintiles based on percentage of White residents. A weighted linear regression model of buprenorphine distribution -- including White resident quintile, waivered prescriber rate, overdose rate, sociodemographic factors, and year fixed effects -- was estimated using national buprenorphine distribution data from 2007–2017. We report predictive margins of the buprenorphine distribution rate by quintile, as well as average marginal effects of waivered prescriber rate on buprenorphine distribution rate for each quintile. Analyses were stratified by Medicaid expansion status and time period (2007–2010, 2011–2014, 2015–2017).
Results:
Buprenorphine distribution increased nationally during 2007–2017, yet growth was disproportionately greater for ZIP3s with higher percentages of White residents. Medicaid expansion states exhibited significant differences in buprenorphine distribution across ZIP3 quintiles during 2007–2010, the magnitude of which increased across time periods. Non-expansion states exhibited significant quintile differences during 2011–2014 and 2015–2017. The average marginal effect of increasing the waivered prescriber rate on the distribution rate was consistently smaller in ZIP3s with lower percentages of White residents, particularly in expansion states.
Conclusions:
We find ecological evidence consistent with racial/ethnic disparities in buprenorphine distribution. Our finding that increasing the waivered prescriber rate had differential effects by ZIP3 racial/ethnic composition suggest that broad initiatives to increase the number of waivered prescribers are likely insufficient to achieve equitable buprenorphine access. Rather, targeted and tailored policy efforts are warranted.
Keywords: racial/ethnic disparities, buprenorphine, opioid use disorder, treatment
1. INTRODUCTION
The U.S. continues to face a profound opioid crisis; in 2018, an estimated 2 million individuals had an opioid use disorder (OUD) and opioid overdoses killed nearly 47,000 people (Centers for Disease Control and Prevention, 2019; SAMHSA, 2019). A critical component of the nation’s response is treatment for opioid use disorder with opioid agonist medications (e.g., buprenorphine, methadone), the gold standard for effective treatment (Mattick et al., 2009, 2014). Methadone can only be dispensed by federally-licensed opioid treatment programs (OTPs) (IOM, 1995); however, in addition to dispensation in OTPs, buprenorphine can be prescribed by any Drug Addiction Treatment Act (DATA) waivered clinician in varied outpatient settings. Prescribing buprenorphine in outpatient settings increases access, offers opportunities to screen and treat comorbid mental health and physical health conditions common in individuals with OUD, and may reduce the stigma often associated with specialty OUD treatment settings (Duncan et al., 2015; Hatcher et al., 2018; McLellan et al., 2014; Stein et al., 2015b).
Since buprenorphine’s approval for OUD treatment, the number of waivered prescribers and buprenorphine-providing treatment facilities has grown markedly (Mojtabai et al., 2019; Stein et al., 2015a; Wen et al., 2019), substantially increasing uptake of buprenorphine treatment (Oliva et al., 2013; Saloner et al., 2018; Sharp et al., 2018; Stein et al., 2015a). Nationally, many policies have been enacted to expand OUD treatment access, including efforts to expand insurance coverage for OUD treatment and increase the number of buprenorphine-waivered prescribers. For states that opted to expand Medicaid under the Patient Protection and Affordable Care Act (ACA), fully implemented as of January 2014, substance use disorder treatment was a required benefit for Medicaid plans (Saloner et al., 2018). The ACA has been associated with a significant growth in access to and uptake of buprenorphine treatment, with Medicaid expansion states experiencing larger increases in buprenorphine prescribing compared with non-expansion states (McKenna, 2017; Meinhofer and Witman, 2018; Saloner et al., 2018; Sharp et al., 2018).
Emerging evidence suggests that gains in buprenorphine treatment access have not been uniform across the U.S. An analysis of buprenorphine treatment among Medicare Part D beneficiaries found counties with a higher percentage of Black and Hispanic beneficiaries were less likely to have a buprenorphine prescriber compared to counties with a higher percentage of White beneficiaries (Abraham et al., 2019). A study using National Ambulatory Medical Care Survey and National Hospital Ambulatory Medical Care Survey data found that from 2004–2015 clinical visits for buprenorphine grew fastest among White individuals and those with private insurance or self-pay, compared to Black/Other race individuals and Medicare or Medicaid beneficiaries (Lagisetty et al., 2019). A recent cross-sectional study using substance use treatment facilities data found that the number of clinics with a buprenorphine-waivered prescriber, a measure of treatment capacity rather than utilization, was higher in counties with greater racial/ethnic residential segregation (Goedel et al., 2020).
Increasing the number of buprenorphine-waivered prescribers has been a key focus of efforts to expand buprenorphine access. While many waivered prescribers have a buprenorphine patient load well under their waiver limit (Thomas et al., 2017), prior studies have demonstrated a significant correlation between the per capita waivered prescriber rate and buprenorphine treatment (Wen et al., 2018). Nationally, the number of waivered prescribers continues to increase steadily (by 175% between 2016 and 2018), yet disparities in access persist – notably, the waivered prescriber rate is higher in urban areas and areas that have been more impacted by the opioid crisis (Ghertner, 2019). Given documented racial/ethnic disparities in buprenorphine treatment, it is currently an open question whether increasing the waivered prescriber rate has a differential impact on buprenorphine prescribing in geographic regions with varying racial/ethnic composition.
To address this gap in literature, we used national data from 2007–2017 to examine whether the per capita buprenorphine distribution rate, as well as the association between the waivered prescriber rate and buprenorphine distribution, vary across geographic regions with distinct racial/ethnic compositions. Given the notable impact of Medicaid expansion on buprenorphine use, we examined whether trends differed by Medicaid expansion status, stratifying our analyses both by expansion status and time period (i.e., pre-ACA, ACA implementation, post-ACA). Assessing potential racial/ethnic differences in buprenorphine distribution across the country is foundational to mitigating disparities and ensuring equitable access to evidence-based treatments for OUD.
2. METHODS
2.1. Data and measures
Data on the total volume of buprenorphine distributed each year from 2007 to 2017 were from the Automation of Reports and Consolidated Orders System (ARCOS), which tracks the transport of all controlled substances in the U.S. from the point of manufacturing, through commercial distribution, to DEA- and state-registered pharmacies, hospitals and other healthcare providers, including OTPs (Drug Enforcement Administration). Our analytic unit was the 3-digit zip code (henceforth “ZIP3”), the smallest geographic unit for which ARCOS reports data. The U.S. has a total of 929 ZIP3 regions (including military bases and U.S. territories, which were excluded from our study); these regions are defined as an aggregation of 5-digit zip codes that share the first 3 digits (see Figure 1). A very limited number of ZIP3 regions cross state lines. Our primary outcome was the per capita buprenorphine distribution rate, defined as grams per 100,000 ZIP3 residents. We classified ZIP3s depending on whether they were in a state that expanded Medicaid by the end of the study period. We considered three distinct periods: Pre-ACA (2007–2010), ACA implementation (2011–2014), and post-ACA (2015–2017).
Figure 1.
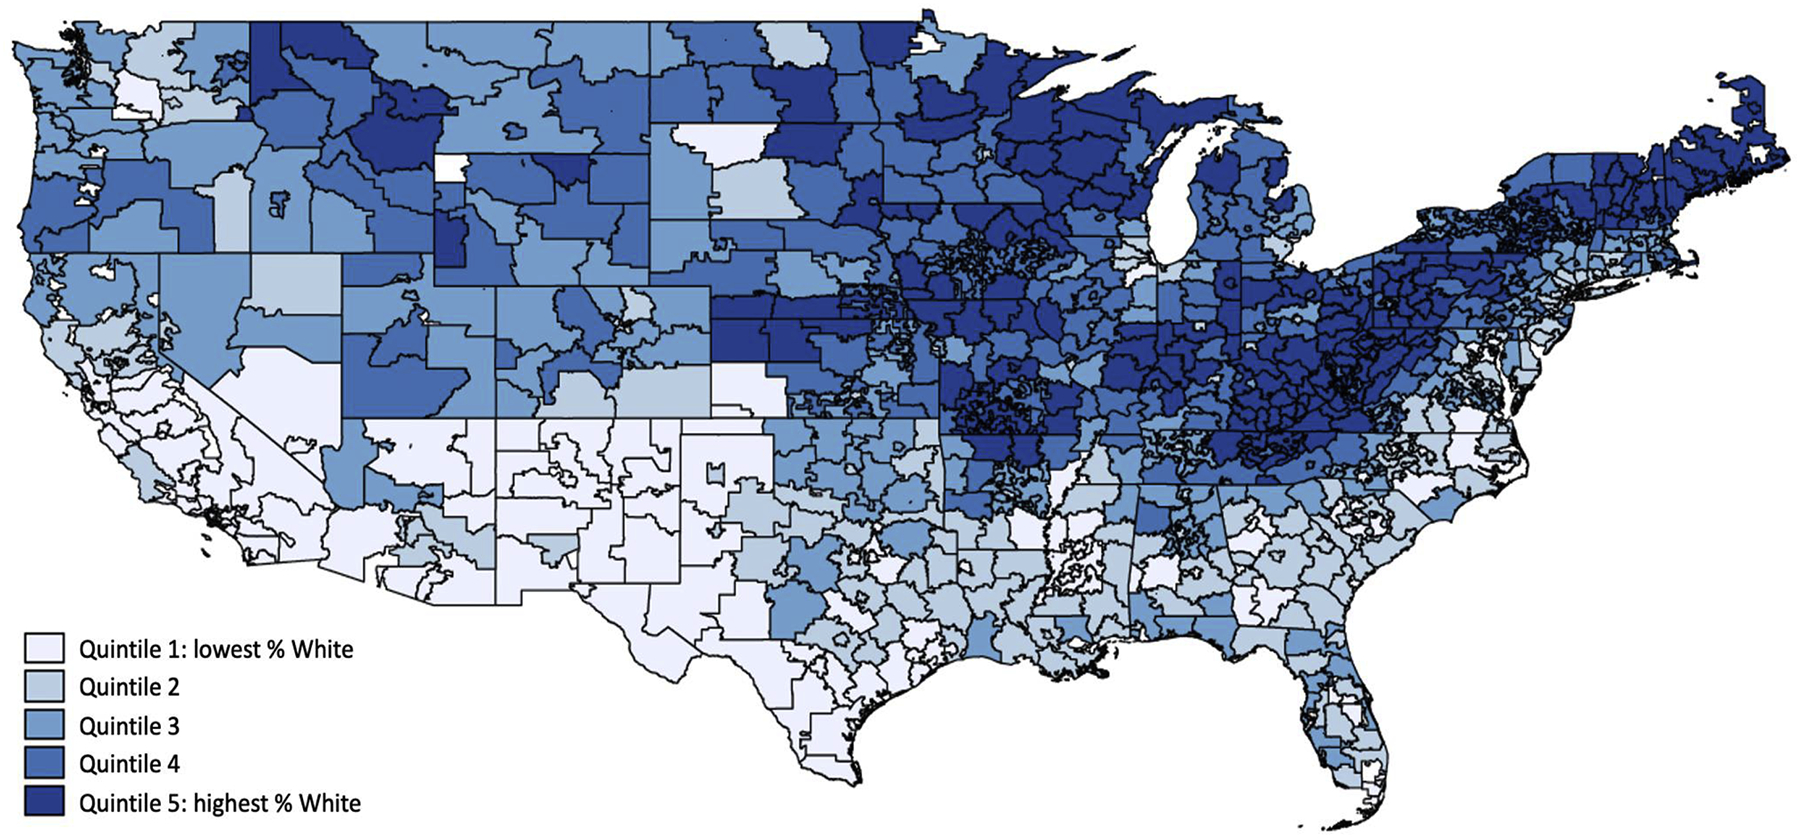
Map of ZIP3 regions, classified into quintiles based on % White residents
Annual county-level sociodemographic characteristic data were from the Health Resources & Service Administration’s Area Health Resources Files (AHRF). Race/ethnicity of county residents was measured as percentage of population identifying as each of four mutually-exclusive categories: non-Hispanic White, non-Hispanic Black, Hispanic, and other race/multiracial. Additional covariates included percentage of residents who are male; percentage under age 15; percentage aged 15–24; percentage with a high school diploma; percentage with a 4-year college degree; percentage unemployed; percentage under age 65 who are uninsured; and percentage of households below the federal poverty line. Additionally, urbanicity was classified based on Rural-Urban Continuum Codes (RUCC) codes that classify metropolitan areas: ZIP3s were classified as a metro region (versus non-metro) if all counties that comprised it were classified as RUCC code 1 (metro areas of 1 million population or more), 2 (metro areas of 250,000 to 1 million population) or 3 (metro areas of fewer than 250,000 population).
Additional covariates, hypothesized to be correlated with OUD prevalence, included per capita rate of buprenorphine-waivered prescribers and fatal drug overdose rate. The annual buprenorphine-waivered prescriber rate (per 100,000 county residents) was calculated using administrative data regarding the number of buprenorphine-waivered prescribers (physicians, nurse practitioners, and physician assistants) per county from the Substance Abuse and Mental Health Services Administration and the Federal Drug Enforcement Agency, augmented with information from the Pew Charitable Trusts and Deerfield Management (Duncan et al., 2020). County-level fatal drug overdose rates (per 100,000 residents) were obtained from the National Vital Statistics System Multiple Cause of Death mortality files from 2007–2017 (Centers for Disease Control and Prevention, 2019); we control for this as a proxy measure of OUD treatment need, similar to prior studies (Goedel et al., 2020; McBain et al., 2020). We used total drug overdose counts as they are more reliable than opioid-specific overdose counts at the county level (Jones CM et al., 2019); approximately 70% of all fatal overdoses involve opioids (Wilson et al., 2020).
We constructed ZIP3-level measures of opioid-related characteristics and sociodemographic characteristics by calculating the weighted average of county-level measures for all counties contained in a given ZIP3, with weights reflecting each county’s proportion of the total ZIP3 population. For counties that crossed ZIP3 boundaries, we disaggregated the county into 5-digit ZIP codes, assuming that county-level characteristics were constant across all component 5-digit ZIP codes, and calculated ZIP3 measures as a weighted average across 5-digit ZIP codes. This study was deemed exempt from review by RAND’s IRB.
2.2. Statistical analysis
For each year during 2007–2017, the 883 ZIP3s were classified into quintiles based on the percentage of residents that identified as White; quintile 5 comprised ZIP3s with the highest percentage of White residents (top 20% nationally). We calculated descriptive statistics of demographic characteristics as the population-weighted mean among ZIP3s in each quintile. Additionally, we calculated the annual per capita rate of buprenorphine distribution, buprenorphine-waivered prescribers, and fatal drug overdose among ZIP3s in each quintile, weighted for ZIP3 population (presented graphically).
We used a weighted linear regression model of buprenorphine distribution rate, with ZIP3-year as the unit of analysis. The model fully interacted White resident quintile, waivered prescriber rate, Medicaid expansion status, and time period, and controlled for sociodemographic factors, urbanicity (metro vs. non-metro), and one year-lagged fatal overdose rate. Robust standard error estimation was used to account for clustering at the ZIP3 level. Year fixed effects were included to account for temporal trends. We assessed potential collinearity across sociodemographic factors using variance inflation factors (VIF); all VIFs were less than 5, a more conservative threshold for collinearity, indicating that collinearity was not a concern.
Our primary outcome was the quintile-specific estimated buprenorphine distribution rate. These estimates were calculated based on our regression model, using Stata’s margins command, using the -over- option for Medicaid expansion status and time period. To assess differences in predictive margins across quintiles, contrast tests relative to quintile 5 (quintile with highest percentage of White residents) were estimated used the margins command. Our secondary outcome was the quintile-specific estimates of the effect of waivered prescriber rate were calculated using the margins -dydx- command, specifying the -over- option for quintile, Medicaid expansion status, and time period. All analyses used ZIP3-level population weights to produce nationally-representative estimates and to account for potential heteroskedasticity across ZIP3s arising from differences in population size. Analyses were conducted in Stata version 16.1. We emphasize that our analytic objectives were descriptive in nature, rather than causal; as such, we do not purport to estimate the impacts of Medicaid expansion.
In our primary analysis, we did not additionally control for other racial/ethnic categories (e.g., % Non-Hispanic Black residents), as that would obscure interpretation of the White resident quintiles. However, we conducted sensitivity analyses to investigate whether the relationship between buprenorphine distribution and % White residents varied between geographic areas for which there was a larger Black population or a larger Hispanic population. We stratified our sample into ZIP3s for which % Black residents was greater than % Hispanic residents (n=340) and ZIP3s for which % Black residents was less than % Hispanic residents (n=543). As an additional sensitivity analysis, we excluded the most rural ZIP3s, namely the 49 ZIP3s comprised of counties exclusively classified as RUCC 6 (Nonmetro: urban population of 2,500 to 19,999, adjacent to a metro area) through RUCC 9 (Nonmetro: completely rural or less than 2,500 urban population, not adjacent to a metro area). Result of sensitivity analyses are presented in the Appendix.
3. RESULTS
3.1. ZIP3 sociodemographic characteristics
Nationally, during 2015–2017, the average ZIP3 proportion of White residents was 61.4% (Table 1). ZIP3s were classified into quintiles based on the % of White residents. The quintile cut-points and means were as follows: quintile 1 (lowest percentage of White residents) range = [7.3–53.4%], mean = 37.7%; quintile 2 range= [53.5–69.5%], mean = 61.4%; quintile 3 range = [69.6–81.6%], mean = 75.3%; quintile 4 range = [81.7–89.6%], mean = 85.0%; quintile 5 (highest percentage of White residents) range = [89.7–97.6%], mean = 92.1%. Quintiles differed significantly on urbanicity: 74.9% of ZIP3s in quintile 1 were in metro areas compared to only 2.1% of ZIP3s in quintile 5. Household poverty was highest in quintile 1 (16.1%) and second-highest in quintile 5 (14.3%). Quintile 1 ZIP3s had the highest rate of uninsured individuals under age 65 (12.1%). We observe geographic patterning across quintiles (Figure 1), with quintile 1 ZIP3s more commonly occurred in the South and Southwest, whereas quintile 1 ZIP3s more commonly occurred in the Northeast and Midwest. See Appendix Table 1 for ZIP3 sociodemographic characteristics by Medicaid expansion status and time period.
Table 1.
Sociodemographic characteristics of 883 ZIP3 regions for 2015–2017 time period, overall and by quintiles defined by % White residents
| Overall | Quintile 1: Lowest % White | Quintile 2 | Quintile 3 | Quintile 4 | Quintile 5: Highest % White | |
|---|---|---|---|---|---|---|
| n=883 | n=177 | n=177 | n=176 | n=177 | n=176 | |
| Racial/ethnic composition | ||||||
| % Non-Hispanic White | 61.4 | 37.7 | 61.4 | 75.3 | 85.0 | 92.1 |
| % Non-Hispanic Black | 12.2 | 16.4 | 15.9 | 9.2 | 4.8 | 2.1 |
| % Hispanic | 17.9 | 33.2 | 14.7 | 9.1 | 5.5 | 2.6 |
| % Non-Hispanic other race/multiracial | 8.5 | 12.6 | 8.0 | 6.4 | 4.6 | 3.2 |
| Sociodemographic factors | ||||||
| % male | 49.5 | 49.1 | 49.1 | 49.2 | 49.6 | 49.7 |
| % under age 15 | 19.1 | 19.7 | 18.8 | 18.5 | 18.4 | 17.4 |
| % age 15–24 | 13.9 | 13.6 | 13.5 | 13.2 | 13.9 | 13.0 |
| % with high school diploma | 87.3 | 83.6 | 88.3 | 89.9 | 90.5 | 89.1 |
| % with 4-year college degree | 31.1 | 32.3 | 33.0 | 31.6 | 27.9 | 23.3 |
| % households below poverty line | 14.3 | 16.1 | 13.8 | 12.8 | 13.0 | 14.3 |
| Average per capita income | $48,888 | $41,140 | $43,975 | $49,872 | $52,682 | $48,875 |
| % unemployed | 5.1 | 5.5 | 5.0 | 4.8 | 4.6 | 5.1 |
| % under 65 uninsured | 10.2 | 12.1 | 10.3 | 9.0 | 7.6 | 8.0 |
| Urbanicity | ||||||
| % metro region (vs. non-metro) | 48.7 | 74.9 | 50.9 | 39.7 | 16.3 | 2.1 |
Note: ZIP3s were classified into quintiles based on the percentage of population that identified as White; quintile 1 comprised ZIP3s with the highest percentage of White residents (top 20% nationally). Descriptive statistics were calculated as the mean among ZIP3s in each quintile and were weighted by the population of the ZIP3 region. For all variables, omnibus F-test was significant, indicating significant differences across quintiles.
3.2. Trends in buprenorphine distribution, buprenorphine-waivered prescribers, and fatal overdose
The buprenorphine distribution rate increased across 2007–2017 for ZIP3s in all quintiles in both non-expansion and expansion states (Figure 2), with distribution consistently highest in quintile 5 (highest percentage of White residents) ZIP3s and consistently lowest in quintile 1 ZIP3s.
Figure 2. Population-weighted rates of buprenorphine distribution, buprenorphine-waivered prescribers, and fatal drug overdose from 2007–2017, stratified by ZIP3 quintile and Medicaid expansion status.
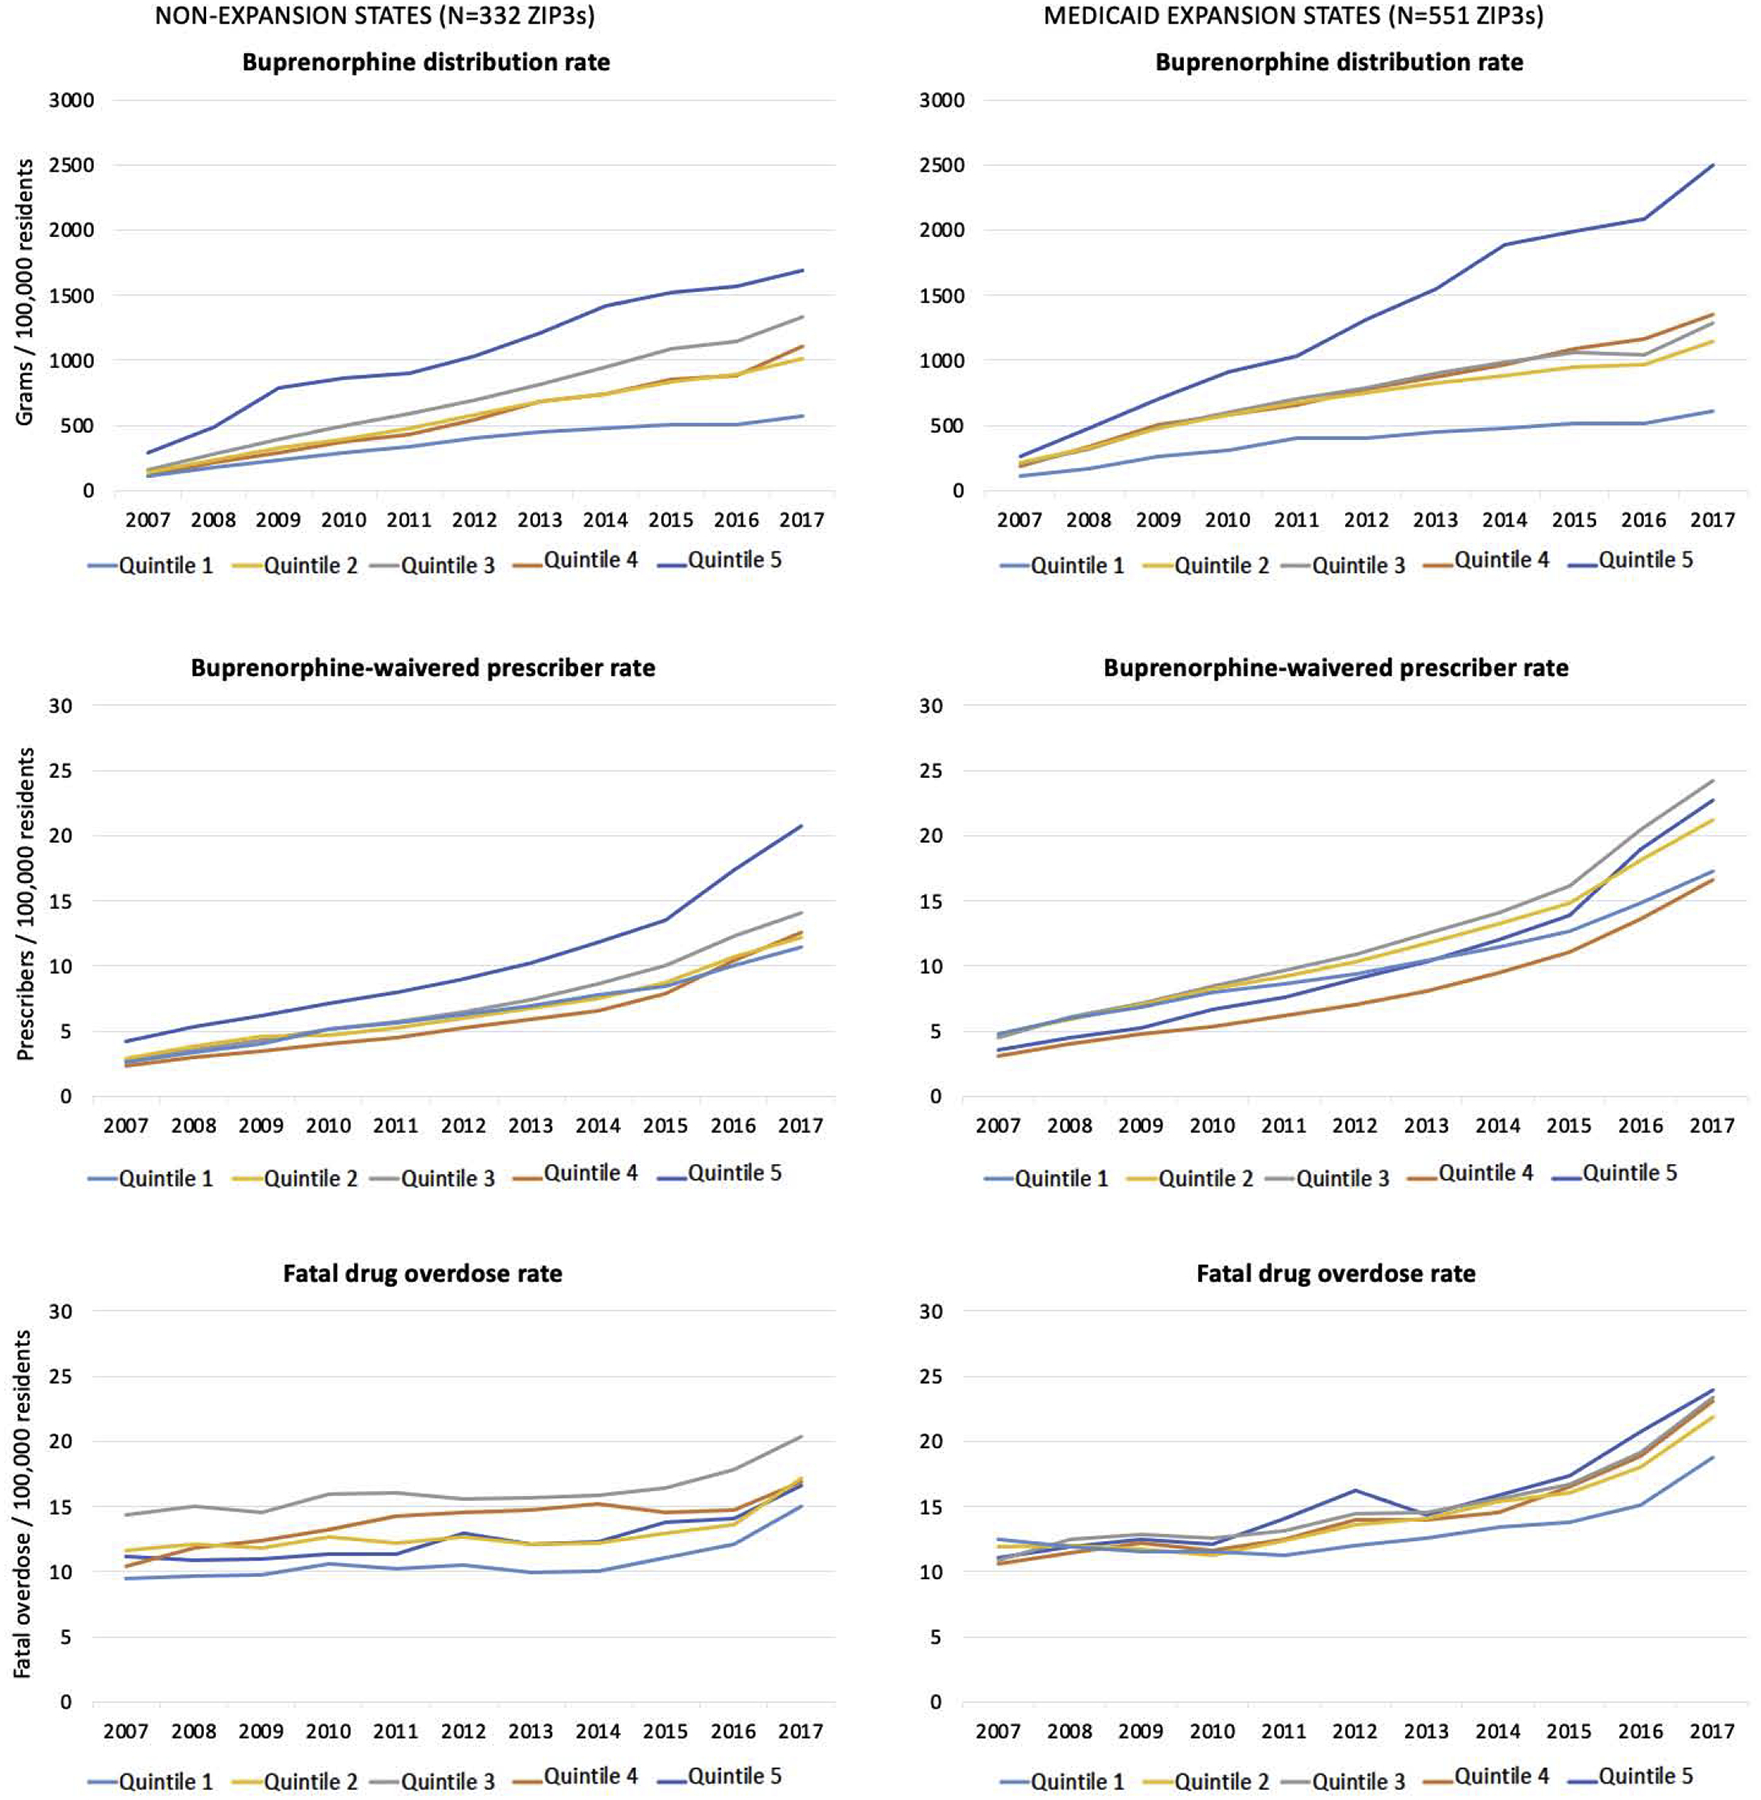
Note: Quintile 1 comprised of ZIP3s with the lowest % White residents; Quintile 5 comprised of ZIP3s with the highest % of White residents.
The buprenorphine-waivered prescriber rate in non-expansion states was consistently highest among ZIP3s with the highest percentage of White residents. In Medicaid expansion states, the waivered prescriber rate was relatively comparable across quintiles, yet growth was faster for quintile 5 ZIP3s, which transitioned from having the second-lowest rate in 2007 to the second-highest rate by 2017.
The fatal overdose rate in non-expansion states showed moderate growth across 2007–2017 for ZIP3s in all quintiles, with overdose rates consistently lowest in quintile 1 ZIP3s. In Medicaid expansion states, the overdose rate was relatively similar across quintiles during 2007–2010 and then diverged such that, by 2017, rates were highest in quintile 5 ZIP3s and lowest in quintile 1 ZIP3s.
3.3. Estimated buprenorphine distribution rate by ZIP3 quintile
In non-expansion states, estimated buprenorphine distribution rates (adjusting for sociodemographic factors, waivered prescriber rate, and lagged fatal overdose rate) were relatively similar across quintiles during 2007–2010, with the exception that distribution was significantly lower in quintile 4 relative to quintile 5 (Table 2; Figure 3). Distribution rose for all quintiles during the subsequent time periods, but increased the most for quintile 5 ZIP3s, leading to significant differences between quintile 5 and both quintiles 1 and 2. Specifically, while quintile 5 and quintile 1 did not significantly differ during 2007–2010, quintile 5 distribution was approximately 1.7 times higher during 2011–2014 (847.4 g vs 492.3 g) and twice as high during 2015–2017 (1,284.2g vs 609.2g).
Table 2.
Quintile-specific estimates of ZIP3-level buprenorphine distribution rate (grams/100,000 residents), by Medicaid expansion status and time period
| PRE-ACA (2007–2010) | ACA IMPLEMENTATION (2011–2014) | POST-ACA (2015–2017) | ||
|---|---|---|---|---|
| ZIP3 n | Estimate [95% CI] | Estimate [95% CI] | Estimate [95% CI] | |
| NON-EXPANSION STATES | 332 | |||
| Quintile 1: lowest % White | 70 | 275.5 [223.9–327.2] | 492.3 [432.2–552.3] | 609.2 [525.6–692.7] |
| Quintile 2 | 83 | 261.3 [219.2–303.4] | 584.9 [523.7–646.1] | 875.0 [785.4–964.5] |
| Quintile 3 | 74 | 272.9 [226.1–319.7] | 677.9 [594.0–761.8] | 1,055.5 [931.0–1,180.1] |
| Quintile 4 | 54 | 229.3 [162.1–296.5] | 625.1 [535.5–714.7] | 967.5 [781.9–1,153.2] |
| Quintile 5: highest % White (reference) | 51 | 357.7 [255.8–459.7] | 847.4 [621.0–1,073.8] | 1,284.2 [906.8–1,661.5] |
| MEDICAID EXPANSION STATES (BY 2017) | 551 | |||
| Quintile 1: lowest % White | 107 | 198.2 [140.3–256.1] | 416.8 [336.0–497.5] | 566.7 [450.6–682.8] |
| Quintile 2 | 94 | 401.0 [359.0–442.9] | 797.0 [716.9–877.2] | 1,040.0 [950.8–1,129.1] |
| Quintile 3 | 102 | 435.6 [387.6–483.5] | 839.5 [769.0–910.0] | 1,149.9 [1,062.4–1,237.4] |
| Quintile 4 | 123 | 526.4 [443.5–609.3] | 1,036.2 [913.7–1,158.6] | 1,397.8 [1,275.0–1,520.6] |
| Quintile 5: highest % White (reference) | 125 | 588.7 [502.3–675.0] | 1,411.8 [1,248.0–1,575.6] | 1,914.6 [1,718.3–2,110.9] |
Note: Bold denotes estimates that significantly differ from the Quintile 5 estimate at the 0.05 level. The regression model adjusted for one year-lagged ZIP3 fatal overdose rate, % ZIP3 population male, % ZIP3 population under age 15, % ZIP3 population age 15–24, % ZIP3 population with high school diploma, % ZIP3 population with 4-year college degree, % ZIP3 population households below poverty line, % ZIP3 population unemployed, % ZIP3 population under 65 uninsured, ZIP3 urbanicity, year fixed effects, and ZIP3 population weights.
Figure 3. Absolute differences in estimated buprenorphine distribution rate, relative to quintile 5 (highest % White residents), by Medicaid expansion status and time period.
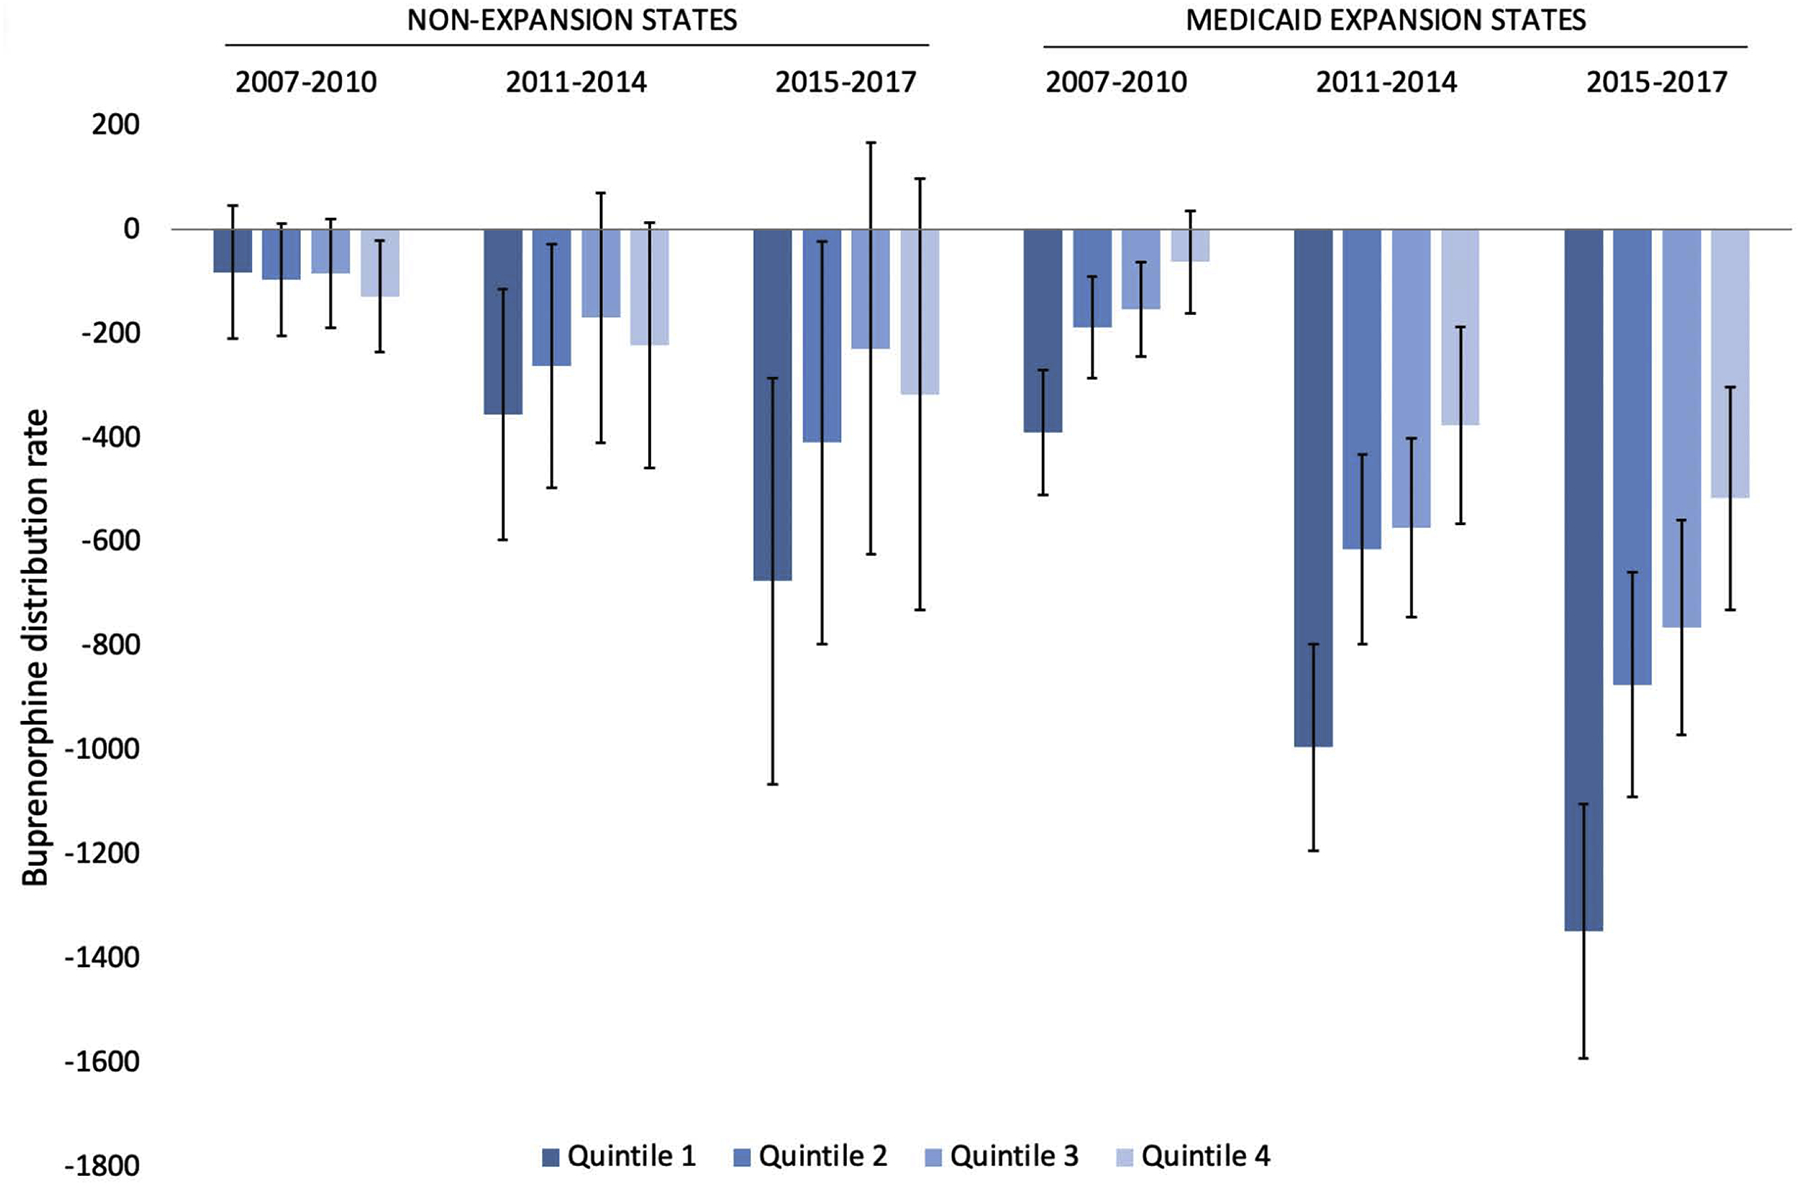
Note: Estimates of predictive margins contrasts across quintiles and corresponding and 95% CIs were obtained from regression model reported in Table 2.
In Medicaid expansion states, more significantly differences were observed across quintiles: relative to quintile 5, quintiles 1–3 had significantly lower buprenorphine distribution in every time period, as did quintile 4 in the last two time periods. The magnitude of quintile differences increased over time: during 2007–2010, the distribution rate was approximately 3 times higher in quintile 5 compared to quintile 1 (588.7 g vs 198.2 g) yet was 3.4 times higher during 2015–2017 (1,914.6 g vs 566.7 g). Overall, quintile 1 distribution rates were relatively similar in magnitude across expansion and non-expansion states for all time periods. In contrast, the quintile 5 distribution rates were approximately 1.5 times as high in expansion states relative to non-expansion states at baseline, a difference that persisted across time periods.
In sensitivity analyses, we assessed whether quintile-specific buprenorphine distribution trends differed for geographic areas in which % Black residents was greater than % Hispanic residents and vice versa (Appendix Table 2). Findings were largely similar to our primary results. In Medicaid expansion states, for both ZIP3s with a greater % of Hispanic residents and ZIP3s with a greater % of Black residents, quintiles 1–3 had significantly lower distribution rates than quintile 5 in every time period, as did quintile 4 in the final two time periods. In non-expansion states, quintile 1 distribution rates were significantly lower than quintile 5 during 2011–2014 and 2015–2017 for ZIP3s with a greater % of Hispanic residents. No significant quintile differences were observed for ZIP3s with a greater % of Black residents in non-expansion states. Of note, distribution rates in all quintiles were generally higher (up to nearly twice as high) for ZIP3s with a greater % of Black residents compared to ZIP3s with a greater % of Hispanic residents. Additionally, results were robust to excluding the most rural 5% of ZIP3s; patterns of quintile differences and magnitude of distribution rates were very similar to our primary results (Appendix Table 3).
3.4. Marginal effect of waivered prescriber rate by ZIP3 quintile
As a secondary outcome, we estimated the quintile-specific marginal effect of increasing the rate of waivered prescribers on buprenorphine distribution, consistently finding a positive effect (Table 3). Each additional waivered prescriber (per 100,000 residents) was associated with an increase in the buprenorphine distribution rate ranging from 17–104 grams across all quintiles and time periods. For non-expansion states, significant differences in the magnitude of the estimated waivered prescriber effect across quintiles were only observed for quintiles 2 and 3 (relative to quintile 5) during 2007–2010. In contrast, quintile differences were consistently observed in expansion states: the estimated waivered prescriber effect in quintile 5 was significantly larger (ranging from 1.5 to 5.0 times larger) compared to the marginal effects for quintiles 1, 2, and 3 in every time period.
Table 3.
Quintile-specific estimates of the marginal effect of the ZIP3 buprenorphine-waivered prescriber rate on the ZIP3 buprenorphine distribution rate, by Medicaid expansion status and time period
| PRE-ACA (2007–2010) | ACA IMPLEMENTATION (2011–2014) | POST-ACA (2015–2017) | ||
|---|---|---|---|---|
| ZIP3 n | Estimate [95% CI] | Estimate [95% CI] | Estimate [95% CI] | |
| NON-EXPANSION STATES | 332 | |||
| Quintile 1: lowest % White | 70 | 60.2 [34.7–85.7] | 61.0 [38.8–83.1] | 39.5 [21.0–57.9] |
| Quintile 2 | 83 | 43.4 [25.6–61.2] | 54.5 [32.7–76.3] | 47.0 [30.5–63.4] |
| Quintile 3 | 74 | 53.8 [36.4–71.1] | 70.6 [45.5–95.6] | 68.8 [37.8–99.8] |
| Quintile 4 | 54 | 56.3 [36.9–75.7] | 81.9 [66.7–97.0] | 76.5 [52.7–100.3] |
| Quintile 5: highest % White (reference) | 51 | 96.3 [60.7–131.8] | 96.6 [46.6–146.5] | 63.1 [33.9–92.2] |
| MEDICAID EXPANSION STATES (BY 2017) | 551 | |||
| Quintile 1: lowest % White | 107 | 17.5 [0.3–34.7] | 28.4 [5.2–51.7] | 27.1 [8.1–46.1] |
| Quintile 2 | 94 | 60.7 [49.4–72.1] | 59.6 [49.2–70.1] | 38.8 [31.6–46.0] |
| Quintile 3 | 102 | 60.5 [48.5–72.5] | 67.7 [56.2–79.2] | 45.1 [36.4–53.8] |
| Quintile 4 | 123 | 84.4 [64.9–103.9] | 94.4 [73.8–114.9] | 75.6 [63.7–87.4] |
| Quintile 5: highest % White (reference) | 125 | 87.8 [64.9–110.8] | 104.1 [76.0–132.2] | 83.8 [63.0–104.5] |
Note: Marginal effect reported as grams/100,000 residents. Bold denotes estimates that significantly differ from the Quintile 5 estimate at the 0.05 level. Estimates obtained from the same regression model as Table 2 estimates.
4. DISCUSSION
Our findings highlight that, while buprenorphine distribution increased significantly in the U.S. during 2007–2017, the growth in buprenorphine distribution was disproportionately greater for ZIP3 regions with higher percentages of White residents. After adjusting for ZIP3-level sociodemographic factors, buprenorphine-waivered prescriber rate, and lagged fatal overdose rate, our results indicated that differences in buprenorphine distribution across ZIP3 quintiles (defined based on the proportion of White residents) increased over time in both Medicaid expansion and non-expansion states. While our findings are at the ecological level, they are consistent with prior studies at the individual-level demonstrating that racial/ethnic minorities, particularly Black adults, are less likely to receive buprenorphine in multiple contexts (e.g., national samples (Krawczyk et al., 2017; Lagisetty et al., 2019), publicly insured samples (Abraham et al., 2019; Stein et al., 2018), and the Veterans Affairs healthcare system (Manhapra et al., 2017; Manhapra et al., 2020)). Furthermore, our results provide novel evidence that an increase in the buprenorphine-waivered prescriber rate was associated with significantly smaller gains in buprenorphine distribution in ZIP3s with lower percentages of White residents. To date, increasing the total number of buprenorphine waivered prescribers has been an objective of many policy initiatives, yet our results indicate that an increase in the waivered prescriber rate does not yield equitable gains in buprenorphine distribution for regions with a lower proportion of White residents – a finding that is consistent with prior work showing that overall improvements in health care access do not necessarily improve, and may sometimes widen, racial/ethnic disparities (Breslau et al., 2020; Breslau et al., 2018; Phelan and Link, 2005). As we discuss below, targeted policy approaches are likely necessary to mitigate racial/ethnic disparities in buprenorphine access.
Given that our analyses adjusted for buprenorphine-waivered prescriber rate, the observed differences in buprenorphine distribution across quintiles do not merely reflect variation in the number of waivered prescribers. Other explanatory factors include geographic heterogeneity in access to and affordability of buprenorphine. There is notable regional variation in substance use treatment access: in 2015, approximately 40% of U.S. counties, disproportionately counties with a higher proportion of Black residents, did not have a single outpatient substance use treatment facility that accepted Medicaid (Cummings et al., 2014). Recent work found a higher density of buprenorphine treatment facilities in counties that were less accessible to racial/ethnic minorities (Goedel et al., 2020). Geographic variation in buprenorphine affordability, arising from clinical contexts in which buprenorphine is prescribed as well as racial/ethnic differences in insurance status, may also contribute to our findings. Clinicians serving publicly-insured or uninsured populations may be less likely than private practice physicians to obtain buprenorphine waivers due lack of time and resources to pursue the training, limited reimbursement rates for buprenorphine clinical visits, or a lack of mentorship opportunities regarding buprenorphine treatment (Hansen et al., 2016; Hansen et al., 2013; SAMHSA, 2020). Additionally, a recent study suggests that growing number of buprenorphine prescribers accept only cash (Lagisetty et al., 2019), potentially constraining access to buprenorphine for low-income individuals. While the ACA increased insurance coverage overall (Abraham et al., 2017; Cher et al., 2019; Knudsen et al., 2015; Meinhofer and Witman, 2018), racial/ethnic minorities were more likely to be publicly insured or uninsured relative to White individuals, both before and after the ACA (Berchick et al., 2019; Buchmueller et al., 2016). Finally, the observed variation in buprenorphine distribution likely reflects, in part, broader racial/ethnic disparities in healthcare access (Towne, 2017).
Other salient factors that may contribute to our observed differences across quintiles may include a lack of racial/ethnic minority buprenorphine prescribers and culturally-tailored outreach and treatment initiatives. A recent study highlighted that approximately 70% of waivered prescribers in urban regions and 85% of waivered prescribers in rural regions are White (Lin and Knudsen, 2019). Addressing the shortage of racial/ethnic minority waivered prescribers may help to reduce disparities in buprenorphine access and utilization, given consistent evidence of the benefits of cultural competency and racial/ethnic concordance between doctor and patient (Corral et al., 2017; Eiser and Ellis, 2007; SAMHSA, 2020). Increased diversity is likewise needed among allied health professionals, peer recovery coaches, social workers, and case managers who support individuals receiving OUD treatment (SAMHSA, 2020). The use of mobile outreach, including on-site buprenorphine initiation, may be an effective strategy for connecting underserved populations with treatment (Buzza et al., 2019; Iheanacho et al., 2020; Krawczyk et al., 2019). A recent SAMHSA report highlights several initiatives that have sought to promote OUD treatment among racial/ethnic minorities, including a holistic addiction clinic at New York’s Bellevue Hospital with strong partnerships with Black community-based organizations; the Detroit Recovery Project, which focuses on promoting substance use recovery among Black individuals; and Boston’s Project RECOVER, which prioritizes training Black and Hispanic peer recovery coaches (SAMHSA, 2020). Such targeted and tailored treatment initiatives may be critical in addressing current buprenorphine disparities.
Regarding Medicaid expansion status, our findings that Medicaid expansion states generally had higher buprenorphine distribution rates across 2007–2017 than did non-expansion states are consistent with prior literature (McKenna, 2017; Meinhofer and Witman, 2018; Saloner et al., 2018; Sharp et al., 2018). While Medicaid expansion and non-expansion states differ with respect to numerous demographic, geographic, and political characteristics, one factor likely to be a key contributor is expansion states’ greater generosity of substance use treatment funding, both directly and indirectly through Medicaid (Knudsen et al., 2015). While all state Medicaid plans currently cover buprenorphine (Stein et al., 2015a), state plans impose various limitations on coverage, including prior authorization, annual maximums, and copayments and deductibles (Grogan et al., 2016); non-expansion states may have be more likely to impose greater restrictions. Furthermore, the significant variation in benefit generosity and specific services covered for substance use treatment across insurance plans under Medicaid expansion (Abraham et al., 2017) may also have contributed to growing racial/ethnic differences in buprenorphine distribution. Some plans require beneficiaries receiving buprenorphine to concurrently receive non-pharmacological treatments (e.g., counseling), which may be disproportionately burdensome for some individuals due to geographic, financial, or transportation factors. We note that the singular exception to the pattern of higher distribution rates in expansion states was quintile 1 (ZIP3s with the lowest % White residents), as quintile 1 ZIP3s in non-expansion states had higher distribution rates than quintile 1 ZIP3s in expansion states in every time period. As quintile 1 ZIP3s are predominantly urban, it is possible that factors such as pathways to OUD care, prescribing patterns, or OTP availability differ in urban settings between non-expansion and expansion states.
Targeted policy efforts addressing both buprenorphine access and affordability are warranted. On the provider side, initiatives are necessary not only to increase the number of waivered prescribers in underserved areas, but also to increase buprenorphine access through affordable, low-cost treatment settings as well as increasing buprenorphine treatment outreach to underserved population subgroups. Potential policy strategies include providing buprenorphine-waiver training at no cost to prescribers (Abraham et al., 2019), the use of clinical champion models to promote adoption and provide clinician support (Priest and McCarty, 2019), and continuing education efforts regarding OUD treatment and buprenorphine (Clark et al., 2019). Regarding affordability, generous coverage of buprenorphine treatment by governmental entities, as well as commercial insurers, can help to reduce treatment barriers on both the patient and provider sides (Haffajee et al., 2020). Policy initiatives to reduce cost sharing and eliminate prior authorization for certain buprenorphine formulations (Abraham et al., 2019) may help reduce racial/ethnic disparities in buprenorphine treatment by improving access and affordability.
Overall, we underscore the magnitude of the observed differences in buprenorphine distribution across ZIP3 quintiles. In expansion states, buprenorphine distribution rates in ZIP3s with the highest percentage of White residents were more than 300% higher than in ZIP3s with the lowest percentage of White residents during 2015–2017; correspondingly, a difference of over 200% was observed for non-expansion states. As an illustration of the implications of these disparities, based on the recommended 16mg dose (FDA, 2017) and assuming a 6-month treatment episode (Stein et al., 2015b), the observed post-ACA difference translates to 468 more buprenorphine patients (per 100,000 residents) treated annually in quintile 1, relative to quintile 5, in expansion states and a corresponding difference of 234 buprenorphine patients in non-expansion states. While our analyses are ecological, it is likely that the observed heterogeneity at the ZIP3 level contributes to lower buprenorphine access for racial/ethnic minorities individuals.
Our findings should be considered in light of the study’s limitations. We adjusted for measures associated with OUD, including fatal drug overdose rate and sociodemographic characteristics. However, given the challenges of accurately measuring OUD and treatment need, the observed heterogeneity in distribution may partly reflect unmeasured variation in need. Due to the ecological study design, our findings provide evidence of variation at the geographic level, rather than the individual level. Without person-level data, we cannot determine if White individuals are more likely to receive buprenorphine than racial/ethnic minority individuals. Our analyses solely considered buprenorphine; prior studies indicate that methadone utilization is higher in ZIP3s with lower percentages of White residents (Goedel et al., 2020). As such, our findings do not necessarily indicate racial/ethnic disparities in OUD treatment access overall, nor do they provide insights regarding treatment quality. Our unit of analysis, ZIP3, is relatively large (883 nationally) compared to counties (3,141 nationally). Rather than arbitrarily disaggregating the dependent variable from ZIP3 to counties, we aggregated the county-level independent variables to have accurate ZIP3 totals. The relationships we identify are appropriate at the ZIP3 level, but we are unable to identify heterogeneity within ZIP3s. Finally, while buprenorphine is primarily used to treat OUD, it is also (less commonly) used to treat pain; thus, buprenorphine distribution rate does not directly represent buprenorphine OUD treatment rate.
Overall, our findings that buprenorphine distribution rates are significantly higher geographic regions with a higher proportion of White individuals provide further evidence of racial/ethnic disparities in buprenorphine treatment access in the U.S. Additionally, our results provide novel evidence that an increase in the per capita waivered prescriber rate does not yield equitable gains in buprenorphine distribution for regions with greater racial/ethnic minorities. Targeted policy initiatives aimed at reducing racial/ethnic disparities are warranted: key priorities include increasing buprenorphine access through accessible, low-cost treatment settings; mitigating payment barriers to buprenorphine, and diversifying the OUD treatment workforce.
Highlights.
3-digit ZIP codes (“ZIP3s”) were classified into quintiles by % of White residents
We examined trends in buprenorphine distribution by ZIP3 quintiles across 2007–2017
Growth was disproportionately greater for ZIP3s with higher % White residents
The magnitude of the observed racial/ethnic differences increased over time
Increasing the waivered prescriber rate had smaller effect in ZIP3s with lower % White residents
Role of funding source:
This work was funded by awards R01 DA045800 and P50 DA046351. The content is solely the responsibility of the authors and does not necessarily represent the official views of NIDA, the NIH or the US Government.
Appendix Table 1:
Characteristics of ZIP3 regions by Medicaid expansion status and time period
| Non-Expansion States (N= 332 ZIP3s) | Expansion States (N = 551 ZIP3s) | |||||
|---|---|---|---|---|---|---|
| PRE-ACA (2007–2010) |
ACA (2011–2014) |
POST-ACA (2015–2017) | PRE-ACA (2007–2010) | ACA (2011–2014) |
POST-ACA (2015–2017) | |
| Racial/ethnic composition | ||||||
| % Non-Hispanic White | 64.3 | 62.1 | 61.4 | 65.6 | 63.8 | 61.4 |
| % Non-Hispanic Black | 15.8 | 16 | 15.7 | 10 | 10.2 | 10.3 |
| % Hispanic | 15.3 | 16.5 | 17.1 | 16.1 | 16.7 | 18.3 |
| % Other race/multiracial | 4.7 | 5.4 | 5.7 | 8.4 | 9.3 | 10 |
| Sociodemographic factors | ||||||
| % male | 49.3 | 49.2 | 49.2 | 49.3 | 49.2 | 49.3 |
| % under age 15 | 20.7 | 20.0 | 19.6 | 19.8 | 19.0 | 18.5 |
| % age 15–24 | 14.2 | 13.9 | 13.6 | 14.1 | 13.9 | 13.4 |
| % high school diploma | 84.2 | 85.7 | 86.9 | 85.6 | 86.9 | 87.6 |
| % 4-yr college degree | 26.2 | 27.5 | 29 | 29 | 30.6 | 32.3 |
| % below poverty line | 15.1 | 16.9 | 15.1 | 13.4 | 15.2 | 13.9 |
| Avg. per capita income | $36,426 | $40,414 | $43,963 | $41,235 | $46,169 | $51,713 |
| % unemployed | 7 | 7.3 | 4.9 | 7.7 | 8 | 5.2 |
| % under 65 uninsured | 20 | 19.2 | 13.8 | 15.5 | 14.1 | 8.1 |
| Urbanicity | ||||||
| % metro region | 35.8 | 56 | ||||
Note: Descriptive statistics were calculated as the mean among ZIP3s, stratified by expansion status and time period, and were weighted by the population of the ZIP3 region.
Appendix Table 2.
Quintile-specific estimates of ZIP3-level buprenorphine distribution rate, by Medicaid expansion status and time period. Results are stratified into ZIP3s in which the % Hispanic residents is greater than the % Black residents, and vice versa.
| ZIP3s in which % Hispanic residents > % Black residents | ||||
|---|---|---|---|---|
| PRE-ACA (2007–2010) |
ACA IMPLEMENTATION (2011–2014) |
POST-ACA (2015–2017) |
||
| N | Estimate [95% CI] | Estimate [95% CI] | Estimate [95% CI] | |
| NON-EXPANSION STATES | 165 | |||
| Quintile 1 | 30 | 245.9 [184.5–307.3] | 428.5 [355.5–501.4] | 522.6 [429.8–615.3] |
| Quintile 2 | 32 | 224.8 [156.5–293.1] | 470.4 [393.8–547.0] | 686.4 [595.1–777.7] |
| Quintile 3 | 27 | 215.2 [160.6–269.8] | 521.0 [439.1–602.9] | 783.1 [663.9–902.3] |
| Quintile 4 | 36 | 160.7 [75.7–245.7] | 544.6 [421.6–667.6] | 830.2 [598.1–1,062.3] |
| Quintile 5 (ref) | 40 | 282.8 [184.8–380.8] | 699.9 [470.4–929.4] | 1,037.4 [625.4–1,449.3] |
| EXPANSION STATES | 311 | |||
| Quintile 1 | 89 | 206.3 [169.3–243.2] | 359.0 [312.9–405.2] | 474.3 [408.7–540.0] |
| Quintile 2 | 54 | 302.0 [262.5–341.5] | 594.7 [536.8–652.5] | 796.8 [737.1–856.5] |
| Quintile 3 | 66 | 345.7 [299.8–391.6] | 702.1 [619.0–785.2] | 970.1 [863.8–1,076.4] |
| Quintile 4 | 45 | 462.0 [334.4–589.7] | 935.3 [730.7–1,139.9] | 1,239.7 [1,038.8–1,440.7] |
| Quintile 5 (ref) | 57 | 540.2 [428.6–651.8] | 1,161.9 [943.4–1,380.3] | 1,628.2 [1,351.3–1,905.2] |
| ZIP3s in which % Hispanic residents < % Black residents | ||||
| NON-EXPANSION STATES | 167 | |||
| Quintile 1 | 37 | 273.2 [204.0–342.3] | 542.0 [456.4–627.5] | 723.0 [610.3–835.7] |
| Quintile 2 | 60 | 281.8 [245.9–317.7] | 671.7 [604.3–739.1] | 1,044.9 [927.1–1,162.7] |
| Quintile 3 | 36 | 337.9 [271.2–404.7] | 868.9 [728.3–1009.5] | 1,411.4 [1,208.9–1,613.9] |
| Quintile 4 | 21 | 331.6 [251.2–412.0] | 782.1 [635.9–928.3] | 1,166.2 [898.6–1,433.8] |
| Quintile 5 (ref) | 13 | 452.3 [224.8–679.8] | 1,111.6 [265.4–1,957.8] | 2,077.0 [680.7–3,473.4] |
| EXPANSION STATES | 240 | |||
| Quintile 1 | 21 | 251.7 [117.6–385.7] | 618.9 [398.6–839.2] | 918.1 [688.7–1,147.5] |
| Quintile 2 | 31 | 519.0 [423.1–615.0] | 1,138.5 [978.2–1,298.9] | 1,477.1 [1,287.4–1,666.9] |
| Quintile 3 | 47 | 488.8 [405.4–572.3] | 989.3 [869.6–1,109.0] | 1,378.0 [1,237.5–1,518.4] |
| Quintile 4 | 75 | 567.3 [465.8–668.7] | 1,155.6 [1,017.7–1,293.6] | 1,623.3 [1,489.9–1,756.7] |
| Quintile 5 (ref) | 66 | 695.7 [567.9–823.5] | 1,676.0 [1,456.4–1,895.7] | 2,277.3 [2,029.2–2,525.4] |
Note: Buprenorphine distribution rate reported as grams/100,000 residents. Bold denotes estimates that significantly differ from the Quintile 5 estimate at the 0.05 level. The regression model adjusted for one year-lagged ZIP3 fatal overdose rate, % ZIP3 population male, % ZIP3 population under age 15, % ZIP3 population age 15–24, % ZIP3 population with high school diploma, % ZIP3 population with 4-year college degree, % ZIP3 population households below poverty line, % ZIP3 population unemployed, % ZIP3 population under 65 uninsured, and ZIP3 urbanicity, as well as year fixed effects and ZIP3 population weights.
Appendix Table 3.
Quintile-specific estimates of ZIP3-level buprenorphine distribution rate, by Medicaid expansion status and time period. ZIP3s comprised exclusively of counties classified as RUCC6-RUCC9 are excluded (n=49 ZIP3s).
| Sensitivity analysis: excluding the 49 most-rural ZIP3s | ||||
|---|---|---|---|---|
| PRE-ACA (2007–2010) |
ACA IMPLEMENTATION (2011–2014) |
POST-ACA (2015–2017) |
||
| N | Estimate [95% CI] | Estimate [95% CI] | Estimate [95% CI] | |
| NON-EXPANSION STATES | 315 | |||
| Quintile 1 | 68 | 276.8 [226.8–326.8] | 490.5 [430.4–550.5] | 613.1 [533.2–693.0] |
| Quintile 2 | 81 | 256.2 [216.2–296.3] | 579.2 [519.1–639.3] | 867.8 [781.0–954.6] |
| Quintile 3 | 71 | 270.8 [226.3–315.2] | 679.3 [594.5–764.1] | 1,052.1 [926.1–1,178.1] |
| Quintile 4 | 51 | 228.6 [168.6–288.6] | 624.7 [530.0–719.4] | 956.3 [764.0–1,148.5] |
| Quintile 5 (ref) | 44 | 368.3 [260.1–476.5] | 858.1 [612.9–1,103.2] | 1,285.8 [884.9–1,686.7] |
| EXPANSION STATES | 521 | |||
| Quintile 1 | 104 | 234.7 [187.0–282.4] | 448.5 [374.0–523.0] | 607.3 [498.4–716.3] |
| Quintile 2 | 93 | 392.4 [351.3–433.5] | 787.2 [709.2–865.1] | 1,025.5 [937.8–1,113.2] |
| Quintile 3 | 99 | 401.3 [357.8–444.7] | 810.3 [742.1–878.5] | 1,115.2 [1031.9–1,198.6] |
| Quintile 4 | 119 | 504.2 [421.3–587.1] | 1,011.5 [888.2–1,134.7] | 1,356.1 [1,235.4–1,476.8] |
| Quintile 5 (ref) | 106 | 564.8 [481.2–648.4] | 1,336.9 [1,181.2–1,492.7] | 1,805.1 [1,613.8–1,996.5] |
Note: Buprenorphine distribution rate reported as grams/100,000 residents. Bold denotes estimates that significantly differ from the Quintile 5 estimate at the 0.05 level. The regression model adjusted for one year-lagged ZIP3 fatal overdose rate, % ZIP3 population male, % ZIP3 population under age 15, % ZIP3 population age 15–24, % ZIP3 population with high school diploma, % ZIP3 population with 4-year college degree, % ZIP3 population households below poverty line, % ZIP3 population unemployed, % ZIP3 population under 65 uninsured, and ZIP3 urbanicity, as well as year fixed effects and ZIP3 population weights.
Footnotes
Publisher's Disclaimer: This is a PDF file of an unedited manuscript that has been accepted for publication. As a service to our customers we are providing this early version of the manuscript. The manuscript will undergo copyediting, typesetting, and review of the resulting proof before it is published in its final form. Please note that during the production process errors may be discovered which could affect the content, and all legal disclaimers that apply to the journal pertain.
Conflict of Interest: No conflict declared
REFERENCES
- Abraham AJ, Adams GB, Bradford AC, Bradford WD, 2019. County-level access to opioid use disorder medications in Medicare Part D (2010–2015). Health Serv. Res 54, 390–398. [DOI] [PMC free article] [PubMed] [Google Scholar]
- Abraham AJ, Andrews CM, Grogan CM, D’Aunno T, Humphreys KN, Pollack HA, Friedmann PD, 2017. The Affordable Care Act transformation of substance use disorder treatment. Am. J. Public Health 107, 31–32. [DOI] [PMC free article] [PubMed] [Google Scholar]
- Berchick ER, Barnett JC, Upton RD, 2019. Health insurance coverage in the United States: 2018 U.S. Government Printing Office, Washington, DC. [Google Scholar]
- Breslau J, Han B, Lai J, Yu H, 2020. Impact of the Affordable Care Act Medicaid expansion on utilization of mental health care. Med. Care 58, 757–762. [DOI] [PMC free article] [PubMed] [Google Scholar]
- Breslau J, Han B, Stein BD, Burns RM, Yu H, 2018. Did the affordable care act’s dependent coverage expansion affect race/ethnic disparities in health insurance coverage? Health Serv. Res 53, 1286–1298. [DOI] [PMC free article] [PubMed] [Google Scholar]
- Buchmueller TC, Levinson ZM, Levy HG, Wolfe BL, 2016. Effect of the Affordable Care Act on racial and ethnic disparities in health insurance coverage. Am. J. Public Health 106, 1416–1421. [DOI] [PMC free article] [PubMed] [Google Scholar]
- Buzza C, Elser A, Seal J, 2019. A mobile buprenorphine treatment program for homeless patients with opioid use disorder. Psychiatr. Serv 70, 635–636. [DOI] [PubMed] [Google Scholar]
- Centers for Disease Control and Prevention, 2019. Wide-ranging online data for epidemiologic research (WONDER) https://wonder.cdc.gov/. (Accessed Jan 10 2020).
- Cher BAY, Morden NE, Meara E, 2019. Medicaid expansion and prescription trends: Opioids, addiction therapies, and other drugs. Med. Care 57, 208–212. [DOI] [PMC free article] [PubMed] [Google Scholar]
- Clark B, Kai M, Dix R, White J, Rozenfeld Y, Levy S, Engstrom K, 2019. Association of a multimodal educational intervention for primary care physicians with prescriptions of buprenorphine for opioid use disorders. JAMA Netw Open 2, e1913818. [DOI] [PMC free article] [PubMed] [Google Scholar]
- Corral I, Johnson TL, Shelton PG, Glass O, 2017. Psychiatry resident training in cultural competence: An educator’s toolkit. Psychiatr. Q 88, 295–306. [DOI] [PubMed] [Google Scholar]
- Cummings JR, Wen H, Ko M, Druss BG, 2014. Race/ethnicity and geographic access to Medicaid substance use disorder treatment facilities in the United States. JAMA Psychiatry 71, 190–196. [DOI] [PMC free article] [PubMed] [Google Scholar]
- Drug Enforcement Administration, ARCOS: Automation of reports & consolidated orders system https://www.deadiversion.usdoj.gov/arcos/retail_drug_summary/. (Accessed Jan 1, 2020.
- Duncan A, Anderman J, Deseran T, Reynolds I, Stein BD, 2020. Monthly patient volumes of buprenorphine-waivered clinicians in the US. JAMA Network Open 3. [DOI] [PMC free article] [PubMed] [Google Scholar]
- Duncan LG, Mendoza S, Hansen H, 2015. Buprenorphine maintenance for opioid dependence in public sector healthcare: Benefits and barriers. J Addict Med Ther Sci 1, 31–36. [DOI] [PMC free article] [PubMed] [Google Scholar]
- Eiser AR, Ellis G, 2007. Viewpoint: Cultural competence and the African American experience with health care: The case for specific content in cross-cultural education. Acad. Med 82, 176–183. [DOI] [PubMed] [Google Scholar]
- FDA, 2017. Suboxone prescribing information https://www.accessdata.fda.gov/drugsatfda_docs/label/2017/020733s020lbl.pdf.
- Ghertner R, 2019. US trends in the supply of providers with a waiver to prescribe buprenorphine for opioid use disorder in 2016 and 2018. Drug Alcohol Depend 204. [DOI] [PubMed] [Google Scholar]
- Goedel WC, Shapiro A, Cerda M, Tsai JW, Hadland SE, Marshall BDL, 2020. Association of racial/ethnic segregation with treatment capacity for opioid use disorder in counties in the United States. JAMA Netw Open 3, e203711. [DOI] [PMC free article] [PubMed] [Google Scholar]
- Grogan CM, Andrews C, Abraham A, Humphreys K, Pollack HA, Smith BT, Friedmann PD, 2016. Survey highlights differences in Medicaid coverage for substance use treatment and opioid use disorder medications. Health Aff. (Millwood) 35, 2289–2296. [DOI] [PMC free article] [PubMed] [Google Scholar]
- Haffajee RL, Andraka-Christou B, Attermann J, Cupito A, Buche J, Beck AJ, 2020. A mixed-method comparison of physician-reported beliefs about and barriers to treatment with medications for opioid use disorder. Subst Abuse Treat Prev Policy 15, 69. [DOI] [PMC free article] [PubMed] [Google Scholar]
- Hansen H, Siegel C, Wanderling J, DiRocco D, 2016. Buprenorphine and methadone treatment for opioid dependence by income, ethnicity and race of neighborhoods in New York city. Drug Alcohol Depend 164, 14–21. [DOI] [PMC free article] [PubMed] [Google Scholar]
- Hansen HB, Siegel CE, Case BG, Bertollo DN, DiRocco D, Galanter M, 2013. Variation in use of buprenorphine and methadone treatment by racial, ethnic, and income characteristics of residential social areas in New York city. J. Behav. Health Serv. Res 40, 367–377. [DOI] [PMC free article] [PubMed] [Google Scholar]
- Hatcher AE, Mendoza S, Hansen H, 2018. At the expense of a life: Race, class, and the meaning of buprenorphine in pharmaceuticalized “care”. Subst. Use Misuse 53, 301–310. [DOI] [PMC free article] [PubMed] [Google Scholar]
- Iheanacho T, Payne K, Tsai J, 2020. Mobile, community-based buprenorphine treatment for veterans experiencing homelessness with opioid use disorder: A pilot, feasibility study. Am. J. Addict [DOI] [PubMed] [Google Scholar]
- IOM, 1995. Federal regulation of methadone treatment National Academies Press, Washington DC. [PubMed] [Google Scholar]
- Jones CM, Warner M, Hedegaard H, W C, 2019. Data quality considerations when using county-level opioid overdose death rates to inform policy and practice. Drug Alcohol Depend 204, 107549. [DOI] [PMC free article] [PubMed] [Google Scholar]
- Knudsen HK, Lofwall MR, Havens JR, Walsh SL, 2015. States’ implementation of the Affordable Care Act and the supply of physicians waivered to prescribe buprenorphine for opioid dependence. Drug Alcohol Depend 157, 36–43. [DOI] [PMC free article] [PubMed] [Google Scholar]
- Krawczyk N, Buresh M, Gordon MS, Blue TR, Fingerhood MI, Agus D, 2019. Expanding low-threshold buprenorphine to justice-involved individuals through mobile treatment: Addressing a critical care gap. J. Subst. Abuse Treat 103, 1–8. [DOI] [PMC free article] [PubMed] [Google Scholar]
- Krawczyk N, Feder KA, Fingerhood MI, Saloner B, 2017. Racial and ethnic differences in opioid agonist treatment for opioid use disorder in a U.S. National sample. Drug Alcohol Depend 178, 512–518. [DOI] [PMC free article] [PubMed] [Google Scholar]
- Lagisetty PA, Ross R, Bohnert A, Clay M, Maust DT, 2019. Buprenorphine treatment divide by race/ethnicity and payment. JAMA Psychiatry 76, 979–981. [DOI] [PMC free article] [PubMed] [Google Scholar]
- Lin L, Knudsen HK, 2019. Comparing buprenorphine-prescribing physicians across nonmetropolitan and metropolitan areas in the United States. Ann. Fam. Med 17, 212–220. [DOI] [PMC free article] [PubMed] [Google Scholar]
- Manhapra A, Petrakis I, Rosenheck R, 2017. Three-year retention in buprenorphine treatment for opioid use disorder nationally in the Veterans Health Administration. Am. J. Addict 26, 572–580. [DOI] [PubMed] [Google Scholar]
- Manhapra A, Stefanovics E, Rosenheck R, 2020. Initiating opioid agonist treatment for opioid use disorder nationally in the Veterans Health Administration: Who gets what? Subst. Abus 41, 110–120. [DOI] [PubMed] [Google Scholar]
- Mattick RP, Breen C, Kimber J, Davoli M, 2009. Methadone maintenance therapy versus no opioid replacement therapy for opioid dependence. Cochrane Database Syst Rev, CD002209. [DOI] [PubMed] [Google Scholar]
- Mattick RP, Breen C, Kimber J, Davoli M, 2014. Buprenorphine maintenance versus placebo or methadone maintenance for opioid dependence. Cochrane Database Syst Rev, CD002207. [DOI] [PubMed] [Google Scholar]
- McBain RK, Dick A, Sorbero M, Stein BD, 2020. Growth and distribution of buprenorphine-waivered providers in the United States, 2007–2017. Ann. Intern. Med 172, 504–506. [DOI] [PMC free article] [PubMed] [Google Scholar]
- McKenna RM, 2017. Treatment use, sources of payment, and financial barriers to treatment among individuals with opioid use disorder following the national implementation of the ACA. Drug Alcohol Depend 179, 87–92. [DOI] [PubMed] [Google Scholar]
- McLellan AT, Starrels JL, Tai B, Gordon AJ, Brown R, Ghitza U, Gourevitch M, Stein J, Oros M, Horton T, Lindblad R, McNeely J, 2014. Can substance use disorders be managed using the chronic care model? Review and recommendations from a NIDA consensus group. Public Health Rev 35. [DOI] [PMC free article] [PubMed] [Google Scholar]
- Meinhofer A, Witman AE, 2018. The role of health insurance on treatment for opioid use disorders: Evidence from the Affordable Care Act Medicaid expansion. J. Health Econ 60, 177–197. [DOI] [PubMed] [Google Scholar]
- Mojtabai R, Mauro C, Wall MM, Barry CL, Olfson M, 2019. Medication treatment for opioid use disorders in substance use treatment facilities. Health Aff. (Millwood) 38, 14–23. [DOI] [PMC free article] [PubMed] [Google Scholar]
- Oliva EM, Trafton JA, Harris AH, Gordon AJ, 2013. Trends in opioid agonist therapy in the Veterans Health Administration: Is supply keeping up with demand? Am. J. Drug Alcohol Abuse 39, 103–107. [DOI] [PubMed] [Google Scholar]
- Phelan JC, Link BG, 2005. Controlling disease and creating disparities: a fundamental cause perspective. J. Gerontol. B Psychol. Sci. Soc. Sci 60 Spec No 2, 27–33. [DOI] [PubMed] [Google Scholar]
- Priest KC, McCarty D, 2019. Making the business case for an addiction medicine consult service: a qualitative analysis. BMC Health Serv. Res 19, 822. [DOI] [PMC free article] [PubMed] [Google Scholar]
- Saloner B, Levin J, Chang HY, Jones C, Alexander GC, 2018. Changes in buprenorphine-naloxone and opioid pain reliever prescriptions after the Affordable Care Act Medicaid expansion. JAMA Netw Open 1, e181588. [DOI] [PMC free article] [PubMed] [Google Scholar]
- SAMHSA, 2019. Key substance use and mental health indicators in the United States: Results from the 2018 National Survey on Drug Use and Health Center for Behavioral Health Statistics and Quality, Substance Abuse and Mental Health Services Administration, Rockville, MD. [Google Scholar]
- SAMHSA, 2020. The opioid crisis and the Black/African American population: An urgent issue. Office of Behavioral Health Equity, Substance Abuse and Mental Health Services Administration. [Google Scholar]
- Sharp A, Jones A, Sherwood J, Kutsa O, Honermann B, Millett G, 2018. Impact of Medicaid expansion on access to opioid analgesic medications and medication-assisted treatment. Am. J. Public Health 108, 642–648. [DOI] [PMC free article] [PubMed] [Google Scholar]
- Stein BD, Dick AW, Sorbero M, Gordon AJ, Burns RM, Leslie DL, Pacula RL, 2018. A population-based examination of trends and disparities in medication treatment for opioid use disorders among Medicaid enrollees. Subst. Abus 39, 419–425. [DOI] [PMC free article] [PubMed] [Google Scholar]
- Stein BD, Gordon AJ, Dick AW, Burns RM, Pacula RL, Farmer CM, Leslie DL, Sorbero M, 2015a. Supply of buprenorphine waivered physicians: the influence of state policies. J. Subst. Abuse Treat 48, 104–111. [DOI] [PMC free article] [PubMed] [Google Scholar]
- Stein BD, Pacula RL, Gordon AJ, Burns RM, Leslie DL, Sorbero MJ, Bauhoff S, Mandell TW, Dick AW, 2015b. Where is buprenorphine dispensed to treat opioid use disorders? The role of private offices, opioid treatment programs, and substance abuse treatment facilities in urban and rural counties. Milbank Q 93, 561–583. [DOI] [PMC free article] [PubMed] [Google Scholar]
- Thomas CP, Doyle E, Kreiner PW, Jones CM, Dubenitz J, Horan A, Stein BD, 2017. Prescribing patterns of buprenorphine waivered physicians. Drug Alcohol Depend 181, 213–218. [DOI] [PubMed] [Google Scholar]
- Towne SD Jr., 2017. Socioeconomic, geospatial, and geopolitical disparities in access to health care in the US 2011–2015. Int. J. Environ. Res. Public Health 14. [DOI] [PMC free article] [PubMed] [Google Scholar]
- Wen H, Borders TF, Cummings JR, 2019. Trends in buprenorphine prescribing by physician specialty. Health Aff. (Millwood) 38, 24–28. [DOI] [PubMed] [Google Scholar]
- Wen H, Hockenberry JM, Pollack HA, 2018. Association of buprenorphine-waivered physician supply with buprenorphine treatment use and prescription opioid use in Medicaid enrollees. JAMA Netw Open 1, e182943. [DOI] [PMC free article] [PubMed] [Google Scholar]
- Wilson N, Kariisa M, Seth P, Smith H.t., Davis NL, 2020. Drug and opioid-involved overdose deaths - United States, 2017–2018. MMWR Morb. Mortal. Wkly. Rep 69, 290–297. [DOI] [PMC free article] [PubMed] [Google Scholar]