
Figure 3.
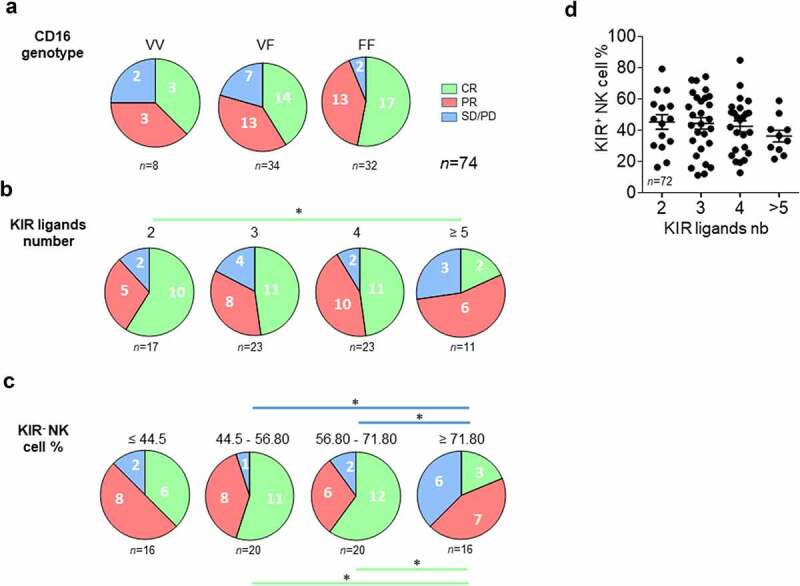
Lower KIR ligand numbers and peripheral blood KIR− NK cell frequency are good prognostic markers of rituximab responses in lymphoma patients. (a) Pie charts representing the distribution of lymphoma patients (n = 74) following clinical outcome (CR, PR, and SD/PD) and CD16 polymorphism (VV, VF, and FF). (b) Pie charts representing the distribution of lymphoma patients following clinical outcome (CR, PR, and SD/PD) and the number of KIR ligands (2, 3, 4 or ≥5). (c) Pie charts representing the distribution of lymphoma patients following clinical outcome (CR, PR, and SD/PD) and the KIR− NK cell frequency (≤ 44.5, 44.5–56.80, 56.80–71.80 and ≥ 71.80). (d) KIR+ NK cell frequencies following the number of KIR ligands for all lymphoma patients. The green and blue lines determine the significant difference between 2 groups for CR and SD/PD outcomes *p < .05