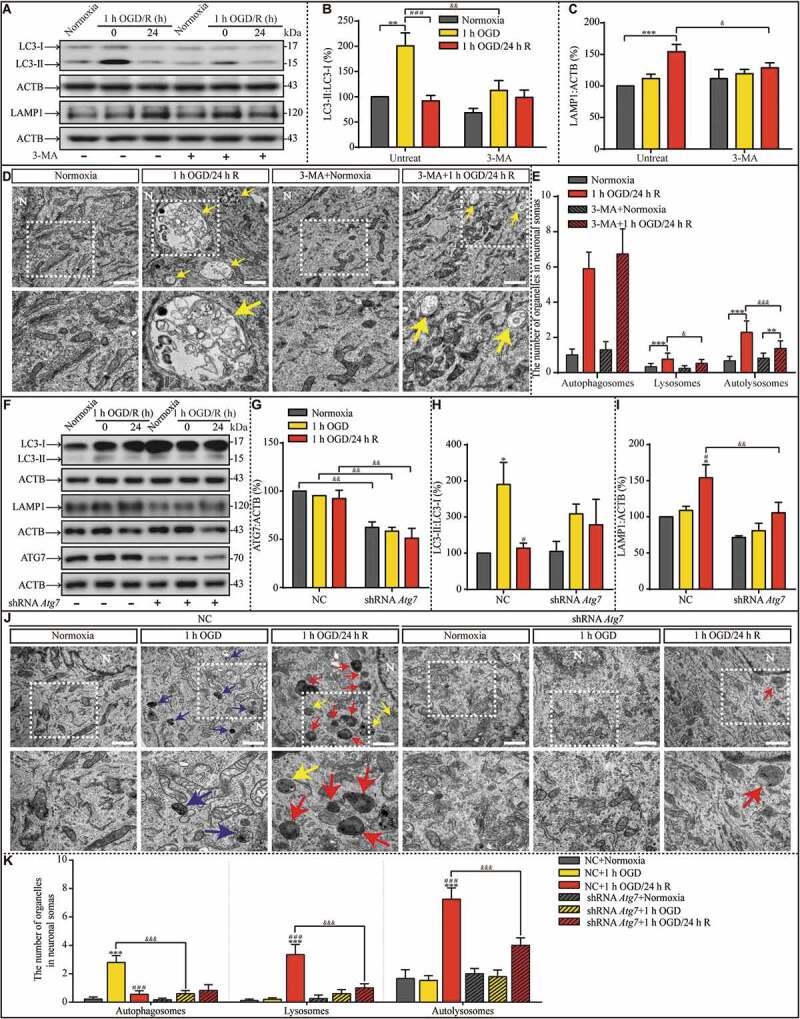
Figure 4.

Suppression of OGD-induced autophagy upregulation by 3-MA pretreatment or ATG7 genetic knockdown prevents lysosomal accumulation during the subsequent reperfusion, respectively. (A-C) The LC3-II:LC3-I ratio and LAMP1 protein levels in indicated groups. (D and E) Representative images and quantitative analysis of autophagosomes, lysosomes, and autolysosomes in indicated groups with or without 3-MA treatment. Yellow arrows depict autolysosomes. N: nucleus; scale bar: 1 μm. (B, n = 6; C, n = 5; E, normoxia: n = 18; 1-h OGD/24-h R: n = 21; 3-MA+normoxia: n = 17; 3-MA+1-h OGD/24-h R: n = 27; B, C and E, **p < 0.01, ***p < 0.001 vs. the indicated normoxia group, respectively; ###p < 0.001 vs. the 1-h OGD group; &p < 0.05, &&p < 0.01, &&&p < 0.001 vs. the indicated condition without 3-MA). (F-I) Representative western blots and quantitative analysis of ATG7, LC3, and LAMP1 in the indicated groups. ACTB was used as the loading control. (J and K) The numbers of autophagosomes, lysosomes, and autolysosomes in the indicated groups were evaluated with TEM. Scale bar: 1 μm. NC: negative control. N: nucleus. Blue, yellow, or red arrowheads indicate representative autophagosomes, autolysosomes, or lysosomes, respectively (G, H and I, n = 3; K, NC+normoxia, n = 9; NC+1-h OGD, n = 15; NC+1-h OGD/24-h R, n = 20; shRNA Atg7+normoxia, n = 12; shRNA Atg7+1-h OGD, n = 13; shRNA Atg7+1-h OGD/24-h R, n = 17; G, H, I and K, *p < 0.05, ***p < 0.001 vs. the NC+normoxia group; #p < 0.05 or ###p < 0.001 vs. the NC+1-h OGD group; &&p < 0.01 or &&&p < 0.001 vs. the indicated condition with NC). Statistical comparisons were carried out with one-way ANOVA. Data are shown as the mean ± SEM
