Figure 7.

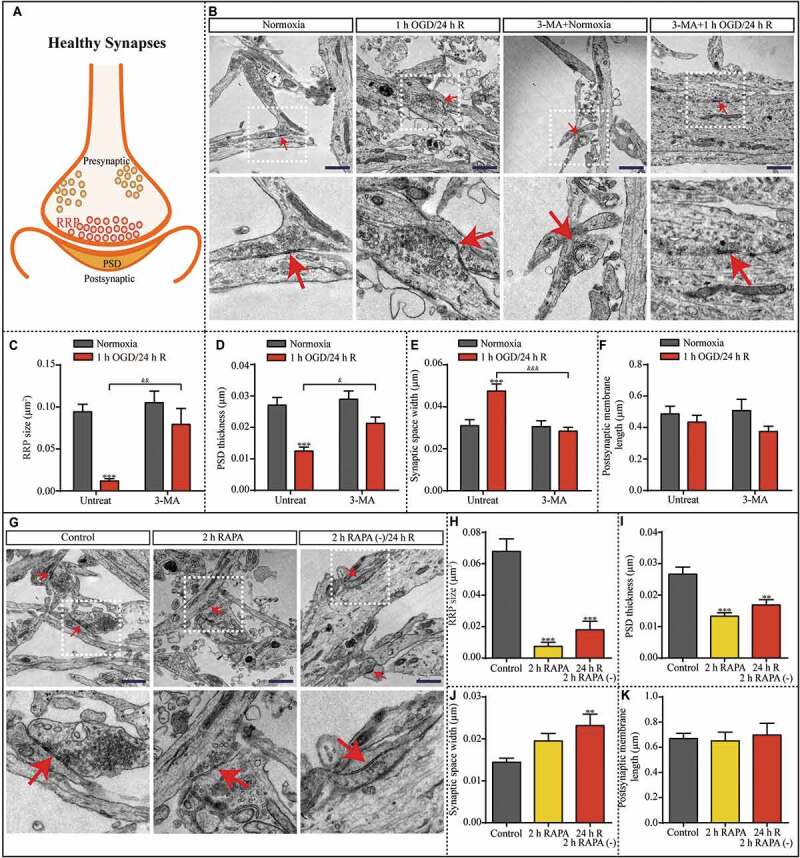
Synaptic structures are altered after 1 h OGD/24 h reperfusion; these changes are prevented by 3-MA treatment and partially mimicked by RAPA treatment. (A) Illustration of healthy synaptic structure under normoxic condition. (B) Representative TEM images showing the synapses of neurons in the indicated groups with or without 3-MA. RRP size (C), PSD thickness (D), synaptic space width (E), and postsynaptic membrane length (F) in the neurons were evaluated in the indicated groups (normoxia, n = 31; 1-h OGD/24-h R, n = 24; 3-MA+normoxia, n = 19; 3-MA+1-h OGD/24-h R, n = 31; ***p < 0.001 vs. the normoxia group; &p < 0.05, &&p < 0.01, &&&p < 0.001 vs. 1-h OGD/24-h R without 3-MA). (G) Representative TEM images showing the synapses of neurons exposed to RAPA treatment. (H) RRP size, (I) PSD thickness, (J) synaptic space width, and (K) postsynaptic membrane length in the neurons were evaluated in the indicated groups (control, n = 27; 2 h RAPA, n = 21; 2 h RAPA (-)/24 h R, n = 19; **p < 0.01, ***p < 0.001 vs. the control group); scale bar: 1 μm. Red arrowheads indicate representative synapses. Statistical comparisons were carried out with one-way ANOVA. Data are shown as the mean ± SEM
