ABSTRACT
Retinal ischemia is a major cause of vision loss and a common underlying mechanism associated with diseases, such as diabetic retinopathy and central retinal artery occlusion. We have previously demonstrated the robust neuroprotection in retina induced by post-conditioning (post-C), a brief period of ischemia, 24 h, following a prolonged and damaging initial ischemia. The mechanisms underlying post-C-mediated retinal protection are largely uncharacterized. We hypothesized that macroautophagy/autophagy is a mediator of post-C-induced neuroprotection. This study employed an in vitro model of oxygen glucose deprivation (OGD) in the retinal R28 neuronal cell line, and an in vivo rat model of retinal ischemic injury. In vivo, there were significant increases in autophagy proteins, MAP1LC3-II/LC3-II, and decreases in SQSTM1/p62 (sequestosome 1) in ischemia/post-C vs. ischemia/sham post-C. Blockade of Atg5 and Atg7 in vivo decreased LC3-II, increased SQSTM1, attenuated the functional protective effect of post-C, and increased histological damage and TUNEL compared to non-silencing siRNA. TUNEL after ischemia in vivo was found in retinal ganglion, amacrine, and photoreceptor cells. Blockade of Atg5 attenuated the post-C neuroprotection by a brief period of OGD in vitro. Moreover, in vitro, post-C attenuated cell death, loss of cellular proliferation, and defective autophagic flux from prolonged OGD. Stimulating autophagy using Tat-Beclin 1 rescued retinal neurons from cell death after OGD. As a whole, our results suggest that autophagy is required for the neuroprotective effect of retinal ischemic post-conditioning and augmentation of autophagy offers promise in the treatment of retinal ischemic injury.
Abbreviations: BECN1: Beclin 1, autophagy related; DAPI: 4’,6-diamidino-2-phenylindole; DR: diabetic retinopathy; EdU: 5-ethynyl-2’-deoxyuridine; ERG: Electroretinogram; FITC: Fluorescein isothiocyanate; GCL: Ganglion cell layer; GFAP: Glial fibrillary acidic protein; INL: Inner nuclear layer; IPL: Inner plexiform layer; MAP1LC3/LC3: Microtubule-associated protein 1 light chain 3; OGD: Oxygen-glucose deprivation; ONL: Outer nuclear layer; OP: Oscillatory potential; PFA: Paraformaldehyde; PL: Photoreceptor layer; post-C: post-conditioning; RFP: Red fluorescent protein; RGC: Retinal ganglion cell; RPE: Retinal pigment epithelium; RT-PCR: Real-time polymerase chain reaction; SEM: Standard error of the mean; siRNA: Small interfering RNA; SQSTM1: Sequestosome 1; STR: Scotopic threshold response; Tat: Trans-activator of transcription; TUNEL: Terminal deoxynucleotidyl transferase dUTP nick end labeling
KEYWORDS: ATG proteins, autophagic flux, LC3, macroautophagy/autophagy, MTOR, post-ischemic conditioning, retina, SQSTM1/p62, TUNEL
Introduction
Retinal ischemia is a major cause of vision loss and a common underlying pathology in diseases affecting millions, including diabetic retinopathy (DR) and age-related macular degeneration (AMD). The pathophysiology of retinal ischemic injury includes inflammation, glial activation, oxidative stress, and death of retinal neurons leading to visual loss [1]. The regenerative capacity of the human retina is limited, and current treatment options for DR, such as intraocular injections (e.g., anti-VEGFA, vascular endothelial factor A), eye drops, and surgery, are primarily focused on arresting disease progression, but their effectiveness is limited [2]. Thus, treatment of retinal ischemia and its consequences is a priority and calls for new approaches to overcome a lack of specificity, toxicity, and side effects of treatments.
A more recent advance from our laboratory utilizes the retina’s endogenous protective mechanisms through ischemic post-conditioning (post-C), a transient ischemic stimulus applied as late as 24 h after damaging retinal ischemia. Post-C conferred potent neuroprotection and facilitated robust functional and histological recovery after retinal ischemic injury in rats [3].
There have been few studies examining the mechanisms of retinal post-C, although we showed that AKT1 (thymoma viral proto-oncogene 1) was required [4], and subsequently that post-C altered TRP53/p53, cell cycle, apoptosis, MAPK (mitogen activated protein kinase), JAK-STAT (Janus kinase-signal transducer and transcription activator), and HIF1A/HIF-1(hypoxia inducible factor 1, alpha subunit) pathways [5]. Macroautophagy/autophagy is another candidate pathway in ischemic injury or protection from injury [6]. It occurs at low levels constitutively and can be further activated under stress (e.g., exercise) and energy-deprived (fasting) conditions to recycle damaged proteins and organelles [7]. Emerging evidence implicates autophagy as an intrinsic protective response to cerebral and myocardial ischemia and chronic degenerative diseases, e.g., Alzheimer [8]. A number of studies evaluated the essential role of autophagy in ocular homeostasis, particularly in the retinal pigment epithelium or photoreceptors [9–11]. However, studies on retinal ischemia and autophagy, where the inner retina is the predominant site of pathology, have yielded conflicting results. These discrepancies are due to, among other factors, the ischemia model used, and use of various nonspecific inhibitors of autophagy [12–14].
Based on the role of autophagy as a cytoprotective mechanism enabling retinal cells to salvage essential nutrients under stressed conditions, we hypothesized that autophagy is triggered by post-C and is essential for post-C-induced neuroprotection from retinal ischemia. In the present study, we utilized a rat in vivo model of retinal ischemia and post- C [15]. Also, based upon our previous studies [16], we established a new in vitro model of simulated ischemia-reperfusion with oxygen-glucose deprivation (OGD) and “post-C.” Using in vivo and in vitro models of retinal ischemia and post-conditioning, specific inhibition with small interfering RNA (siRNA), and specific stimulation of autophagy using Tat-Beclin 1, we assessed the involvement of autophagy in rendering retinal neuroprotection against ischemic injury.
RESULTS
Atg5 and Atg7 silencing blocked post-C enhancement of retinal function and its prevention of cell loss after ischemia
Intravitreal injection of Atg5 and Atg7 siRNA 6 h prior to post-C decreased levels of their corresponding proteins ATG5 and ATG7 (Figure 1). Functionally, this decrease resulted in a significant decrease in the a- and b-waves, and P2 amplitudes recovery at 7 d after ischemia/post-C vs. the non-silencing scrambled siRNA-injected ischemia + post-C group (n = 9 per group, Figure 2). This outcome can be seen most readily with the ERG waves in the ischemic eyes expressed relative to the baseline and the normal eye (“normalized” data, Figure 2A), or, alternatively, as comparisons of absolute values, the latter particularly for the b-wave and P2 (Figure 2B). We found no impact of siRNA for Atg5 and Atg7 on the a-wave, b-wave, OP, or P2 in the non-ischemic eyes (Figure 3). For both nSTR and pSTR, there were significant decreases in recovery in the siRNA- and scrambled-treated ischemia + post-C groups (Figure 3).
Figure 1.
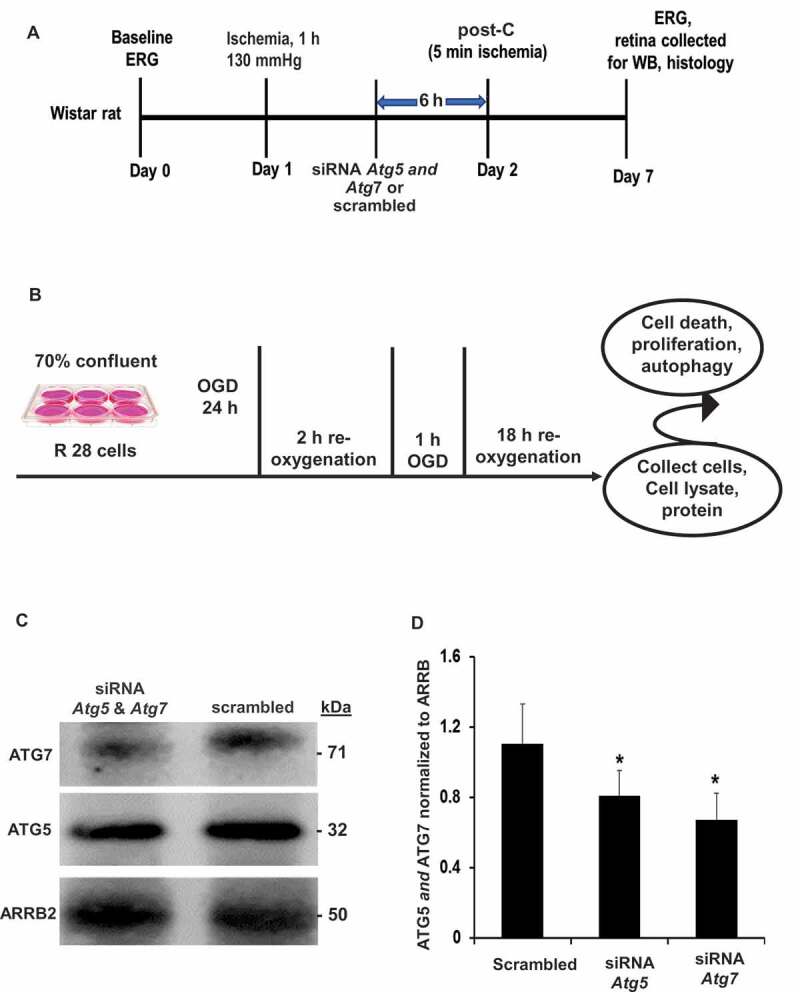
Schematic representation of experimental protocol. (A) in vivo rat (B) in vitro R28 cell line ischemia and post-C model. (C, D) Representative western blot image and densitometry demonstrating the silencing effect on ATG5 and ATG7 in vivo with intravitreal administration of siRNA. Results were normalized for protein loading using ARRB2. Mean ± SEM; N = 4 per group; * = p < 0.05 for siRNA to Atg5 and Atg7 vs. scrambled. ERG: electroretinogram; OGD: oxygen-glucose deprivation; siRNA Atg: interfering RNA to Atg; WB: western blot
Figure 2.
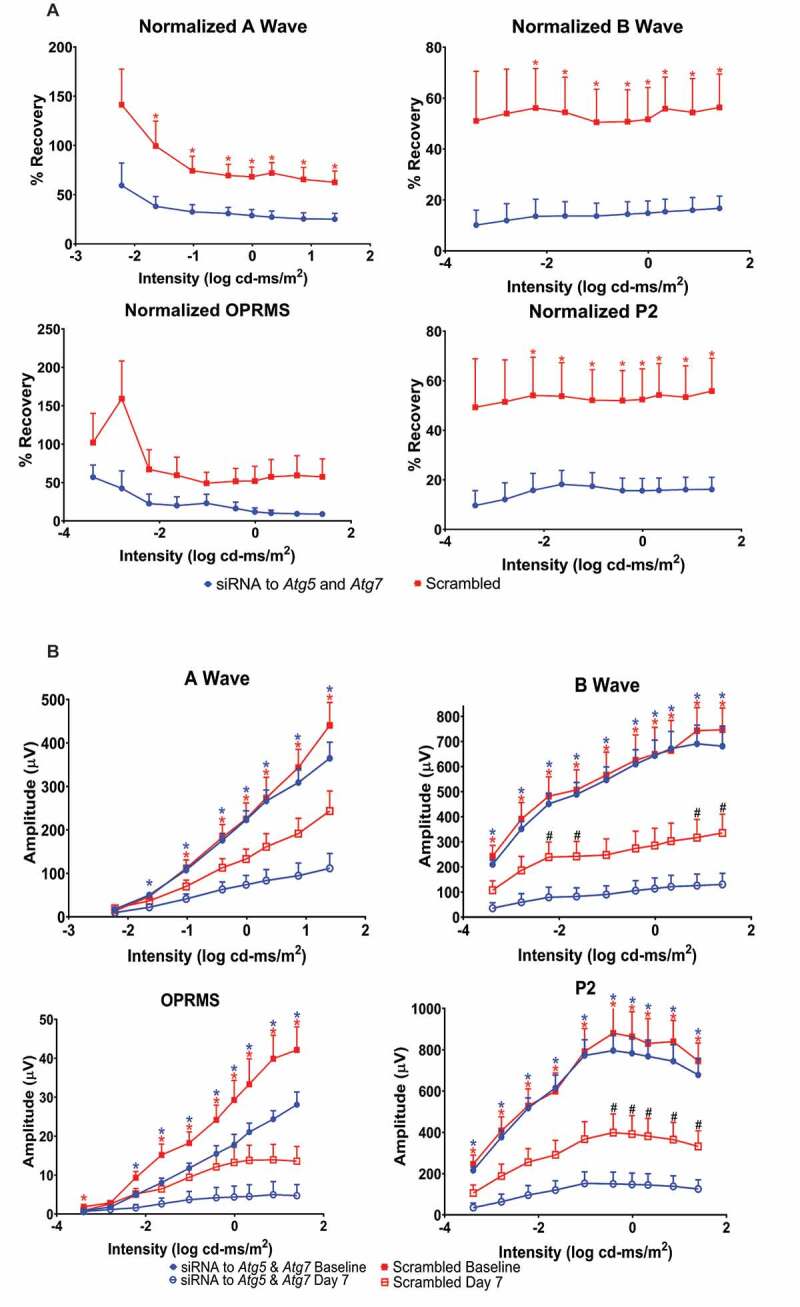
Autophagy is required for functional retinal recovery by post-C after ischemia in vivo. Stimulus intensity response in post-conditioned ischemic rat retinae injected with Atg5 and Atg7 siRNA. (A) Normalized ERG amplitude data for a- and b-waves, oscillatory potentials (OP; shown as OPRMS, OP Root Mean Square) and P2 over a range of flash intensities (x-axis, log cd-ms/m2). Y-axis = calculated % recovery of amplitudes relative to baseline. Data were recorded at baseline (prior to ischemia) and 7 d after post-C (post-C was 24 h after ischemia) and shown as mean ± SEM. N = 9 per group; * = p < 0.05 for non-silencing scrambled vs. siRNA to Atg5 and Atg7. Description of data points appears at bottom of the graph. (B) Absolute ERG amplitude data for ischemic eyes for a- and b-waves, OP and P2 over a range of flash intensities (log cd-ms/m2) shown on the x-axis. Y-axis is absolute amplitude (µV); mean ± SEM, and N = 9 per group. Blue * indicates p < 0.05 for baseline vs. day 7 ischemic eyes in siRNA-treated group. Red * indicates p < 0.05 for baseline vs. day 7 ischemic eyes in scrambled-treated group. # indicates significant difference between ischemic eyes for siRNA vs. scrambled groups. Description of data points appears at bottom of the graph
Figure 3.
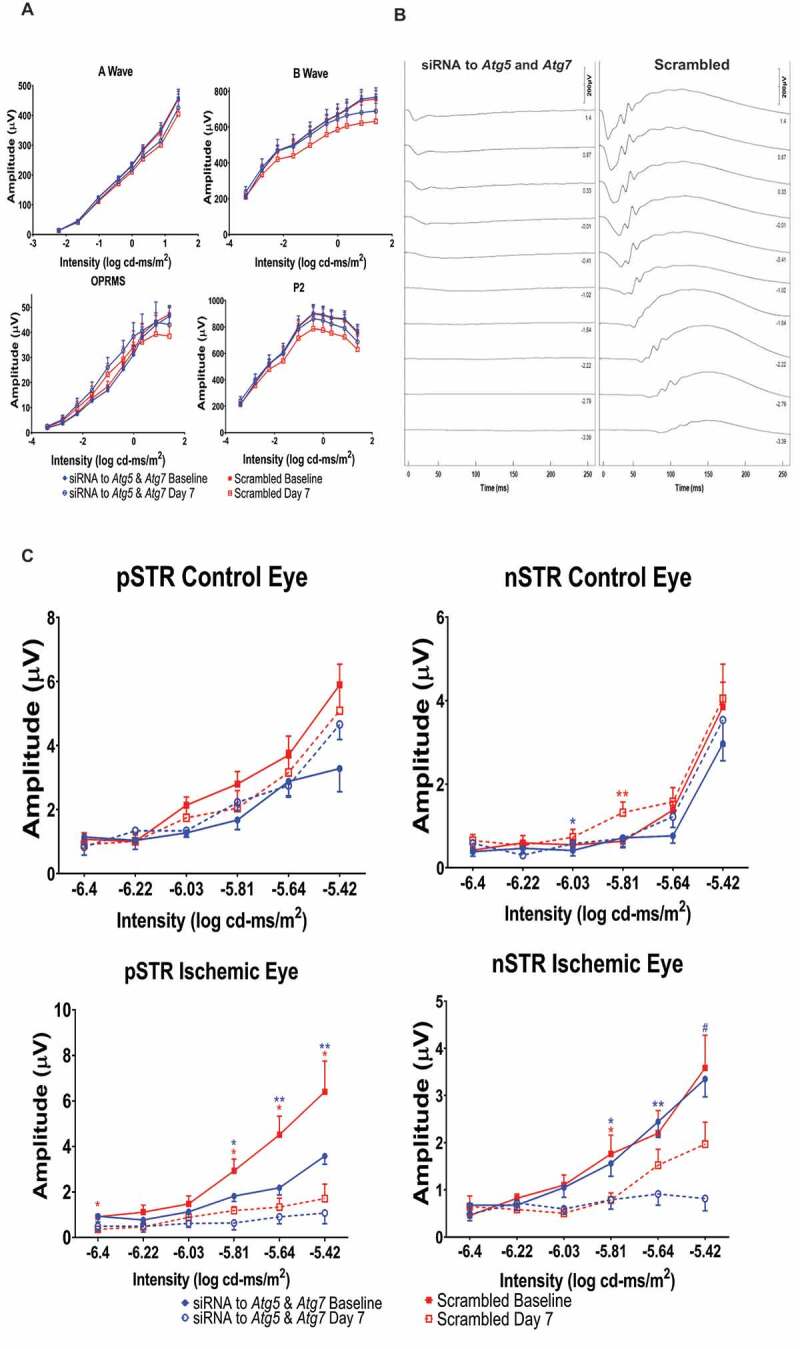
ERG absolute values, representative traces, and the scotopic threshold responses. (A) Stimulus-intensity responses for the absolute values of amplitudes of a- and b-waves, OP, and P2 in the non-ischemic control eyes. ERGs recorded at baseline and 7 d after ischemia and post-C. Y-axis is absolute amplitude (µV), and x-axis is the stimulus intensity (log cd-ms/m2). Description of data points appears at bottom of the graph. Data are shown as mean ± SEM.(B) Representative ERG tracings for ischemic groups. Time after flash in milliseconds (ms) on x-axis. Scale bar for amplitude in top right corners. (C) Stimulus intensity responses for the scotopic threshold response (STR), showing the positive STR (pSTR) and negative STR (nSTR) in rats subjected to retinal ischemia and post-conditioning and the eyes injected with siRNA for Atg5 and Atg7 or scrambled. STRs were recorded from the control and ischemic eyes at baseline and 7 d after post-C. Absolute amplitude appears on the y-axis (see Methods) and the 6 flash intensities (log cd-ms/m2) are on the x-axis. Description of data points appears at bottom of the graph. Data are shown as mean ± SEM; blue * for p < 0.05 for siRNA group, and red ** p < 0.05 for scrambled group. N = 9 for both groups. Symbols for bottom ischemic eye graphs: blue * indicates p < 0.05, and blue ** is p < 0.01 between baseline and day 7 ischemic eyes of the siRNA-injected group; red * indicates p < 0.05 between baseline and day 7 ischemic eyes of the scrambled groups, blue # indicates p < 0.01 between the siRNA and scrambled groups
At 7 d after ischemia/post-C, there was a significant decrease in the number of cells in the retinal ganglion cell (RGC) and inner nuclear layers (INL) in the siAtg5- and siAtg7-treated vs. the scrambled-treated ischemic retinae (Table 1), and no differences in the cell counts in the ONL (outer nuclear layer). Post-C, as expected, suppressed TUNEL after ischemia, and the addition of siRNA increased TUNEL, with most TUNEL located in the ONL and INL. Knockdown by siRNA increased TUNEL in ischemia + post-C group (Figure 4A), indicating that siRNA to Atg5 attenuated the anti-apoptosis effect of post-C. TUNEL was present in RGCs, amacrine cells, photoreceptors, and microglia/macrophages incorporated TUNEL cells in the inner nuclear layer. Under non-ischemic conditions, there was minimal TUNEL. When siRNA was administered with ischemia alone, TUNEL was widespread throughout the retina (Figure 4B).
Table 1.
Histology after retinal ischemia
| Mean number of cells in RGC layer | |
|---|---|
| Scrambled siRNA + post-C | 9.7 ± 0.5 |
| Atg5 and Atg7 siRNA + post-C | 7.3 ± 0.4* |
| Number of INL cells/area | |
| Scrambled siRNA + post-C | 2.6 ± 0.01 |
| Atg5 and Atg7 siRNA + post-C | 2.2 ± 0.01* |
| Number of ONL cells/area | |
| Scrambled siRNA + post-C | 5.5 ± 0.02 |
| Atg5 and Atg7 siRNA + post-C | 5.2 ± 0.03 |
(A) Mean number of cells/area (± SEM) in retinal ganglion cell (RGC) layer in the ischemic retinae 7 days after ischemia + post-C with scrambled siRNA injected 6 h before post-C compared to the number of cells in the ischemic retinae for Atg5 and Atg7 siRNA injected 6 h before post-C.
* = p < 0.01 vs. scrambled via unpaired t test
(B) Mean number (± SEM) of INL cells/area (μm2; x 100) in the ischemic retinae 7 d after ischemia + post-C with scrambled siRNA injected 6 h before post-C compared to the ischemic retinae for Atg5 and Atg7 siRNA injected 6 h before post-C.
* = p < 0.04 vs. scrambled via unpaired t test
(C) Mean number (± SEM) of ONL cells/area (μm2; x 100) in the ischemic retinae 7 days after ischemia + post-C with scrambled siRNA injected 6 h before post-C compared to the ischemic retinae for Atg5 and Atg7 siRNA injected 6 h before post-C.
Figure 4.
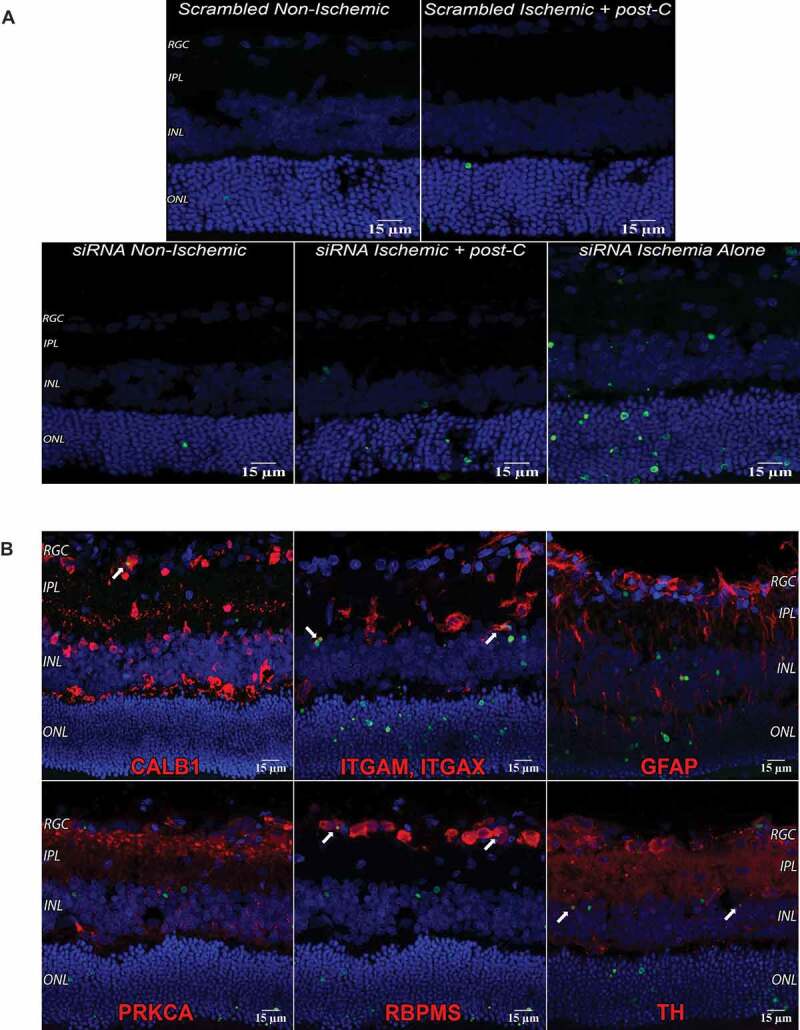
TUNEL and autophagy in the retina. (A) TUNEL, Atg5 silencing, and ischemia. The 14 µm cryosections were prepared from retinas taken 24 h after post-C (that is, 48 h after ischemia). DAPI: blue, TUNEL: green, and examined using confocal microscopy. Clockwise from top left: scrambled, non-ischemic, scrambled, ischemia + post-C, siRNA with ischemia alone, siRNA + ischemia + post-C, and siRNA, non-ischemic. These are representative images from N = 3 per group; magnification 40x. (B) TUNEL in specific cells in the retina after ischemia. DAPI: blue, TUNEL: green, and markers for retinal cells are red. White arrows (top left panel) show yellow overlap of CALB1 and TUNEL, in what is likely a displaced amacrine cell. ITGAM and ITGAX double labeling (white arrows, top middle panel) are microglia or monocytes engulfing TUNEL cells in the INL, and TH (tyrosine hydroxylase) double labeling (white arrows, bottom-right panel) shows TUNEL in amacrine cells in the INL. RBPMS (RNA binding protein with multiple splicing) double labeling shows TUNEL in RGCs (white arrows, bottom middle panel). No co-labeling was found with GFAP, or PRKCA. TUNEL is also visible in the photoreceptor layer. These are representative images from N = 3 per group; magnification 40x
ATG5 and ATG7 protein levels were decreased by about 40% by siRNA silencing even after 7 d post-transfection (Figure 5A,B). Reflecting the functional impact of Atg5 blockade by siRNA at 3 and 7 d after intravitreal injection of siRNA in non-ischemic retinae, MAP1LC3-II/LC3-II levels in retinal homogenates were significantly decreased by > 80% relative to that of control (Figure 5A,B), while SQSTM1 levels increased significantly about 2.5-fold (Figure 5A,B), suggesting that blockade of Atg5 decreased autophagic flux in vivo [17].
Figure 5.
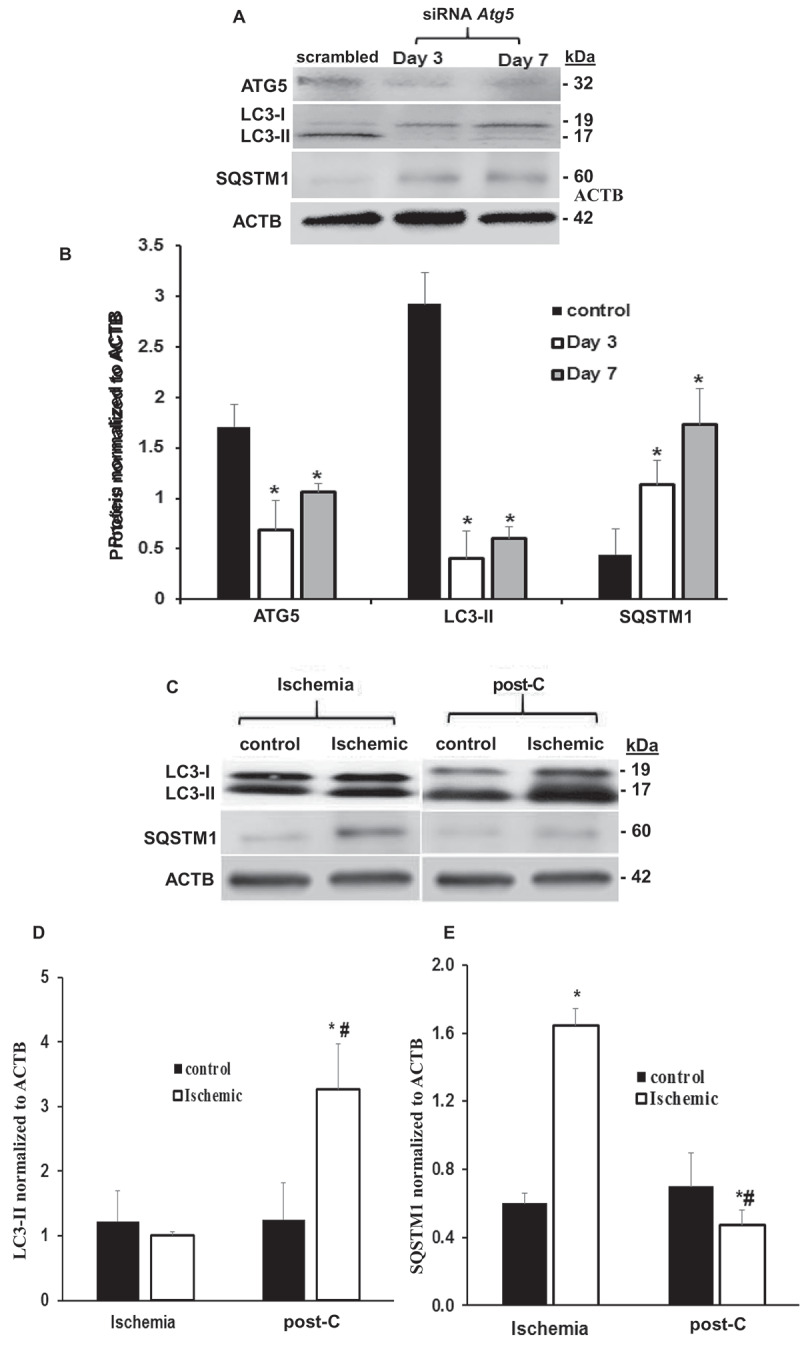
Atg5 silencing and post-C induction of autophagy in vivo. (A and B) Representative western blot images and densitometry bar graphs demonstrating decreased autophagy in Atg5-silenced retinae as decreased LC3-II and increased SQSTM1 post-silencing days 3 and 7. Mean ± SEM; n = 4 per group. * = p < 0.05 comparing control scrambled siRNA- to Atg5 siRNA-silenced group. ACTB was loading control. (C) Representative western blot image demonstrating increased LC3-II and decreased SQSTM1 protein levels in ischemia + post-C retinae vs. ischemia + sham post-C in vivo collected 7 d after post-C. (D and E) Densitometry analysis of protein levels of LC3-II and SQSTM1 in ischemia + post-C retinae vs. ischemia + sham post-C. mean ± SEM; n = 6 per group. * = p < 0.05 comparing within groups, non-ischemic to ischemic paired eyes; # = p < 0.05 comparing ischemia + sham post-C vs. ischemia + post-C eyes between groups
Impact of ischemia and post-C on autophagy proteins and MTOR in vivo
Western blotting demonstrated increased LC3-II and decreased SQSTM1 in ischemia + post-C retinae in vivo collected 7 d after post-C (Figure 5C,E). There was a significant increase in LC3-II in paired ischemia + post-C vs. non-ischemic control, and in ischemia + post-C vs. ischemia + sham post-C retinae. SQSTM1 increased with ischemia + sham post-C vs. non-ischemic control and decreased with ischemia + post-C, suggesting that ischemia decreased autophagic flux, while post-C added to ischemia increased autophagic flux in vivo. By immunohistochemistry, siRNA reduced levels of ATG5 both in non-ischemic and ischemic + post-C retinae (Figure 6A). Most ATG5 expression was in inner retina and some in the ONL. In both the non-ischemic and the ischemic + post-C retinae, siRNA reduced levels of ATG5 throughout the retina and attenuated the ischemia + post-C induced increased expression of ATG5.
Figure 6.

Impact of Atg5 silencing in vivo. Immunostaining for ATG5, SQSTM1, and LC3-II with Atg5 silencing in vivo. (A-C) are 7 µm retinal cryosections at 4 d after ischemia (i.e., 3 d after siRNA administration), examined using confocal microscopy; magnification 40x. (A) siRNA to Atg5 reduced levels of ATG5 in immunostained sections. DAPI: blue; ATG5: red. Representative images from N = 3 per group. (B) siRNA to Atg5 increased levels of SQSTM1 on immunostained sections. DAPI: blue. SQSTM1 (green staining) is in the RGC layer and INL and was increased by Atg5 siRNA under baseline conditions and with ischemia + post-C. Representative images from N = 3 per group. (C) siRNA to Atg5 reduced levels of LC3 on immunostained sections. DAPI: blue and LC3-II: red. Most of the LC3-II was located in the inner retinal layers and increased in the ONL with ischemia. These are representative images from N = 3 per group
SQSTM1 was in the RGC layer and INL, and was increased by Atg siRNA at baseline conditions and with ischemia + post-C (Figure 6B) relative to the scrambled-treated retinae. Under non-ischemic conditions, siRNA to Atg5 decreased LC3-II relative to scrambled. siRNA to Atg5 also attenuated the increased LC3-II levels seen with ischemia + post-C (Figure 6C).
With respect to MTOR signaling, a previous study shows that axotomy activates MTOR in rodents in a subset of RGCs [18]. Hypoxia activates MTOR in retinal Muller cells in vitro [19]. In retinal cryosections taken at 24 h after post-C or sham post-C (48 h after ischemia), levels of MTOR, and downstream p-RPS6 KB1 (ribosomal protein S6 kinase, polypeptide 1), p-EIF4EBP1 (eukaryotic translation initiation factor 4E-binding protein 1) were highest in normal, non-ischemic eyes, decreased with ischemia + post-C + scrambled, and were intermediate in ischemia + post-C + siRNA. Muller cells, astrocytes, and retinal ganglion cells expressed MTOR and its phosphorylated downstream targets (Figure 7A and 7B).
Figure 7.
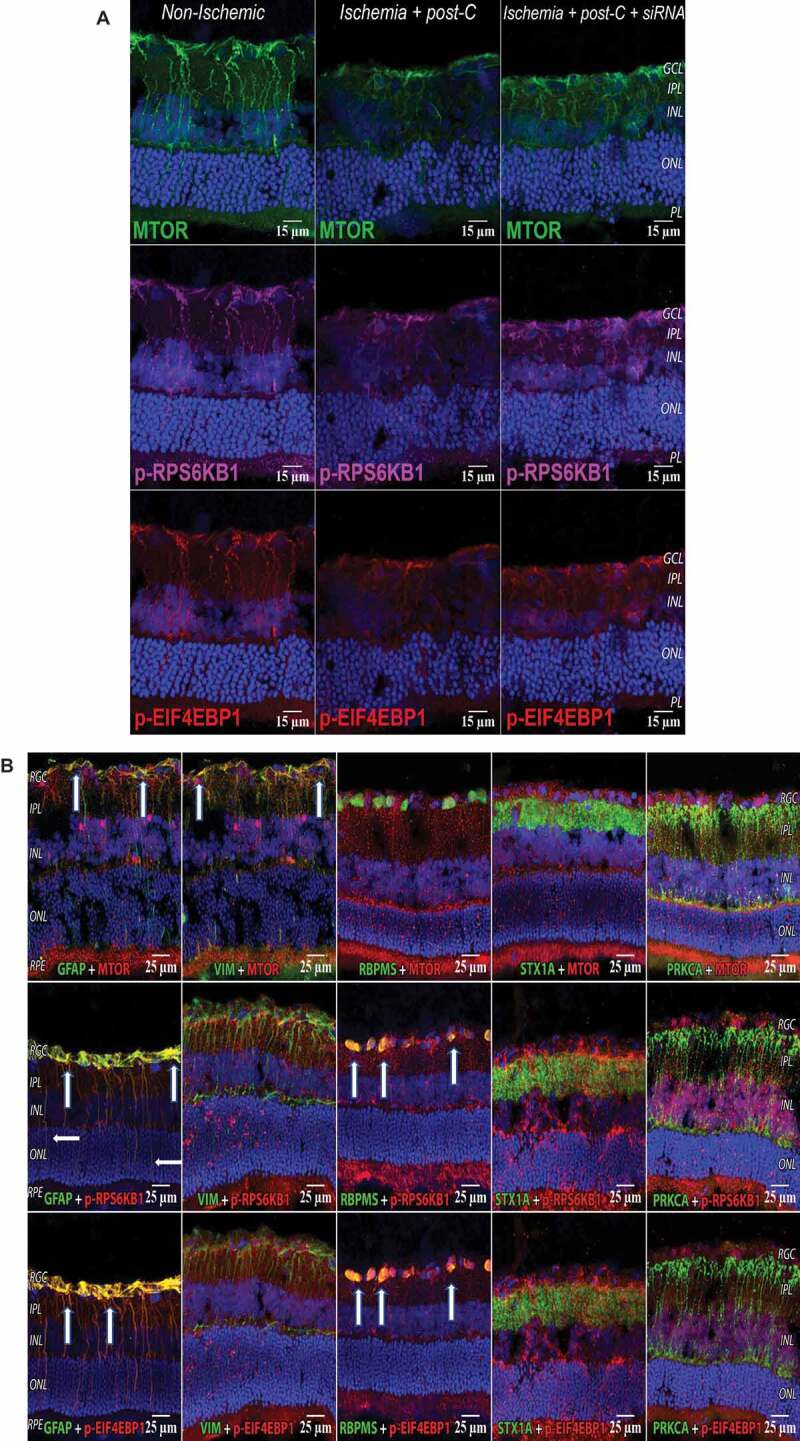
MTOR pathway in retina with ischemia and post-C. (A) Changes in immunostaining for the MTOR pathway (from left to right) in normal, ischemia + post-C + scrambled, and ischemia + post-C + Atg5 siRNA. Retinal cryosections were prepared 24 h after post-C (that is, 48 h after ischemia), and examined using confocal microscopy. From top to bottom are staining for MTOR, p-RPS6KB1, and p-EIF4EBP1. These are representative images from N = 3 per group. Orientation is shown on far right; magnification 40x. (B) Localization of MTOR pathway proteins in retinal cells. These cryosections are all taken from the same group, ischemia + post-C + scrambled Atg5 siRNA, at 24 h after post-C (that is, 48 h after ischemia). Nuclei were stained blue using DAPI. From top to bottom are staining (red) for MTOR, p-RPS6KB1, and p-EIF4EBP1. From left to right (staining green) are: GFAP (Muller cells); VIM (for astrocytes); RBPMS (retinal ganglion cells); STX1A (amacrine cells); PRKCA (bipolar cells). For GFAP, white arrows indicate yellow overlap of MTOR (red), p-RPS6KB1: red; and p-EIF4EBP1: red with GFAP: green, in Muller cell endplates and projections. For VIM, white arrows indicate yellow overlap of MTOR (red) and VIM (green) in the superficial inner retina. For RBPMS, white arrows indicate yellow overlap of p-RPS6KB1: red, and p-EIF4EBP1: red with RBPMS: green in retinal ganglion cells. There was no evident overlap with the MTOR pathway for STX1A (amacrine cells), and PRKCA (bipolar cells). Orientation on far left. RGC = retinal ganglion cells, IPL = inner plexiform layer, INL = inner nuclear layer, ONL = outer nuclear layer, RPE = retinal pigment epithelium. Representative images from N = 3 per group; magnification 40x
Autophagy is involved in simulated ischemia and post-C in retinal R28 cells
Retinal R28 cells expressed markers for neurons (TUBB3 [tubulin, beta 3 class III]; CALB1 [calbindin 1]; STX1A [syntaxin 1A {brain}]; NEFH [neurofilament, heavy polypeptide]; PRKACA [protein kinase, cAMP dependent, catalytic, alpha]) and astrocytes (GFAP [glial fibrillary protein]; and VIM [vimentin]) (Figure 8 and Table 2). The in vitro model (Figure 1) simulated ischemia using 24 h of OGD. A subsequent period of “post-C” by 1 h of OGD attenuated cell death (Figure 9A). OGD significantly reduced cellular proliferation, an effect likewise reversed by post-C (Figure 9B). OGD produced a non-significant decrease in LC3-II, but post-C added to OGD significantly increased LC3-II vs. normoxia and vs. OGD (Figure 9C,D). SQSTM1 increased significantly with OGD and decreased significantly vs. OGD when post-C was added. OGD significantly decreased BECN1, which increased significantly with post-C added to OGD. OGD significantly increased apoptosis-related gene expression, as indicated by levels of cleaved-CASP3 (caspase-3), which was significantly attenuated by post-C (Figure 9C,D). Electron micrographs (EM) (Figure 10A) showed characteristic double-membrane autophagosomes in R28 cells. With OGD, autophagosomes appeared densely packed with cellular material; however, with post-C added, the autophagosomes were larger in size, and less densely packed compared to OGD.
Figure 8.
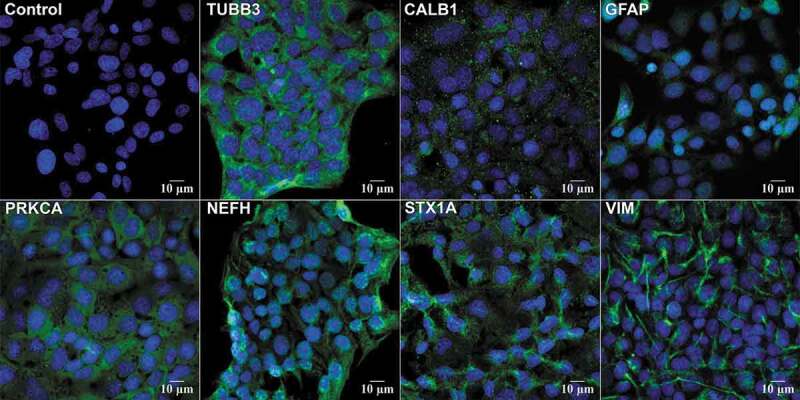
Neuronal markers in R28 cells. R28 cells were stained with primary antibodies to retinal cell protein markers (Table 3) and imaged using confocal microscopy. DAPI (blue) stains the cell nuclei. All other markers were imaged using green secondary antibody. Clockwise, starting from top left: control IgA, TUBB3 staining cytoplasm and axons of retinal neurons; CALB1 (retinal horizontal cells); GFAP (Muller glial cells); VIM (astrocytes); STX1A (amacrine neurons) showing cytoplasmic staining; NFH (neurofilament); PRKCA (retinal bipolar neurons) showing cytoplasmic staining. These are representative images from N = 4; magnification 63x
Table 2.
Gene expression of retinal cell markers in R28 cell culture
| Gene Name | Mean CT (n = 8) |
SEM | Fold-change relative to Gapdh |
|---|---|---|---|
| Vim (vimentin) | 18.20 | 0.048 | 0.24 |
| Prkca (protein kinase C, alpha) | 22.94 | 0.098 | 0.009 |
| Nfh (neurofilament heavy chain) | 26.00 | 0.148 | 0.001 |
| Stx1a (syntaxin 1) | 26.14 | 0.0928 | 0.001 |
| Calb1 (calbindin 1) | 31.07 | 0.1928 | 0.00003 |
| Calb2 (calbindin 2) | 30.10 | 0.139 | 0.00006 |
| Tubb3 (tubulin, beta 3 class III) | 30.09 | 0.072 | 0.00006 |
| Gapdh | 16.15 | 0.166 | 1.0 |
| A1cf * | 39.43 | 2.366 | 0.0000001 |
Real-time PCR was performed on R28 cells. Lower mean CT indicates higher levels in R28 cells. The negative control is A1cf and the positive is Gapdh for comparison. Thus Vim, Prkca, Nfh, Stx1a, and Calb1 and Calb2, shown in descending order in the table, are the most abundant retinal neuronal markers in R28 cells under the culture conditions we used. * 3 out of 8 samples had undetectable A1cf.
Figure 9.
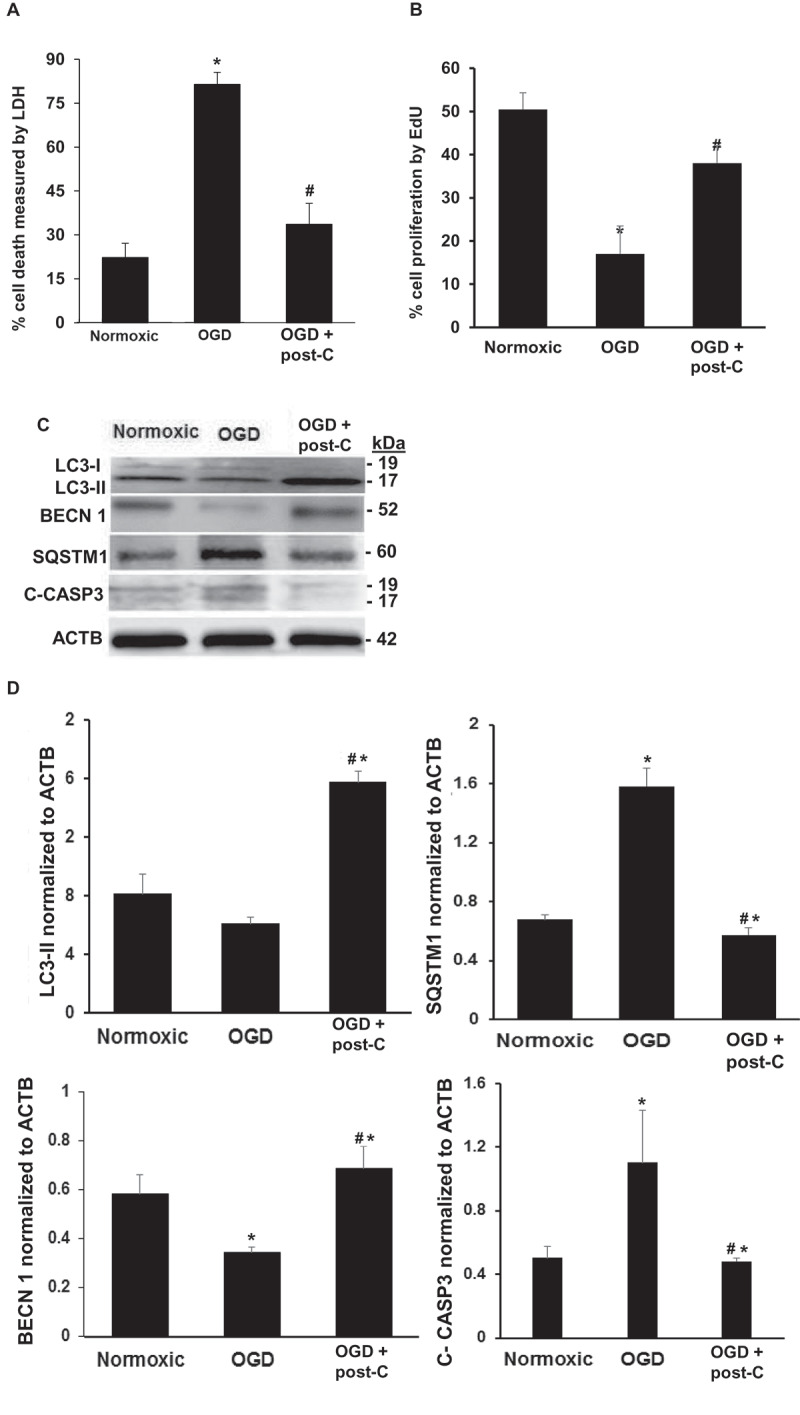
Post-C attenuates cell death, enhances cell proliferation, induces autophagy, and prevents apoptosis in R28 retinal neuronal cells subjected to OGD in vitro. (A) Simulated post-C robustly decreased cell death (Y-axis, % cell death, LDH assay) in retinal R28 cells in vitro subjected to OGD. mean ± SEM; n = 6 per group. * = p < 0.05 OGD vs. normoxic conditions; # = p < 0.05 OGD + post-C vs. OGD alone. (B) Simulated post-C increased cell proliferation (Click-iT EdU) in retinal R28 cells in vitro subjected to OGD. mean ± SEM; n = 6 per group. * = p < 0.05 OGD vs. normoxic conditions; # = p < 0.05 OGD + post-C vs. OGD alone. (C) Representative western blot images showing altered levels of LC3-II, SQSTM1, BECN1, and C-CASP3 (cleaved caspase-3) in R28 cells subjected to OGD and post-C. OGD produced minimal change in LC3-II, but when post-C was added, there was a significant increase in LC3-II. SQSTM1 levels were increased with OGD and restored to levels similar to normoxia conditions by post-C. BECN1 levels decreased with OGD and increased when post-C was added to OGD. C-CASP3 was increased by OGD, and this increase was attenuated with post-C. (D) Bar graphs of densitometry analysis of protein levels of LC3-II, SQSTM1, BECN1, and C-CASP3, normalized to ACTB. mean ± SEM; n = 4 per group. * = p < 0.05 vs. normoxia; # = p < 0.05 OGD vs. OGD + post-C
Figure 10.
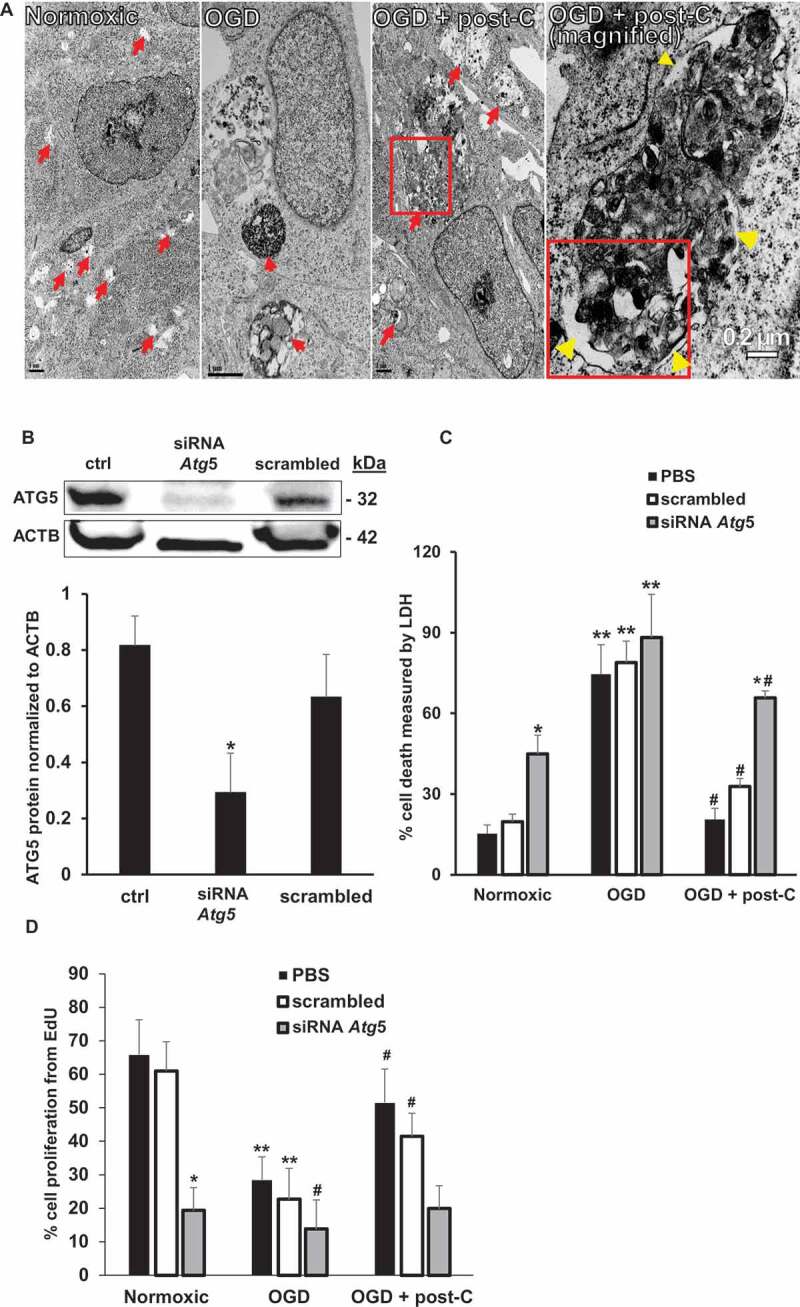
Blockade of Atg5 attenuates post-C-mediated neuroprotection in R28 cells subjected to OGD in vitro. (A) EM evidence of autophagy induction by post-C in R28 retinal neuronal cells. Electron micrographic images of autophagosomes in R28 cells subjected to normoxia, OGD and OGD + post-C. Red arrows point to autophagosomes. With OGD, autophagosomes appeared densely packed with cellular material. When post-C was added, the autophagosomes were larger in size, and less densely packed compared to OGD. Yellow arrowheads in the magnified image (far-right) inside and outside the boxed area indicate double membranes. Scale bar = 1 µm except for right-most image at 0.2 µm. (B) Representative western blot illustrating the silencing efficiency of Atg5 siRNA in R28 cells. The cells were treated with PBS (“control”), siRNA to Atg5, or scrambled. mean ± SEM; n = 4 per group; * = p < 0.05 siRNA Atg5 vs. control or scrambled. ACTB was loading control. (C) Atg5 silencing and cell death with normoxia, OGD, and OGD + post-C measured by LDH assay. mean ± SEM; n = 5 per treatment; * = p < 0.05 for scrambled or control vs. siRNA within groups; ** = p < 0.05 normoxia vs. OGD for each treatment; # = p < 0.05 OGD vs. OGD + post-C. (D) Atg5 silencing significantly altered proliferation in all three groups measured by EdU assay. mean ± SEM; n = 5 per treatment; * = p < 0.05 for scrambled or control vs. siRNA within groups; ** = p < 0.05 normoxia vs. OGD for each treatment; # = p < 0.05 OGD vs. OGD + post-C
To determine the impact in vitro on cell death and proliferation of blocking autophagy in OGD, Atg5 was silenced using siRNA, resulting in > 70% decrease in protein levels (Figure 10B). Under normoxic conditions, siRNA to Atg5 increased cell death and decreased proliferation vs. phosphate-buffered saline (PBS) or scrambled (Figure 10C,D). OGD significantly increased cell death and decreased proliferation, irrespective of incubation with PBS, scrambled, or Atg5 siRNA, with no difference between the groups. Post-C decreased cell death and restored proliferation in PBS and scrambled groups compared to the parallel groups in OGD, while siAtg5 blocked this recovery effect of post-C. Furthermore, siAtg5 significantly increased cell death and decreased proliferation in normoxic cells.
Autophagic flux, post-C, and cell death in simulated ischemia in vitro.
While increases in LC3-II in vivo support the presence of autophagy, its protein levels cannot assess autophagic flux. Decreases in SQSTM1 are commonly believed to represent a flux measurement as the protein is degraded through autophagy [20]. To directly test autophagic flux, we performed tandem RFP-GFP-LC3 labeling [21] on R28 cells subjected to OGD/post-C. Atg5 siRNA significantly attenuated autophagic flux in normoxia, in OGD, and blunted the ameliorative effect of post-C on OGD-induced flux impairment. (Figure 11)
Figure 11.
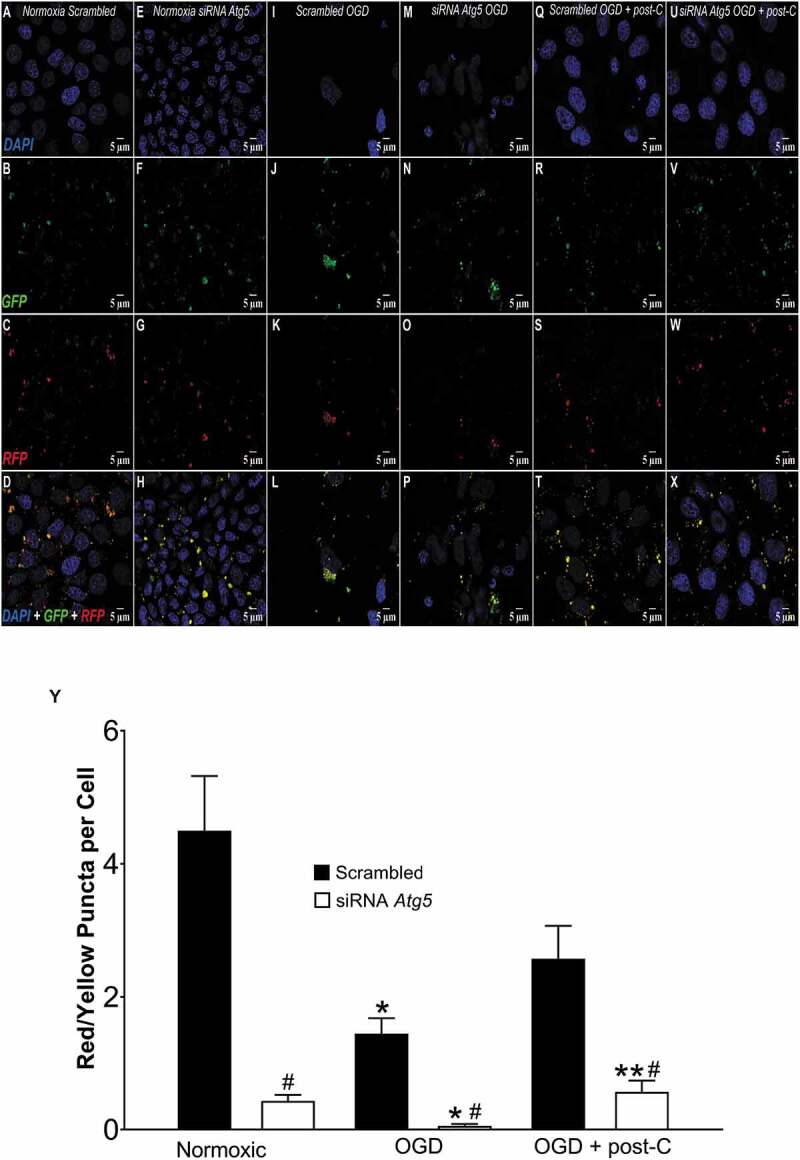
Post-C induced autophagic flux and its blockade by Atg5 siRNA in vitro. (A-X) Representative immunofluorescence images comparing autophagic flux in R28 cells subjected to (from left to right) normoxia, OGD, and, OGD + post-C using tandem RFP-GFP-LC3 sensor. In each experiment, top to bottom are DAPI, GFP, RFP, and merged images, all displayed at 63x via confocal imaging. In this assay, yellow puncta represent autophagosomes and red puncta are autolysosomes. (A-D) Normoxic R28 cells + scrambled. (E-H) Normoxic R28 cells + Atg5 siRNA. (I-L) R28 cells subjected to OGD + scrambled. (M-P): R28 cells subjected to OGD + Atg5 siRNA. (Q-T) R28 cells subjected to OGD+ post-C + scrambled. (U-X) R28 cells subjected to OGD + post-C + Atg5 siRNA. (Y): Quantification of flux (red/yellow puncta per cell, mean ± SEM) N = 4. * = p < 0.05 vs normoxia; # = p < 0.05 vs scrambled; ** = p < 0.05 vs OGD + siRNA
To further test autophagy flux, cell death, and the impact of post-C (Figure 12A,X), rapamycin was used as a positive control to activate autophagy. Figure 12Y shows the quantitative flux results graphically. There was suppression of flux by OGD, and post-C added to OGD restored flux (more yellow and red puncta than green in merged images in far-right panels of Figure 12A,X). Rapamycin significantly increased flux in OGD compared to control. Chloroquine and PIK-III blunted the increased flux from post-C + OGD. PIK-III also significantly worsened OGD-flux impairment, and chloroquine tended (P < 0.09) to worsen OGD-flux impairment. Chloroquine increased the number of yellow puncta per cell, indicating an accumulation of autophagosomes.
Figure 12.
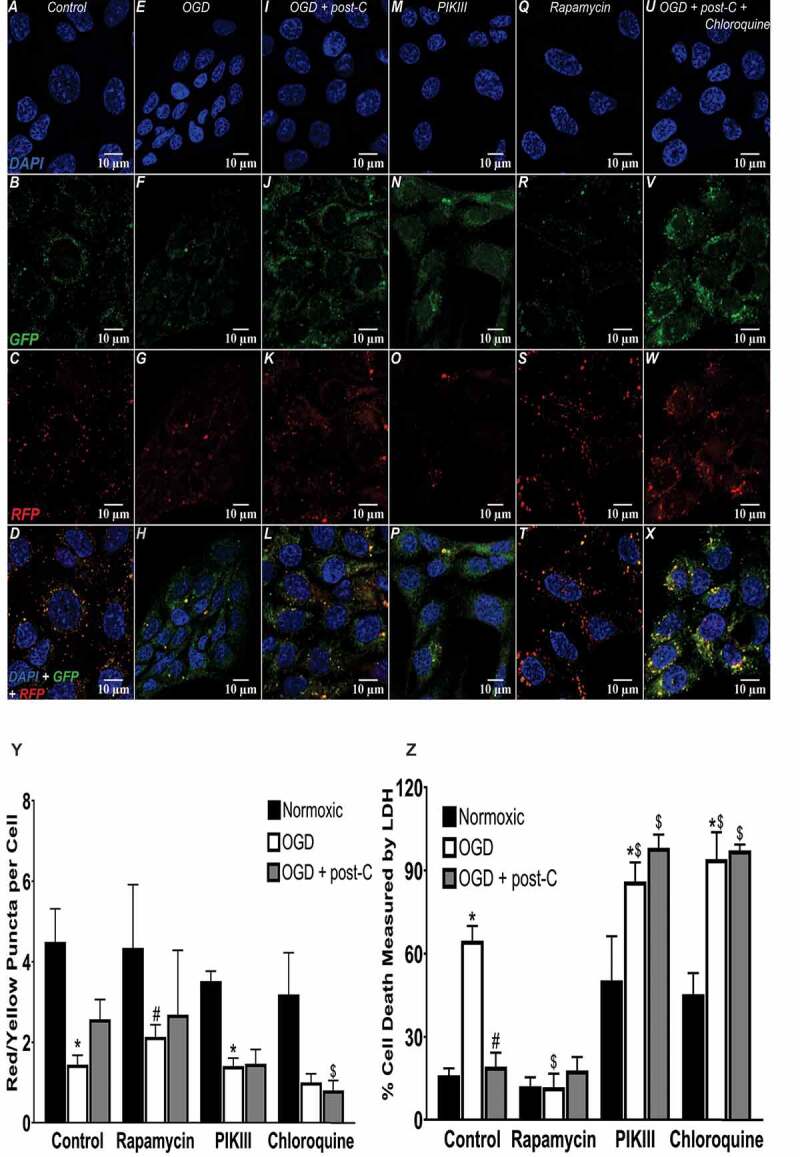
Autophagic flux, stimulants, and antagonists in simulated ischemia in vitro. (A-X) Representative immunofluorescence images comparing autophagic flux in R28 cells subjected to OGD + post-C using tandem RFP-GFP-LC3 reagent, PIK-III and chloroquine as negative control autophagy inhibitors, and rapamycin to stimulate autophagy, as a positive control. In each experiment, top to bottom are DAPI, GFP, RFP, and merged, all displayed at 63x. (Y) Quantitation of flux (red/yellow puncta per cell): mean ± SEM; N = 4. * = P < 0.05 vs normoxia; # = p < 0.05 vs. control OGD; $ = p < 0.05 vs. control OGD + post-C. mean ± SEM; N = 6. * = p < 0.05 normoxia vs. OGD within groups. # = p < 0.05 for OGD alone vs. OGD + post-C, $ = p < 0.05 for matched groups vs. control (far-left bars of each set)
Cell death was significantly decreased in R28 cells pre-treated with rapamycin before OGD, similar to the effect of post-C (Figure 12Z). Rapamycin added to post-C did not produce any additive effect on decreasing cell death in OGD. Chloroquine and PIK-III significantly enhanced cell death in normoxia and OGD and prevented the cell-death attenuating effect of post-C (Figure 12Z).
Activating autophagy prevents cell death from OGD in retinal neurons
To further test the hypothesis that activating autophagy prevents retinal cell death, R28 cells were incubated with Tat-Beclin 1, a fusion of cell-penetrating Tat via a diglycine linker with a peptide from BECN1 (RRRQRRKKRGYGGDHWIHFTANWV). The peptide interacts with a negative autophagy regulator, GLIPR2/Golgi-associated plant pathogenesis-related protein 1 [22]. This results in release of a pool of BECN1, specifically enhancing stage 2 of autophagy, and vesicle nucleation [23]. Incubating R28 cells with Tat-Beclin 1 (Novus Biologicals, NBP2-49888, D11) significantly reduced cell death following OGD from 90% to 55% vs. peptide control and prevented OGD-induced loss of cell proliferation (Figure 13A,C.D). Tat-Beclin 1 increased BECN1 and LC3-II, and decreased SQSTM1 in R28 cells subjected to OGD compared to OGD alone, but had minimal impact upon normoxic cells (Figure 13B).
Figure 13.
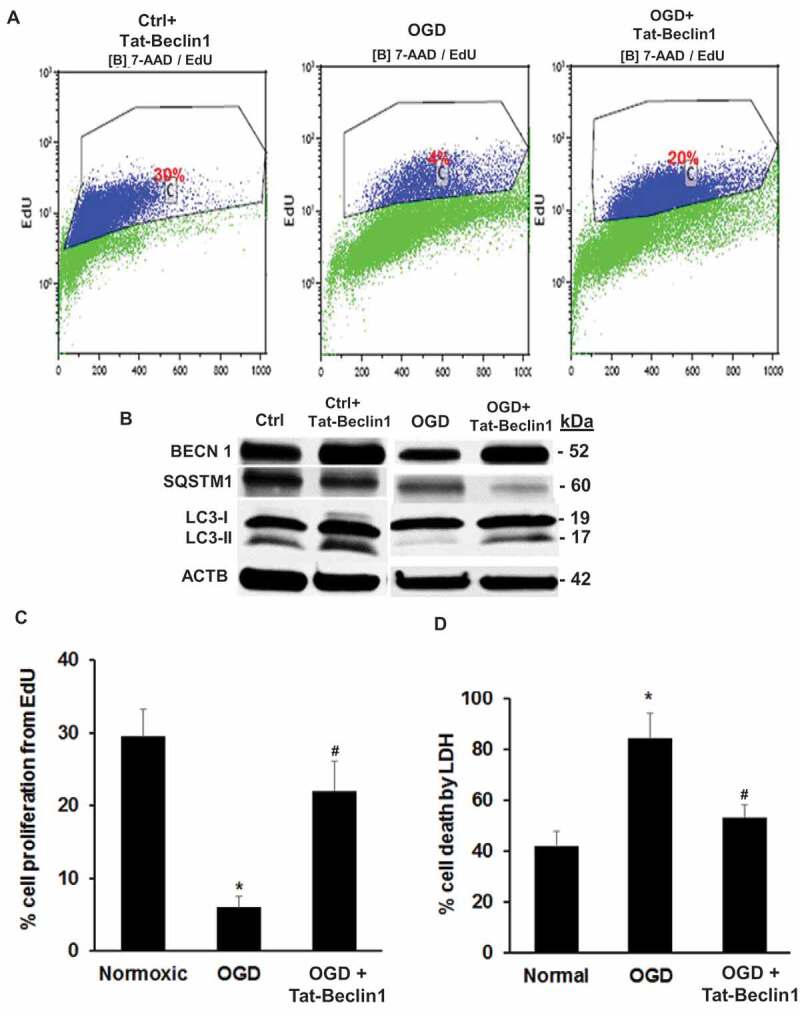
Activating autophagy with Tat-Beclin 1 prevents cell death from OGD in R28 retinal neurons in vitro. (A) Representative flow cytometry histograms, showing that OGD decreased proliferation and Tat-Beclin 1 restored proliferation in cells subjected to OGD. (B) Western blotting indicating the increase in LC3-II and decrease in SQSTM1 in cultures subjected to OGD and treated with Tat-Beclin 1, whereas there was minimal effect in normoxic cultures. (C and D). Bar graphs showing R28 cell proliferation and cell death in groups treated with Tat-Beclin 1 and subjected to OGD. Tat-Beclin 1 robustly attenuated the decreased proliferation (C) and cell death (D) from OGD. mean ± SEM; n = 4 per treatment. * = P < 0.05 normoxic vs OGD; # = P < 0.05 OGD vs OGD +Tat-Beclin 1
Discussion
Since autophagy is an endogenous cellular mechanism for coping with stress, it is an essential survival mechanism in photoreceptors [10]. A large body of data indicates the essential role of autophagy in survival of cells in the outer retina. For example, deleting Atg5 in rod photoreceptors reduced autophagy and diminished cone function [24]. Autophagic breakdown of photo-transduction proteins is essential to prevent photoreceptor degeneration [25]. Similarly, deleting Becn1 or Atg7 in rod photoreceptors increased susceptibility to light damage [26]. Autophagy is also essential for homeostasis in retinal pigment epithelium (RPE). Autophagy increased in ARPE-19 and primary human RPE cells exposed to oxidative stress. SQSTM1 was integral to normal RPE function; when depleted, autophagy declined, whereas, when upregulated, SQSTM1 promoted autophagy [27,28]. In an experimental model of retinal detachment, HIF1A induced autophagy and delayed photoreceptor death [29].
Notably, autophagy does not serve uniformly in a cell survival function in the outer retina. While autophagy clears mutant RHO (rhodopsin) in mice heterozygous for RHOP 23 H, enhancing autophagy increases retinal degeneration [25]. Hence, the role of autophagy in retina must be assessed in the context of the underlying pathological process. There has been much less investigation of autophagy in survival of cells in the inner retina, and specifically, in the few studies reported to date, its role as an endogenous mechanism protecting the retina from ischemic insult has yielded conflicting results. Our main hypothesis was that autophagy is a mechanism of endogenous neuroprotection in the retina induced by post-ischemic conditioning. Post-C is a unique and counter-intuitive phenomenon, where transient ischemia following the prolonged ischemic insult generates a robust ischemic tolerance. Determining its mechanism(s) is an essential step toward potential clinical translation in retinal disease.
Elevating intraocular pressure (IOP) above systolic arterial blood pressure is among the most common experimental methods used to produce retinal ischemia in rodents in vivo. However, there are other techniques, including suture occlusion of the ophthalmic artery and suture or clip occlusion of the central retinal artery. These methods all have different advantages and disadvantages. The occlusion of the central retinal artery is more invasive and may damage the optic nerve and is more difficult to produce reproducibly, while the suture occlusion method also occludes the middle cerebral artery leading to cerebral ischemia. The increased IOP method also produces ischemia of the anterior segment of the eye and completely occludes the choroidal circulation to the outer retina, but is easily reproducible [30]. To enable consistency and comparison with our previous studies, we used the increased IOP method for our study.
It was previously shown that retinal ischemia in rats via increasing IOP activates CAPN1 (calpain 1) and proteolytic BECN1 cleavage and decreases LC3-II. Yet, in RGC-5 cells subject to serum deprivation, BECN1 knockdown prevents LC3-II formation while increasing cell death. Although serum deprivation in vitro might not be equivalent to in vivo ischemia, these results suggest that autophagy is necessary for retinal cell survival, and retinal ischemia might dysregulate autophagy [12]. The authors did not measure cell death or retinal function, and therefore the direct effect of autophagy in retinal ischemia cannot be conclusively stated. Additionally, RGC-5 has been shown to be a photoreceptor, not a retinal ganglion cell line [31]. In contrast, Piras et al. found that retinal ischemia activates LC3, and pharmacological blockade of autophagy using 3-methyladenine partially attenuates the death of cells in the RGC layer after retinal ischemia in a rat model [14]. A ROCK (Rho kinase) inhibitor increases LC3-II and decreases SQSTM1, and prevents optic nerve axonal loss after TNF (tumor necrosis factor) treatment [32]. Contrary, others show that optic nerve axotomy in mice upregulates ATG5, and Atg5 conditional knockout mice enhance cell death [33]. Thus, the involvement of autophagy in retinal ischemia and endogenous ischemic tolerance in the retina remains uncertain. Several findings from our study support the hypothesis that autophagy is necessary for recovery from ischemia and is a mechanism of post-ischemic conditioning. Blockade of ATG proteins essential for autophagosome formation attenuates the functional and histological rescue of the retina afforded by post-C [34]. Immunoblotting on whole retinal homogenates for the proteins showing significant decrease in levels after siRNA, immunostaining on retinal cryosections, and demonstration that siRNA induces a decrease in LC3-II and an increase in SQSTM1 confirms the blockade of ATGs. Significant increases after ischemia and post-C in protein levels of LC3-II [35], compared to ischemia and sham post-C, along with decreases SQSTM1 in ischemia and post-C, suggest that post-C functions by enhancing autophagy and/or maintaining autophagic flux in vivo.
These findings are consistent with previous studies in cerebral ischemia, where post-C activates autophagy; however, here, we show for the first time the essential role of autophagy activation in the neuroprotection of post-conditioning in the retina. With respect to the cellular sites of action of autophagy and post-conditioning in the retina, we have previously shown that autophagosomes are present in the RGC and inner nuclear layers in retinal ischemia [36], where post-conditioning exerts its neuroprotective effects. Furthermore, we show, in the same layers, the presence of autophagic machinery proteins ATG5, SQSTM1, and LC3-II. In the present study, we have demonstrated that the MTOR system, which puts a brake on autophagy with ischemia, is primarily localized to Muller cells and RGCs in the retina. Of note, in the present study, the blockade of ATG5 and ATG7 uniformly decreased recovery of all ERG waveforms after ischemia and increased cell loss in vivo, suggesting a widespread effect of autophagy in inner retinal function.
The MTOR system inhibits autophagy [37]. In our study, MTOR activity (indicated by levels of MTOR and downstream phosphorylated RPS6KB1/S6K and EIF4EBP1/4EBP1) was high under normal conditions, suggesting that MTOR acts as a brake on autophagy. MTOR system activation was reduced in ischemia and post-C retinae treated with non-silencing scrambled sequences, suggesting that post-C may release the MTOR “brake” and lead to activation of autophagy. Ischemia and post-C- + Atg siRNA-treated retina had higher levels of activated MTOR downstream proteins in comparison to ischemia and post-C-treated with non-silencing siRNA, suggesting a reversal of the post-C release of the MTOR “brake.”
An important limitation of the in vivo experiments is the lack of direct measurement of autophagic flux based on the levels of SQSTM1. Therefore, apart from post-C’s attenuation of the ischemia-induced decrease in LC3-II, we cannot determine definitively if autophagic flux in vivo was altered. Accordingly, the in vitro model using OGD in retinal R28 cells is better suited for the measurement of autophagic flux. Although the in vitro model does not replicate retinal inter-cellular interactions, it does allow determination of neuroprotection mechanisms rigorously [38]. The R28 retinal neuronal precursor cell line is an immortalized retinal cell line displaying both neuronal and glial cell properties, which may be an advantage for these experiments. While the ability of these cells to proliferate enables measurement of a critical cell function, they may not behave the same as primary retinal cells, thus it will be necessary to repeat the study in individual retinal primary cells, e.g., RGCs and amacrine cells, to determine the specific effects upon retinal cells. OGD most closely resembles an ischemia-reperfusion injury because changes in cellular PO2 in culture are very similar to those in vivo [39]. Alternatives include glutamate, or withdrawing trophic factors, all of which produce confounding influences [40].
In vitro, the “post-C” stimulus significantly attenuated cell loss and loss of proliferation, thus successfully serving as a means to rescue cells after simulated “ischemia.” Decreases in LC3-II and BECN1, and an increase in SQSTM1, all with simulated ischemia, along with their restoration by post-C, suggested that simulated ischemia disturbed autophagy. Simulated ischemia disturbed autophagic flux and enhanced cell death, both reversed by post-C. Also, the findings on EM suggest that autophagosome-lysosome fusion was impaired by OGD. The blockade of Atg5 by siRNA produced a number of effects in the in vitro model that further supports the role of autophagy in the neuroprotective effect of post-C, including decreased LC3-II, increased SQSTM1, decreased BECN1, increased cell death, and impaired autophagic flux. Positive control rapamycin increased flux and decreased cell death, while autophagy blockers PIK-III and chloroquine, produced the opposite effects, validating our methodology as well as supporting the underlying hypotheses.
It should be noted that the in vitro studies only employed the blockade of Atg5, not Atg7, which was done to simplify the analyses of possible mechanisms of action. In particular, Atg5 siRNA blunted the effect of post-C to reverse the decreased cell proliferation and increased cell death with OGD. Decreased proliferation and survival were induced by Atg5 siRNA in normoxic cells, suggesting that autophagy is necessary for normal function of these cells. Rapamycin activates autophagy nonspecifically, but Tat-Beclin 1 is a specific activator of stage 2 of autophagy. In our experiments, it decreased cell death in an in vitro model of ischemia-reperfusion, thus recapitulating the effect of post-C, suggesting that specific, controlled activation of autophagy could be a viable treatment option in retinal ischemia.
Supporting our findings, a number of studies using pharmacological inhibitors or activators of autophagy suggest that it is necessary for ischemic preconditioning in cerebral ischemia [41]. Papadakis et al. [8] showed that Tsc1/hamartin (TSC complex subunit 1), was upregulated by ischemic preconditioning in CA1 neurons, and its overexpression induces autophagy through an MTOR complex-dependent mechanism. In other models beyond the central nervous system, e.g., acute kidney injury, there have also been conflicting results [42]. In part, some of these differences are due to different models and organ systems.
While our study demonstrates that LC3-II increases after ischemia and post-C, but not after ischemia and sham post-C, a limitation is that we did not determine if that effect was due to increased autophagy or a block in trafficking to lysosomes [43]. Additionally, apart from the demonstration that post-C in vivo and Atg5 in vitro requires Atg5 and Atg7, we did not determine more specific mechanisms whereby autophagy was altered by post-C. Numerous transcriptional and post-translational pathways interact with and control autophagy and were not evaluated in this study [44]. A limitation of our methods is that siRNA to the Atg mRNAs did not completely eliminate ATG in vitro or in vivo; however, mitigating this limitation is the demonstration of robustly decreased LC3-II and autophagic flux, and increased SQSTM1.
Another limitation is the focus on macroautophagy. Mitophagy is an increasingly recognized phenomenon in retina, suggested to be involved in the pathogenesis of age-related macular degeneration, as well as in retinal development [45]. Furthermore, mitophagy regulator prkn−/- mice developed light-induced retinal degeneration [26], and Atg5 deficiency rendered cones susceptible to light-induced damage and accumulation of damaged mitochondria in the inner segments, showing the need for mitophagy in metabolic requirements of cones [24]. Mitophagy should be further investigated for its role in inner retinal disorders.
In summary, we showed that autophagy is disturbed by retinal ischemia, and restored by post-ischemic conditioning, as well as by autophagy activation with Tat-Beclin 1. Our study provides support for further examination of the mechanisms whereby autophagy may be harnessed for delayed rescue of retinal cells after ischemia.
Materials and Methods
Retinal ischemia and post-conditioning
Procedures conformed to the Association for Research in Vision and Ophthalmology Resolution on the Use of Animals in Research (arvo.org) and were approved by our Institutional Animal Care and Use Committee. Male Wistar rats (200–250 gm; Envigo, Indianapolis, IN USA) were maintained on a 12 h on/12 h off light cycle. For retinal ischemia, rats were anesthetized, and intraocular pressure (IOP) increased to 130–135 mm Hg for 55 min as described previously by placing a 30-gauge needle (BD Medical, BD305106) in the mid-anterior chamber without disturbing the lens [16]. Experiments were performed under normal lighting conditions in early afternoon. The eyes were treated with topical vigamox (0.5%; Alcon, to prevent infection), cyclomydril (Alcon, to dilate the pupils) and proparacaine (0.5%; Bausch & Lomb, to provide local anesthesia for needle placement). A servo–controlled heating blanket (Harvard Apparatus 50–7053, Natick, MA USA) maintained body temperature at 36–37°C. Oxygen saturation was measured with a pulse oximeter (Ohmeda Biox 3740; Louisville, CO USA) on the tail. Supplemental oxygen, when necessary to maintain O2 saturation > 93%, was administered using a cannula placed in front of the nares and mouth. At 24 h after ischemia ended, post-C was produced by placing a 2.0-silk suture (Ethicon, SA65 H) behind the globe, which had been passed through a small length of PE-200 Intramedic plastic tubing (Becton-Dickinson, BD427440) and pulled to maximal tightness to occlude the retinal circulation for 5 min, as we previously described [46]. Sham post-C was placement of the suture but not tightening it. This timing and experimental design were based upon our previous demonstration of anti-ischemic efficacy of “delayed post-C” [4]. A schematic of the procedures is in Figure 1.
Atg5 and Atg7 silencing and post-c
We targeted autophagy proteins ATG5 and ATG7, the latter an E1-like ligase that conjugates ATG5 to ATG12 that converts LC3/ATG8 to an autophagosomal membrane protein. Atg7 deletion eliminates autophagy [47]. Autophagosome elongation requires ATG5, which is an E3 ubiquitin ligase activated by ATG7 [48]. Small interfering RNA (siRNA) sequence for Atg5 was CTGGTAACTGACAAAGTGAAA, and for Atg7, GCCGATGGCTTCCTACTGTTA (Qiagen, S101871695, S101729119, respectively). The siRNAs were designed using neural-network technology as described previously [49]. siRNA design was then checked for homology to all other sequences of the genome, 3ʹ UTR/seed analysis, single nucleotide polymorphisms, and interferon motif avoidance [50–52]; (http://www1.qiagen.com/Products/GeneSilencing/HPOnGuardsiRNADesign.aspx).
Sequences of the introduced siRNA are uniquely specific to the targeted gene [53]. In two groups of randomly assigned animals, a 4 µl mixture of siRNAs to Atg5 and Atg7, or a negative control (non-silencing scrambled sequences not corresponding to any known rat gene) re-suspended and diluted using DharmaFECT1 transfection reagent (Dharmacon Inc., NC1308404) at a final concentration of 3 µM was injected into the mid-vitreous of both eyes of the rats with a micro-syringe (Hamilton 7633–01; 207,434, Reno, NV USA) 6 h prior to the post-conditioning ischemia stimulus, 18 h after the damaging ischemia. The volume of injection was the maximum possible into the vitreous without inducing injury according to our previous protocols [36]. Subsequently, rats were subjected to post-C. For the in vitro model, R28 cells were transfected for 72 h with siRNA in DharmaFECT1 prior to OGD and post-C. Additional to the Qiagen sequences, we used custom-designed Atg5 siRNA (with 2′-O-methyl- uridine modification [54]; GE Healthcare Dharmacon Inc., CTM-267,018) as a follow-up experiment to confirm the role of autophagy in our post-C model.
Electroretinography
Procedures have been described in detail previously [16]. In brief, for baseline and post–ischemic (i.e., after 7 d) follow–up electroretinogram (ERG), rats were injected with ketamine (35 mg/kg), and xylazine (5 mg/kg) i.p. every 20 min. Corneal analgesia was with 0.5% proparacaine. Pupils were dilated with 0.5% tropicamide (Alcon), and cyclomydril (Alcon). ERG was recorded with UTAS-E 3000 Visual Electrodiagnostic System (LKC Technologies, Gaithersburg, MD USA) prior to experiments and at 7 d after ischemia/post-C, in groups injected with Atg5 and Atg7 siRNA or scrambled. Retinal ganglion cell (RGC) function was assessed with the scotopic threshold response (STR), amacrine cell function via oscillatory potentials (OP), and rod bipolar function via the P2, as described previously [55].
Histology
Eyes enucleated on the eighth day after ischemia (7 d after post-C) were immediately placed in Davidson’s fixative (11% glacial acetic acid [Sigma-Aldrich, ARK2183]; 2% neutral buffered formalin [Sigma-Aldrich, HT501128]; 32% ethanol in H2O [Sigma-Aldrich, E7023]) for 24 h, then transferred to 70% ethanol for 24 h and stored in PBS (Gibco, 10010031) at 4°C. Eyes were embedded in paraffin, sectioned to 4 µm and stained with hematoxylin and eosin (H&E). Sections were examined by light microscope by blinded observers, and cell counts quantitated at 40 x. Specifically, the number of cells in the RGC layer was counted in a standardized region in all of the retinae, centered 1280 μm distant from the thinning of the neurofilaments arising from the optic nerve head. To maintain counts at the same eccentricities, the counts were made, in both directions from the optic nerve head, in a region spanning 128 μm. The average number of cells in the RGC layer is reported as previously described [3]. Cell numbers in the inner nuclear layer (INL) were determined using Micron (Westover Scientific, Bothell, WA USA). Several INL cell regions were selected (around 1280 μm from the optic nerve bundle) and the numbers of cells were manually counted and determined per area, as previously described [3].
Immunostaining
Following perfusion-fixation with 4% paraformaldehyde (PFA; Sigma-Aldrich Inc, 441,244), enucleated eyes were fixed at room temperature in 4% PFA for 2 h, the anterior segment removed, and the posterior eye post-fixed in the same fixative overnight at 4°C. Eyecups were placed in 20% sucrose (Sigma-Aldrich Inc, S0389) solution overnight at 4°C, then embedded in Tissue-Tek OCT (optimal cutting temperature) compound (VWR International, 25,608–930). Considering the known circadian rhythm changes in LC3-II [56], samples were collected under the same, consistent conditions, in mid-afternoon with normal room lighting. Primary antibodies are in Table 3. Anti-fade mounting media with DAPI (Thermo Fisher Scientific, P36971) was applied along with a coverslip.
Table 3.
Primary antibodies used in the study
| Antibody | Manufacturer | Type | Catalog Number | Dilution |
|---|---|---|---|---|
| ATG5 | Santa Cruz Biotechnology | Mouse Monoclonal | sc-133158 | 1:500 |
| ATG7 | Santa Cruz Biotechnology | Mouse Monoclonal | sc-376212 | 1:1000 |
| BECN1 | MBL International | Rabbit Polyclonal | JM-3663-100 | 1:1000 |
| ACTB | Sigma-Aldrich | Mouse Monoclonal | A3854-200UL | 1:25000 |
| ARRB2 | Proteintech | Rabbit Polyclonal | 10171-1-AP | 1:500 |
| TUBB3 | Sigma-Aldrich | Mouse Monoclonal | T8660-.2 ML | 1:250 |
| CALB1 | Proteintech Group | Rabbit Polyclonal | 14479-1-AP | 1:50 |
| CASP3 (cleaved) | Cell Signaling Technology | Rabbit Polyclonal | 9661 S | 1:1000 |
| ITGAM, ITGAX | BD Pharmingen | Mouse Monoclonal | 550299 | 1:500 |
| GFAP | Agilent Technologies | Rabbit Polyclonal | Z033429-2 | 1:1000 |
| LC3-I &II | MBL International | Rabbit Polyclonal | PD014 MS | 1:1000 |
| LC3B | Proteintech Group | Rabbit Polyclonal | 18725-1-AP | 1:500 |
| MTOR | Proteintech Group | Rabbit Polyclonal | 20657-1-AP | 1:500 |
| SQSTM1 | Sigma-Aldrich | Rabbit Polyclonal | p0067 | 1:1000 |
| PRKCA | BD Biosciences | Mouse Monoclonal | 610107 | 1:250/1:500 |
| p-EIF4EBP1/2/3 (Thr45) | Bioss Antibodies | Rabbit Polyclonal | BS-5672 R-A647 | 1:500 |
| RBPMS | GeneTex | Rabbit Polyclonal | GTX118619 | 1:1000 |
| p-RPS6KB1 (Ser421) | Bioss Antibodies | Rabbit Polyclonal | BS-6421RA555 | 1:500 |
| NFH | Covance | Mouse Monoclonal | SMI32-P | 1:250 |
| STX1A | Sigma-Aldrich | Mouse Monoclonal | S0664-.2 ML | 1:250/1:2000 |
| VIM | Santa Cruz Biotechnology | Mouse Monoclonal | sc-6260 | 1:50/1:1000 |
| TH | Iowa Developmental Studies Hybridoma Bank | Mouse Monoclonal | aTH-s | 1:500 |
Fluorescent TUNEL
Fluorescent terminal deoxynucleotidyl transferase-mediated dUTP nick end labeling assay (TUNEL) was performed with Dead-End Fluorometric TUNEL System (Promega, G3250) on retinal sections collected 48 h after ischemia, consistent with the time course and peak of apoptosis we previously described [57,58]. Cryosections were fixed in 4% PFA, permeabilized in 0.3% Triton X-100 (Sigma-Aldrich, T8787)-PBS, then placed in equilibration buffer and incubated in rTdT buffer for 1 h with humidification, with light exposure prevented. Sections were stained, then mounted using Prolong Diamond Antifade Mounting Agent containing DAPI.
Images were obtained on a Zeiss 710 Laser Scanning Confocal Microscope (Carl Zeiss Microscopy, Dublin, CA USA), and processed using Zeiss ZEN 2.3 SP1 and ImageJ-Fiji (https://imagej.nih.gov/ij/), similar to our previous descriptions [59]. For double-labeling, we used specific markers for retinal ganglion cells, amacrine cells, horizontal cells, bipolar cells, and macrophages or microglia (Table 3).
Western blotting
Retinas were rapidly dissected, frozen in liquid N2, crushed with a tissue pulverizer (Beckman) on dry ice and homogenized using 1X RIPA buffer (Sigma-Aldrich Inc, R0278) with protease and phosphatase inhibitor cocktail (Sigma-Aldrich Inc, PPC1010). Lysates were centrifuged at 4°C and protein concentrations measured using Pierce BCA Protein assay kit (Thermo Fisher Scientific, 23,225). Equal amounts of protein per lane (10 μg) were diluted with SDS sample buffer and loaded onto gels (4% – 20% or 16%; Bio-Rad 4,561,094; 4,561,095). Proteins were electroblotted to polyvinylidene difluoride membranes (Immobilon-P; Millipore, IPVH00010) with efficiency of transfer confirmed by Ponceau S Red (Thermo Fisher Scientific, 507,517,525). RIPA buffer Protease inhibitor cocktail (Sigma-Aldrich Inc, P8340) consisting of 4-(2-aminoethyl) benzenesulfonyl fluoride, pepstatin A, bestatin, leupeptin, and E-64 prevented protease activity. The samples were collected under the same, consistent conditions, in mid-afternoon and with normal room lighting. Similarly, for in vitro experiments, R28 cell pellets were lysed and the above steps followed. Membranes were incubated overnight at 4°C with primary antibodies (Table 3). Immunoreactive bands were developed via enhanced chemiluminescence and imaged using Odyssey CLX (LI-COR, Lincoln, NE USA). Band density was calculated using an ImageJ macro with normalization to ACTB (actin, beta) or ARRB2 (arrestin, beta 2).
Retinal neuronal cell line, R28
We used the R28 retinal cell line [60] (Kerafast, EUR201), an adherent retinal precursor cell line from postnatal day 6 Sprague-Dawley rat retina immortalized with the 12 S E1A gene introduced via an incompetent retroviral vector; no infectious virus is produced. Cells were cultured in a T75 flask in DMEM and 10% serum (420 ml DMEM incomplete [Gibco, 11,966,025]; 15 ml 7.5% sodium bicarbonate [Gibco, 25,080,094]; 50 ml bovine serum [Gemini Bio-Products Inc, 100–106]; 5 ml MEM non-essential amino acids [Gibco, 11,140,050]; 5 ml MEM vitamins [Corning, 25020Cl]; 5 ml L-glutamine [200 mM] [Gibco, 25,030,081]; and 0.625 ml gentamicin [80 mg/ml] [Corning, 30,005 CR]; glucose 1 g/L, pH 7.4). As soon as the cells were attached, media was removed and re-placed freshly. Cells were fed or trypsinized (Gibco, 25,300,062) every 2–3 d.
To examine the retinal cell types present under our culture conditions, we used immunocytochemistry on R28 cells growing on coverslips with a 70% confluency. Cells were washed with 1X PBS, fixed with 4% PFA, and immunostained with antibodies for retinal neuronal markers (Table 3), then imaged with a Zeiss LSM710 Confocal Microscope. Cells expressing these proteins are considered representative of the retinal cell population [60]. We further confirmed the expression of these cellular markers by real-time PCR following the protocol detailed in a later section below.
In vitro post C
As an in vitro model of retinal ischemia and reperfusion, we used OGD [16]. This was done to enable quantitation of cell death and impact of simulated post-C and autophagy, to quantitate autophagic flux, and the effect of stimulating or blocking autophagy. R28 cells were plated to reach 70% confluency in normal media. The glucose-deprived R28 medium was deoxygenated before the experiment by bubbling for 1 h with 1% O2 and 5% CO2. For OGD, cells were cultured in deoxygenated glucose-free media and exposed to hypoxia (1% O2 and 5% CO2) overnight followed by 6 h reoxygenation. “post-C” was 1 h OGD; “sham” group had same but no 1 h OGD, as shown schematically (Figure 1).
Evaluation of cell death and cell proliferation
Cells were assayed for cell death and cell proliferation (EdU, ethynyl deoxyuridine assay) [61,62]. Cytotoxicity (LDH release) was assayed with non-radioactive cytotoxicity assay kit (Promega, G1780) [63]. Briefly, culture supernatant samples were transferred to a 96-well plate and equal volume of Sytox added, incubated 30 min at room temperature, and absorbance measured at 490 nm. Percentage cytotoxicity was calculated from LDH release into the supernatant. We used Click-iT Plus EdU kit (Thermo Fisher Scientific, C10636) for measuring cell proliferation. Cells were labeled with EdU and the fluorescent signal generated by Click-iT EdU was detected by logarithmic amplification and analyzed by flow cytometry with a CyAn 2 Bench-top Analyzer (Beckman-Coulter, Brea, CA USA) [64].
Electron microscopic imaging of autophagosomes
Cells were centrifuged to form pellets, washed with PBS, fixed in 2.5% glutaraldehyde (pH 7.2) (Electron Microscopy Sciences, 16,220), post-fixed 1 h with 1% osmium tetroxide (Electron Microscopy Sciences, 19,160), and dehydrated via an ascending series of ethanol concentrations through 100%. They were embedded in LX112 epoxy resin (Ladd Research Industries, 21,210), and polymerized at 60°C for 3 d. Thin sections (~75 nm) were collected onto nickel grids and stained with uranyl acetate and lead citrate, respectively. Specimens were examined using a JEOL (Glen Ellyn, IL USA) JEM1220 Transmission Electron Microscope at 80 kV. Digital images were acquired using an Erlangshen ES1000 W model 785 CCD Camera and Digital Micrograph software (Gaton, Pleasanton, CA USA).
Autophagic flux using tandem RFP-GFP-LC3B sensor in vitro
We analyzed autophagy flux using Premo™ Autophagy Tandem RFP-GFP-LC3B BacMam Sensor Kit (Molecular Probes, P36239). R28 cells were plated onto poly-D-Lysine (Santa Cruz Biotechnology, sc-136,156)-coated coverslips to confluency 80%. Cells were transfected for 48 h with BacMam technology as previously described, where transduction rate in rat RGCs was 90% [65]. Transfected cells were subjected to OGD and post-C as described above. Rapamycin (500 nM; Sigma-Aldrich, 553,210) was a positive control for stimulation of autophagy, with cells pre-treated 4 h, prior to subjecting them to OGD ± post-C. Autophagy inhibitors were chloroquine (30 µM for 24 h; R&D Systems, 4109) and PIK-III (10 µM for 4 h; Selleck Chemical LLC, S7683) prior to OGD and post-C. PIK-III binds a unique hydrophobic pocket to selectively inhibit PIK3C3/VPS34 [66]. At the end of the experiment, cells were washed with 1X PBS, fixed with 4% PFA, and imaged with a Zeiss LSM710 Confocal Microscope using DAPI, FITC, and Texas Red filters. ImageJ with the Green-Red Puncta Co-localization Macro (https://imagejdocu.tudor.lu/plugin/analysis/colocalization_analysis_macro_for_red_and_green_puncta/start, Daniel J. Shiwarski, Ruben K Dagda, and Charleen T. Chu) was used to determine flux, as validated and described previously [67]. The Watershed plugin in ImageJ was used to segment and distinguish individual cells. Yellow GFP+/RFP+ puncta represent autophagosomes, and RFP+ indicate autolysosomes [21]. Flux rate was calculated as RFP+/RFP & GFP+ puncta per cell [68].
Real time PCR
To examine retinal cell types in R28 cells under our culture conditions, we used real-time PCR. Quantitation of selected transcripts was performed with SsoAdvancedTM Universal SYBR Green Supermix RT-PCR assays (Bio-Rad, 172–5271). cDNAs were generated from total RNA by cDNA Reverse Transcription Kit (Applied Biosystems, 4,368,814) and subjected to PCR amplification according to the manufacturer’s protocol. The relative quantitation method (ΔΔCt) was used [69], with the ratio of the mRNA levels normalized to internal control.
Data handling and statistical analysis
The ERG waves from ischemic eyes 7 d after ischemia and post-C in the groups for comparison were expressed as normalized intensity-response plots with stimulus intensity (log cd∙s/m2) on the x-axis, and corresponding percent recovery of baseline on the y-axis [3]. Recorded amplitude, time course, and intensity were exported and analyzed in Matlab 2011a (MathWorks, Natick MA USA) [3] and ERG waveforms for the OP and P2 were derived [59]. ERG waveform recovery was corrected for day-to-day variation and was referenced to the non-ischemic eyes. Direct comparisons of amplitudes at equal stimulus intensities between groups are also reported as previously described [16]. The STRs were of expected low amplitude, with correction for day-to-day variation and to the non-ischemic eyes neither practical nor accurate [55]. ERG data, histology, western blot, and protein expression were compared by ANOVA (analysis of variance) and t-testing. Analyses were performed using Stata v10.0 (College Station, TX USA).
Funding Statement
This work was supported by the BrightFocus Foundation [G2018168]; Center for Clinical and Translational Science, University of Illinois at Chicago [UL1 TR002003]; National Institutes of Health [EY010343]; [EY001792]; [EY 028690]; NIH EY 028690.
Disclosure statement
No potential conflict of interest was reported by the authors.
References
- [1].Duh EJ, Sun JK, Stitt AW.. Diabetic retinopathy: current understanding, mechanisms, and treatment strategies. JCI Insight. 2017;2(14):ii: 93751. [DOI] [PMC free article] [PubMed] [Google Scholar]
- [2].Pardue MT, Allen RS. Neuroprotective strategies for retinal disease. Prog Ret Eye Res. 2018;65:50–76. . [DOI] [PMC free article] [PubMed] [Google Scholar]
- [3].Dreixler JC, Poston JN, Shaikh AR, et al. Delayed post-ischemic conditioning significantly improves the outcome after retinal ischemia. Exp Eye Res. 2011;92(6):521–527. . [DOI] [PMC free article] [PubMed] [Google Scholar]
- [4].Dreixler JC, Sampat A, Shaikh AR, et al. Protein kinase B (Akt) and mitogen-activated protein kinase p38alpha in retinal ischemic post-conditioning. J Mol Neurosci. 2011;45:309–320. [DOI] [PMC free article] [PubMed] [Google Scholar]
- [5].Kadzielawa K, Mathew B, Stelman CR, et al. Gene expression in retinal post-ischemic conditioning. Graef Archiv Clin Exp Ophthalmol. 2018;256:935–949. [DOI] [PMC free article] [PubMed] [Google Scholar]
- [6].Jankauskas SS, Silachev DN, Andrianova NV, et al. Aged kidney: can we protect it? Autophagy, mitochondria and mechanisms of ischemic preconditioning. Cell Cycle. 2018;17:1–19. [DOI] [PMC free article] [PubMed] [Google Scholar]
- [7].Klionsky DJ, Abdelmohsen K, Abe A, et al. Guidelines for the use and interpretation of assays for monitoring autophagy (3rd edition). Autophagy. 2016;12:1–222. [DOI] [PMC free article] [PubMed] [Google Scholar]
- [8].Papadakis M, Hadley G, Xilouri M, et al. Tsc1 (hamartin) confers neuroprotection against ischemia by inducing autophagy. Nat Med. 2013;19:351–357. [DOI] [PMC free article] [PubMed] [Google Scholar]
- [9].Frost LS, Mitchell CH, Boesze-Battaglia K. Autophagy in the eye: implications for ocular cell health. Exp Eye Res. 2014;124:56–66. [DOI] [PMC free article] [PubMed] [Google Scholar]
- [10].Chinskey ND, Zheng QD, Zacks DN. Control of photoreceptor autophagy after retinal detachment: the switch from survival to death. Invest Ophthalmol Vis Sci. 2014;55(2):688–695. [DOI] [PMC free article] [PubMed] [Google Scholar]
- [11].Kim JY, Zhao H, Martinez J, et al. Noncanonical autophagy promotes the visual cycle. Cell. 2013;154:365–376. [DOI] [PMC free article] [PubMed] [Google Scholar]
- [12].Russo R, Berliocchi L, Adornetto A, et al. Calpain-mediated cleavage of Beclin-1 and autophagy deregulation following retinal ischemic injury in vivo. Cell Death Dis. 2011;2:e144. [DOI] [PMC free article] [PubMed] [Google Scholar]
- [13].Produit-Zengaffinen N, Pournaras CJ, Schorderet DF. Autophagy induction does not protect retina against apoptosis in ischemia/reperfusion model. Adv Exp Med Biol. 2014;801:677–683. [DOI] [PubMed] [Google Scholar]
- [14].Piras A, Gianetto D, Conte D, et al. Activation of autophagy in a rat model of retinal ischemia following high intraocular pressure. PloS One. 2011;6(7):e22514. [DOI] [PMC free article] [PubMed] [Google Scholar]
- [15].Dreixler J, Shaikh A, Alexander M, et al. Post-ischemic conditioning in the rat retina is dependent upon ischemia duration and is not additive with ischemic preconditioning. Exp Eye Res. 2010;91:844–852. [DOI] [PMC free article] [PubMed] [Google Scholar]
- [16].Mathew B, Ravindran S, Liu X, et al. Mesenchymal stem cell-derived extracellular vesicles and retinal ischemia-reperfusion. Biomaterials. 2019;197:146–160. [DOI] [PMC free article] [PubMed] [Google Scholar]
- [17].Gottlieb RA, Andres AM, Sin J, et al. Untangling autophagy measurements: all fluxed up. Circ Res. 2015;116(3):504–514. [DOI] [PMC free article] [PubMed] [Google Scholar]
- [18].Duan X, Qiao M, Bei F, et al. Subtype-specific regeneration of retinal ganglion cells following axotomy: effects of osteopontin and mTOR signaling. Neuron. 2015;85(6):1244–1256. [DOI] [PMC free article] [PubMed] [Google Scholar]
- [19].Ou K, Mertsch S, Theodoropoulou S, et al. Muller cells stabilize microvasculature through hypoxic preconditioning. Cell Physiol Biochem. 2019;52:668–680. [DOI] [PubMed] [Google Scholar]
- [20].Matsumoto G, Wada K, Okuno M, et al. Serine 403 phosphorylation of p62/SQSTM1 regulates selective autophagic clearance of ubiquitinated proteins. Mol Cell. 2011;44(2):279–289. [DOI] [PubMed] [Google Scholar]
- [21].Mizushima N, Yoshimori T, Levine B. Methods in mammalian autophagy research. Cell. 2010;140(3):313–326. [DOI] [PMC free article] [PubMed] [Google Scholar]
- [22].Shoji-Kawata S, Sumpter R, Leveno M, et al. Identification of a candidate therapeutic autophagy-inducing peptide. Nature. 2013;494(7436):201–206. . [DOI] [PMC free article] [PubMed] [Google Scholar]
- [23].Funderburk SF, Wang QJ, Yue Z. The Beclin 1-VPS34 complex–at the crossroads of autophagy and beyond. Trends Cell Biol. 2010;20:355–362. [DOI] [PMC free article] [PubMed] [Google Scholar]
- [24].Zhou Z, Vinberg F, Schottler F, et al. Autophagy supports color vision. Autophagy. 2015;11(10):1821–1832. [DOI] [PMC free article] [PubMed] [Google Scholar]
- [25].Yao J, Qiu Y, Frontera E, et al. Inhibiting autophagy reduces retinal degeneration caused by protein misfolding. Autophagy. 2018;14(7):1226–1238. . [DOI] [PMC free article] [PubMed] [Google Scholar]
- [26].Chen Y, Sawada O, Kohno H, et al. Autophagy protects the retina from light-induced degeneration. J Biol Chem. 2013;288:7506–7518. [DOI] [PMC free article] [PubMed] [Google Scholar]
- [27].Shang P, Valapala M, Grebe R, et al. The amino acid transporter SLC36A4 regulates the amino acid pool in retinal pigmented epithelial cells and mediates the mechanistic target of rapamycin, complex 1 signaling. Aging Cell. 2017;16(2):349–359. . [DOI] [PMC free article] [PubMed] [Google Scholar]
- [28].Sinha D, Valapala M, Shang P, et al. Lysosomes: regulators of autophagy in the retinal pigmented epithelium. Exp Eye Res. 2016;144:46–53. [DOI] [PMC free article] [PubMed] [Google Scholar]
- [29].Shelby SJ, Angadi PS, Zheng QD, et al. Hypoxia inducible factor 1alpha contributes to regulation of autophagy in retinal detachment. Exp Eye Res. 2015;137:84–93. [DOI] [PMC free article] [PubMed] [Google Scholar]
- [30].Rosenbaum DM, Rosenbaum PS, Singh M, et al. Functional and morphologic comparison of two methods to produce transient retinal ischemia in the rat. J Neuro-Ophthalmol. 2001;21(1):62–68. . [DOI] [PubMed] [Google Scholar]
- [31].Krishnamoorthy RR, Clark AF, Daudt D, et al. A forensic path to RGC-5 cell line identification: lessons learned. Invest Ophthalmol Vis Sci. 2013;54(8):5712–5719. [DOI] [PubMed] [Google Scholar]
- [32].Kitaoka Y, Sase K, Tsukahara C, et al. Axonal protection by ripasudil, a Rho kinase inhibitor, via modulating autophagy in TNF-induced optic nerve degeneration. Invest Ophthalmol Vis Sci. 2017;58(12):5056–5064. . [DOI] [PubMed] [Google Scholar]
- [33].Rodriguez-Muela N, Boya P. Axonal damage, autophagy and neuronal survival. Autophagy. 2012;8(2):286–288. [DOI] [PubMed] [Google Scholar]
- [34].Frudd K, Burgoyne T, Burgoyne JR. Oxidation of Atg3 and Atg7 mediates inhibition of autophagy. Nat Comm. 2018;9(1):95. [DOI] [PMC free article] [PubMed] [Google Scholar]
- [35].Tanida I, Minematsu-Ikeguchi N, Ueno T, et al. Lysosomal turnover, but not a cellular level, of endogenous LC3 is a marker for autophagy. Autophagy. 2005;1(2):84–91. [DOI] [PubMed] [Google Scholar]
- [36].Mathew B, Poston JN, Dreixler JC, et al. Bone-marrow mesenchymal stem-cell administration significantly improves outcome after retinal ischemia in rats. Graefes Arch Clin Exp Ophthalmol. 2017;255(8):1581–1592. . [DOI] [PMC free article] [PubMed] [Google Scholar]
- [37].Yoon WH, Sandoval H, Nagarkar-Jaiswal S, et al. Loss of nardilysin, a mitochondrial co-chaperone for alpha-ketoglutarate dehydrogenase, promotes mTORC1 activation and neurodegeneration. Neuron. 2017;93(1):115–131. . [DOI] [PMC free article] [PubMed] [Google Scholar]
- [38].Seigel GM, Chiu L, Paxhia A. Inhibition of neuroretinal cell death by insulin-like growth factor-1 and its analogs. Mol Vis. 2000;6:157–163. [PubMed] [Google Scholar]
- [39].Wangsa-Wirawan ND, Linsenmeier RA. Retinal oxygen: fundamental and clinical aspects. Arch Ophthalmol. 2003;121:547–557. [DOI] [PubMed] [Google Scholar]
- [40].Kim K, Yu SY, Kwak HW, et al. Retinal neurodegeneration associated With peripheral nerve conduction and autonomic nerve function in diabetic patients. Am J Ophthalmol. 2016;170:15–24. [DOI] [PubMed] [Google Scholar]
- [41].Sheng R, Zhang TT, Felice VD, et al. Preconditioning stimuli induce autophagy via sphingosine kinase 2 in mouse cortical neurons. J Biol Chem. 2014;289(30):20845–20857. . [DOI] [PMC free article] [PubMed] [Google Scholar]
- [42].Muratsubaki S, Kuno A, Tanno M, et al. Suppressed autophagic response underlies augmentation of renal ischemia/reperfusion injury by type 2 diabetes. Sci Rep. 2017;7(1):5311. . [DOI] [PMC free article] [PubMed] [Google Scholar]
- [43].Klionsky DJ. Coming soon to a journal near you - the updated guidelines for the use and interpretation of assays for monitoring autophagy. Autophagy. 2014;10:1691. [DOI] [PMC free article] [PubMed] [Google Scholar]
- [44].Feng Y, Yao Z, Klionsky DJ. How to control self-digestion: transcriptional, post-transcriptional, and post-translational regulation of autophagy. Trends Cell Biol. 2015;25(6):354–363. [DOI] [PMC free article] [PubMed] [Google Scholar]
- [45].Esteban-Martinez L, Boya P. BNIP3L/NIX-dependent mitophagy regulates cell differentiation via metabolic reprogramming. Autophagy. 2018;14(5):915–917. [DOI] [PMC free article] [PubMed] [Google Scholar]
- [46].Roth S, Li B, Rosenbaum PS, et al. Preconditioning provides complete protection against retinal ischemic injury in rats. Invest Ophthalmol Vis Sci. 1998;39:775–785. [PubMed] [Google Scholar]
- [47].Nakatogawa H. Two ubiquitin-like conjugation systems that mediate membrane formation during autophagy. Essays Biochem. 2013;55:39–50. [DOI] [PubMed] [Google Scholar]
- [48].Kim JH, Hong SB, Lee JK, et al. Insights into autophagosome maturation revealed by the structures of ATG5 with its interacting partners. Autophagy. 2015;11:75–87. [DOI] [PMC free article] [PubMed] [Google Scholar]
- [49].Huesken D, Lange J, Mickanin C, et al. Design of a genome-wide siRNA library using an artificial neural network. Nat Biotech. 2005;23:995–1001. [DOI] [PubMed] [Google Scholar]
- [50].Farh KK, Grimson A, Jan C, et al. The widespread impact of mammalian MicroRNAs on mRNA repression and evolution. Science. 2005;310:1817–1821. [DOI] [PubMed] [Google Scholar]
- [51].Hornung V, Guenthner-Biller M, Bourquin C, et al. Sequence-specific potent induction of IFN-alpha by short interfering RNA in plasmacytoid dendritic cells through TLR7. Nat Med. 2005;11:263–270. [DOI] [PubMed] [Google Scholar]
- [52].Judge AD, Sood V, Shaw JR, et al. Sequence-dependent stimulation of the mammalian innate immune response by synthetic siRNA. Nat Biotech. 2005;23(4):457–462. [DOI] [PubMed] [Google Scholar]
- [53].Dorsett Y, Tuschl T. siRNAs: applications in functional genomics and potential as therapeutics. Nat Rev. 2004;3:318–329. [DOI] [PubMed] [Google Scholar]
- [54].Judge AD, Bola G, Lee AC, et al. Design of noninflammatory synthetic siRNA mediating potent gene silencing in vivo. Mol Ther. 2006;13:494–505. [DOI] [PubMed] [Google Scholar]
- [55].Roth S, Dreixler J, Newman NJ. Haemodilution and head-down tilting induce functional injury in the rat optic nerve: A model for peri-operative ischemic optic neuropathy. Eur J Anaesthesiol. 2018;35:840–847. [DOI] [PMC free article] [PubMed] [Google Scholar]
- [56].Yao J, Jia L, Shelby SJ, et al. Circadian and noncircadian modulation of autophagy in photoreceptors and retinal pigment epithelium. Invest Ophthalmol Vis Sci. 2014;55(5):3237–3246. [DOI] [PMC free article] [PubMed] [Google Scholar]
- [57].Singh M, Savitz SI, Hoque R, et al. Cell-specific caspase expression by different neuronal phenotypes in transient retinal ischemia. J Neurochem. 2001;77(2):466–475. . [DOI] [PubMed] [Google Scholar]
- [58].Zhang C, Rosenbaum DM, Shaikh AR, et al. Ischemic preconditioning attenuates apoptosis following retinal ischemia in rats. Invest Ophthalmol Vis Sci. 2002;43(9):3059–3066. [PubMed] [Google Scholar]
- [59].Dreixler JC, Poston JN, Balyasnikova I, et al. Delayed administration of bone marrow mesenchymal stem cell conditioned medium significantly improves outcome after retinal ischemia in rats. Invest Ophthalmol Vis Sci. 2014;55(6):3785–3796. [DOI] [PMC free article] [PubMed] [Google Scholar]
- [60].Seigel GM. Review: R 28 retinal precursor cells: the first 20 years. Mol Vis. 2014;20:301–306. [PMC free article] [PubMed] [Google Scholar]
- [61].Cieslar-Pobuda A, Los MJ. Prospects and limitations of “Click-Chemistry”-based DNA labeling technique employing 5-ethynyl-2ʹdeoxyuridine (EdU). Cytometry. 2013;83:977–978. [DOI] [PubMed] [Google Scholar]
- [62].Cummings BS, Wills LP, Schnellmann RG. Measurement of cell death in mammalian cells. Curr Prot Pharmacol. 2012;56:12.8.1-.8.24. [DOI] [PubMed] [Google Scholar]
- [63].Leung DW, Lindlief LA, Laabich A, et al. Minocycline protects photoreceptors from light and oxidative stress in primary bovine retinal cell culture. Invest Ophthalmol Vis Sci. 2007;48(1):412–421. [DOI] [PubMed] [Google Scholar]
- [64].Clarke ST, Calderon V, Bradford JA. Click chemistry for analysis of cell proliferation in flow cytometry. Curr Prot Cytom. 2017;82:7.49.1–7.30. [DOI] [PubMed] [Google Scholar]
- [65].Levin E, Diekmann H, Fischer D. Highly efficient transduction of primary adult CNS and PNS neurons. Sci Rep. 2016;6(1):38928. [DOI] [PMC free article] [PubMed] [Google Scholar]
- [66].Dowdle WE, Nyfeler B, Nagel J, et al. Selective VPS34 inhibitor blocks autophagy and uncovers a role for NCOA4 in ferritin degradation and iron homeostasis in vivo. Nat Cell Biol. 2014;16(11):1069–1079. . [DOI] [PubMed] [Google Scholar]
- [67].Pampliega O, Orhon I, Patel B, et al. Functional interaction between autophagy and ciliogenesis. Nature. 2013;502(7470):194–200. . [DOI] [PMC free article] [PubMed] [Google Scholar]
- [68].Castillo K, Valenzuela V, Onate M, et al. A Molecular reporter for monitoring autophagic flux in nervous system in vivo. Methods Enzymol. 2017;588:109–131. [DOI] [PubMed] [Google Scholar]
- [69].Wong ML, Medrano JF. Real-time PCR for mRNA quantitation. BioTechniques. 2005;39(1):75–85. [DOI] [PubMed] [Google Scholar]


