Abstract
Onion-like carbon nanoparticles were synthesized from diamond nanoparticles to be used as the precursor for graphene oxide quantum dots. Onion-like carbon nanoparticles were exfoliated to produce two types of nanoparticles, graphene oxide quantum dots that showed size-dependent fluorescence and highly stable inner cores. Multicolor fluorescent quantum dots were obtained and characterized using different techniques. Polyacrylamide gel electrophoresis showed a range of emission wavelengths spanning from red to blue with the highest intensity shown by green fluorescence. Using high-resolution transmission electron microscopy, we calculated a unit cell size of 2.47 Å in a highly oxidized and defected structure of graphene oxide. A diameter of ca. 4 nm and radius of gyration of ca. 11 Å were calculated using small-angle X-ray scattering. Finally, the change in fluorescence of the quantum dots was studied when single-stranded DNA that is recognized by telomerase was attached to the quantum dots. Their interaction with the telomerase present in cancer cells was observed and a change was seen after six days, providing an important application of these modified graphene oxide quantum dots for cancer sensing.
Keywords: Graphene oxide quantum dots, Small angle X-ray Scattering, Fluorescence, Onion-like carbon nanoparticles, Cancer sensing
Graphical Abstract
Introduction
Carbon based quantum dots (graphene oxide quantum dots (GOQD), graphene quantum dots, and carbon dots) have been synthesized in many different ways that can be grouped into two approaches: top-down1–4 and bottom-up5–7. Top-down approaches mostly use graphite as starting material, although many others have been employed such as carbon nanotubes,8 XC-72 carbon black,9 graphite nanofibers,10 graphite rods,11 activated charcoal,12 and even single buckminsterfullerenes.13 In the last few years, emphasis has been given in the synthesis of carbon dots3, 14 obtained from coal due to the abundance of this carbon source as studied by J. M. Tour et al.15 Bottom-up approaches use aromatic molecules as starting materials, which are nucleated and grown up to the required size3, 14, 16–17.
GOQD synthesized from other carbon materials have been vastly studied for many years, due in part to the attention obtained by graphene, a two-dimensional carbon-based material that is only one-atom thick and exhibits outstanding properties scarcely found in other materials. Graphene oxide, however, is obtained through the exfoliation of graphite-like carbon materials, and it consists of a one-atom thick material with the addition of carbon-oxygen moieties that may stand out of the edges and both sides of the basal plane.18 The oxidation of these carbon-based materials separates the carbon layers, with the addition of oxygen atoms, enough to break van der Waals interactions between them for further exfoliation into separated nanosheets. Due to the strong oxidation procedure, graphene oxide nanosheets are broken down into very small pieces of less than 10 – 15 nm called graphene oxide quantum dots, which behave as confined spaces for the electrons, exhibiting a new array of properties not shown by graphene oxide. GOQD have very high solubility in aqueous solutions while still maintaining areas of sp2 structure that allow for the interaction with hydrophobic molecules19. GOQD exhibit fluorescence and the emitted wavelength depends on their size and degree of oxidation. Carbon-based quantum dots are known to have low quantum yields compared to metal-based quantum dots, with reported values for GOQD quantum yield as low as 0.4%20, with typical values between 7 and 22.9%4, 16, 21–25. Carrier lifetimes have been measured for GOQD with typical values between 0.45 and 6.98 ns26–28. Their fluorescence has been used for different sensing applications such as cells24 and tumor29 imaging, bacterial detection30, and iron detection31, among others. GOQD have been synthesized from different carbon materials32 with outstanding properties required for biomedical applications such as biocompatibility. However, GOQD with only blue and UV fluorescence were synthesized until now using carbon nano-onions (CNO) also called onion-like carbon nanoparticles.32 In this work, using a stronger oxidation (concentrated sulfuric acid with potassium permanganate) with the use of a second acid (phosphoric acid),18 we were able to obtain multicolored fluorescent quantum dots, which may be related to the extent of the oxidation of the quantum dots. The generation of a broader spectrum of visible light from GOQD is important for biological applications as well as their biocompatibility.
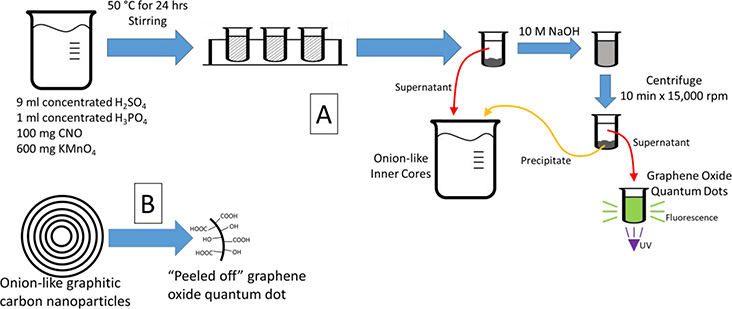
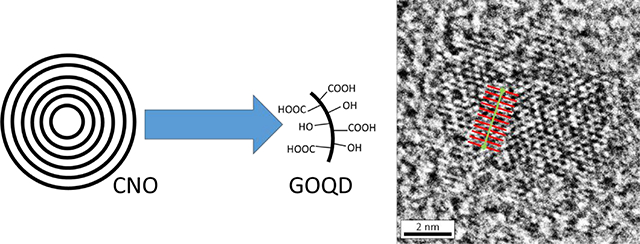
There has been a vast amount of work done in the different type of carbon-based quantum dots with specific applications of GOQD ranging from metal sensing,32 cell imaging,9 nanofiltration,33 to transistors,34 among others. In our work, we will be using GOQD for cancer sensing, specifically telomerase-active cancer, which is 85% of cancer. Using onion-like carbon nanoparticles, we have been able to synthesize GOQD using an iterative process which progressively “peels off” the layers of the onion-like structures as shown in Figure 1A. We expected to obtain GOQD from the graphitic structure of CNO (Figure 1B). GOQD obtained exhibit fluorescence that depends on the light used for excitation.35–36 Due to the dependence of the fluorescence of GOQD on the environment, experiments were conducted to study their use as sensing elements for cancer. Particularly, telomerase was chosen as the biomarker for cancer due to its presence in 85% of cancer and its absence (or negligible concentration) in normal somatic cells.37–38 After six days, we were able to show the use of modified GOQD using single-stranded DNA that recognizes telomerase as a sensing platform for cancer cells by their change in fluorescence.
Figure 1 –
(A) Scheme of synthesis procedure for graphene oxide quantum dots and (B) summary of the expected results from the chemical synthesis.
Results and Discussion
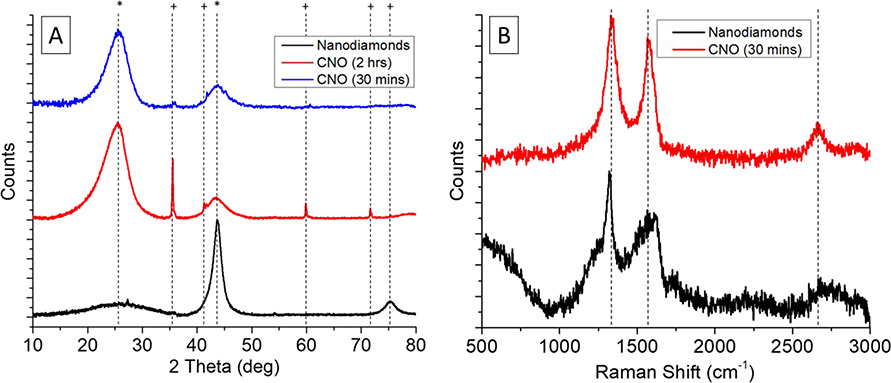
Many iterations were done for the preparation of CNO from diamonds using the high temperature furnace in which we varied the time at which the diamond nanoparticles were maintained at 1,650 °C. We found that at 2 hours the formation of silicon carbide was produced, as seen in Figure 2A with the sharp peaks at ca. 35.5, 41.3, 41.7, 59.9 and 71.7 deg (+) due to the presence of up to 1,000 ppm of silicon dioxide in the diamond nanoparticles that reacted at high temperature to form carbides. The sharpness and height of the peak was due to the structure and size of the silicon carbide nanoparticles formed even though the quantity is very small. After changing the time to 30 mins, these peaks disappear with only traces that are removed during the synthesis of graphene oxide quantum dots. The broad peaks that are seen at ca. 25.1 and 43.7 deg (*) correspond to CNO. The width of the peaks was due to the small size of the nanoparticles according to the Debye-Scherrer equation that states that the smaller the nanoparticle, the broader the peak, due to smaller crystallites. Using the Debye-Scherrer equation for both peaks that correspond to CNO gives us a crystallite size of 1.7 and 2.1 nm, respectively, while using the same equation for the peaks corresponding to silicon carbide gives ca. 40 nm of crystallite size.
Figure 2 –
(A) X-Ray Diffraction of diamond nanoparticles, onion-like carbon nanoparticles processed for 2 hours (CNO 2 hrs) and for 30 minutes (CNO 30 min) to avoid the formation of silicon carbide. (B) Raman Spectroscopy of diamond nanoparticles and onion-like carbon nanoparticles (CNO 30 min).
Raman spectroscopy shown in Figure 2B was used to characterize and compare the CNO synthesized with the diamond nanoparticles. The spectra of diamond nanoparticles and CNO showed a broader peak at ca. 1,320 cm−1, which is related to the defects in the surface of the nanoparticles, called the D peak, as well as a more defined peak at ca. 1,600 cm−1, which is related to the graphitic sp2 structure, that is called the G peak. The presence of the latter peak at the diamond nanoparticles was due to the carbonaceous impurities produced during the synthesis of the diamond, which was lost during the high temperature synthesis of CNO. In the case of the CNO obtained by the procedure of 30 minutes, the D and G peaks were located at 1,340 cm−1 and 1,575 cm−1, respectively.39 These peaks had a small shift from nanodiamonds to CNO toward higher Raman shifts. D peak represented the A1g vibrational mode which is associated with the sp3 carbon atoms that are present in defective graphitic areas. The G peak is characteristic of the E2g vibrational mode corresponding to the sp2 carbon atoms.39–41 The 2D broad peak is an overtone of the D peak shown between 2,550 – 3,000 cm−1 corresponding to double resonance transitions from the production of two phonons with opposite momentum.42 At the end, we were able to synthesize reproducible onion-like carbon nanoparticles which were used for the synthesis of GOQD.
Graphene Oxide Quantum Dots Synthesis
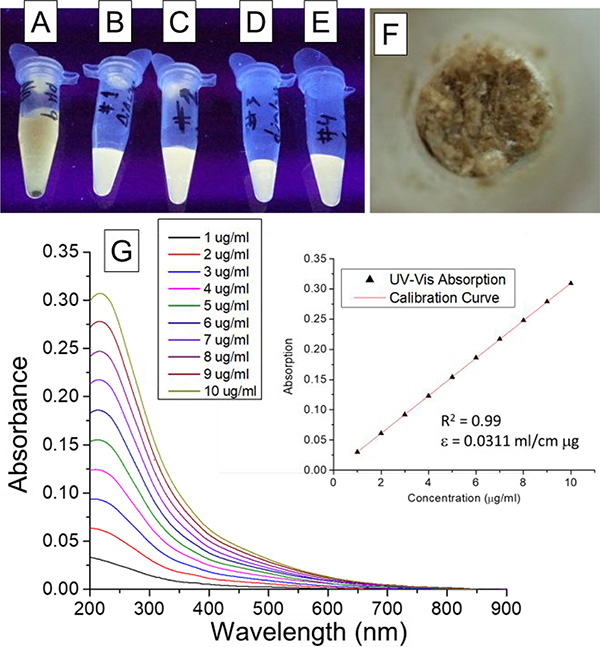
One of the most important details to have in mind when preparing GOQD from onion-like carbon nanoparticles is that the byproducts of the synthesis have almost the same size of the GOQD. This requires additional care to ensure that no other materials that may be deleterious to biological samples stay with the final sample. Therefore, the samples were centrifuged at 15,000 rpm and the supernatant was separated until no precipitate was found. Then, the solution was neutralized using NaOH. The fluorescence was seen using a transilluminator with a 365 nm light, and it was observed that it changed at different pH. This was expected since graphene oxide is reported to have different functional groups that are protonated at different pH.43 This makes the GOQD aggregate at lower pH diminishing fluorescence intensity, and makes them separate at higher pH with an increase in fluorescence. The solution also contained high concentration of salts that shields the negativity of the GOQD and promotes the aggregation, which contributed to the low fluorescence intensity as can be seen in Figure 3A. In order to purify the samples from the salts, dialysis tube membranes were used. It is easily observable from the fluorescence of the samples in Figure 3, the effect of the dialysis. An aliquot of the sample, after each day of dialysis, was observed using a transilluminator with a 365 nm light. The change in the fluorescence is obvious after the first day of dialysis (Figure 3B) and it becomes less notable in the following days (Figure 3C–E) since the intensity seems to stay the same. Different dialysis membranes were tested starting from 100 kDa and decreasing the pore sizes, however, the 5 kDa membrane was the one with the biggest pore that did not decrease the fluorescence of the sample noticeably after four days.
Figure 3 –
Graphene oxide quantum dots aliquots obtained (A) before and (B-E) after each day of dialysis excited with UV light (365 nm) in a transilluminator, as well as after (F) lyophilization. (G) UV-Vis absorbance measured at different graphene oxide quantum dots concentration in water and (insert) calibration curve.
After dialysis, two methods were tried to dry the sample to obtain GOQD in powder form, using vacuum alone and using lyophilization. Using vacuum alone, most of the solution was evaporated until the concentration was high enough for the intermolecular forces between GOQD and water to stop the drying process, at which point the water evaporation stopped. A highly concentrated solution of GOQD was obtained without further drying. Using lyophilization, however, the samples were easily dried after freezing them with liquid nitrogen. Powdered GOQD after lyophilization is shown in Figure 3F.
Once GOQD samples were obtained in powder, they were weighted and dissolved in nanopure water at a concentration of 1 mg/ml. Using UV-Vis absorption spectroscopy, shown in Figure 3G, a calibration curve was obtained (R2=0.99) with concentrations ranging from 1 to 10 μg/ml (Figure 3G, insert) and using the absorption peak at 226 nm. The extinction coefficient was found to be ε=0.0311 ml/cm μg using Beer-Lambert’s Law. UV-Vis absorption spectroscopy showed two peaks, one very intense at 226 nm that corresponds to the π→π* transition of C=C bonds with hybridization sp2, and a shoulder at 270 nm due to the n→π* transition of C=O bonds.35–36
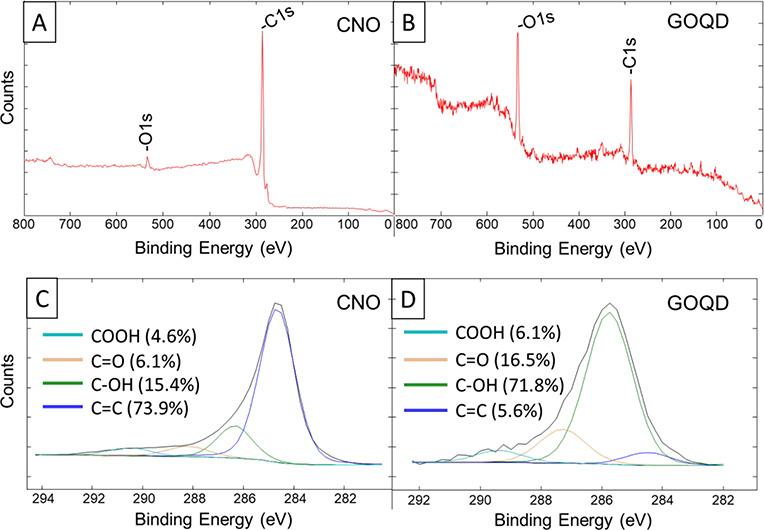
X-ray photoelectron spectroscopy (XPS) was used to compare CNO with GOQD as shown in Figure 4. Figure 4A and Figure 4B show the entire spectra of CNO and GOQD, respectively, with only the carbon 1s and oxygen 1s peaks. It is clearly seen that the oxygen peak is much higher in the GOQD spectrum compared to CNO, which is due to the highly oxidative synthesis used to prepare GOQD. This was also seen in the carbon 1s peak as shown in Figure 4C and Figure 4D. The carbon 1s peaks show the difference in hybridization of the carbon atoms after the highly oxidative process to produce GOQD. The XPS spectrum of CNO (Figure 4C) showed a high atomic proportion (73.9%) of carbon sp2 with a peak at a binding energy of 284.51 eV, which was contrasted to the proportion found in GOQD (5.6%), which was much lower due to the high oxidized procedure used for the synthesis. On the other hand, the proportion of the carbon-oxygen moieties found in GOQD (Figure 4D) is much higher (94.4%) compared to the proportion in CNO (26.1%). Taking into account the error in this technique when used for atomic proportion measurement, the change in carbon moieties proportion is high enough to understand the important change produced by the synthesis in the final structure of GOQD. Comparing the GOQD obtained in this work with previously published GOQD from CNO,32 we hypothesize that the higher extent of oxidation produced by our synthesis and confirmed with XPS (Figure 4D) influenced the generation of the wide spectrum of emitted multicolored visible light.
Figure 4 –
X-ray photoelectron spectra of (B) onion-like carbon nanoparticles (CNO) and (C) graphene oxide quantum dots (GOQD).
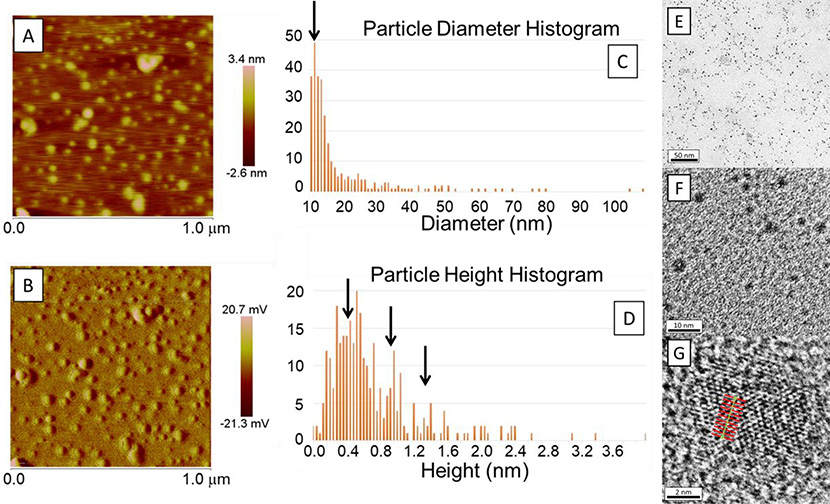
Atomic Force Microscopy (AFM) was used to investigate the size of the GOQD as shown in Figure 5A–D. Figure 5A and Figure 5B show the height and amplitude, respectively, of the GOQD when placed on mica. The size of the images was 1 μm by 1 μm with a color scale for the height between −2.6 and 3.4 nm, and for the amplitude between −21.3 to 20.7 mV. Figure 5C shows the histogram of particle diameter with a peak at 12 nm shown by a black arrow. Additionally, Figure 5D shows the histogram of particle height with the main peak at ca. 0.4 nm, which is consistent with single layer GOQD, with additional smaller peaks at ca. 0.9 nm and ca. 1.3 nm, indicated by black arrows, consistent with dual and triple layered quantum dots.
Figure 5 –
Atomic Force Microscopy images of (A) height and (B) amplitude. (C) Particle diameter and (D) particle height histograms showing peaks centered on 12 and 0.4 nm, respectively. Graphene oxide quantum dots seen using High Resolution Transmission Electron Microscopy at (E) low magnification, (F) medium magnification, and (G) high magnification with unit cell measurements. Black arrows represent the peaks seen in each histogram.
GOQD were found to have less than 10 nm as seen by the high resolution transmission electron microscopy (HRTEM) images in Figure 5E–G, at different magnifications. Figure 5E shows GOQD as back dots evenly spaced in the holey carbon grid, Figure 5F shows the GOQD at higher magnification with a size smaller than 10 nm as was expected given that CNOs are known to be less than 10 nm diameter. Figure 5G is showing a GOQD at high magnification and high resolution where the structure of graphene oxide is clearly seen. The unit cell was calculated using an average of 10 unit cells measured as shown in red and green lines in Figure 5G, with an average of 2.47 Å which is in agreement with the literature.44 Differently to other reports in the literature,45 these GOQD are highly oxidized and defected as seen in their structure observed in the HRTEM. The size of these nanoparticles allows the electrons to behave as in a quantum space, which makes the quantum dots exhibit fluorescence.
Fluorescence of GOQD
Normally, fluorescence is seen when a high energy photon is used to excite the material such as UV light, and the fluorescence is emitted in with a lower energy such as visible light. In GOQD we have measured the fluorescence in a range of wavelengths, and we have found something that seems like upconversion fluorescence and has been reported in the literature as such.46–49 Moreover, they are reported with the intensity as high as the fluorescence even though it is known that the probability of two-photon fluorescence is much lower.47–48 We have to be careful to make sure that it is understood that what seems like upconversion fluorescence when using a xenon lamp is due to the second order of the excitation monochromator and has been explained in different published papers.50–52 However, there are still papers being published after these clarifications using xenon lamp based fluorescent instrumentation to measure and claiming upconversion fluorescence.47–48 According to the published literature that take the precautions to make sure that upconversion fluorescence is real, only using high power pulsed lasers very low intensity upconversion fluorescence can be observed in GOQD.51
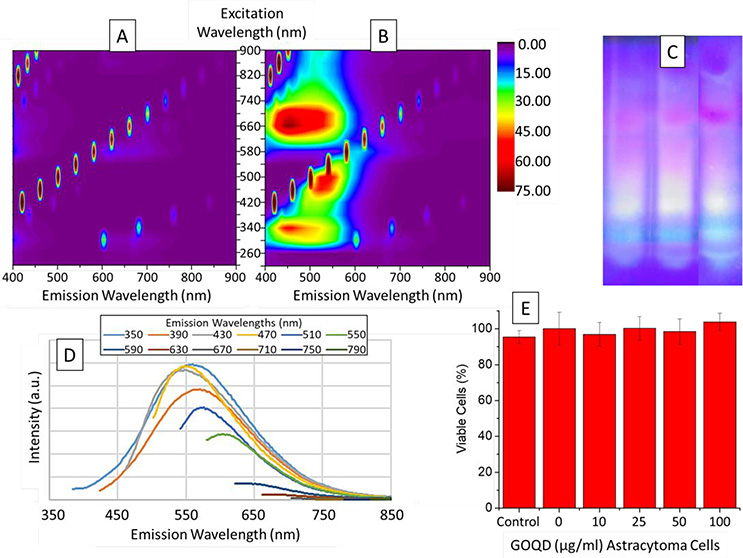
Figure 6A and Figure 6B show the fluorescence of water and GOQD solution, respectively. Figure 6A shows the fluorescence with only water to use as a baseline and the peaks seen are due to the water, artifacts, the excitation light, and the overtones. Figure 6B shows the fluorescence exhibited by GOQD where the Y axis shows the wavelength used to excite the quantum dots, and the X axis shows the wavelength emitted by the quantum dots. It is important to clarify the lack of upconversion fluorescence seen with common desktop spectrophotometers because it may be tempting to think that the fluorescence seen in the upper-left quadrant of Figure 6B could be due to this two-photon process. GOQD synthesized by this method exhibited fluorescence between 400 nm and 600 nm when excited with wavelengths between 260 nm and 540 nm. Moreover, the same fluorescence is again seen due to the second order signal in the upper-left quadrant.
Figure 6 –
Fluorescence emission maps of (A) water as baseline and (B) graphene oxide quantum dots in water. (C) Multicolor fluorescence emitted by graphene oxide quantum dots in polyacrylamide gel with an excitation wavelength of 365 nm. (D) Excitation-dependent fluorescence emission of graphene oxide quantum dots and (E) cell viability experiment using MTT colorimetric assay for quantum dots exposure during one day to Astrocytoma cells
Once the synthesis was successful, we hypothesized that different sizes of GOQD were present with different fluorescence emission wavelengths due to the form of the fluorescence peaks seen in Figure 6B. In order to understand the composition of the sizes of our quantum dots to provide these shifting peaks we performed polyacrylamide gel electrophoresis (PAGE) to separate them by charge and size. These quantum dots are negatively charged at neutral pH, which made them perfect for this separation technique. Agarose gel could not be used due to the small size of the quantum dots in order to have a good separation. Figure 6C shows the 20% PAGE of three samples of GOQD after applying 100 V for 2 hours on a transilluminator with 365 nm UV lamps. The quantum dots separated in a continuum of different sizes with the different wavelengths emitted by the different sizes. As it was expected and in agreement with literature,3 the smaller quantum dots are lower in the gel and emitted blue fluorescence, and the bigger the quantum dot, the higher in the gel, and the higher the wavelength emitted; therefore, showing a dependence of the wavelength emitted to the size of the GOQD. Figure 6D confirms the appearance of different sizes of GOQD by having different emission peaks when using different excitation wavelengths with a decrease in intensity due to the lower amount of GOQD excited according to the concentrations of each of the different sizes. This effect has been seen in the synthesis of graphene-based quantum dots.53
Once the GOQD were characterized, the cytotoxicity in Astrocytoma Cells was investigated using the MTT proliferation assay, which is a colorimetric assay used to study the cell metabolic activity, and correlated to the viability as seen in Figure 6E. In this experiment, Astrocytoma cells were exposed to GOQD for one day except for the control in which nothing was added, and the 0 μg/ml that only water was added. The experiments were done in triplicate and the standard deviation is seen in the error bars. As can be clearly seen in these results, there is no effect on the cytotoxicity up to 100 μg/ml.
SAXS Characterization
GOQD were studied by small angle X-ray scattering (SAXS) in MacCHESS,54–56 F1 line, at different concentrations in water from 100 to 40 μg/ml. Graphene oxide nanosheets in nanopure water have more than half of their functional groups protonated43, which promotes agglomerations at high concentration. Moreover, SAXS intensity for GOQD is low due to their small size, creating a compromise where the concentration must be high enough to have reliable data while avoiding agglomeration. Figure 7 shows a Log(I)-q SAXS plot of water and GOQD at different concentrations57. The Guinier plot, after background subtraction, is shown as an insert, and it was used for assessing agglomeration58. At low q2, the data points are increased in 100 μg/ml, showing aggregation of quantum dots, which is decreased at lower concentrations. Using the slope, the radius of gyration (Rg) was calculated at each concentrations and shown in Table 1. At 100 and 80 μg/ml, Rg appears to be higher due to aggregation of quantum dots, compared to 60 μg/ml and 40 μg/ml, which shows a smaller Rg. These GOQD are expected to be curved due to some five-carbon rings which come from the fullerene-like structure of the exfoliated shells of CNO. However, the small curvature and size makes them almost disk-shaped, shown by the long linear region seen also at low q2 in the Guinier plot.
Figure 7 –
(A) Small angle X-ray scattering data for different concentrations of graphene oxide quantum dots and nanopure water. (A, Insert) Guinier Plot for calculation of radius of gyration (Rg) and I(0), which showed agglomeration at a high concentration. (B) Pair Distance Distribution Function (P(r)) showing a change in the peak position and width, with little or no change in Dmax. This behavior can be attributed to the agglomeration of nanosheets at high concentrations.
Table 1 –
Results for Graphene-Oxide Quantum Dots obtained by SAXS.
| Concentration (μg/ml) | Dmax (Å) | Rg (SD) (Å) | I(0) (SD) (Å) | Rg (SD) (Å) | I(0) (SD) (Å) |
|---|---|---|---|---|---|
| Guinier Method | P(r) Method | ||||
| 40* | 39.56 | 9.82(0.73) | 0.78 (0.04) | 10.99 (0.68) | 0.79 (0.37) |
| 60 | 41.62 | 8.93 (0.50) | 1.05(0.03) | 10.58(0.77) | 1.10 (0.42) |
| 80 | 42.26 | 10.31(0.52) | 1.65 (0.04) | 11.19(0.47) | 1.69 (0.42) |
| 100 | 43.12 | 11.34(0.43) | 1.87(0.05) | 11.76(0.37) | 1.88 (0.42) |
SAXS data was not intense enough to obtain a reliable P(r).
The Pair Distance Distribution Function (P(r)) in Figure 7 shows clearly the difference between the agglomeration at different concentrations. It is noteworthy that at 40 μg/ml the quality of data decreases vastly making it difficult to obtain a reliable P(r) curve. Assuming that GOQD agglomerate piling one on top of the other, Dmax, the diameter of the quantum dots, almost does not change with concentration. However, the position of the peak in P(r) and the width changed due to the increased thickness generated by the agglomeration. Dmax was obtained as ca. 4 nm, which correlates with literature for average size of GOQD with blue-green fluorescence.10 Using P(r), we calculated Rg in the real space by integrating r2 over all the Pair Distance Distribution Function and obtained a value of ca. 11 Å, which confirms the approximation done by the Guinier plot. The Rg and I(0) calculated at each concentration the different methods are shown in Table 1.
Fluorescence Change with Telomerase
After the synthesis, characterization, and biocompatibility testing of GOQD, we hypothesized that their fluorescence may be modified with different molecules interacting in their surface. This would provide an optical indication that may be used for sensing. Therefore, we designed an experiment to make a proof-of-concept that would show the change in fluorescence produced by the interaction of GOQD with single stranded DNA of different sizes attached to their surface that was elongated by telomerase. Telomerase is an enzyme that is present in 85% of cancer which has been the object of study of different sensors in the last few years to detect cancer.37, 59
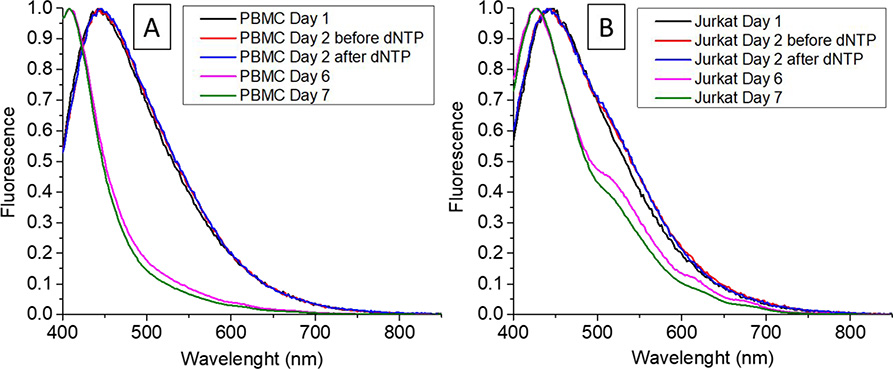
In order to show the change in fluorescent of GOQD in their interaction with telomerase as a biomarker for cancer, single stranded DNA (ssDNA) probes were tethered to the surface of the quantum dots that include the sequence 5’-TTAGGG-3’ at the end, which is known to be recognized by the enzyme telomerase to elongate the strand repeating the same sequence.37 Using nuclear extracts from T-cells, cancer-positive (Jurkat cells) and negative (PBMC) samples were tested, finding that the presence of this enzyme changed the fluorescence of the quantum dots as can be seen in Figure 8.
Figure 8 –
Fluorescence of GOQD in nuclear extracts of (a) PBMCs and (b) Jurkat cells at different times.
Based on these results, it was hypothesized that the change in the emission wavelength of the fluorescence emitted by GOQD-DNA when illuminated with UV light is due to the elongation of the telomere-like probe on the surface of the quantum dots. It has been reported that ssDNA has affinity toward the non-polar areas of the graphene oxide interacting non-covalently by intermolecular forces.60–61 Double stranded DNA, however, cannot bind to GOQD due to the helix formation.
Conclusions
GOQD have been synthesized from CNO by oxidation and exfoliation of their atomic layers. Raman and XRD characterization showed the confirmation of their synthesis while avoiding the formation of silicon carbide. After purification, the synthesis produced a wide range of sizes of GOQD that had different emission wavelengths. The shift in the emission peak was seen with the excitation wavelength and PAGE was used to show the difference in fluorescence at different sizes. The radius of gyration of GOQD was calculated using SAXS and both the Pair Distribution Function and the Guinier Plot produced a similar value of ca. 11.5 Å. Moreover, Dmax was found to be ca. 4 nm, which increased with concentration due to agglomeration of GOQD. Given the biocompatibility of GOQD, they were used as fluorescent probes by modifying them with single stranded DNA designed to be elongated by telomerase. The change in fluorescence with time was measured when telomerase is present in cancerous vs non-cancerous T-cells nuclear extracts. Several clear emission peaks were found after six and seven days in presence of telomerase that were not seen in non-cancerous cells. In this way, we were able to show the novel application of using modified GOQD for telomerase-positive cancer sensing by exploiting their change in fluorescence when interacting with telomerase.
Supplementary Material
Acknowledgment
This project was supported by an Institutional Development Award (IDeA) from the National Institute of General Medical Sciences of the National Institutes of Health under grant number P20 GM103475-14, the National Science Foundation under award numbers 1827622 and 1849243, and the Puerto Rico Science, Technology, and Research Trust award number 2016-00068. This content is only the responsibility of the authors and does not necessarily represent the official views of the National Institutes of Health, the National Science Foundation, or the Puerto Rico Science, Technology, and Research Trust. The authors acknowledge the Puerto Energy Center at Universidad Ana G. Mendez – Gurabo Campus and Ian Gutierrez for the use of the X-ray diffraction facilities and the Molecular Science Research Center (MSRC) at the University of Puerto Rico for the use of the Raman spectroscopy facilities. The authors acknowledge Dr. Valance Washington from the Department of Biology at the University of Puerto Rico, Rio Piedras Campus for the blood sample. The authors also acknowledge Dr. Angel Marti from Rice University for scientific chats related to the possibility of upconversion fluorescence in GOQD.
Authors acknowledge Dr. Gillilan at MacCHESS for his help in carrying out the analysis of the samples. This work is based upon research conducted at the Cornell High Energy Synchrotron Source (CHESS), which is supported by the National Science Foundation and the National Institutes of Health/National Institute of General Medical Sciences under NSF award DMR1829070, using the Macromolecular Diffraction at CHESS (MacCHESS) facility, which is supported by award GM-124166 from the National Institutes of Health, through its National Institute of General Medical Sciences.
Footnotes
Supporting Information
Experimental Section. CNO and GOQD syntheses and purification.
References
- 1.Qin Y; Cheng Y; Jiang L; Jin X; Li M; Luo X; Liao G; Wei T; Li Q, Top-down Strategy toward Versatile Graphene Quantum Dots for Organic/Inorganic Hybrid Solar Cells. ACS Sustain Chem Eng 2015, 3 (4), 637–644. [Google Scholar]
- 2.Hu H; Quan H; Zhong B; Li Z; Huang Y; Wang X; Zhang M; Chen D, A Reduced Graphene Oxide Quantum Dot-Based Adsorbent for Efficiently Binding with Organic Pollutants. ACS Appl Nano Mater 2018, 1 (11), 6502–6513. [Google Scholar]
- 3.Ye R; Peng Z; Metzger A; Lin J; Mann JA; Huang K; Xiang C; Fan X; Samuel EL; Alemany LB; Marti AA; Tour JM, Bandgap engineering of coal-derived graphene quantum dots. ACS Appl Mater Interfaces 2015, 7 (12), 7041–8. [DOI] [PubMed] [Google Scholar]
- 4.Yoon H; Kim HS; Kim J; Park M; Kim B; Lee S; Kang K; Yoo S; Jeon S, Blue Graphene Quantum Dots with High Color Purity by Controlling Subdomain Formation for Light-Emitting Devices. ACS Appl Nano Mater 2020, 3 (7), 6469–6477. [Google Scholar]
- 5.Gao T; Wang X; Zhao J; Jiang P; Jiang FL; Liu Y, Bridge between Temperature and Light: Bottom-Up Synthetic Route to Structure-Defined Graphene Quantum Dots as a Temperature Probe In Vitro and in Cells. ACS Appl Mater Interfaces 2020, 12 (19), 22002–22011. [DOI] [PubMed] [Google Scholar]
- 6.Liu R; Wu D; Feng X; Mullen K, Bottom-up fabrication of photoluminescent graphene quantum dots with uniform morphology. J Am Chem Soc 2011, 133 (39), 15221–3. [DOI] [PubMed] [Google Scholar]
- 7.Mueller ML; Yan X; Dragnea B; Li LS, Slow hot-carrier relaxation in colloidal graphene quantum dots. Nano Lett 2011, 11 (1), 56–60. [DOI] [PubMed] [Google Scholar]
- 8.Wei S; Zhang R; Liu Y; Ding H; Zhang Y-L, Graphene quantum dots prepared from chemical exfoliation of multiwall carbon nanotubes: An efficient photocatalyst promoter. Catal Commun 2016, 74, 104–109. [Google Scholar]
- 9.Hong GL; Zhao HL; Deng HH; Yang HJ; Peng HP; Liu YH; Chen W, Fabrication of ultra-small monolayer graphene quantum dots by pyrolysis of trisodium citrate for fluorescent cell imaging. Int J Nanomedicine 2018, 13, 4807–4815. [DOI] [PMC free article] [PubMed] [Google Scholar]
- 10.Peng J; Gao W; Gupta B; Liu Z; Romero-Aburto R; Ge L; Song L; Alemany L; Zhan X; Gao G; Vithayathil S; Kaipparettu B; Marti A; Hayashi T; Zhu J; Ajayan P, Graphene Quantum Dots Derived from Carbon Fibers. Nano Letters 2012, 12 (2), 844–849. [DOI] [PubMed] [Google Scholar]
- 11.Ahirwar S; Mallick S; Bahadur D, Electrochemical Method To Prepare Graphene Quantum Dots and Graphene Oxide Quantum Dots. ACS Omega 2017, 2 (11), 8343–8353. [DOI] [PMC free article] [PubMed] [Google Scholar]
- 12.Dong Y; Zhou N; Lin X; Lin J; Chi Y; Chen G, Extraction of Electrochemiluminescent Oxidized Carbon Quantum Dots from Activated Carbon. Chem Mater 2010, 22 (21), 5895–5899. [Google Scholar]
- 13.Chua CK; Sofer Z; Simek P; Jankovsky O; Klimova K; Bakardjieva S; Hrdlickova Kuckova S; Pumera M, Synthesis of strongly fluorescent graphene quantum dots by cage-opening buckminsterfullerene. ACS Nano 2015, 9 (3), 2548–55. [DOI] [PubMed] [Google Scholar]
- 14.Nilewski L; Mendoza K; Jalilov AS; Berka V; Wu G; Sikkema WKA; Metzger A; Ye R; Zhang R; Luong DX; Wang T; McHugh E; Derry PJ; Samuel EL; Kent TA; Tsai AL; Tour JM, Highly Oxidized Graphene Quantum Dots from Coal as Efficient Antioxidants. ACS Appl Mater Interfaces 2019, 11 (18), 16815–16821. [DOI] [PubMed] [Google Scholar]
- 15.Ye R; Xiang C; Lin J; Peng Z; Huang K; Yan Z; Cook NP; Samuel EL; Hwang CC; Ruan G; Ceriotti G; Raji AR; Marti AA; Tour JM, Coal as an abundant source of graphene quantum dots. Nat Commun 2013, 4, 2943. [DOI] [PubMed] [Google Scholar]
- 16.Li L; Wu G; Yang G; Peng J; Zhao J; Zhu JJ, Focusing on luminescent graphene quantum dots: current status and future perspectives. Nanoscale 2013, 5 (10), 4015–39. [DOI] [PubMed] [Google Scholar]
- 17.Bacon M; Bradley SJ; Nann T, Graphene Quantum Dots. Particle & Particle Systems Characterization 2014, 31 (4), 415–428. [Google Scholar]
- 18.Cunci L; Velez CA; Perez I; Suleiman A; Larios E; Jose-Yacaman M; Watkins JJ; Cabrera CR, Platinum electrodeposition at unsupported electrochemically reduced nanographene oxide for enhanced ammonia oxidation. ACS Appl Mater Interfaces 2014, 6 (3), 2137–45. [DOI] [PMC free article] [PubMed] [Google Scholar]
- 19.Sun X; Liu Z; Welsher K; Robinson JT; Goodwin A; Zaric S; Dai H, Nano-Graphene Oxide for Cellular Imaging and Drug Delivery. Nano Res 2008, 1 (3), 203–212. [DOI] [PMC free article] [PubMed] [Google Scholar]
- 20.Shen S; Wang J; Wu Z; Du Z; Tang Z; Yang J, Graphene Quantum Dots with High Yield and High Quality Synthesized from Low Cost Precursor of Aphanitic Graphite. Nanomaterials (Basel) 2020, 10 (2). [DOI] [PMC free article] [PubMed] [Google Scholar]
- 21.Zhang M; Bai L; Shang W; Xie W; Ma H; Fu Y; Fang D; Sun H; Fan L; Han M; Liu C; Yang S, Facile synthesis of water-soluble, highly fluorescent graphene quantum dots as a robust biological label for stem cells. Journal of Materials Chemistry 2012, 22 (15), 7461. [Google Scholar]
- 22.Wang Z; Yu J; Zhang X; Li N; Liu B; Li Y; Wang Y; Wang W; Li Y; Zhang L; Dissanayake S; Suib SL; Sun L, Large-Scale and Controllable Synthesis of Graphene Quantum Dots from Rice Husk Biomass: A Comprehensive Utilization Strategy. ACS Appl Mater Interfaces 2016, 8 (2), 1434–9. [DOI] [PubMed] [Google Scholar]
- 23.Pan D; Zhang J; Li Z; Wu M, Hydrothermal route for cutting graphene sheets into blue-luminescent graphene quantum dots. Adv Mater 2010, 22 (6), 734–8. [DOI] [PubMed] [Google Scholar]
- 24.Sun H; Wu L; Gao N; Ren J; Qu X, Improvement of photoluminescence of graphene quantum dots with a biocompatible photochemical reduction pathway and its bioimaging application. ACS Appl Mater Interfaces 2013, 5 (3), 1174–9. [DOI] [PubMed] [Google Scholar]
- 25.Tian P; Tang L; Teng KS; Lau SP, Graphene quantum dots from chemistry to applications. Materials Today Chemistry 2018, 10, 221–258. [Google Scholar]
- 26.Ghosh T; Prasad E, White-Light Emission from Unmodified Graphene Oxide Quantum Dots. The Journal of Physical Chemistry C 2015, 119 (5), 2733–2742. [Google Scholar]
- 27.Dey T; Mukherjee S; Ghorai A; Das S; Ray SK, Effects of Size and Localized States in Charge Carrier Dynamics and Performance of Solution-Processed Graphene Quantum Dots/Silicon Heterojunction Near-UV Photodetectors. The Journal of Physical Chemistry C 2020, 124 (22), 12161–12167. [Google Scholar]
- 28.Chae WS; Yun J; Nam SH; Lee SG; Yang WG; Yoon H; Park M; Jeon S, Fluorescence Modulation of Graphene Quantum Dots Near Structured Silver Nanofilms. ACS Appl Mater Interfaces 2018, 10 (16), 14079–14086. [DOI] [PubMed] [Google Scholar]
- 29.Xu A; He P; Ye C; Liu Z; Gu B; Gao B; Li Y; Dong H; Chen D; Wang G; Yang S; Ding G, Polarizing Graphene Quantum Dots toward Long-Acting Intracellular Reactive Oxygen Species Evaluation and Tumor Detection. ACS Appl Mater Interfaces 2020, 12 (9), 10781–10790. [DOI] [PubMed] [Google Scholar]
- 30.Gao R; Zhong Z; Gao X; Jia L, Graphene Oxide Quantum Dots Assisted Construction of Fluorescent Aptasensor for Rapid Detection of Pseudomonas aeruginosa in Food Samples. J Agric Food Chem 2018, 66 (41), 10898–10905. [DOI] [PubMed] [Google Scholar]
- 31.Kalaiyarasan G; Joseph J; Kumar P, Phosphorus-Doped Carbon Quantum Dots as Fluorometric Probes for Iron Detection. ACS Omega 2020, 5 (35), 22278–22288. [DOI] [PMC free article] [PubMed] [Google Scholar]
- 32.Liu Y; Kim DY, Ultraviolet and blue emitting graphene quantum dots synthesized from carbon nano-onions and their comparison for metal ion sensing. Chem Commun (Camb) 2015, 51 (20), 4176–9. [DOI] [PubMed] [Google Scholar]
- 33.Zhang C; Wei K; Zhang W; Bai Y; Sun Y; Gu J, Graphene Oxide Quantum Dots Incorporated into a Thin Film Nanocomposite Membrane with High Flux and Antifouling Properties for Low-Pressure Nanofiltration. ACS Appl Mater Interfaces 2017, 9 (12), 11082–11094. [DOI] [PubMed] [Google Scholar]
- 34.Kim YH; Lee EY; Lee HH; Seo TS, Characteristics of Reduced Graphene Oxide Quantum Dots for a Flexible Memory Thin Film Transistor. ACS Appl Mater Interfaces 2017, 9 (19), 16375–16380. [DOI] [PubMed] [Google Scholar]
- 35.Luo Z; Lu Y; Somers LA; Johnson AT, High yield preparation of macroscopic graphene oxide membranes. J Am Chem Soc 2009, 131 (3), 898–9. [DOI] [PubMed] [Google Scholar]
- 36.Shang J; Ma L; Li J; Ai W; Yu T; Gurzadyan GG, The origin of fluorescence from graphene oxide. Sci Rep 2012, 2, 792. [DOI] [PMC free article] [PubMed] [Google Scholar]
- 37.Cunci L; Vargas MM; Cunci R; Gomez-Moreno R; Perez I; Baerga-Ortiz A; Gonzalez CI; Cabrera CR, Real-Time Detection of Telomerase Activity in Cancer Cells using a Label-Free Electrochemical Impedimetric Biosensing Microchip. RSC Adv 2014, 4 (94), 52357–52365. [DOI] [PMC free article] [PubMed] [Google Scholar]
- 38.Defever T; Druet M; Rochelet-Dequaire M; Joannes M; Grossiord C; Limoges B; Marchal D, Real-Time Electrochemical Monitoring of the Polymerase Chain Reaction by Mediated Redox Catalysis. J Am Chem Soc 2009, 131 (32), 11433–11441. [DOI] [PubMed] [Google Scholar]
- 39.Ferrari AC; Robertson J, Interpretation of Raman spectra of disordered and amorphous carbon. Phys Rev B Condens Matter 2000, 61 (20), 14095–14107. [Google Scholar]
- 40.Shahriary L; Athawale AA, Graphene oxide synthesized by using modified hummers approach.
- 41.Cuong TV; Pham VH; Tran QT; Hahn SH; Chung JS; Shin EW; Kim EJ, Photoluminescence and Raman studies of graphene thin films prepared by reduction of graphene oxide. Mater Lett 2010, 64 (3), 399–401. [Google Scholar]
- 42.Zhao J; Liu L; Li F, Graphene oxide: physics and applications. Springer: 2015; Vol. 1. [Google Scholar]
- 43.Konkena B; Vasudevan S, Understanding Aqueous Dispersibility of Graphene Oxide and Reduced Graphene Oxide through pK(a) Measurements. Journal of Physical Chemistry Letters 2012, 3 (7), 867–872. [DOI] [PubMed] [Google Scholar]
- 44.Yang G; Li L; Lee WB; Ng MC, Structure of graphene and its disorders: a review. Sci Technol Adv Mater 2018, 19 (1), 613–648. [DOI] [PMC free article] [PubMed] [Google Scholar]
- 45.Zhu J; Tang Y; Wang G; Mao J; Liu Z; Sun T; Wang M; Chen D; Yang Y; Li J; Deng Y; Yang S, Green, Rapid, and Universal Preparation Approach of Graphene Quantum Dots under Ultraviolet Irradiation. ACS Appl Mater Interfaces 2017, 9 (16), 14470–14477. [DOI] [PubMed] [Google Scholar]
- 46.Zhuo S; Shao M; Lee ST, Upconversion and downconversion fluorescent graphene quantum dots: ultrasonic preparation and photocatalysis. ACS Nano 2012, 6 (2), 1059–64. [DOI] [PubMed] [Google Scholar]
- 47.Wu C; Chen R; Ma C; Cheng R; Gao X; Wang T; Liu Y; Huo P; Yan Y, Construction of upconversion nitrogen doped graphene quantum dots modified BiVO4 photocatalyst with enhanced visible-light photocatalytic activity. Ceram Int 2019, 45 (2), 2088–2096. [Google Scholar]
- 48.Ke J; Li X; Zhao Q; Liu B; Liu S; Wang S, Upconversion carbon quantum dots as visible light responsive component for efficient enhancement of photocatalytic performance. J Colloid Interface Sci 2017, 496, 425–433. [DOI] [PubMed] [Google Scholar]
- 49.Li M; Wu W; Ren W; Cheng H-M; Tang N; Zhong W; Du Y, Synthesis and upconversion luminescence of N-doped graphene quantum dots. Appl Phys Lett 2012, 101 (10), 103107. [Google Scholar]
- 50.Barati A; Shamsipur M; Abdollahi H, A misunderstanding about upconversion luminescence of carbon quantum dots. J Iran Chem Soc 2014, 12 (3), 441–446. [Google Scholar]
- 51.Gan Z; Wu X; Zhou G; Shen J; Chu PK, Is There Real Upconversion Photoluminescence from Graphene Quantum Dots? Adv Opt Mater 2013, 1 (8), 554–558. [Google Scholar]
- 52.Wen X; Yu P; Toh YR; Ma X; Tang J, On the upconversion fluorescence in carbon nanodots and graphene quantum dots. Chem Commun 2014, 50 (36), 4703–6. [DOI] [PubMed] [Google Scholar]
- 53.Zeng M; Shah SA; Huang D; Parviz D; Yu YH; Wang X; Green MJ; Cheng Z, Aqueous Exfoliation of Graphite into Graphene Assisted by Sulfonyl Graphene Quantum Dots for Photonic Crystal Applications. ACS Appl Mater Interfaces 2017, 9 (36), 30797–30804. [DOI] [PubMed] [Google Scholar]
- 54.Hopkins JB; Gillilan RE; Skou S, BioXTAS RAW: improvements to a free open-source program for small-angle X-ray scattering data reduction and analysis. J Appl Crystallogr 2017, 50 (Pt 5), 1545–1553. [DOI] [PMC free article] [PubMed] [Google Scholar]
- 55.Acerbo AS; Cook MJ; Gillilan RE, Upgrade of MacCHESS facility for X-ray scattering of biological macromolecules in solution. J Synchrotron Radiat 2015, 22 (1), 180–6. [DOI] [PMC free article] [PubMed] [Google Scholar]
- 56.Skou S; Gillilan RE; Ando N, Synchrotron-based small-angle X-ray scattering of proteins in solution. Nat Protoc 2014, 9 (7), 1727–39. [DOI] [PMC free article] [PubMed] [Google Scholar]
- 57.Konarev PV; Volkov VV; Sokolova AV; Koch MHJ; Svergun DI, PRIMUS: a Windows PC-based system for small-angle scattering data analysis. J Appl Crystallogr 2003, 36 (5), 1277–1282. [Google Scholar]
- 58.Petoukhov MV; Konarev PV; Kikhney AG; Svergun DI, ATSAS 2.1 – towards automated and web-supported small-angle scattering data analysis. J Appl Crystallogr 2007, 40 (s1), s223–s228. [Google Scholar]
- 59.Diaz-Cartagena DC; Hernandez-Cancel G; Bracho-Rincon DP; Gonzalez-Feliciano JA; Cunci L; Gonzalez CI; Cabrera CR, Label-Free Telomerase Activity Detection via Electrochemical Impedance Spectroscopy. ACS Omega 2019, 4 (16), 16724–16732. [DOI] [PMC free article] [PubMed] [Google Scholar]
- 60.Tang Z; Wu H; Cort JR; Buchko GW; Zhang Y; Shao Y; Aksay IA; Liu J; Lin Y, Constraint of DNA on functionalized graphene improves its biostability and specificity. Small 2010, 6 (11), 1205–9. [DOI] [PubMed] [Google Scholar]
- 61.Liu B; Salgado S; Maheshwari V; Liu J, DNA adsorbed on graphene and graphene oxide: Fundamental interactions, desorption and applications. Curr Opin Colloid Interface Sci 2016, 26, 41–49. [Google Scholar]
Associated Data
This section collects any data citations, data availability statements, or supplementary materials included in this article.


