Inactivating mutations in LKB1/STK11 are present in ~20% of non-small cell lung cancers (NSCLC) and portend poor response to anti-PD-1 immunotherapy. Unexpectedly, we found that LKB1-deficiency correlated with elevated tumor mutational burden (TMB) in NSCLCs from non-smokers and genetically engineered mouse models (GEMMs), despite the frequent association between high TMB and anti-PD1 treatment efficacy. However, LKB1 deficiency also suppressed antigen processing and presentation, associated with compromised immunoproteasome activity and increased autophagic flux. Immunoproteasome activity and antigen presentation were restored by inhibiting autophagy through targeting the ATG1/ULK1 pathway. Accordingly, ULK1 inhibition synergized with PD-1 antibody blockade, provoking effector T cell expansion and tumor regression in Lkb1-mutant tumor models. This study reveals interplay between the immunoproteasome and autophagic catabolism in antigen processing and immune recognition, and suggests the therapeutic potential of dual ULK1 and PD-1 inhibition in LKB1-mutant NSCLC as a strategy to enhance antigen presentation and to promote anti-tumor immunity.
LKB1 mutant NSCLC presents a clinical challenge, with significantly worse overall outcomes compared to other NSCLC subsets and notable resistance to current immunotherapies as demonstrated in both patients and genetically engineered mouse models (GEMMs)1–7. LKB1 is frequently co-mutated with KRAS8 in NSCLC, and these tumors (designated KL) display an objective response rate (ORR) to immune checkpoint inhibition of <10%, whereas KRAS/TP53 mutant NSCLC (designated KP) show a >30% ORR1–4. However, both KL and KP NSCLCs often arise in patients with a history of heavy smoking, which drives increased levels of nonsynonymous mutations, a feature that in NSCLC in general is associated with a more durable clinical response and better progression-free survival upon checkpoint inhibitor treatment8, likely due to the enhanced activation of neoantigen-specific CD8+ T cells9–11.
LKB1 mutation increases tumor mutational burden
Prior studies of human lung cancers not stratified by smoking status revealed comparably high TMB in KL and KP tumors. We used spontaneous Kras-driven NSCLCs arising in genetically engineered mouse models (GEMMs)12 to more readily resolve the impact of Lkb1 loss on TMB. Remarkably, we found that Lkb1 co-mutation was associated with five-fold increase in TMB compared with Trp53 co-mutation in both cell lines and lung nodules generated from GEMMs (Fig. 1a, Extended Data Fig. 1a). This effect was attributable to Lkb1 status not Trp53 status since mouse cell lines with co-mutated Lkb1, Kras, and Trp53 (KLP) had comparable TMB to KL lines (Extended Data Fig. 1b, 1c). Similar to LKB1-mutant (LKB1mut) cancer patient tumors and KL GEMMs, KL cell lines generated from GEMMs showed a mixture of adenocarcinoma and squamous carcinomas phenotypes (Extended Data Fig. 1d).
Figure 1|. Increased tumor mutational burden in LKB1 mutant NSCLC tumors.
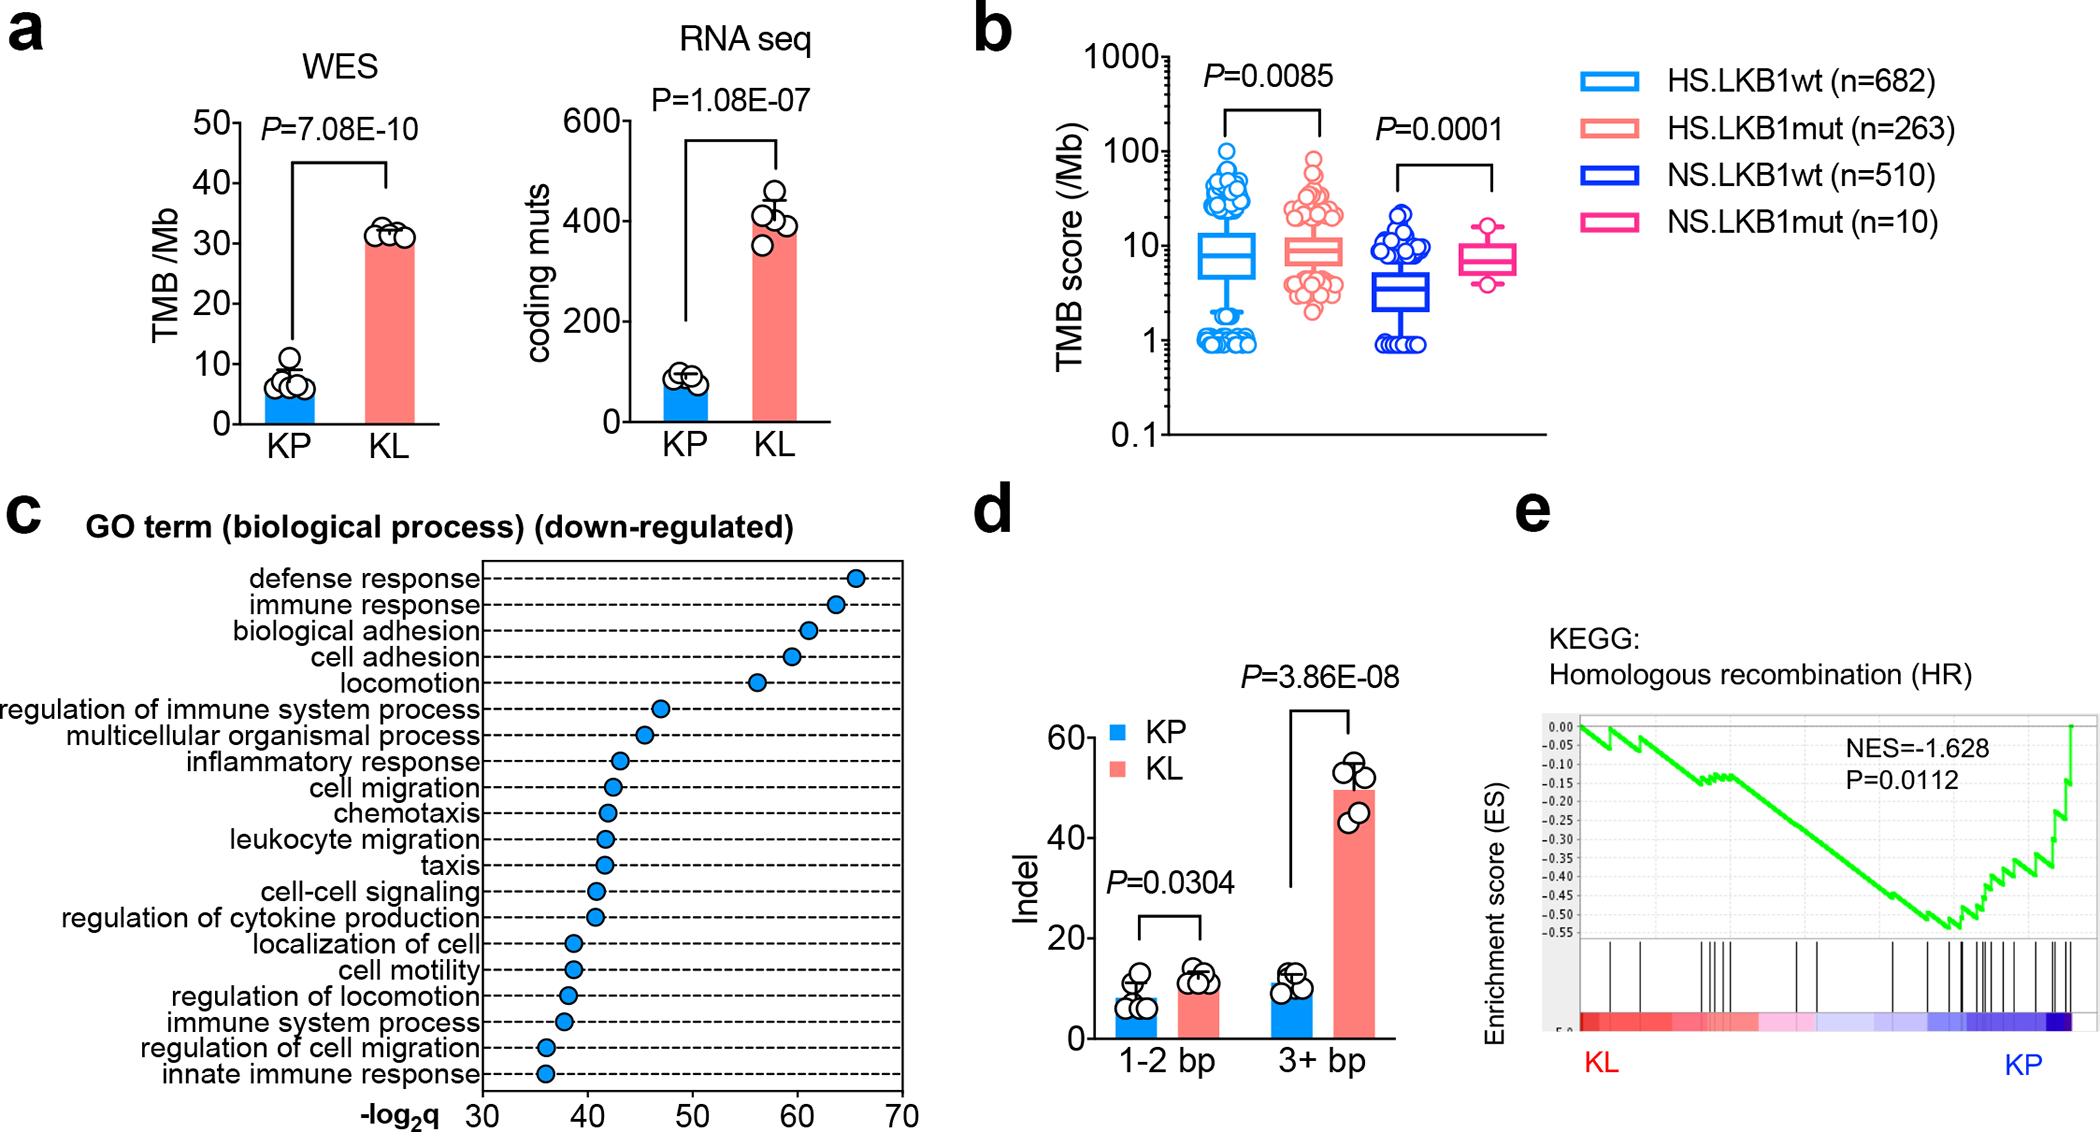
a. Comparison of tumor mutational burden (TMB) of nonsynonymous mutation using cell lines derived from KrasG12DLkb1fl/fl (KL) or KrasG12DTrp53fl/fl (KP) NSCLC GEMMs lung nodules. Left panel, whole exome sequencing (WES) of total nonsynonymous mutation per Mb. (KP, n=6 cell lines; KL n=5 cell lines) (mean±sd, two-sided Student’s t test). Right panel, RNA sequencing for the total number coding region mutants of each cell line. (KP n=5 cell lines; KL n=5 cell lines) (mean±sd, two-sided Student’s t test). b. TMB score from NSCLC patients with or without LKB1 mutation. HS, heavy smoker; NS, never smoker. (HS.LKB1wt n=682; HS.LKB1mut n=263; NS.LKB1wt n=510; NS.LKB1mut n=10 patients each group) (Mann-Whitney test of log10 transformed TMB, two tailed. Box shown 25th to 75th percentiles with line shown as median, and whiskers show 10–90 percentile. Shapiro-Wilk test was used for normality test of transformed TMB score, two-tailed.) c. Top suppressed biological process pathways from TCGA KRAS/LKB1 mutant patient comparing with KRAS/TP53 mutant patients. x-axis, -log2q value (Bonferroni) between the two groups. (KP n=22, KL n=19 patients each group). d. Number of coding insertion-deletion (indel) variants from either KP or KL cell lines of either short (1–2bp) or long (≥3bp) indel. (KP n=6; KL n=5 cell lines each group) (mean±sd, unpaired two-sided multiple t test, FDR<0.05) e. Gene set enrichment analysis (GSEA) of homologous recombination repair of KL and KP cells. (KP n=5; KL n=5 cell lines each group)
Based on these findings in GEM models, we analyzed an NSCLC patient cohort with known LKB1 mutational status, smoking history, and TMB measurement13. Notably, LKB1 mutations in never smoker (NS) patients were associated with two-fold increased TMB compared to a group of NS with wildtype LKB1(NS.LKB1wt). TMB was comparable in LKB1 mutant (LKB1mut) and wildtype (LKB1wt) NSCLCs in heavy smoker (HS) patients, who have a higher TMB in general14 (Fig. 1b). As expected, both LKB1wt and LKB1mut HS groups had increased frequency of KRAS mutations compared to NS groups. Furthermore, the TP53 mutation percentage was higher in the LKB1wt group than the LKB1mut group for both NS and HS patients, consistent with prior studies (Extended Data Fig. 1e).
Despite suppressive immune response pathways in KL tumors (Fig. 1c, Extended Data Fig. 1f), KL tumors also had an increase in total number of coding insertion-deletions (indels) and nonsynonymous single-nucleotide variations (SNVs) (Fig. 1d, Extended Data Fig. 2a), although the percentage of indels among total nonsynonymous mutations was slightly decreased in KL (Extended Data Fig. 2b). Indels have been implicated in driving immunogenic responses due to the generation of immunogenic neoantigens15,16.LKB1 mutant NSCLCs have increases in COSMIC mutational signatures 20 and 26, which are associated with frequent small insertions and deletions17. Conversely, they show a decrease in signature 3, which suggests failure of DNA double-strand break (DSB) repair by homologous recombination (HR)18, and signatures 7 and 22, which correlate with defective nucleotide excision repair (NER)19 (Extended Data Fig. 2c, 2d). Consistent with increased nonsynonymous mutations, gene set enrichment analysis (GSEA) demonstrated the association between LKB1 mutation and both the replication-dependent and -independent HR repair pathways (Fig 1e, Extended Data Fig. 2e), but not other DNA repair related pathways or others (Extended Data Fig. 2e, 2f). Collectively, these analyses suggest a link between LKB1 inactivation and defective NER and HR.
To quantify both HR and non-homologous end joining repair (NHEJ) ratios in KL lines we used a GFP-based reporter system20,21. KL cells showed greatly suppressed HR and NHEJ compared with KP cell lines (Fig. 2a). KLP triple-mutant lung cancer cells also showed reduced HR but not NHEJ (Extended Data Fig. 3a). HR plays a dominant role during the late S/G2 and G1/early S cell cycle phases to repair DSBs and is typically non-mutagenic as compared with NHEJ22,23. HR was rescued by LKB1wt overexpression in KL lines, but not by kinase-dead LKB1 (LKB1-KD) (Fig. 2b, left). By contrast, neither LKB1wt or LKB1-KD reconstitution restored NHEJ in LKB1 deficient cells (Fig. 2b, right). These data indicate that LKB1 is important for maintaining homology directed repair but not NHEJ for DSBs. We further confirmed this phenomenon using human NSCLC cell lines. In particular, LKB1 overexpression increased HR, but not NHEJ levels, in the human LKB1-deficient lung cancer lines H23, A427 and H460 (Fig. 2c, Extended Data Fig. 3b). Thus, the increase in the HR signature in LKB1 deficient tumors correlates with a critical requirement for LKB1 kinase activity for HR-mediated repair of DSBs, whereas the increase in NHEJ signatures is not directly related to LKB1 function.
Figure 2|. LKB1 is critical for maintaining homologous recombination (HR) during DNA double-strand break (DSB) repair.
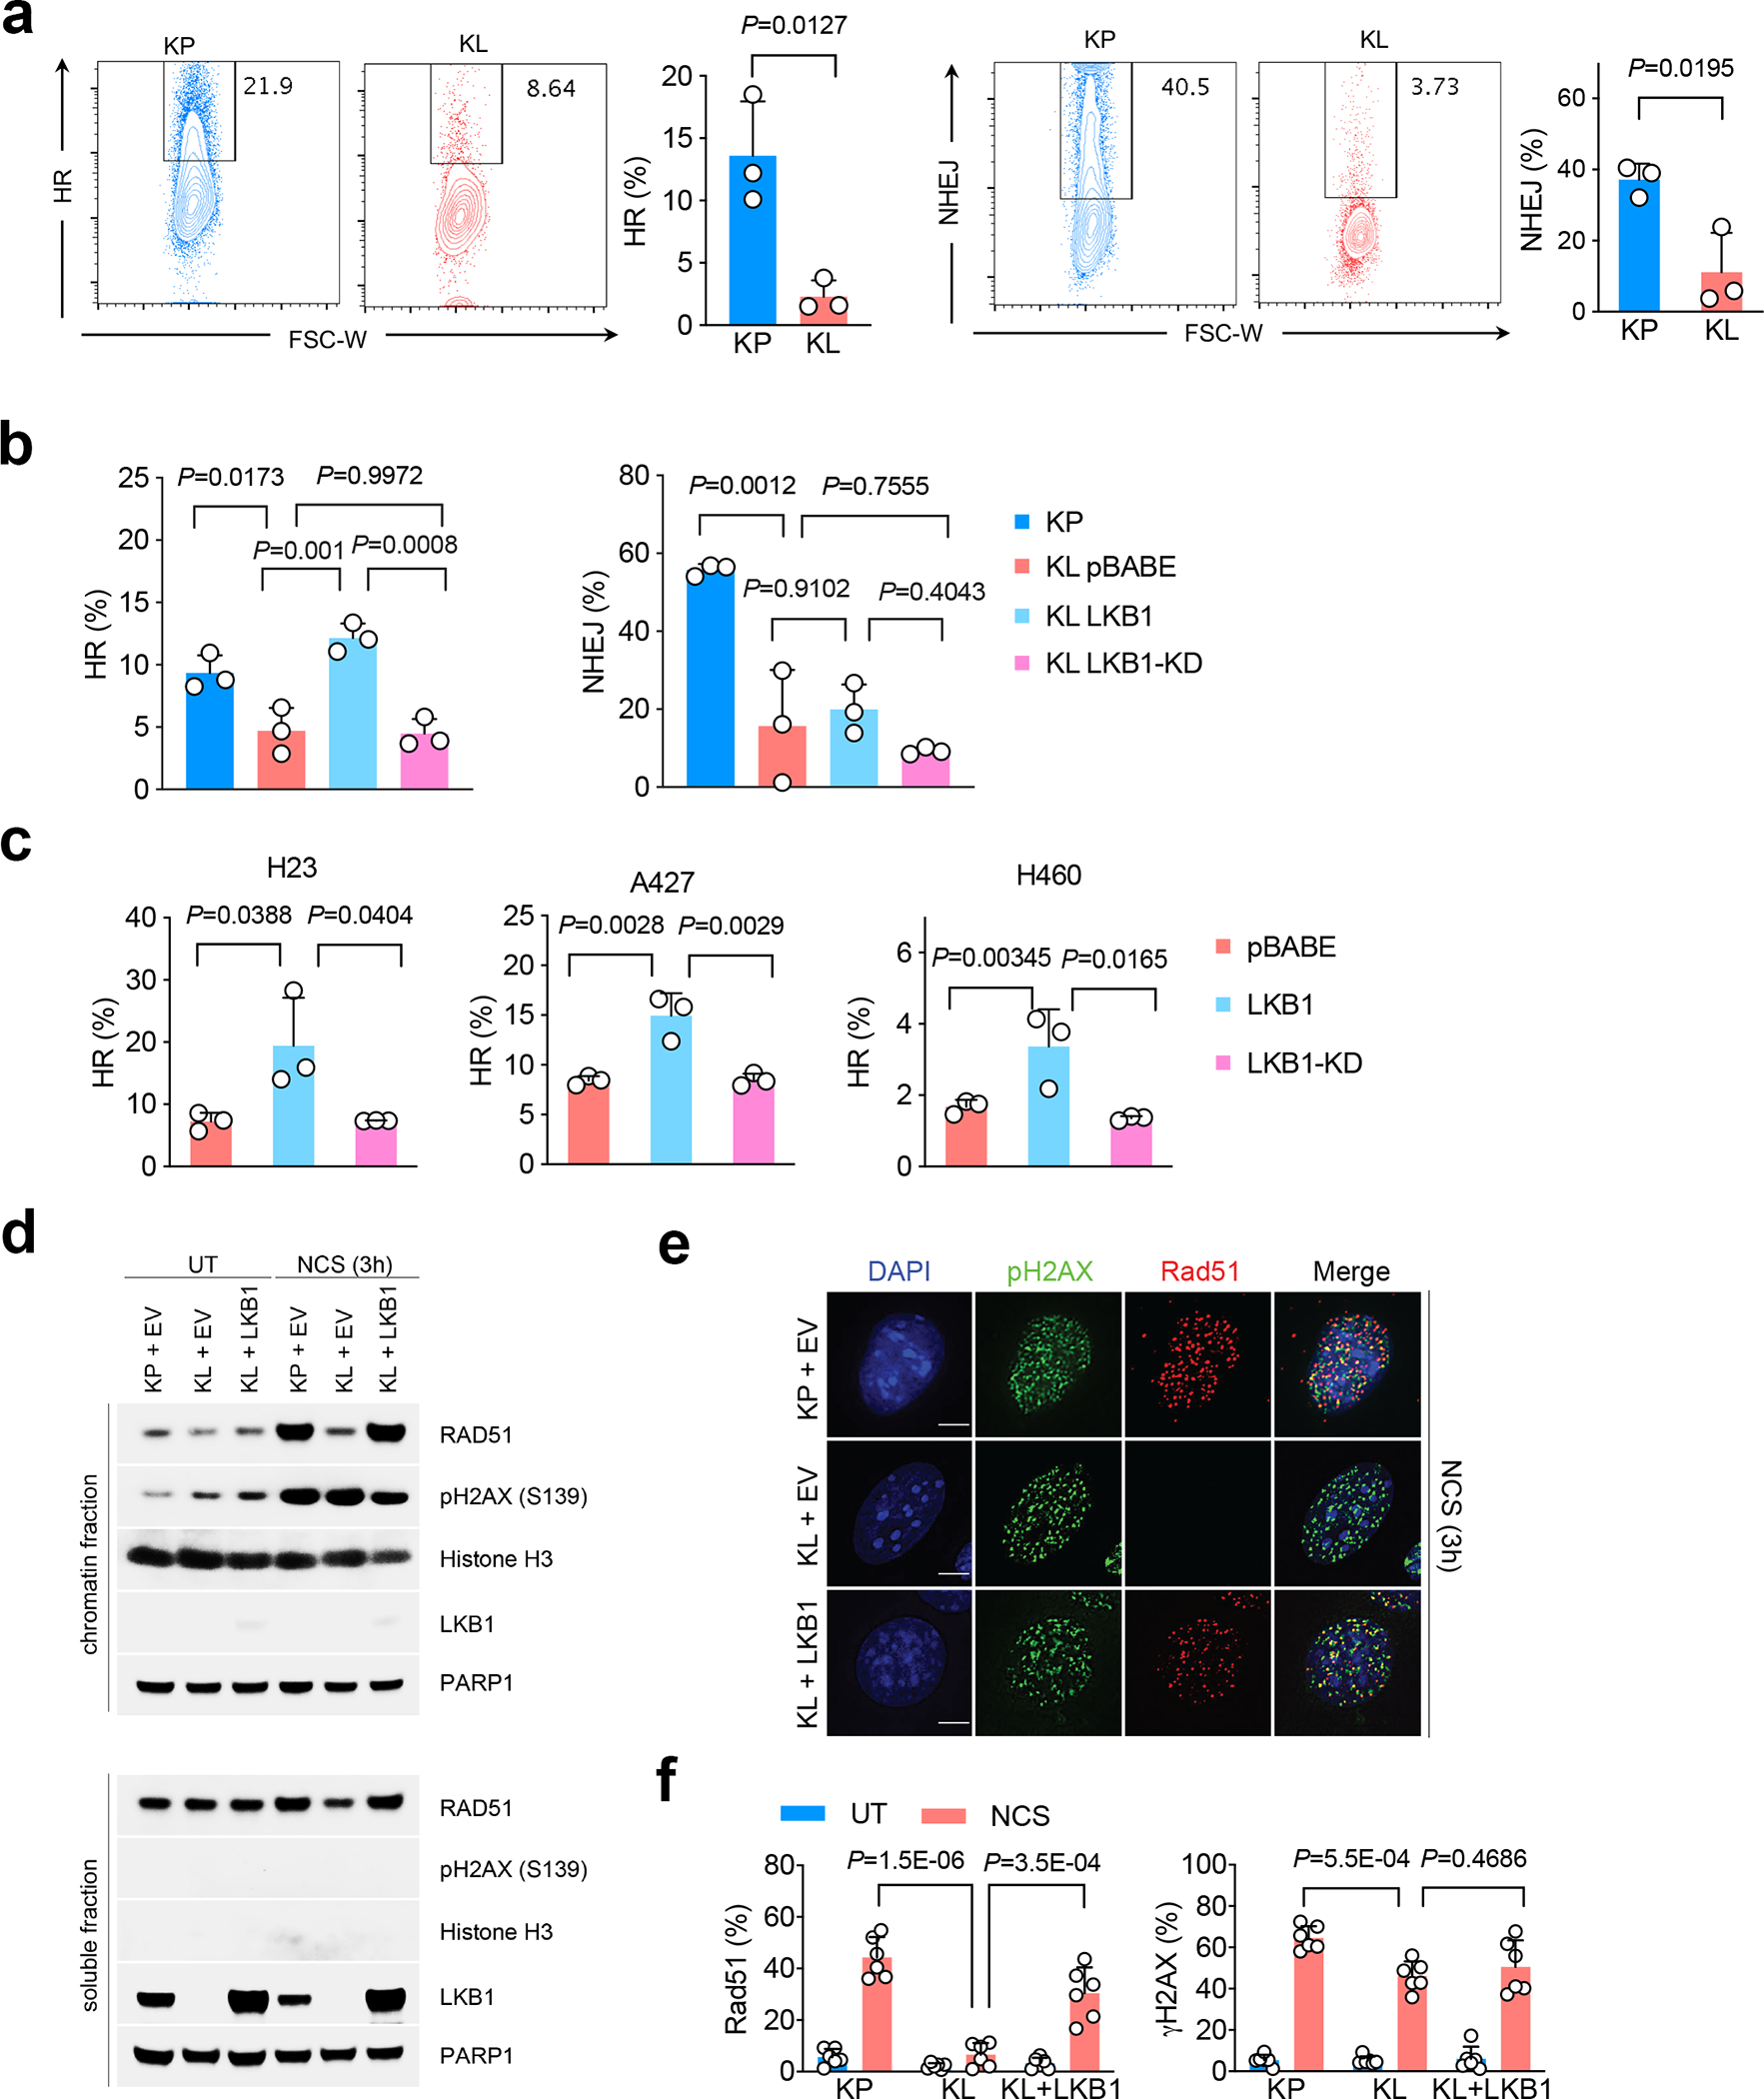
a. Flow analysis of HR (left) and non-homologous end joining (NHEJ) (right) rate in both KP and KL cells through quantifying repaired HR or NHEJ reporter GFP+ cells among total I-SceI expressing BFP+ cells. Left, representative flow panels; right, quantification of HR (KP n=3; KL n=3 cell lines each group) or NHEJ (KP n=3; KL n=3 cell lines each group) percentage. Data representative one of three independent experiments. (mean±sd, two-tailed t test, unpaired) b. Percentage of HR and NHEJ in KP and KL isogenic cells with wild type or kinase dead (KD) LKB1 overexpression. n=3 independent experiments for each group. (mean±sd, two-tailed t test, unpaired). c. HR ratio changes in human NSCLC LKB1 mutant cell lines H23, A427 and H460 with empty vector (pBABE), LKB1 or KLB1-KD overexpression. n=3 independent experiments for each group. (mean±sd, two-tailed t test, unpaired) d. Chromatin binding assay of either KP or KL cells with LKB1 overexpression after neocarzinostatin (NCS) induced DNA damage. Upper panel, chromatin fraction of bound proteins; lower panel, total soluble fraction of the proteins examined. Data represents one of two independent experiments. Blots are cropped and uncropped images can be found in Source Data. e. Immunofluorescent (IF) staining of pH2AX and Rad51 foci at DNA DSB sites after NCS induced damage in KP and KL cells with or without LKB1 overexpression. UT, untreated. NCS, NCS treated. Scale bars, 5μm. Data representative of 3 independent experiments. f. Quantification of Rad51 and pH2AX positive and negative cells as determined in panel e representative photos, and quantified as percentage among total cells. UT and NCS groups, KP n=6, KL n=6, KL+LKB1 n=6 independent experiments. (mean±sd, two-tailed t test, unpaired).
Upon a DSB, PARP1 activity and H2AX phosphorylation (pH2AX) signal can be detected at the DSB. This is followed by the recruitment of BRCA1 to promote DNA-end resection to generate single-strand DNA (ssDNA) for strand invasion and HR repair22. In turn, Rad51 recombinase is recruited at DSB sites to catalyze homology-dependent repair between a damaged DNA strand and an undamaged DNA template. To test acute DNA repair processes, we used the DNA damaging reagent neocarzinostatin (NCS) to induce both DSBs and ssDNA breaks. NCS treatment led to the expected induction of phosphorylation of H2AX- Ser139 in KP, KL, and KL-LKB1 lines (Fig. 2d). However, the recruitment of Rad51 to chromatin was reduced specifically in KL cells and restored by LKB1 re-expression (Fig. 2d). Immunofluorescence (IF) staining confirmed compromised in Rad51 recruitment to pH2AX foci in LKB1-deficient cells and rescue upon LKB1 re-expression, despite comparable levels of pH2AX positivity (Fig. 2e, 2f, Extended Data Fig. 3c). Moreover, immunoprecipitation assays demonstrated the presence of LKB1 in a complex with BRCA1, but not to RAD51, AMPK or RPA, in response to NCS-induced damage (Extended Data Fig. 3d), suggesting that the functions of LKB1 in HR may involve complexing with BRCA1 with compromised RAD51 recruitment.
LKB1 loss suppresses antigen presentation
The relationship between DNA repair deficiency and immunotherapy response in the clinic is complex and incompletely understood. For example, while tumors with mismatch repair deficiency are more susceptible to immune checkpoint blockade24, BRCA1 mutated tumors have suppressed antigen presentation and require additional immune stimulating agents to engender sensitivity to immunotherapy25. Pathway analysis from both the Cancer Genome Atlas (TCGA) and mouse cell line datasets by gene set enrichments showed that LKB1 mutations were associated with transcriptional signatures for suppressed immune response in cancer cells, including pathways involved in host defense response, immune response, regulation of immune system process, leukocyte activation and innate immune responses are suppressed in KL tumors compared with KP tumors (Fig. 1c, Extended Data Fig. 1f, Supplementary Table 1).
We reasoned that impaired neoantigen presentation by MHCI at the cell surface could function as a mechanism to promote immune evasion in the context of the HR defects and high TMB that are present in LKB1mut NSCLC. We found that KL NSCLC patients have decreased expression of the machinery for neoantigen processing and presentation, with reduced mRNA levels of B2M, HLA-A, HLA-B, TAP1, and immunoproteasome subunit PSMB9 compared to KP tumors (Fig. 3a, Extended Data Fig. 4a). By contrast, no differences were observed in the expression of the catalytic subunits of conventional proteasomal PSMB5 and PSMB6 (Fig. 3a). Similarly, KL mouse cancer cell lines and GEMM lung tumor nodules exhibited decreased expression of the immunoproteasome subunits Psmb8 and Psmb9 at the mRNA levels and (Fig. 3b) and protein levels (Extended Data Fig. 4b) compared to murine KP tumors. TAP1 and Tapasin protein levels were reduced, where PSMB5 and PSMB6 were at comparable or increased levels in KL tumors (Extended Data Fig. 4b).
Figure 3|. Suppressed antigen presentation machinery and immunoproteasome function in KL tumors.
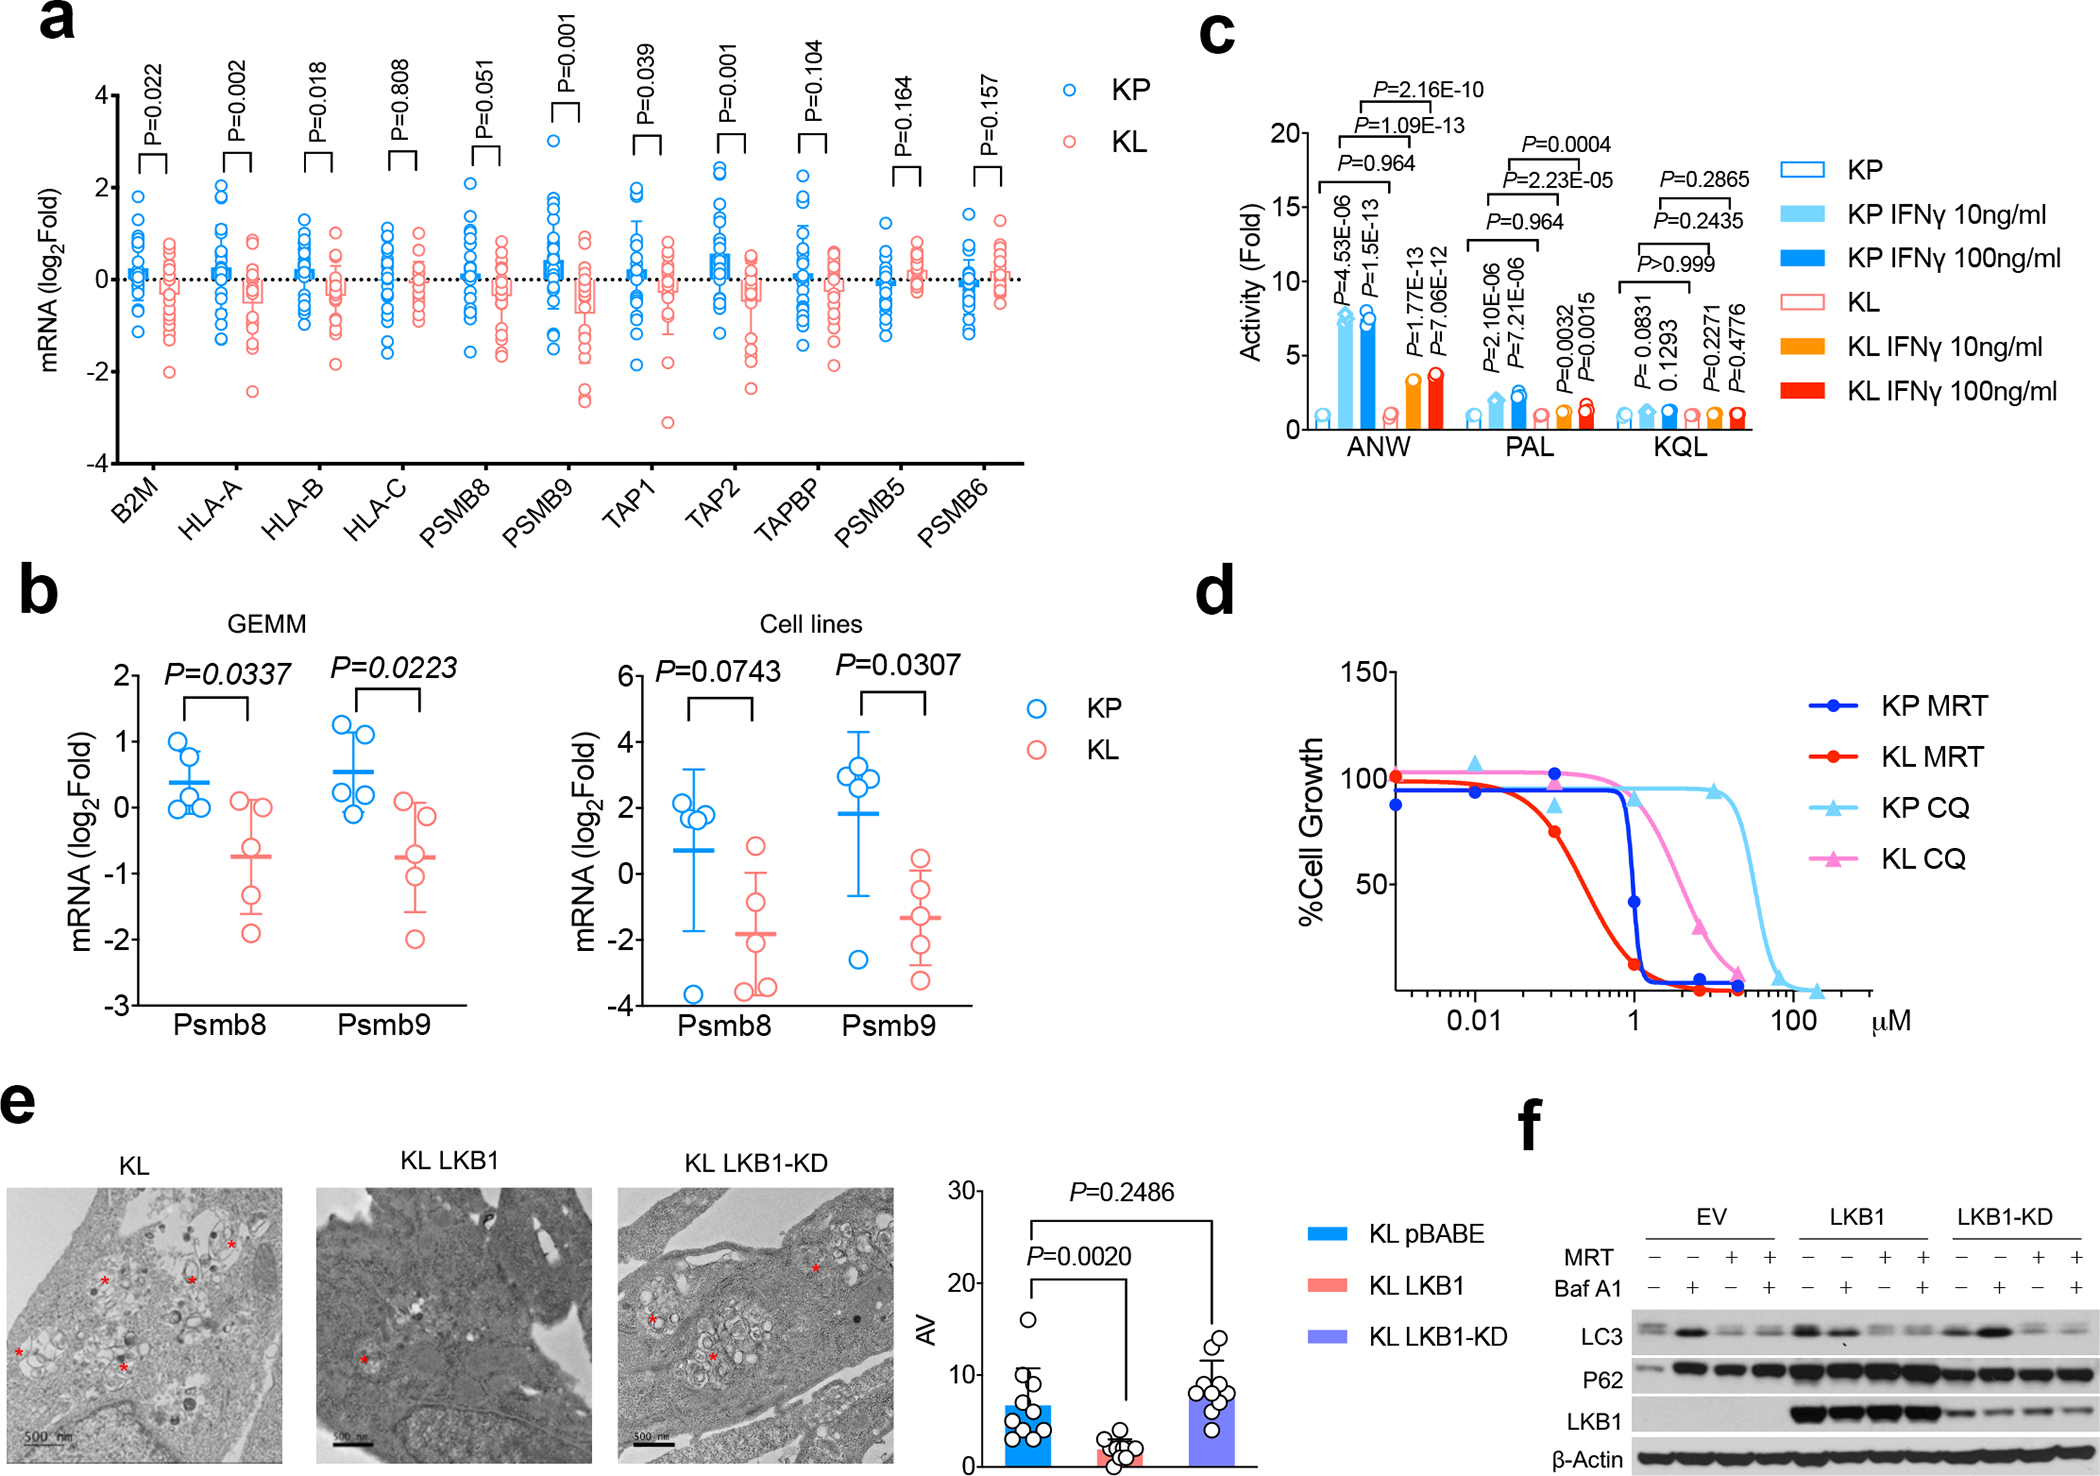
a. mRNA levels of antigen presentation related genes as well as conventional proteasome subunit expression from TCGA KRAS/LKB1 mutant compared with KRAS/TP53 mutant NSCLC patients. KL n=19, KP n=22 patients. (mean±sd, multiple two-tailed t test, unpaired. FDR=0.05) b. mRNA levels of immunoproteasome subunits Lmp2/Psmb9 and Lmp7/Psmb8 from KP and KL tumors either from genetically engineered mouse model (GEMM) (left) or cell lines (right). left, KP n=5, KL n=5 lung nodules each group. right, KP n=5, KL n=5 cell lines each group. (mean± sd, multiple two-tailed t test, unpaired. FDR=0.05). c. Immunoproteasome subunits activity changes in LKB1 mutant tumors are measured by substrates Ac-ANW-AMC, Ac-PAL-AMC and Ac-KQL-AMC cleavage. The cleavage activities Vmax were normalized with corresponding unstimulated samples and shown as fold changes. n=3 cell cultures for each group. Data shown representative one of three independent experiments. (mean±sd, multiple two-tailed t test, unpaired, two-stage step-up method of Benjamini, Krieger and Yekutieli, FDR<1%). d. Cell growth inhibition in KL and KP cells in response to autophagy inhibitors chloroquine (CQ) or ULK1 inhibitor MRT68921 (MRT). Data shown represents one of three independent experiments. n=3 cell cultures for each cell line with each treatment condition. e. Electron microscopy (EM) to visualize double-membraned autophagosome and autolysosome autophagic vacuole (AV) from KL, KL LKB1 and KL LKB1-KD cells. Top and left bottom, representative images. Data representative of 2 independent experiments. * marked AV. Lower right, quantification of AV numbers for each cell line examined. Scale bar, 500nm. For each group n=10 fields. Each dot represents quantification of one random field of EM image. (mean±sd, two-tailed t test, unpaired) f. Western blot showing autophagic flux by blocking lysosomal turnover with bafilomycin A1 (Baf A1) from KL-EV, KL-LKB1 and KL-LKB1(KD) cells. Data representative of 3 independent experiments. Blots are cropped and uncropped images can be found in Source Data.
IFNγ stimulation induces the activity of the immunoproteasome subunits LMP7/PSMB8 (Ac-ANW) and LMP2/PSMB9 (Ac-PAL) along with upregulating the mRNA expression of classical class I MHC genes and processing factors, including HLA-A, HLA-B, HLA-C, TAP1 and TAPASIN26–29. Notably, IFNγ-induced PSMB8 and PSMB9 activity was greatly attenuated in KL cells compared to KP cells, whereas there was no compromise in these transcriptional changes (Fig. 3c, Extended Data Fig. 4b). The impairment in PSMB8 and PSMB9 activity was specifically due to LKB1 loss, since Kras/Lkb1/Trp53 (KLP) cells showed comparable levels to KL cells (Extended Data Fig. 4c, 4d) and since wild type LKB1 reconstitution increased immunoproteasome activity in KL cells (Extended Data Fig. 4e). Finally, while we observed decreased cell surface MHCI expression in KL tumors in vivo, MHCI levels were comparably induced upon IFNγ stimulation in vitro (Extended Data Figs. 5a, 5b, 5c). Thus, uptake of the MHCI complex from the ER to the cell surface remains functional in LKB1 mutant tumors, whereas there is compromised generation of immunogenic peptides through the immunoproteasome.
Autophagy inhibition enhances immunoproteasome activity
Suppressed antigen processing for MHC I presentation could promote immune evasion in LKB1 deficient tumors. Hence, therapeutic strategies that increase antigen presentation might restore anti-tumor immunity and compensate for LKB1 loss. Autophagy and proteasomal degradation are the two major pathways for quality control of cellular protein homeostasis, and reduced proteasome activity can induce autophagy as a compensatory process30. Notably, KRAS mutant cancers, including those with LKB1 co-mutations, have been shown to depend on autophagy-lysosomal catabolism for tumor growth via both cell-autonomous and non-autonomous mechanism31–34. GSEA comparison of lung cancers from the GEM models showed enrichment of autophagy pathways in the KL tumors compared to KP tumors (Extended Data Fig 2e, 2f). Although there was also a trend toward enrichment in human KL lung tumors, it did not reach statistical significance, possibly due to interference of other co-mutations in patient tumors (Extended Data Fig. 2e, 2f). Unfolded protein pathways (UPR), which have been linked to autophagy and MHCI expression35,36, did not show consistent differences in human and murine KL tumors (Extended Data Fig. 2e, 2f), indicating that UPR may not play a major role in antigen presentation defects resulting from of LKB1 inactivation.
Consistent with increased activity of the autophagy-lysosomal catabolic system in KL tumors and its requirement for in vitro proliferation34, KL cells showed elevated sensitivity to autophagy inhibitors chloroquine and MRT68921 (Fig. 3d), which inhibit lysosomal acidification and ULK1/ULK2 kinase activity, respectively37,38, compared to KP tumors. Using transmission electron microscopy (TEM) to quantify the number of autophagic vacuoles (AVs) in KL cells, we found that reconstitution of LKB1, but not LKB1-KD, suppressed the number of AVs (Fig. 3e), consistent with increased autophagic catabolism in the absence of LKB1. Accordingly, inhibition of autolysosome acidification with bafilomycin A1 promoted accumulation of p62 and LC3II levels during nutrient deprivation (EBSS) in both KL-EV and KL-LKB1-KD cells, but not in KL cells expressing LKB1wt (Fig. 3f), in line with an increase in autophagic flux upon LKB1 deficiency. Importantly, MRT68921 treatment of KL cells increased levels of H-2D but not H-2K (Extended Data Fig. 5c). Moreover, PSMB8 activity was increased by Ulk1 inhibition, as demonstrated by cleavage of Ac-ANW substrate (Fig. 4a, 4b, Extended Data Fig. 4c), providing evidence that targeting autophagy restores antigen presentation in LKB1 mutant cancers.
Figure 4|. ULK1 as therapeutic target for LKB1 mutant tumors through inhibition autophagic flux.
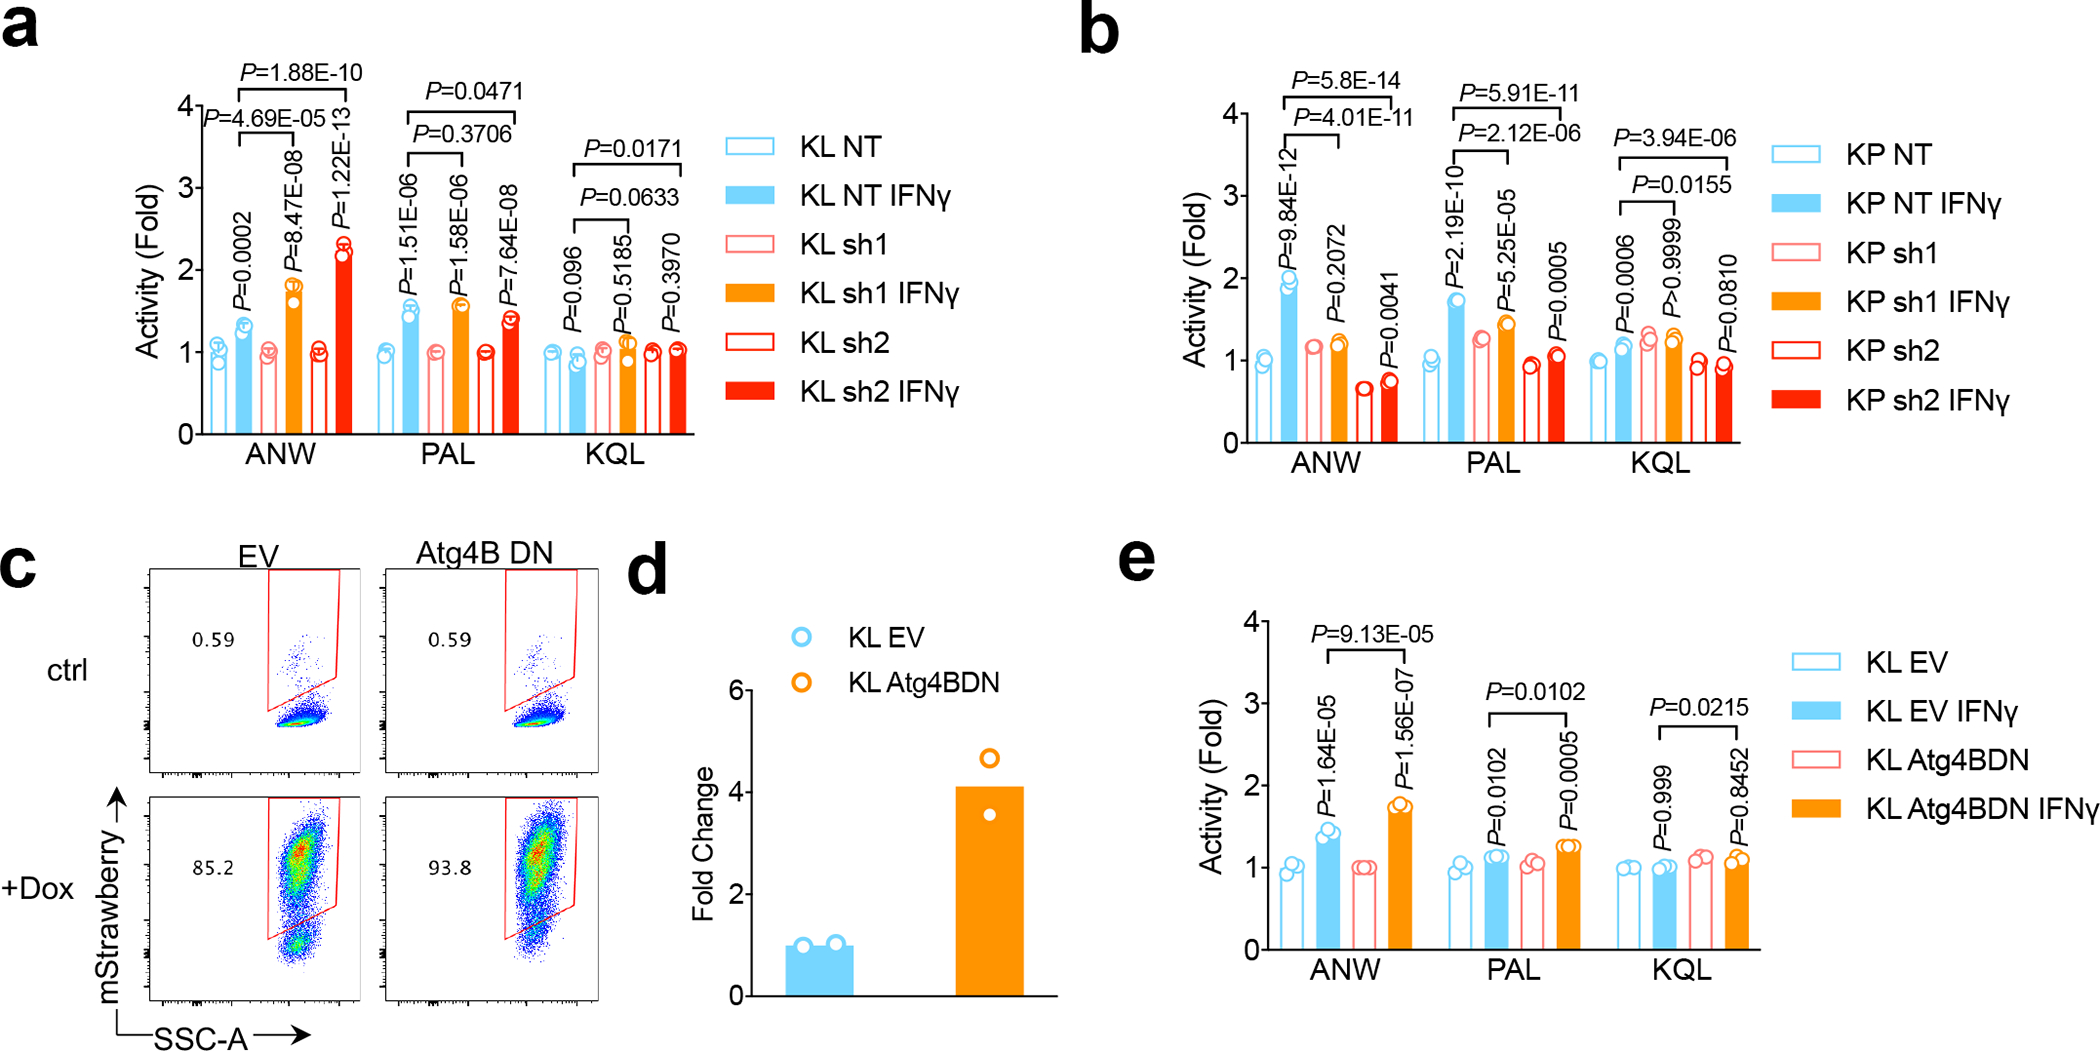
a,b, KL Ulk1 shRNA cell lines (a) and KP Ulk1 shRNA cell lines (b) were stimulated with IFN γ (10ng/ml) for 24 hrs before the measurement of immunoproteasome activities showed as fold change of activities compared with untreated control. n=3 independent experiments each group. (mean±sd, unpaired t test, two-tailed). Samples were either compared with none treated matching cells, or compared with control KL NT shRNA cell line after IFNγ stimulation as depicted. c. FACS analysis of mStrawberry signal upon doxycycline treatment in KL-Atg4BDN cells generated. Data representative of 3 independent experiments. d. Real-time PCR showing RNA level of Atga4B. n=2 independent experiments each group. e. Immunoproteasome activity for KL stable cell lines with mStrawberry-Atg4BC74A overexpression (Atg4BDN). n=3 independent cell cultures for each treatment group. Data shown representative one of two independent experiments. (mean±sd, multiple two-sided unpaired t test, two-stage step-up method of Benjamini, Krieger and Yekutieli, statistics presented on top of each column is compared between IFNγ treatment with vehicle group of each cell line, and pairwise comparisons between EV groups and Atg4BDN groups after IFNγ treatment are shown on top of columns).
The block in autophagy caused by MRT68921 has been reported to involve targeting of ULK1 specifically, and not ULK238. Using a tandem fluorescent reporter of autophagic flux (GFP-RFP-LC3)39 (Extended Data Figs. 6a, 6b), we confirmed that either shRNA-mediated knockdown of Ulk1 or MRT68921 treatment reduced autophagic flux in KL cells (Extended Data Figs. 6b–6d). MRT68921 can also target TBK138, which has been implicated in LKB1-mediated immune suppression through the TBK1/STING pathway40. However, we found that MRT68921 treatment increased TBK1 activity, as reflected by pTBK1 levels, in LKB1 isogenic lines of human NSCLC, probably due to the immune stimulating effects of ULK1 inhibition (Extended Data Fig. 6e). Furthermore, inhibition key autophagy regulators downstream of ULK1—including Atg7, Atg13 and Atg4—caused similar effects of increases in antigen processing via enhanced immunoproteasome activity (Fig. 4c–4e, Extended Data Fig. 6f–6i).
ULK1 inhibition restores antitumor immunity in KL
Following our in vitro observations that KL cells are sensitive to ULK1 inhibition, and that targeting ULK1 restores antigen presentation with increased immunoproteasome activity, we sought to examine whether these effects translate to differential immune responses in vivo in LKB1 mutant and LKB1 wildtype cancer models. We confirmed that MRT68921 treatment blocked autophagic flux in KL lung tumors (Fig. 5a, 5b, Extended Data Fig. 7a, 7b). Importantly, this led to increases in immunoproteasome activity (Fig. 5c, 5d, 5e, Extended Data Fig. 7c). MRT68921 treatment did not result in major toxicity (Extended Data Figs. 7d), and increased infiltration of both CD4+ and CD8+ T cells among total CD45+ immune cells in the tumor-bearing lungs (Fig. 5f, 5g, Extended Data Figs. 8a, 8b, 8c). MRT68921 treatment alone did not result in an anti-tumor effect (Fig. 6a, Extended Data Figs. 7e). Anti-PD1 antibody mono-therapy had modest and inconsistent tumor responses. Conversely, combination MRT68921 treatment enhanced the efficacy of anti-PD1 therapy, with evident tumor regression in 8/14 tumors (Fig. 6a, Extended Data Fig. 7e). We observed similar increased immunoproteasome activity in KL tumors treated with another autophagy inhibitor chloroquine (CQ) (Fig. 5e). By contrast, KP tumors did not respond to either MRT68921 or PD1 treatment alone or in combination (Extended Data Fig. 7f). Neutralizing antibodies against CD8+ T cells blocked the effects of MRT68921 plus PD1 combinational treatment on anti-tumor immunity in LKB1 mutant tumors (Fig. 6b), confirming that the efficacy of the combination involves CD8+ cytotoxic T cells activation rather than tumor intrinsic effects. Combination treatment resulted in an increased CD44+CD62L- population within tumor infiltrating CD8+ T cells (Fig. 6c, upper panels). The IL-7Rα subunit CD127 was reduced, while CD69, CCR7 and 2B4 levels did not change upon treatment (Fig 6c, lower panels, Extended Data Fig. 8d). CD127 is reported to be critical for CD8+ T cell homeostasis, and TCR engagement downregulates CD127 expression41. We also observed enhanced cytotoxicity, with increased levels of both CD107a and granzyme B after combination treatment group (Fig. 6d) as well as an increased ratio of CD8/Treg cells (Extended Data Fig. 8c). These data highlight increased CD8+ cytotoxicity upon engagement of TCR with tumor-derived neoantigens, with suppressed cell death through CD127 inhibition.
Figure 5|. Targeting ULK1 increases immunoproteasome activity and T cell activity in vivo.
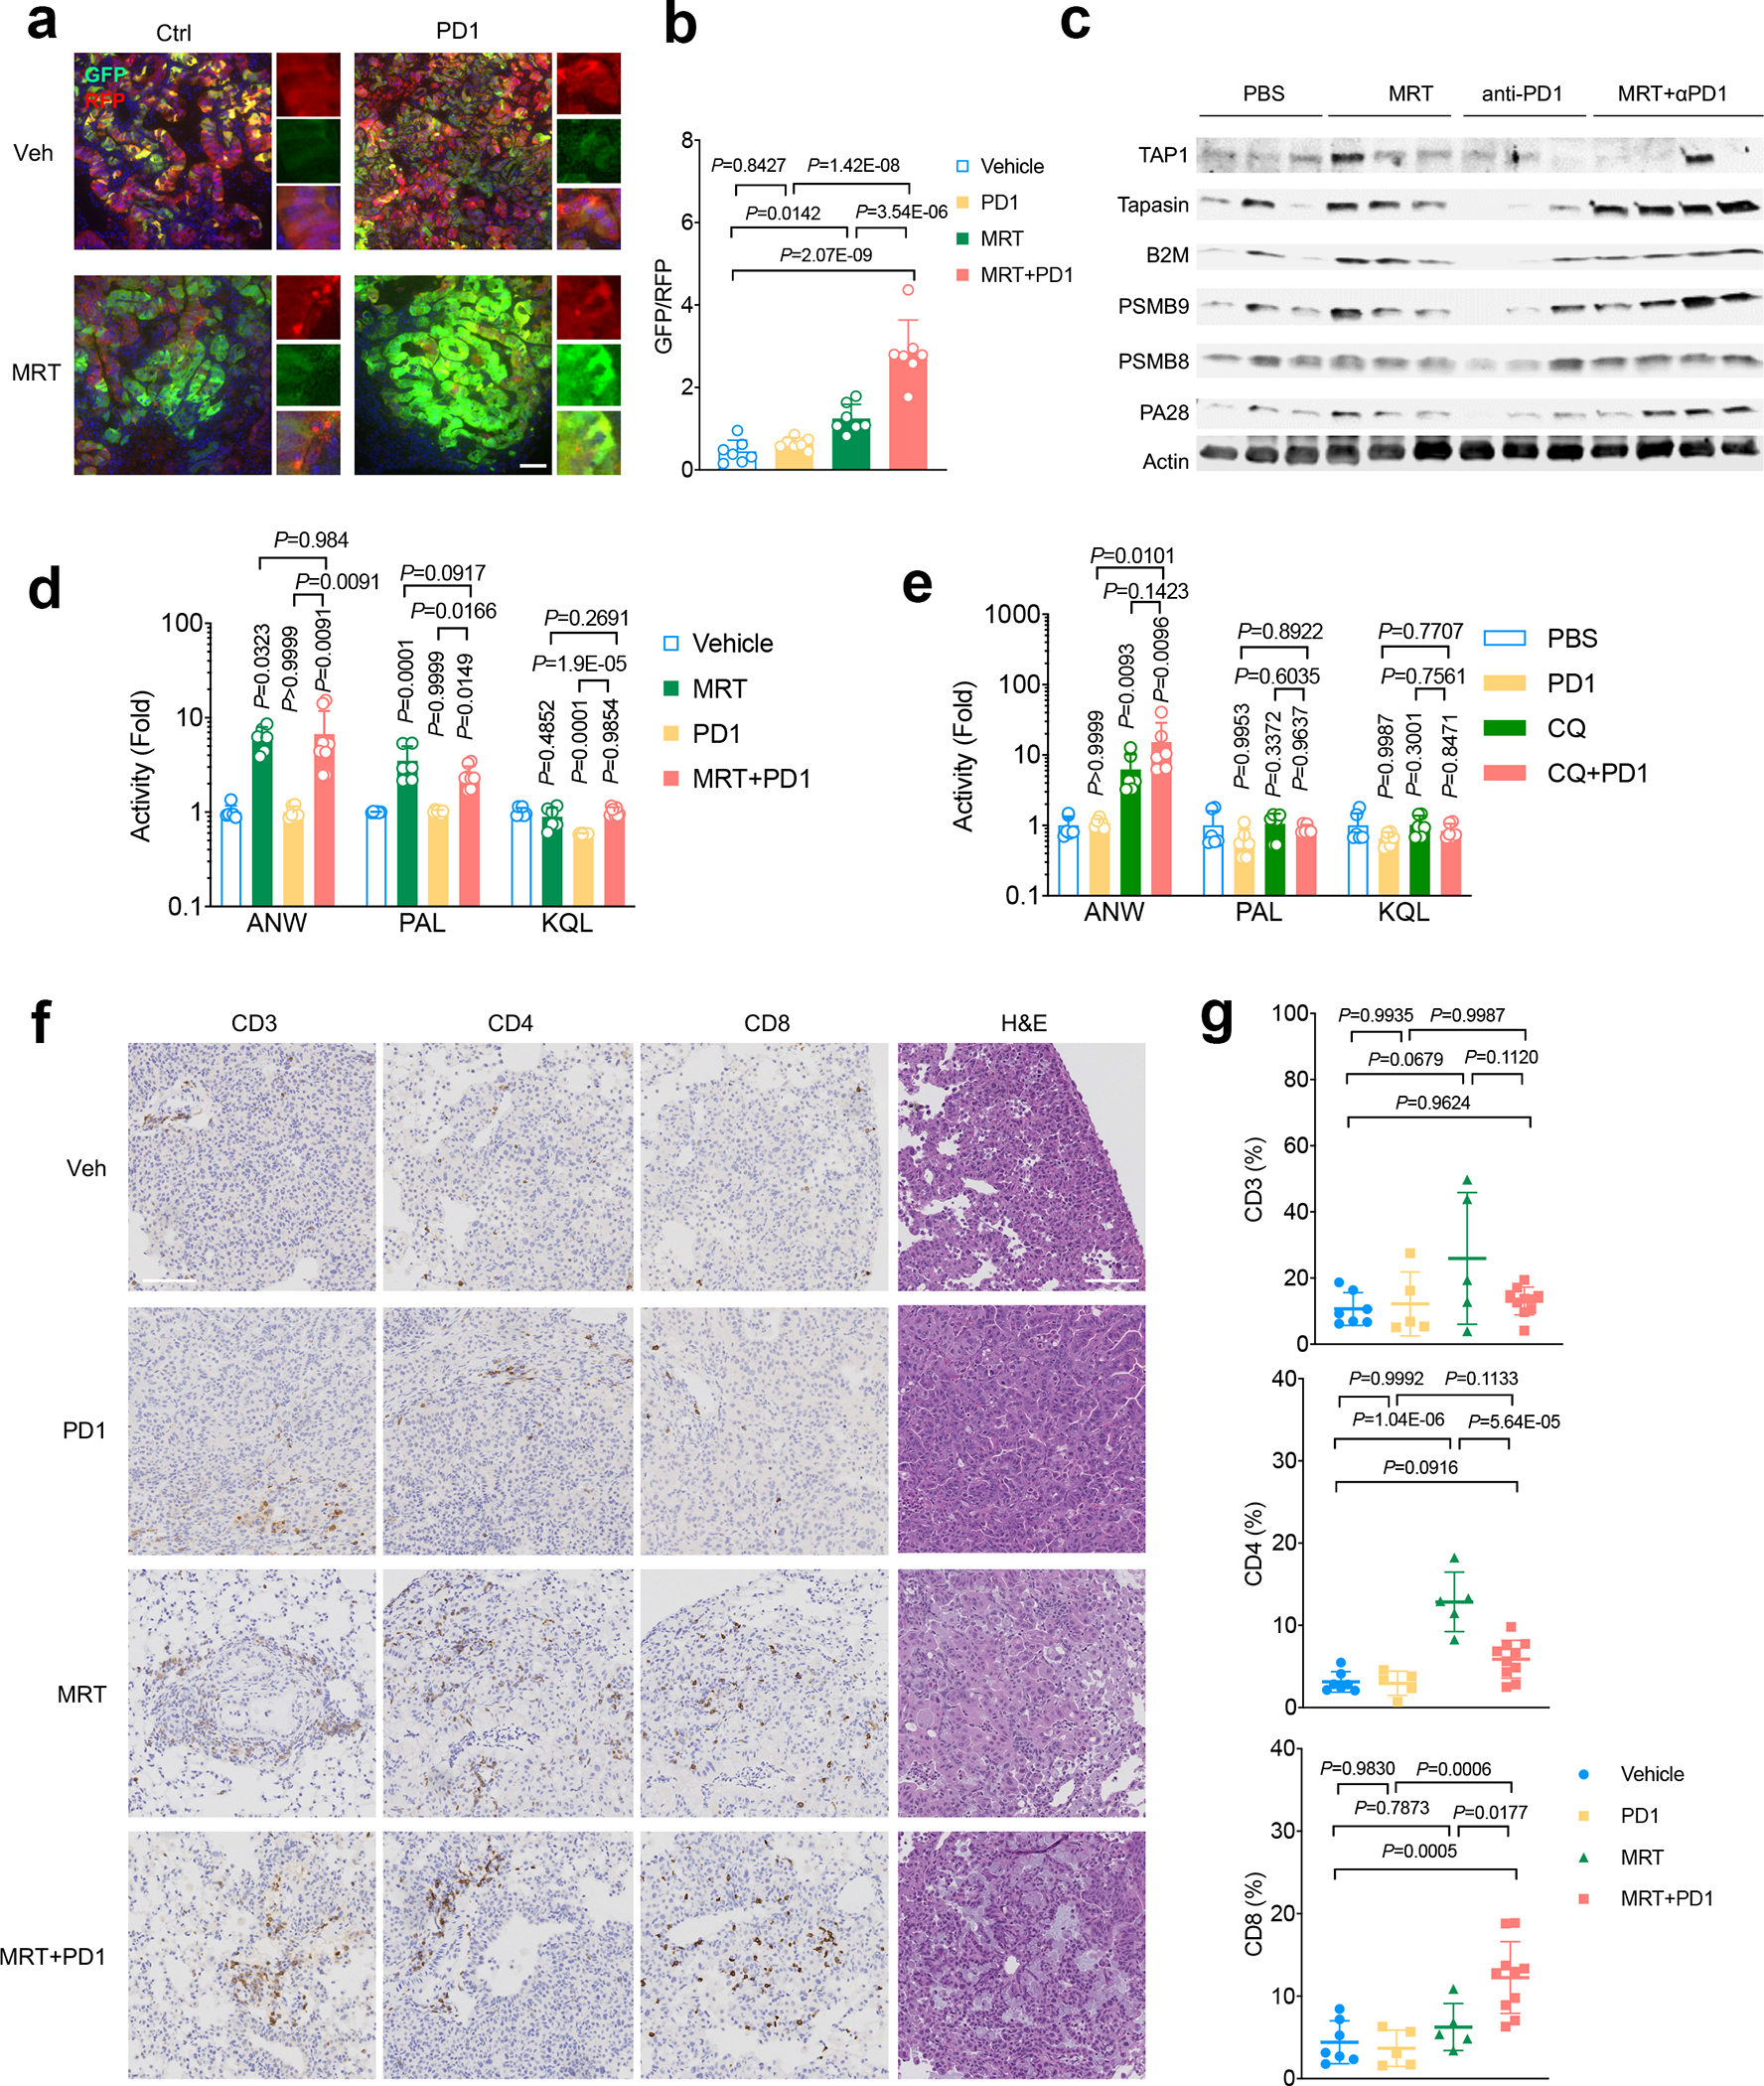
a. Representative immunofluorescent (IF) image lung tumors of KL cells transduced with autophagy flux reporter GFP-LC3-RFP (GLR) after MRT68921+PD1 treatment. Data representative of 3 independent experiments. Scale bar, 50 μm. b. Quantification of autophagic flux inhibition shown as GFP/RFP ratio for each IF image after MRT68921 treatment. n=7 fields from independent tumors each group. Data represent one of three independent experiments. (data are presented as mean±sd, one-way ANOVA). c. Western blot shows antigen presentation related proteins, including PSMB9 and PSMB8, TAP1, Tapasin and B2M expression levels from KL lung nodules after MRT+PD1 treatment. Each lane represents one lung nodule sample from individual mice of indicated groups. Blots are cropped and uncropped images can be found in Source Data. d. Immunoproteasome activities of lung nodules from KL tumors after the treatment with MRT+PD1. Showed as fold change of activities compared with vehicle control group. Vehicle, MRT, PD1, n=6 each group; MRT+PD1 n=8 individual tumor nodules from each group. (mean±sd, one-way ANOVA). e. Immunoproteasome activities of lung nodules from KL allograft tumors nodules after the treatment with CQ+PD1. Showed as fold change of activities compared with vehicle control group. n=6 individual tumor nodules from each group. (mean±sd, one-way ANOVA). f. Representative immunohistochemistry (IHC) images of KL lung tumors treated with indicated treatment before staining with CD3+, CD4+ and CD8+ T lymphocytes infiltration in the lung. Data representative of 3 independent experiments. Scale bar, 100µm. g. Quantification of immune infiltrates shown in panel f. Veh n=7, PD1 n=5, MRT n=5, MRT+PD1 n=10 fields from independent tumors. Data representative of 2 independent experiments. (mean±sd, one-way ANOVA).
Figure 6|. ULK1 inhibition restores antitumor immunity in LKB1 mutant lung cancers.
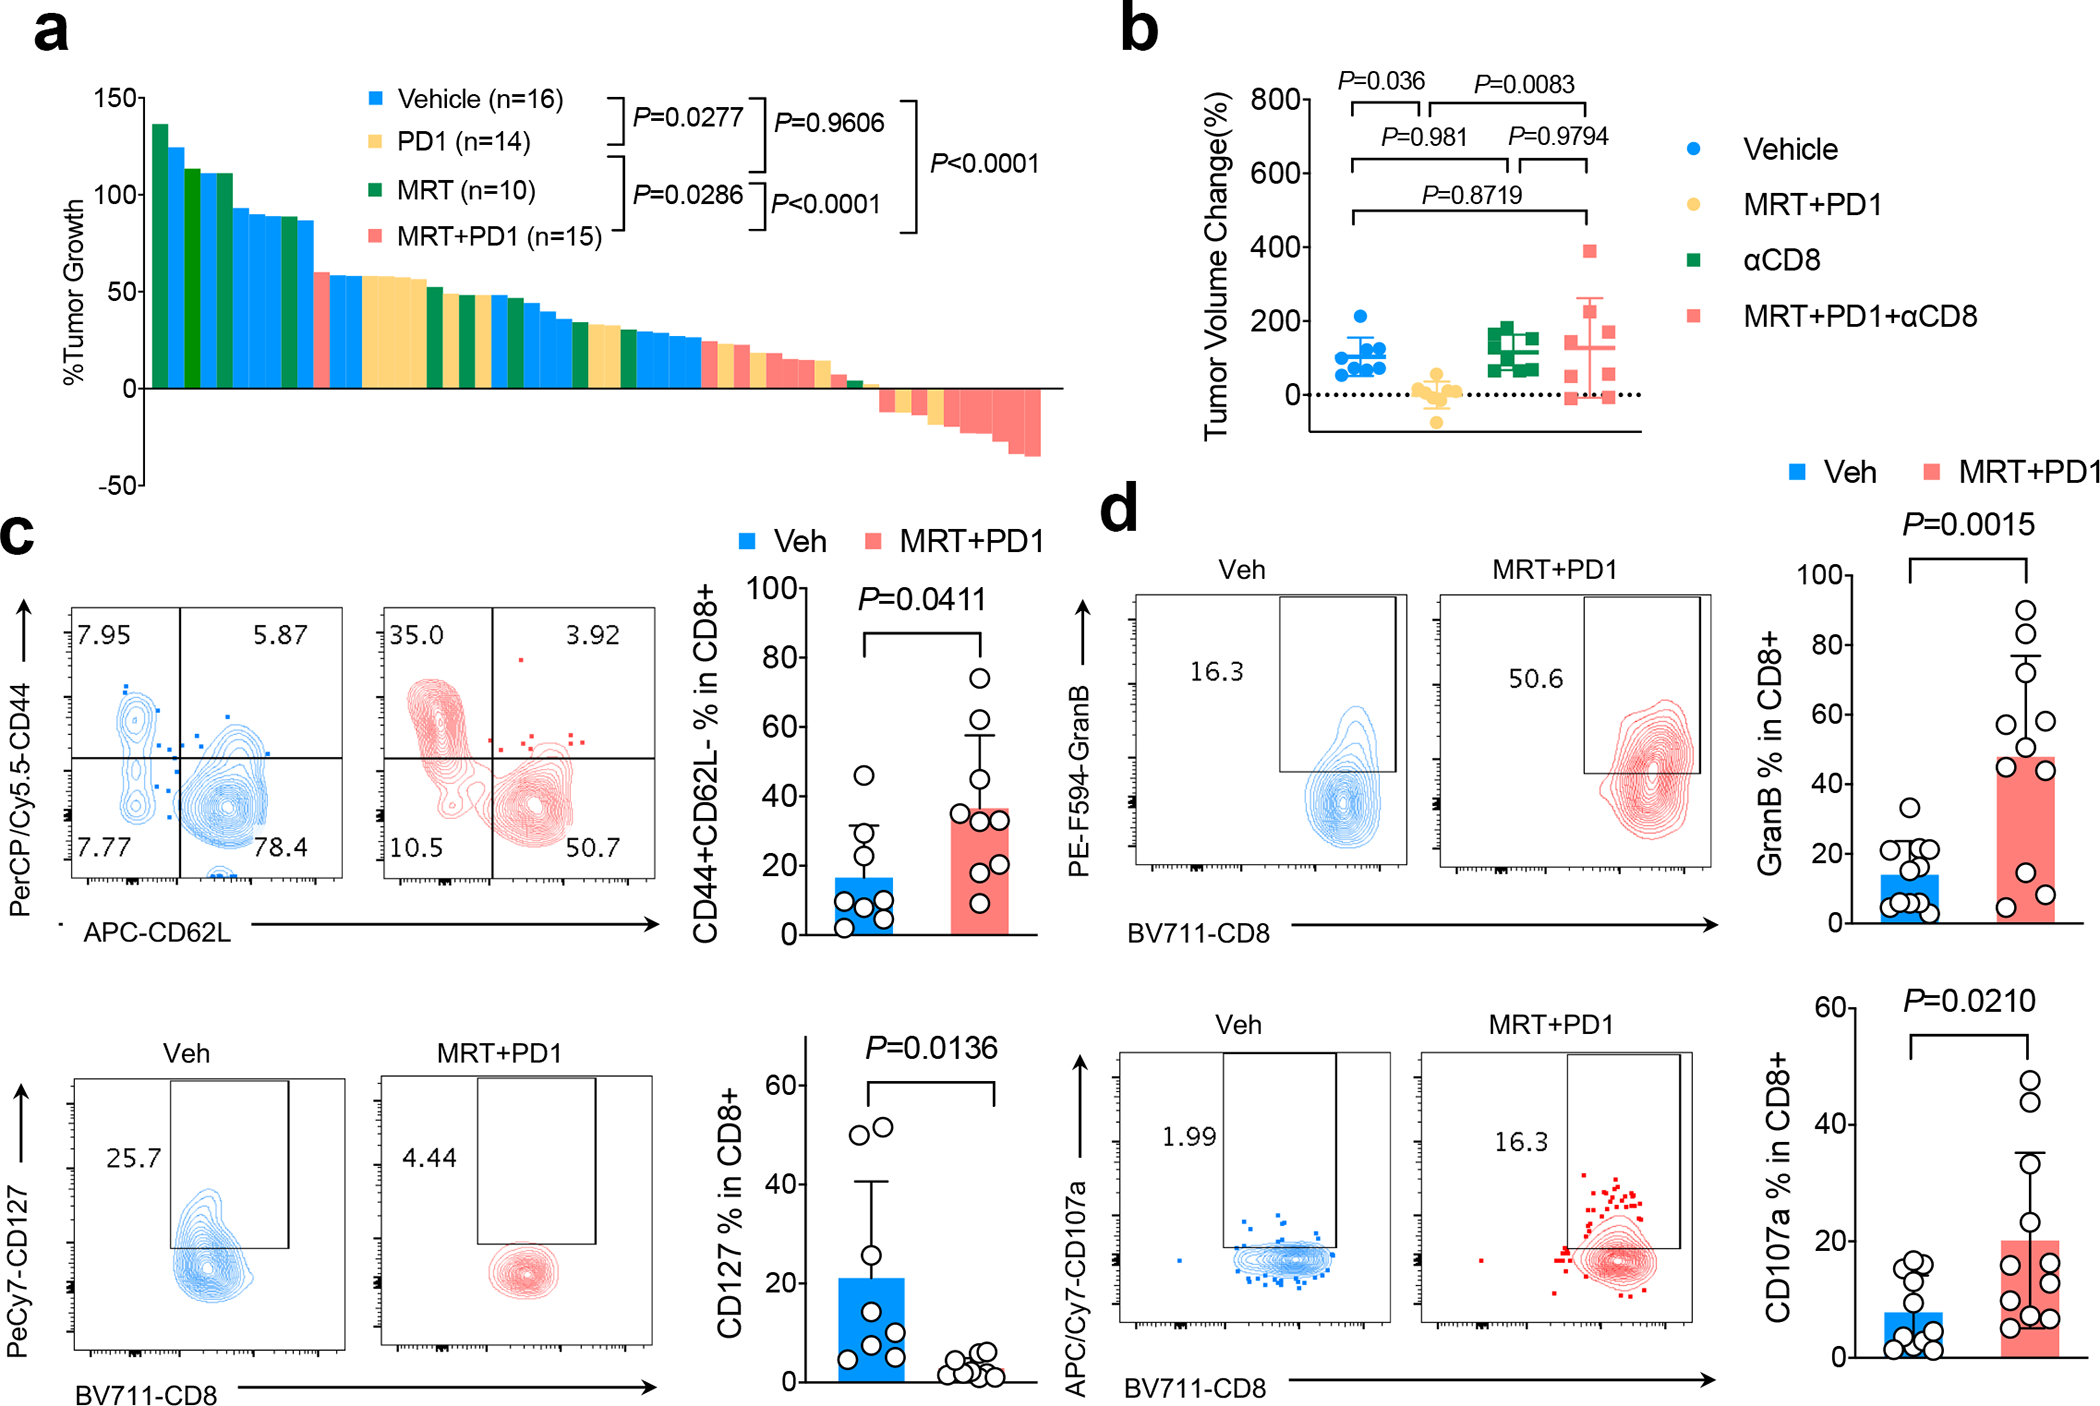
a. Waterfall plot showing KL GEMM tumor volume changes 1 week after the drug treatment as indicated. Shown is tumor volume percentage changes compared with week 0 tumor volume prior to the treatment. Each column represents one mouse. (one-way ANOVA, Dunnett’s multiple comparisons test, two-sided). b. Tumor volume change of KL allograft tumor 1 week after CD8+ neutralizing antibody with or without MRT68921+PD1 combinational treatment. n=8 independent mice each group. (mean±sd, one-way ANOVA, Dunnett’s multiple comparisons test, two-sided) c. FACS analysis of CD44+CD62L- (upper panel) and CD127+ cells among total tumor infiltrating CD8+ T cells in KL tumor after the treatment of drugs indicated. Contour plots representative of 3 independent experiments. Veh n=8, MRT+PD1 n=9 independent tumors. (mean±sd, two-tailed t test, unpaired) d. Granzyme B (GranB) and CD107a levels within CD8+ T cells after MRT68921+PD1 treatment. Left panels, representative flow panels; right panels, quantification of GranB and CD107a levels in CD8+ T cells. Contour plots representative of 3 independent experiments. Veh n=11, MRT+PD1 n=11 independent tumors. (mean±sd, two-tailed t test, unpaired).
In summary, we discovered that LKB1 loss of function leads to DNA DSB repair deficiency with suppressed HR repair, which results in increased TMB in cancer patients. However, despite high TMB and increased number of neoantigens, patients with LKB1 mutations respond poorly to anti-PD1 treatment. Our pre-clinical evidence indicates that LKB1 loss leads to restricted antigen presentation to MHC complexes due to increased autophagic flux and suppressed proteasomal degradation of antigenic peptides. Further studies will be needed to determine whether the DNA repair defects and reduced antigen presentation are functionally related or represent separate functions of LKB1. In this regard, LKB1 is the upstream kinase activating the 14 members of the AMPK-SIK-MARK family, which connect LKB1 to pleiotropic functions, including regulation of cell metabolism and cell polarity42. These functions generally favor restoration of cellular homeostasis in response to changes in nutrient cues and oppose growth. Overall, the integration of these activities, as well as DNA repair and immune regulation reported in the present study, is in keeping with the evolutionarily conserved roles of LKB1 in mediating nutrient stress responses. Importantly, inhibiting autophagy by targeting ULK1 or downstream key regulators restores suppression of antigen presentation through enhancing immunoproteasome activity, leading to increased T cell infiltration and enhanced response to anti-PD1 treatment through the expansion of CD44+CD62L- effector CD8+ T cells in LKB1 mutant tumors. Potential dual effects of ULK inhibitors on both cancer cells and immune populations remain to be explored. Our findings provide the preclinical rationale for combining autophagy inhibition to enhance tumor neoantigen presentation and anti-PD1 therapy in high-TMB tumors with inactivating mutations in LKB1.
Methods
RNA sequencing and whole exome sequencing
For KP and KL cell lines and GEMMs lung nodules, RNA was extracted using RNeasy plus mini kit (Qiagen). RNA-Seq libraries were prepared using the Illumina TruSeq Stranded mRNA Library Prep (for 96 Samples, catalog number 20020595), starting from 500 ng of total RNA, with 10 cycles of PCR amplification. Total genomic DNA were extracted using DNeasy Blood & Tissue Kit (Qiagen) according to manufacture manual. Mouse exome libraries were prepared using Roche SeqCap EZ mouse exome kit (54 Mb, catalog number L2RD02), starting with 250 ng of genomic DNA, following the manufacturer’s protocol (Nimblegen SeqCap EZ Library SR, version 5.1). All libraries (exomes and RNASeq) were uniquely barcoded with IDT 8 bp indices, pooled and sequenced on a NovaSeq 6000, on an S4 300 flow cell, as paired end 150 reads or an Illumina HiSeq2500, producing 2×50bp paired-end reads with multiplexing.
Whole exome and RNA-seq small nucleotide variants analysis
Sequencing results were demultiplexed and converted to FASTQ format using Illumina bcl2fastq software (v2.17). The reads were adapter and quality trimmed with Trimmomatic (v0.33)43.
For whole exome samples, the sequencing reads were aligned to the mouse reference genome (build mm10/GRCm38) using the Burrows-Wheeler Aligner (version 0.7.17) with the BWA-MEM algorithm44. Low confidence mappings (mapping quality <10) and duplicate reads were removed using Sambamba45. Further local indel realignment and base-quality score recalibration was performed using the Genome Analysis Toolkit (GATK v3.8)46.
For RNA-seq samples, the sequencing reads were aligned to the mouse genome (build mm10/GRCm38) using the splice-aware STAR aligner (v2.5.3)47 discarding multi-mapped reads and MAPQ set to 60 for uniquely mapping reads. Duplicate reads were removed using Sambamba (version 0.6.7). GATK was used to split reads into exon segments and hard-clip any sequences overhanging into the intronic regions, followed by local indel realignment and base-quality score recalibration.
Single-nucleotide and small indel somatic variants were called with Mutect (v2.1)48 and Strelka (v2.9.2)49. Variants with at least 5 supporting reads and VAF>5% were retained. ANNOVAR50 was used to annotate variants with genomic context such as functional consequence on genes. MutationalPatterns (v1.4.3)51 R package was used to quantify the contribution of COSMIC mutational signatures.
Patients mutational burden analysis
STK11 somatic mutation status, tumor mutational burden, and smoking history was obtained for 1,497 lung cancer patients from the Memorial Sloan Kettering Cancer Center clinical sequencing cohort on 2018–12-10 as previously reported52. Log10-transformed TMB values were compared between STK11 mutant and wild-type tumors separately for either never smokers or current and former heavy smokers using an unpaired nonparametric Mann-Whitney test (two-tailed). Shapiro-Wilk normality test was performed to determine the normal distribution of each group (confidence level 95%).
Patients transcriptomic data and comparison groups
Lung adenocarcinoma (LUAD) mutation and transcriptomic data was procured from the publicly available Cancer Genome Atlas (TCGA) database53. From this data, we extracted all the samples which had a TP53 mutation and from this cohort we derived two groups: a) group with only TP53 mutations which we designated as KP (n=22) and b) group with co-occurring STK11/LKB1 mutation which we designated as KL (n=19). Silent mutations were not used for this grouping; the STK11 mutations fell into broad missense, nonsense, splice-site and frame shift deletion variant classifications.
RNAseq pathway analysis and gene set enrichment analysis (GSEA)
For the KL and KP cell-line and mouse nodule RNA-seq data, fastq files were aligned to the mouse mm10 reference genome using the STAR aligner algorithm47. Resulting BAM files were sorted and indexed using Samtools and quality control was performed using Picard (http://broadinstitute.github.io/picard/). Transcript read counts were determined was performed using Salmon54. Genes with no reads across any of the samples were removed. Salmon gene-level counts upper quartile normalized55. Genes were log2 transformed and filtered for 80% of expressed genes across all samples using Cluster 3.0 and zeros were preserved for signature analysis. Data was then median centered to establish the matrix in working form for statistical analyses.
We used gene set enrichment analysis (GSEA) (version 3.0)56 through the GenePattern platform57 with publicly available raw transcriptomic data matrix53. The data matrix was upper quartile normalized, log transformed, filtered for 80% of expressed genes and median centered like the cell-line and mouse nodule data.
Besides GSEA, we also performed Differential gene expression (DE) analysis using DESeq2 R package58 and using identified upregulated and downregulated, we interrogated and report their relevance in gene ontologies and pathways using the ToppGene Suite59. For the enrichment results, we performed 1000 permutations using the curated set 5 gene ontology (GO) list (c5.all.v6.2.symbols.gmt.), curated set 2 KEGG and REACTOME pathway lists (c2.cp.kegg.v6.2.symbols.gmt., c2.cp.reactome.v6.2.symbols.gmt.) and hallmark list (h.all.v6.2.symbols.gmt.).
Cell lines
For KL and KP Ulk1 shRNA stable cell line generation, lentiviral vector for Ulk1 shRNA (Sigma TRCN0000319764 and TRCN0000028768) or control pLKO.1 vector (Sigma Cat # SHC001) was employed. For the lentivirus production, HEK-293T cells were co-transfected with the three-vector system including pLKO.1-shRNA vector and packaging vectors psPAX2(Addgene #12260) and pMD2.G (Addgene #12259). Prior to infection, cell culture supernatant was passed through 0.45 μm syringe filter (Corning Cat #431220) and the filtered virus was added to KL cells in the presence of polybrene (10 μg/ml, Sigma Cat #TR-1003-G) and selected with Puromycin (Sigma Cat #P9620) 48 hrs post infection. And selected stable cell lines were validated by western blot and maintained in the cell culture media with 2 μg/ml Puromycin.
Generation of isogenic lines with empty vector (pBABE) (Addgene #1764), wild type LKB1 (pBABE-LKB1, Addgene #8592) and LKB1-KD (Addgene #8593) were performed similar as previously described60. Briefly, HEK-293T cells were transfected with the pBABE-LKB1, LKB1-KD or pBABE vectors, along with pCL-Eco (Addgene Plasmid #12371) and pCMV-VSV-G (Addgene #8454) packaging vectors.
For Atg knockdown cell lines generation, shRNA vectors were obtained from Sigma MISSION TRC shRNA library with clone ID as below: shAtg7#1 (mouse) TRCN0000305991, shAtg7#2(mouse) RCN0000375444, shAtg13#1 (mouse) TRCN0000277121, shAtg13#2 (mouse) TRCN0000176029, shGFP TRCN0000072186. GFP–LC3–RFP (Addgene, plasmid 117413), pINDUCER20-mStrawberry and pINDUCER20-mStrawberry-Atg4BC74A were gifts from Alec Kimmelman61. KL GFP shRNA, Atg7 shRNA, Atg13 shRNA and Atg4BC74A stable cell lines were generated using lentiviral packaging system described above.
DNA repair assays
To measure the repair of an I-SceI generated DSB by transient transfection, for either HR or NHEJ, the assay was performed as previously reported with modifications62. Indicated cells were transfected with 1 μg/ml of pRRL.SceI.BFP vector (Addgene #32628) along with either 1 μg/ml pDRGFP (Addgene #26475) for HR measurement or with 1μg/ml of pimEJ5GFP plasmid (Addgene #44026) for NHEJ measurement. Cells were collected 3 d after transfection, stained with zombie NIR fixable viability kit (Biolegend) and fixed with fixation/permeabilization solution (BD Biosciences) before FACS analysis on BD LSRfortessa X-20 flow cytometer (BD Biosciences). BFP positive zombie NIR negative viable cells were gated for Sce I positive cells. Within these BFP+NIR- cells, GFP positive cells percentage was quantified using flowjo software (BD v10.6.1). Each condition was done at least triplicates and repeated for three independent experiments.
Immunofluorescence microscopy
Cells were permeabilized with cold CSK buffer (10mM HEPES pH 7.4, 100mM NaCl, 300mM sucrose, 3mM MgCl2, 1mm EGTA) containing 0.5% Triton X-100, washed with PBS, and fixed with 4% paraformaldehyde (PFA, Electron Microscopy Sciences) prior to blocking. Cells were blocked with 3% BSA in PBS before incubation with indicated primary antibodies. Alexa Fluor 555 or Alexa Fluor 488-conjugated secondary antibodies (Life Technology Corporation) were added for 1 h (1:2000 dilution). Slides were mounted in ProlongGold with DAPI (Invitrogen). Imaging was performed using a DeltaVision Elite inverted microscope system (Applied Precision), using a x100/1.4NA Oil PSF Objective from Olympus. The system was equipped with a CoolSNAP HQ2 camera and SoftWorx imaging software version 5.0. Serial optical sections obtained 0.2-μm apart along the z-axis were processed using the SoftWorx deconvolution algorithm and projected into one picture using SoftWorx software (Applied Precision).
Immunoprecipitation and immunoblotting
HEK293T cells were transiently transfected using polyethylenimine. Where indicated, 48 h after transfection, HEK293T cells were incubated with NCS for 3 h before collection. Cell lysis was carried out with lysis buffer (50 mM Tris pH 8.0, 250 mM NaCl, 10% glycerol, 1 mM EDTA, 50 mM NaF, and 0.5% NP-40) supplemented with protease and phosphatase inhibitors. Where indicated, Benzonase (Sigma-Aldrich) was used at 1 U/μL. Lysates were then immunoprecipitated with anti-FLAG antibody conjugated to agarose. For chromatin fractionation cells were lysed followed by immunoblotting.
Immunoblotting
Each sample was solubilized with lysis buffer (50 mM Tris pH 7.4, 150 mM NaCl, 1 mM EDTA, 10% glycerol, 0.1% NP-40, protease inhibitors, and phosphatase inhibitors). Cell extracts were quantified with primary antibodies used are LC3B (Novus Biologicals cat# NB100–2220), p63 (MBL cat# PM045), LKB1 (Cell Signaling cat# 3047), and β-actin (Sigma Cat# A5441), RAD51 (GeneTex cat# GTX70230), pH2AX (Cell Signaling cat# 9718S), Histone H3 (Abcam cat# ab1791), PARP1 (Cell Signaling cat# 9542S), TAP1(Cell Signalling cat# 12341S), Tapasin (Biolegend cat# 696702), B2M (R&D Systems MAB8325), PSMB9/LMP2 (Abcam cat# ab3328), PSMB8/LMP7 (cell Signalling cat# 13635S), PA28 (Cell Signalling cat#2409S), PSMB5 (Cell Signaling cat# 12919S), PSMB6 (Cell signalling cat# 13267S), Atg7 (Cell Signaling cat# 8558S), Atg13 (Cell Signaling cat# 13273S), pTBK1 (Cell Signaling 5483S), TBK1 (Cell Signaling 3504S), STING (Cell Signaling 13647S). Secondary antibodies were either coupled with horseradish peroxidase (HRP) (Amersham-GE) and visualized by enhanced chemiluminescence substrate (Thermo Fisher Scientific) and signal was acquired using ImageQuant LAS 400 (GE). Or secondary antibody of IRDye 680RD Goat anti-Rat (Li-COR cat# 926–68076), golden Syrian & armenian hamster IgG DyLight 800 (Rockland cat# 620–145-440), IRDye 680RD donkey anti-Mouse IgG (Li-COR cat# 925–68072) and IRDye 800CW donkey anti-rabbit IgG (Li-COR cat# 925–32212) were used and the fluorescent signal on the membrane were imaged on Odyssey classic infrared imaging system (Li-COR) using Image Studio Lite (V 5.2). The results were further analysed using imageJ fuji (1.51s).
Real-Time Quantitative PCR (qPCR)
Cell line mRNA was isolated using the RNAeasy Mini Kit (Qiagen), quantified, and 2 μg of cDNA per sample was synthesized using the iScript cDNA Synthesis Kit (Bio-Rad). QPCR analysis was performed using 20 ng cDNA per well in technical triplicates with the PowerUp™ SYBR™ Green Master Mix (ThermoFisher) and analyzed on the Applied Biosystems StepOne Real-Time PCR using ΔΔCT quantification. (ThermoFisher). Primers for each gene is listed in the Supplementary Table 2.
Cell Lysate immunoproteasome activity assay
Cell from individual cell lines were plated overnight, and stimulated with IFNγ at indicated concentration for 24 h. The immunoproteasome activities of these cells were performed using Immunoproteasome Activity Fluorometric Assay Kit (UBPBio cat# J4170) according to the manual. Briefly, the Lysates were generated by washing cells with cold PBS and lysing the result cell pellets and lysates were obtained using ice cold cell lysis buffer according to manufactural manual. Total cell lysate proteins (5 μg) were diluted in 1x assay buffer. Activity assay was carried out over 1h following 2-fold sample dilution with 100μM Ac-ANW-AMC, Ac-KQL-AMC or Ac-PAL-AMC substrate at 37 °C. Activity measurements were performed on FlexStation 3 multi-mode microplate reader at λex=360 nm and λem=460 nm with reading interval 1 min using Softmax Pro software (v5.4.6.005). Each treatment condition was done in triplicates. Michaelis-Menten calculations were performed using a non-linear fit in Prism v.8.2.0 to determine Vmax.
Transmission Electron Microscopy
Cultured cells were treated with EBSS for 1hr before fixed in 0.1M sodium cacodylate buffer (pH 7.2) containing 2.5% glutaraldehyde and 2% paraformaldehyde for 2 hours, and then post-fixed with 1% osmium tetroxide and 1% potassium ferrocyanide for one hour at 40°C, and later block stained in 0.25% aqueous uranyl acetate, processed in a standard manner and embedded in EMbed 812 (Electron Microscopy Sciences, Hatfield, PA). Ultrathin sections (60 nm) were cut, mounted on copper grids and stained with uranyl acetate and lead citrate. Stained grids were examined under Philips CM-12 electron microscope and photographed with a Gatan (4k x 2.7k) digital camera.
Autophagy analysis
For investigation of autophagy flux, a tandem autophagy flux reporter plasmid comprising mCherry-EGFP-LC3B (Addgene #22418, gift from Jayanta Debnath) was used to generate the indicated cells which were treated with MRT followed by imaging the LC3 puncta using Leica DM6, and image acquisition was done using LAS X software (version 2.0.0.14332.2). For quantification of autophagic flux, tandem GFP-RFP-LC3 reporter construct ptfLC3 plasmid (Addgene #21074) was transfected into indicated. Cells were treated with either vehicle control or MRT68921 (MCE, Cat no. HY-100006A) for 24 h, followed by EBSS nutrient deprivation for 3 h, and collected for quantification of autophagic flux as determined by fluorescent signal of RFP:GFP ratio within live cells. Data were acquired by FACS using LSRFortessa X-20 (BD) and analyzed using flowjo software (BD v10.6.1).
For autophagy flux analysis using western blot, each group of cells were treated with Bafilomycin A1 (Cayman Chemical Company, Cat# 11038) and/or MRT68921 with EBSS (Thermo Fisher Scientific, Cat# 24010043) for 1 hour. Cells were collected and protein extractions were quantified for immunoblotting with indicated antibodies.
Animal studies
All animal studies were reviewed and approved by the Institutional Animal Care and Use Committee (IACUC) at the New York University School of Medicine (NYUSoM). The genetically engineered mouse model (GEMM) harboring a conditional activating mutation of endogenous Kras (KrasLSL-G12D/+) crossed with Lkb1 or p53 conditional knockout (Lkb1fl/fl or Trp53fl/fl) has been previously described52. All the mice are crossed and confirmed with C57BL/6 genetic background by SNP analysis, 99.59% for KP (KrasG12DTrp53fl/fl), 94.46% for KL (KrasG12DLkb1fl/fl). CRE recombinase was induced through intranasal inhalation of 1×10⁷ p.f.u. adeno-Cre (University of Iowa adenoviral core). The induced mice were evaluated by MRI imaging to quantify the lung tumor burden, and KP and KL lung tumor nodules were obtained and tumor cell lines were generated from these nodules ex vivo. Briefly, lung tumors were harvested and washed in 1×PBS for 2 times, and then the tumors were cut into small pieces use scissor. The shredded tissue were cultured in the incubator at 37 °C (with 5% CO2). Change fresh medium every other day. Culture the cells for at least 5 passages to establish the stable cell lines. In this study, 5 KL cell lines generated from different KL mice were used. Generated KL cells were injected into female B6(Cg)-Tyrc−2J/J (B6-albino) mice via tail vein injection at 1×10⁶/mice. Both KL GEMMs and KL allografts lung tumors development were examined by MRI scan by 7-T Bruker Biospec 70/30 MRI System and the images were acquired using ParaVision software (version 6). Mice lung tumors burden were quantified by MRI imaging before and after the drug treatment. MRT68921 (MedChemExpress, Cat no. HY-100006A) or PBS vehicle control was administered as 15mg/kg through I.P. injection daily, PD-1 antibody PD1 (clone 29F.1A12) was administered three times a week at 200 μg/mouse through I.P. injection. Chloroquine diphosphate (Sigma, Cat no. C6628–25G) was administered as 60mg/kg through I.P. injection daily alone or in combination with anti-PD1 antibody. For CD8 depletion assay, anti-CD8 (clone 2.43, Bioxcell Cat no. BP0061) antibody were injected 400 μg/mouse through I.P. injection twice per week 3 days prior to MRT68921 plus PD-1 antibody treatment starts.
Cell isolation for immune analysis
Mouse lung with tumors were collected after transcardially perfused with ice cold 1X PBS, followed by mechanical disruption with scissors. The minced tissues were incubated with lysis buffer of HBSS (ThermoFisher Scientific Cat # 14025092) with collagenase D (400 U/ml, Sigma Cat # 11088866001) and DNase I (1 mg/ml, Sigma Cat # 10104159001) at 37°C for 30 min. The digested tissue was separated through 70μm cell strainer to obtain single cell suspension. Cells were spun down at 1500x rpm for 5 min at 4 °C (Eppendorf centrifuge 5810R). Pellets were lysed with 1x RBC lysis buffer (Biolegend cat # 420301) and cells were further processed for downstream applications.
Antibodies for flow cytometric analysis
For mouse studies, the following antibodies were purchased from Biolegend: CD45 (clone 30-F11), CD4 (clone RM4–5), CD8 (clone 53–6.7), CD3 (clone 17A2), PD-1 (clone 29F.1A12), CD69 (clone H1.2F3), CCR7 (clone 4B12), CD244/2B4 (clone m2B4), CD44 (clone IM7), CD62L (clone MEL-14), CD127 (clone A7R34), CD107a (clone 1D4B), MHCI (clone M1/42). From BD Biosciences: Granzyme B (GB1). From eBiosciences: Foxp3 (clone FJK-16s), CTLA-4 (clone UC10–4B9). Cells were stained and analyzed using BD fortessa with DACS Diva (8.0.1) and flowjo software (v10.6.1).
Cell Growth Assay
Adherent syngeneic KL and KP cells were plated in 96-well plates at density of 1,000 cells/well overnight and challenged with 1 nM-20 μM of each compound as indicated for 72 hours in the presence of 10% FBS and constant 0.2% DMSO in RMPI-1640. Cell proliferation was measured by CCK-8 kit (Enzo Lifesciences, Cat#ALX-850–039-KI02) per manufacturer’s protocol on FlexStation 3 multi-mode microplate reader using Softmax Pro software (v5.4.6.005). The data calculations were carried out as the percentage cell growth over the DMSO controls and IC50 was acquired using CalcuSyn (version 2). The normalized data was then log10 transformed and plotted in GraphPad Prism 8.
Statistics & Reproducibility
No statistical methods were used to predetermine sample size. The group size of mice and samples were chosen based on our previous publications that we used to generate statistically significant results60. The experiments for the animal study are not randomized and the investigators are not blinded during the experiment and outcome assessment. Randomization is not relevant to other cell-based study since they require different treatment conditions. For immunofluorescence microscopy, one sample (KL+LKB1) was excluded during foci quantification due to cell contamination (Fig. 2f). For comparison of normal distribution samples, two-tailed t test was used for statistical analysis using Prism software. For multiple comparison, one way ANOVA or multiple t test was used as specified for each experiment in the figure legend with P values calculated in Prism. For patient samples that are not normal distribution, Shapiro-Wilk test was used for normality test and Mannn-Whitney test was used for statistical analysis among different groups.
Reporting summary
Further information on research design is available in Nature Research Reporting Summary linked to this paper.
Extended Data
Extended Data Fig. 1|. Mutational burden and signature analysis for LKB1 mutant tumors.
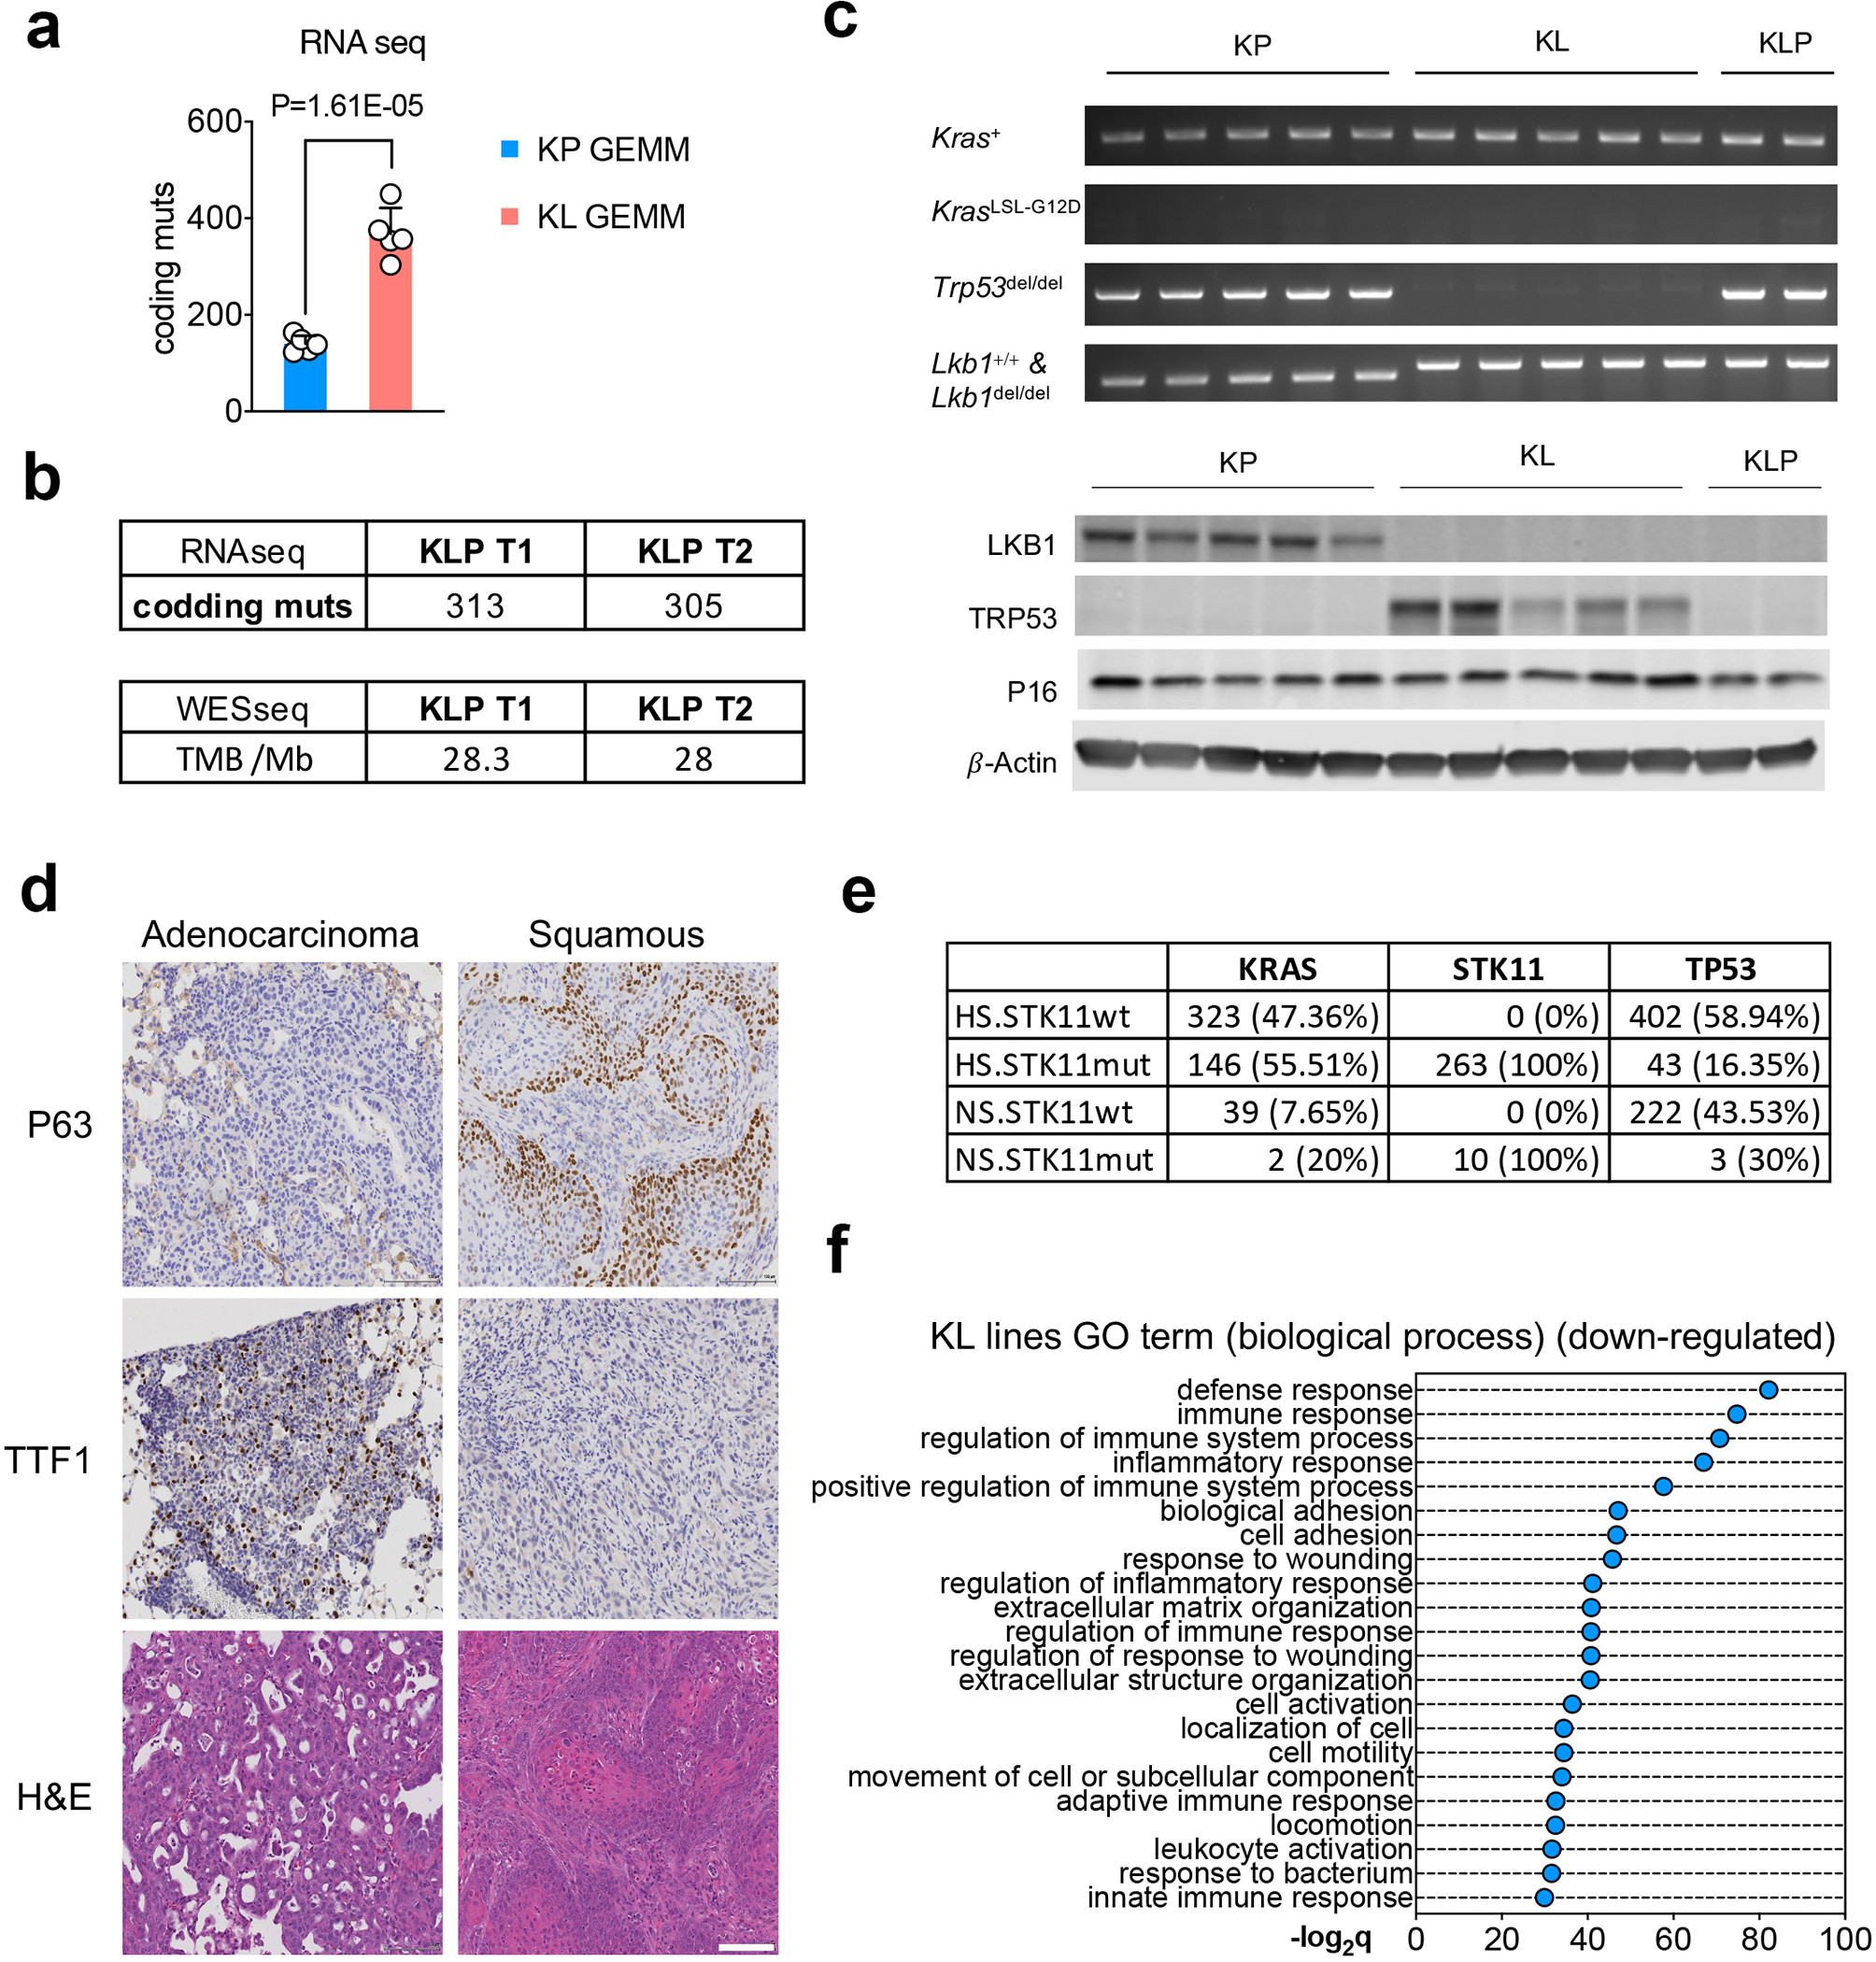
a. Comparison of tumor mutational burden (TMB) of nonsynonymous mutation using freshly isolate NSCLC GEMMs lung nodules from KrasG12DLkb1fl/fl (KL) or KrasG12DTrp53fl/fl (KP) from RNA sequencing. n=5 lung nodules each group. (unpaired t test, two sided, FDR<0.05) b. TMB analysis of cell lines derived from KrasG12DLkb1fl/flTrp53fl/fl (KLP) NSCLC GEMM nodules using RNA sequencing (Upper table) or whole exome sequencing (WES) (lower table) for each cell line. c. Validation of KP, KL, KLP lines used. Upper panel, PCR result of indicated primers for each cell line. Lower panel, western blot result of LKB1, TRP53 and P16 protein levels of each cell lines. Blots are cropped and that uncropped images can be found in Source Data. Data represents one of three independent experiments. d. Representative IHC images of KL allograft lung tumors showing adenocarcinoma (left panels) or squamous tumor (right panels). Data represents one of three independent experiments. Scale bar, 100μm. e. Co-mutational analysis of NSCLC patients analyzed in fig. 1b, including KRAS, STK11 and TP53 as total patient number and percentage within each group. f. Top suppressed biological process pathways from Kras/Lkb1 comparing with Kras/Trp53 mutant mouse cell lines. x-axis, -log2q value (Bonferroni) between the two groups. n=5 cell lines each group.
Extended Data Fig. 2|. Mutational signature analysis and gene set enrichment analysis (GSEA) from KL and KP tumors.
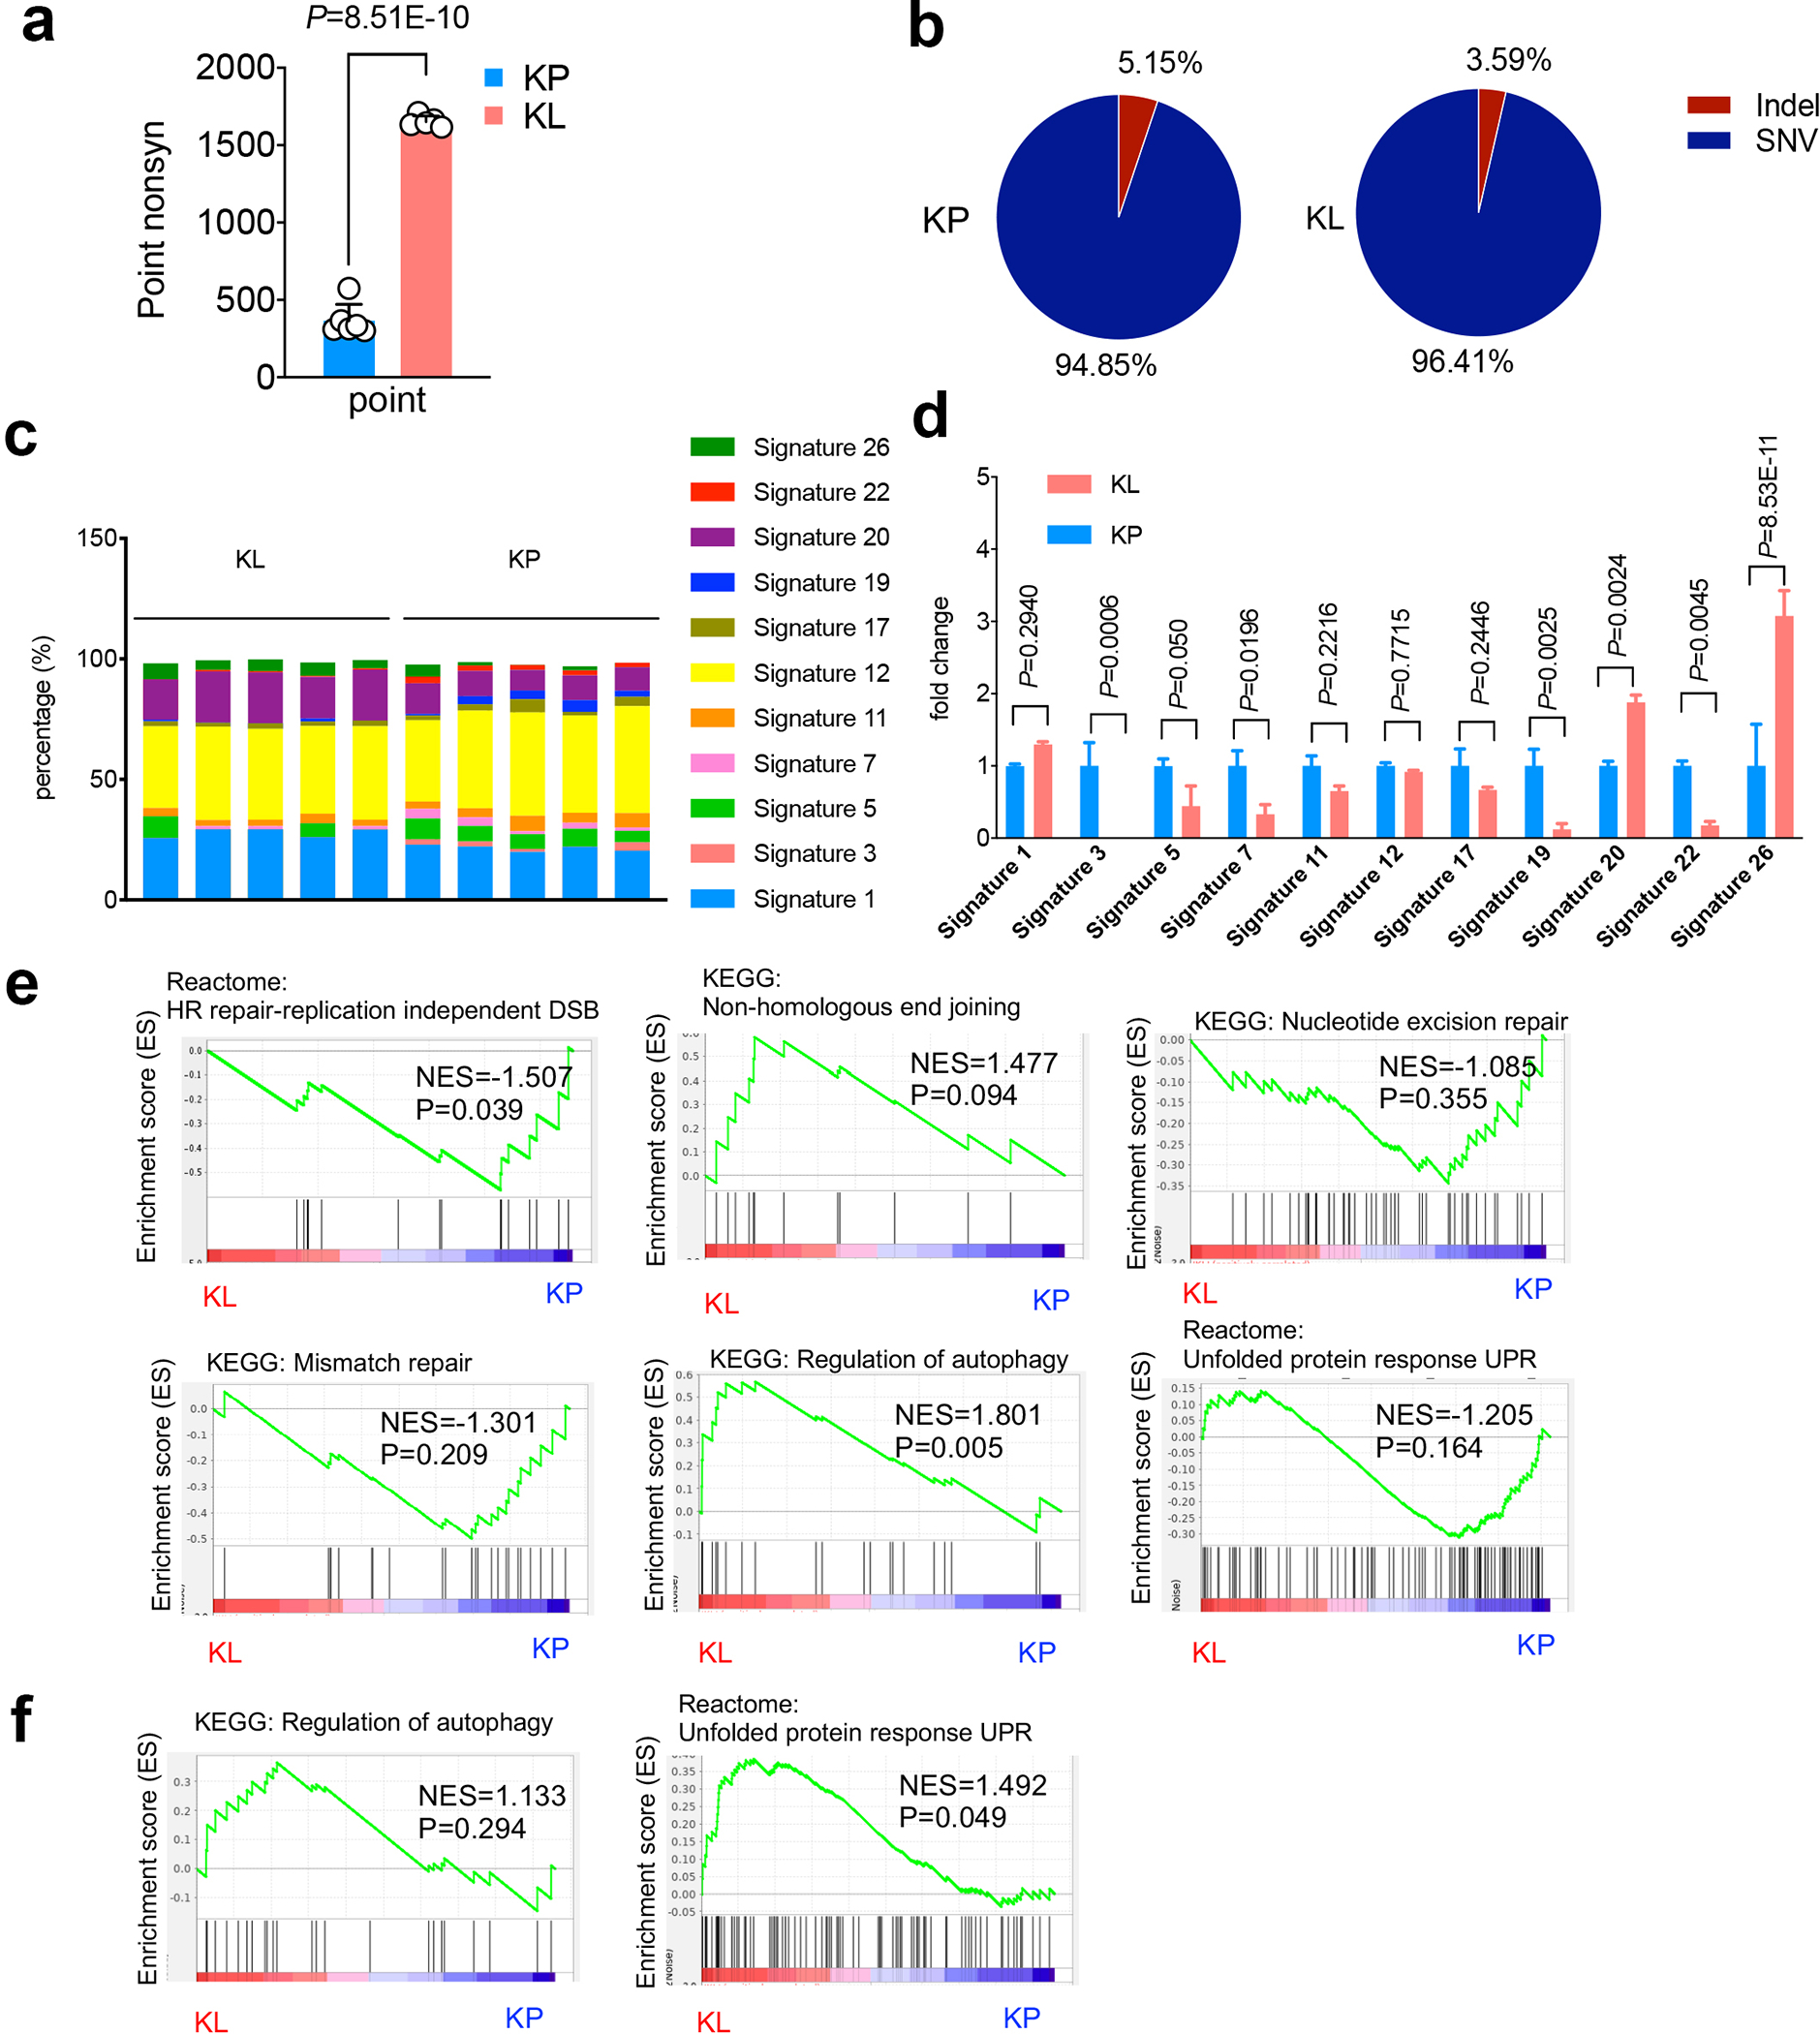
a. Point nonsynonymous single-nucleotide variations (SNV) numbers from either KP or KL cells. KP n=6, KL n=5 cell lines each group. (mean±sd, unpaired t test, two tailed). b. Percentage of Indels and SNVs in KP and KL cells KP n=6, KL n=5 cell lines each group. (unpaired t test, two sided. P=0.0032). c. Percentage of each COSMIC mutational signature detected in the cell lines examined. Each column represents one individual cell line. d. Fold change of the signatures shown in (a) and normalized to average levels of corresponding signature in KP. KL, KP n=5 cell lines each group. (mean±sd, multiple t test, FDR<0.05). e, GSEA of DNA repair related pathways, including HR repair-replication independent DSB, non-homologous end joining, nucleotide excision repair and mismatch repair, and related autophagy pathway and unfolded protein response (UPR) pathway of KL and KP GEMM lung nodules. KL n=5, KP n=5 lung nodules each group. f. Gene set enrichment analysis (GSEA) of TCGA patients for autophagy pathway and UPR pathway. KL n=19, KP n=22 patients each group.
Extended Data Fig. 3|. LKB1 mutant tumor double strand break repair.
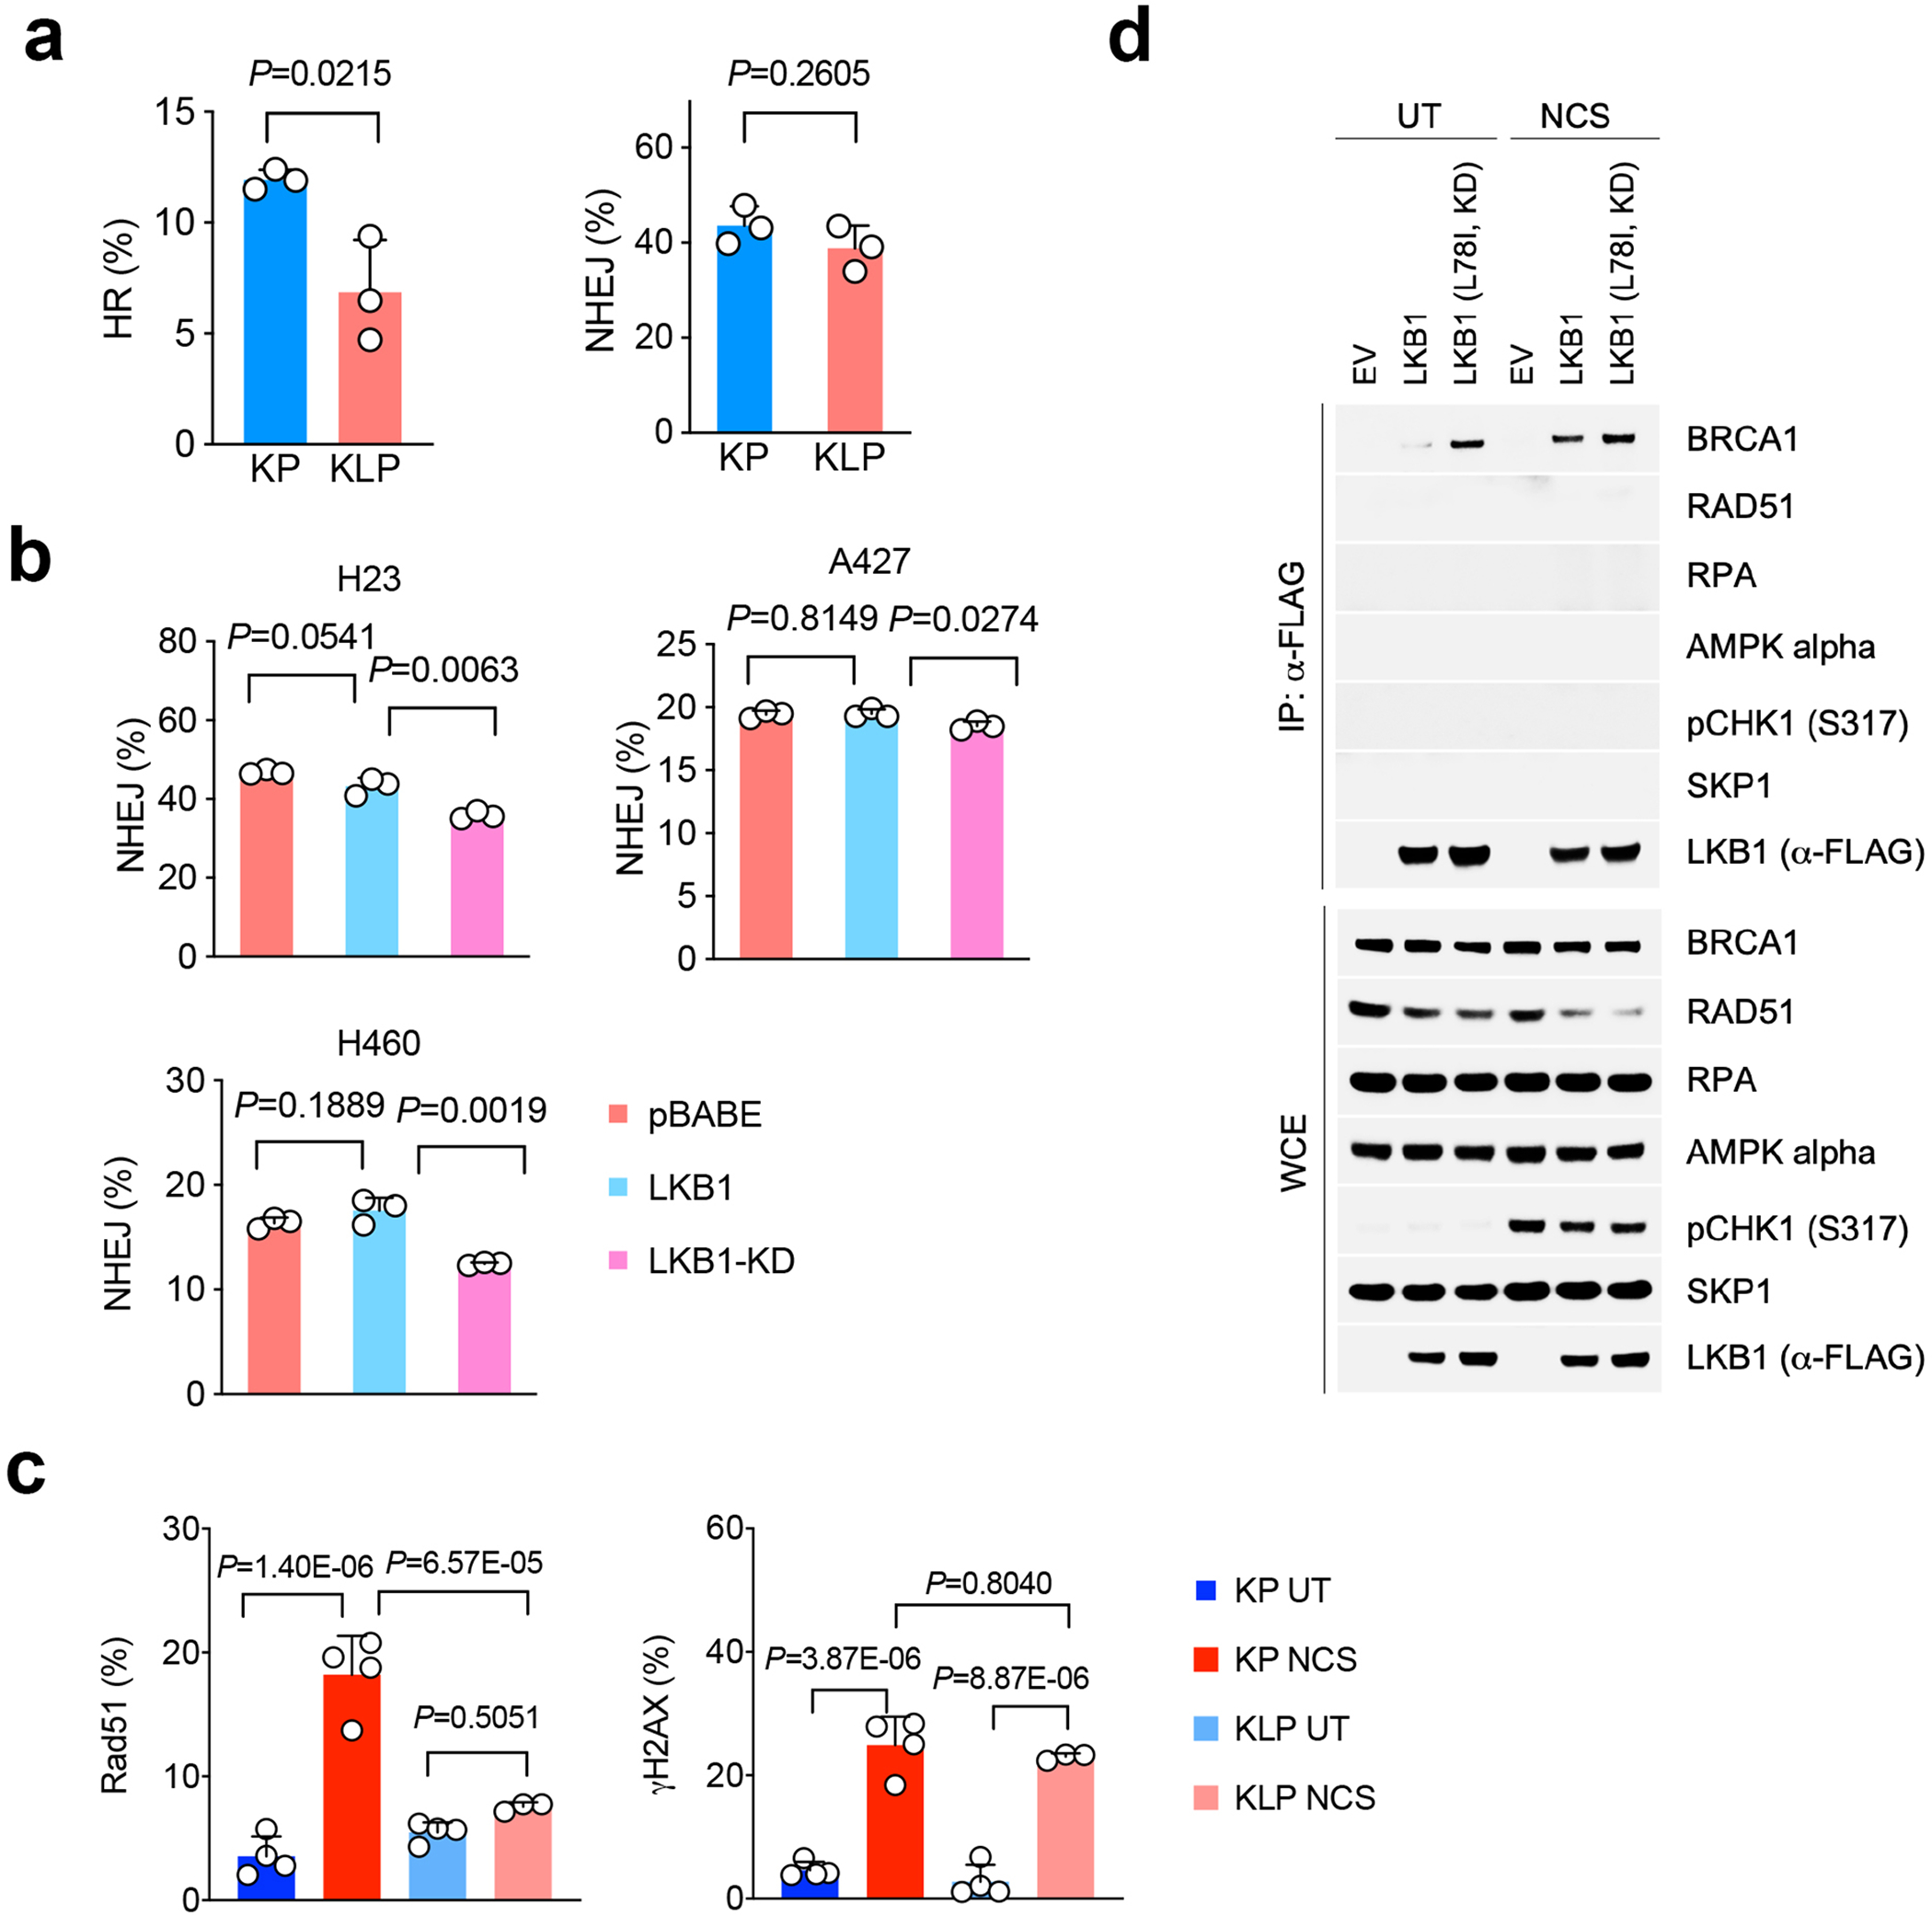
a. HR and NHEJ levels in Kras/Lkb1/Trp53 mutant cell lines comparing with Kras/Trp53 cells. n=3 cell cultures for each group. (mean±sd, two-sided t test, unpaired). b. NHEJ ratio changes in human NSCLC LKB1 mutant cell lines H23, A427 and H460 with empty vector (pBABE), LKB1 or KLB1-KD overexpression were determined by flow cytometry. n=3 individual cell cultures for each group. (mean±sd, two-sided t test, unpaired). c. Quantification of Rad51 and pH2AX positive cells percentage in KLP cells. Result is combined from three independent experiments. KP UT, KP NCS and KLP UT n=4, KLP NCS n=3 individual cell cultures each group. Data shown one of two independent experiments. (mean±sd, one-way ANOVA, multiple two-sided comparison, Tukey test). d. LKB1 forms complex with BRCA1 in response to DNA damage. Upper panel, immunoprecipitation assay showing LKB1 interacting proteins in response to neocarzinostatin (NCS) treatment induced DNA damage. Lower panel, western blot showing total level of input proteins from whole-cell extract (WCE). Data represents one of two independent experiments. Blots are cropped and uncropped images can be found in Source Data.
Extended Data Fig. 4|. Immunoproteasome activity changes in LKB1 mutant tumors upon IFNγ stimulation.
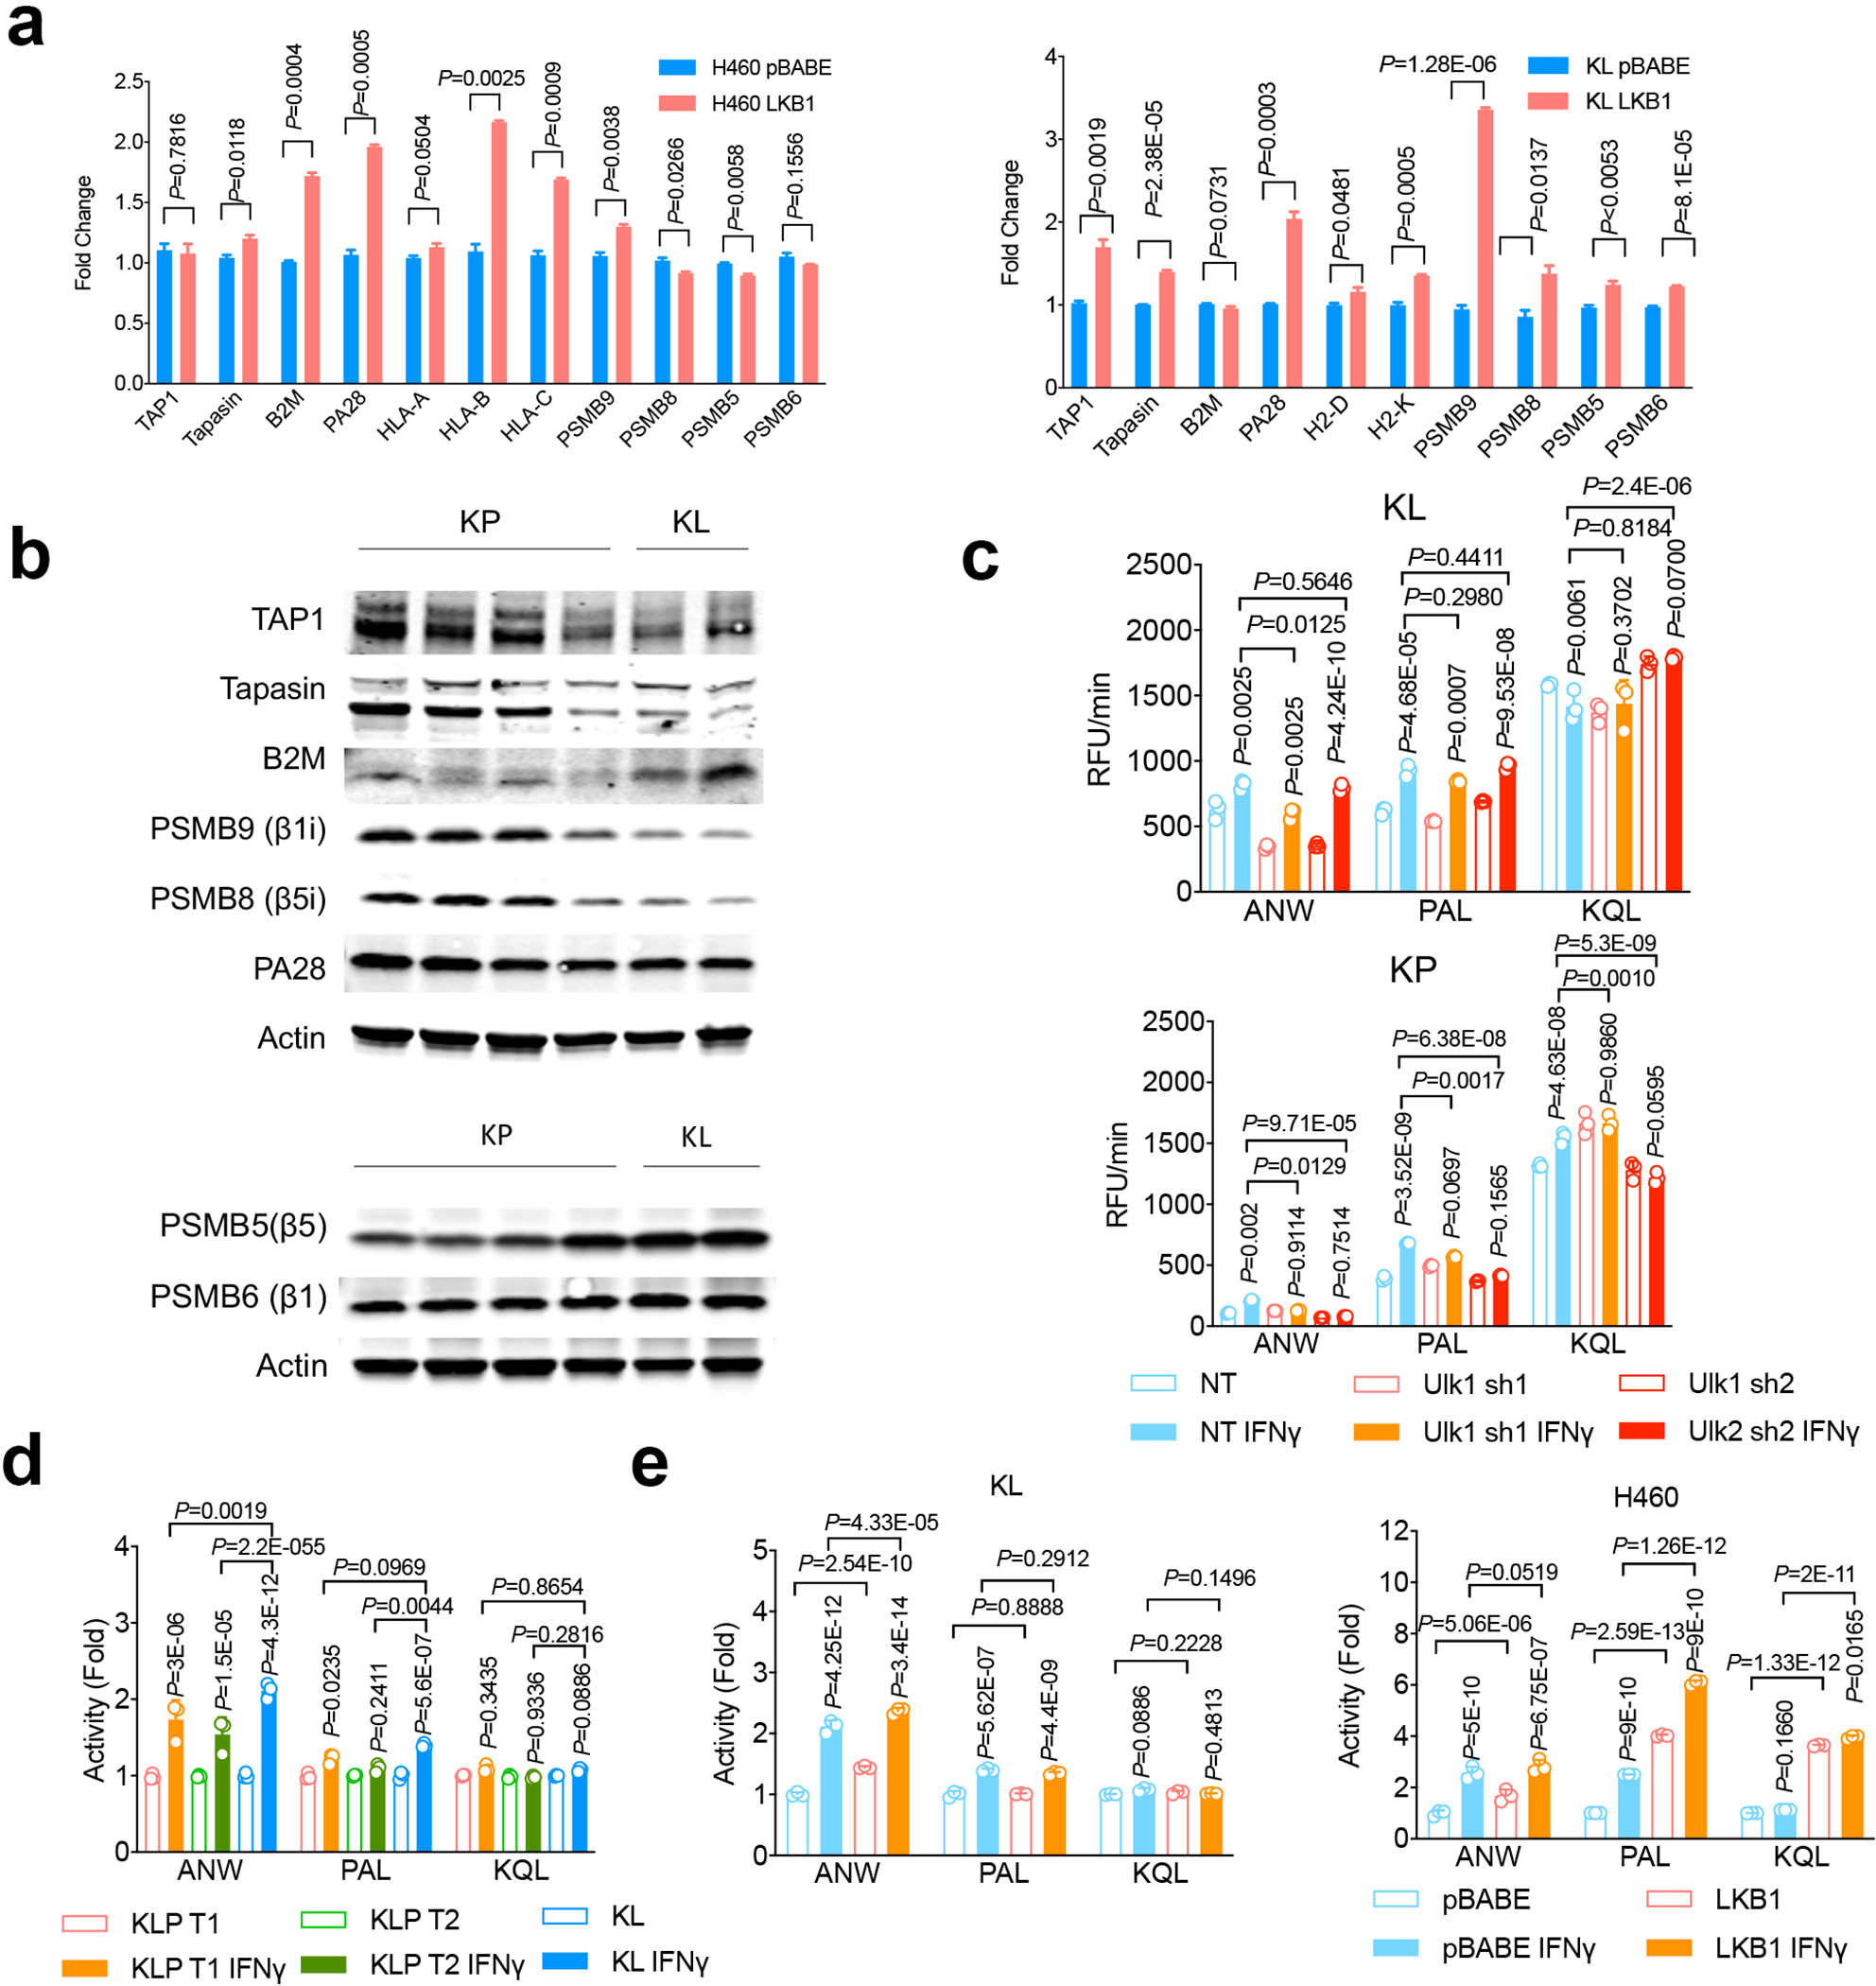
a. Real-time PCR showing antigen presentation genes expressing in LKB1 mutant lines with LKB1 overexpression. Left, H460 human NSCLC cells. Right, mouse KL cells with or without LKB1 over-expression. n=3 experiments each group. (mean±sd, unpaired t test, two tailed). *P<0.05, ***P<0.001. b. Western blot showing immunoproteasome subunits PSMB9 and PSMB8 levels, TAP1, Tapasin and B2M expression (Upper panel) and conventional proteasome subunits PSMB5 and PSMB6 expression (lower panel) from KP or KL lung nodules. Samples are derived from the same experiment and blots were processed in parallel. Blots are cropped and uncropped images can be found in Source Data.
c. KL Ulk1 shRNA cell lines (upper panel) and KP Ulk1 shRNA cell lines (lower panel) were stimulated with IFN γ (10ng/ml) for 24 hrs before the measurement of immunoproteasome activities showed as relative fluorescent units (RFU) per min (Vmax). n=3 cell cultures for each group. (mean±sd, multiple two-sided unpaired t test, two-stage step-up method of Benjamini, Krieger and Yekutieli). d. Immunoproteasome cleavage activity corresponding to indicated substrate for two KLP cells (KLP T1 and KLP T2) after IFNγ stimulation shown as Vmax fold change compared with KL vehicle control group. n=3 cell cultures each group. (mean±sd, two-sided unpaired multiple t test, two-stage step-up method of Benjamini, Krieger and Yekutieli). e. Immunoproteasome activity for KL (left) and H460 (right) with or without LKB1 over-expression. n=3 cell cultures each group. (mean±sd, two-sided unpaired multiple t test, two-stage step-up method of Benjamini, Krieger and Yekutieli).
Extended Data Fig. 5|. MHCI levels in KL and KP tumors.
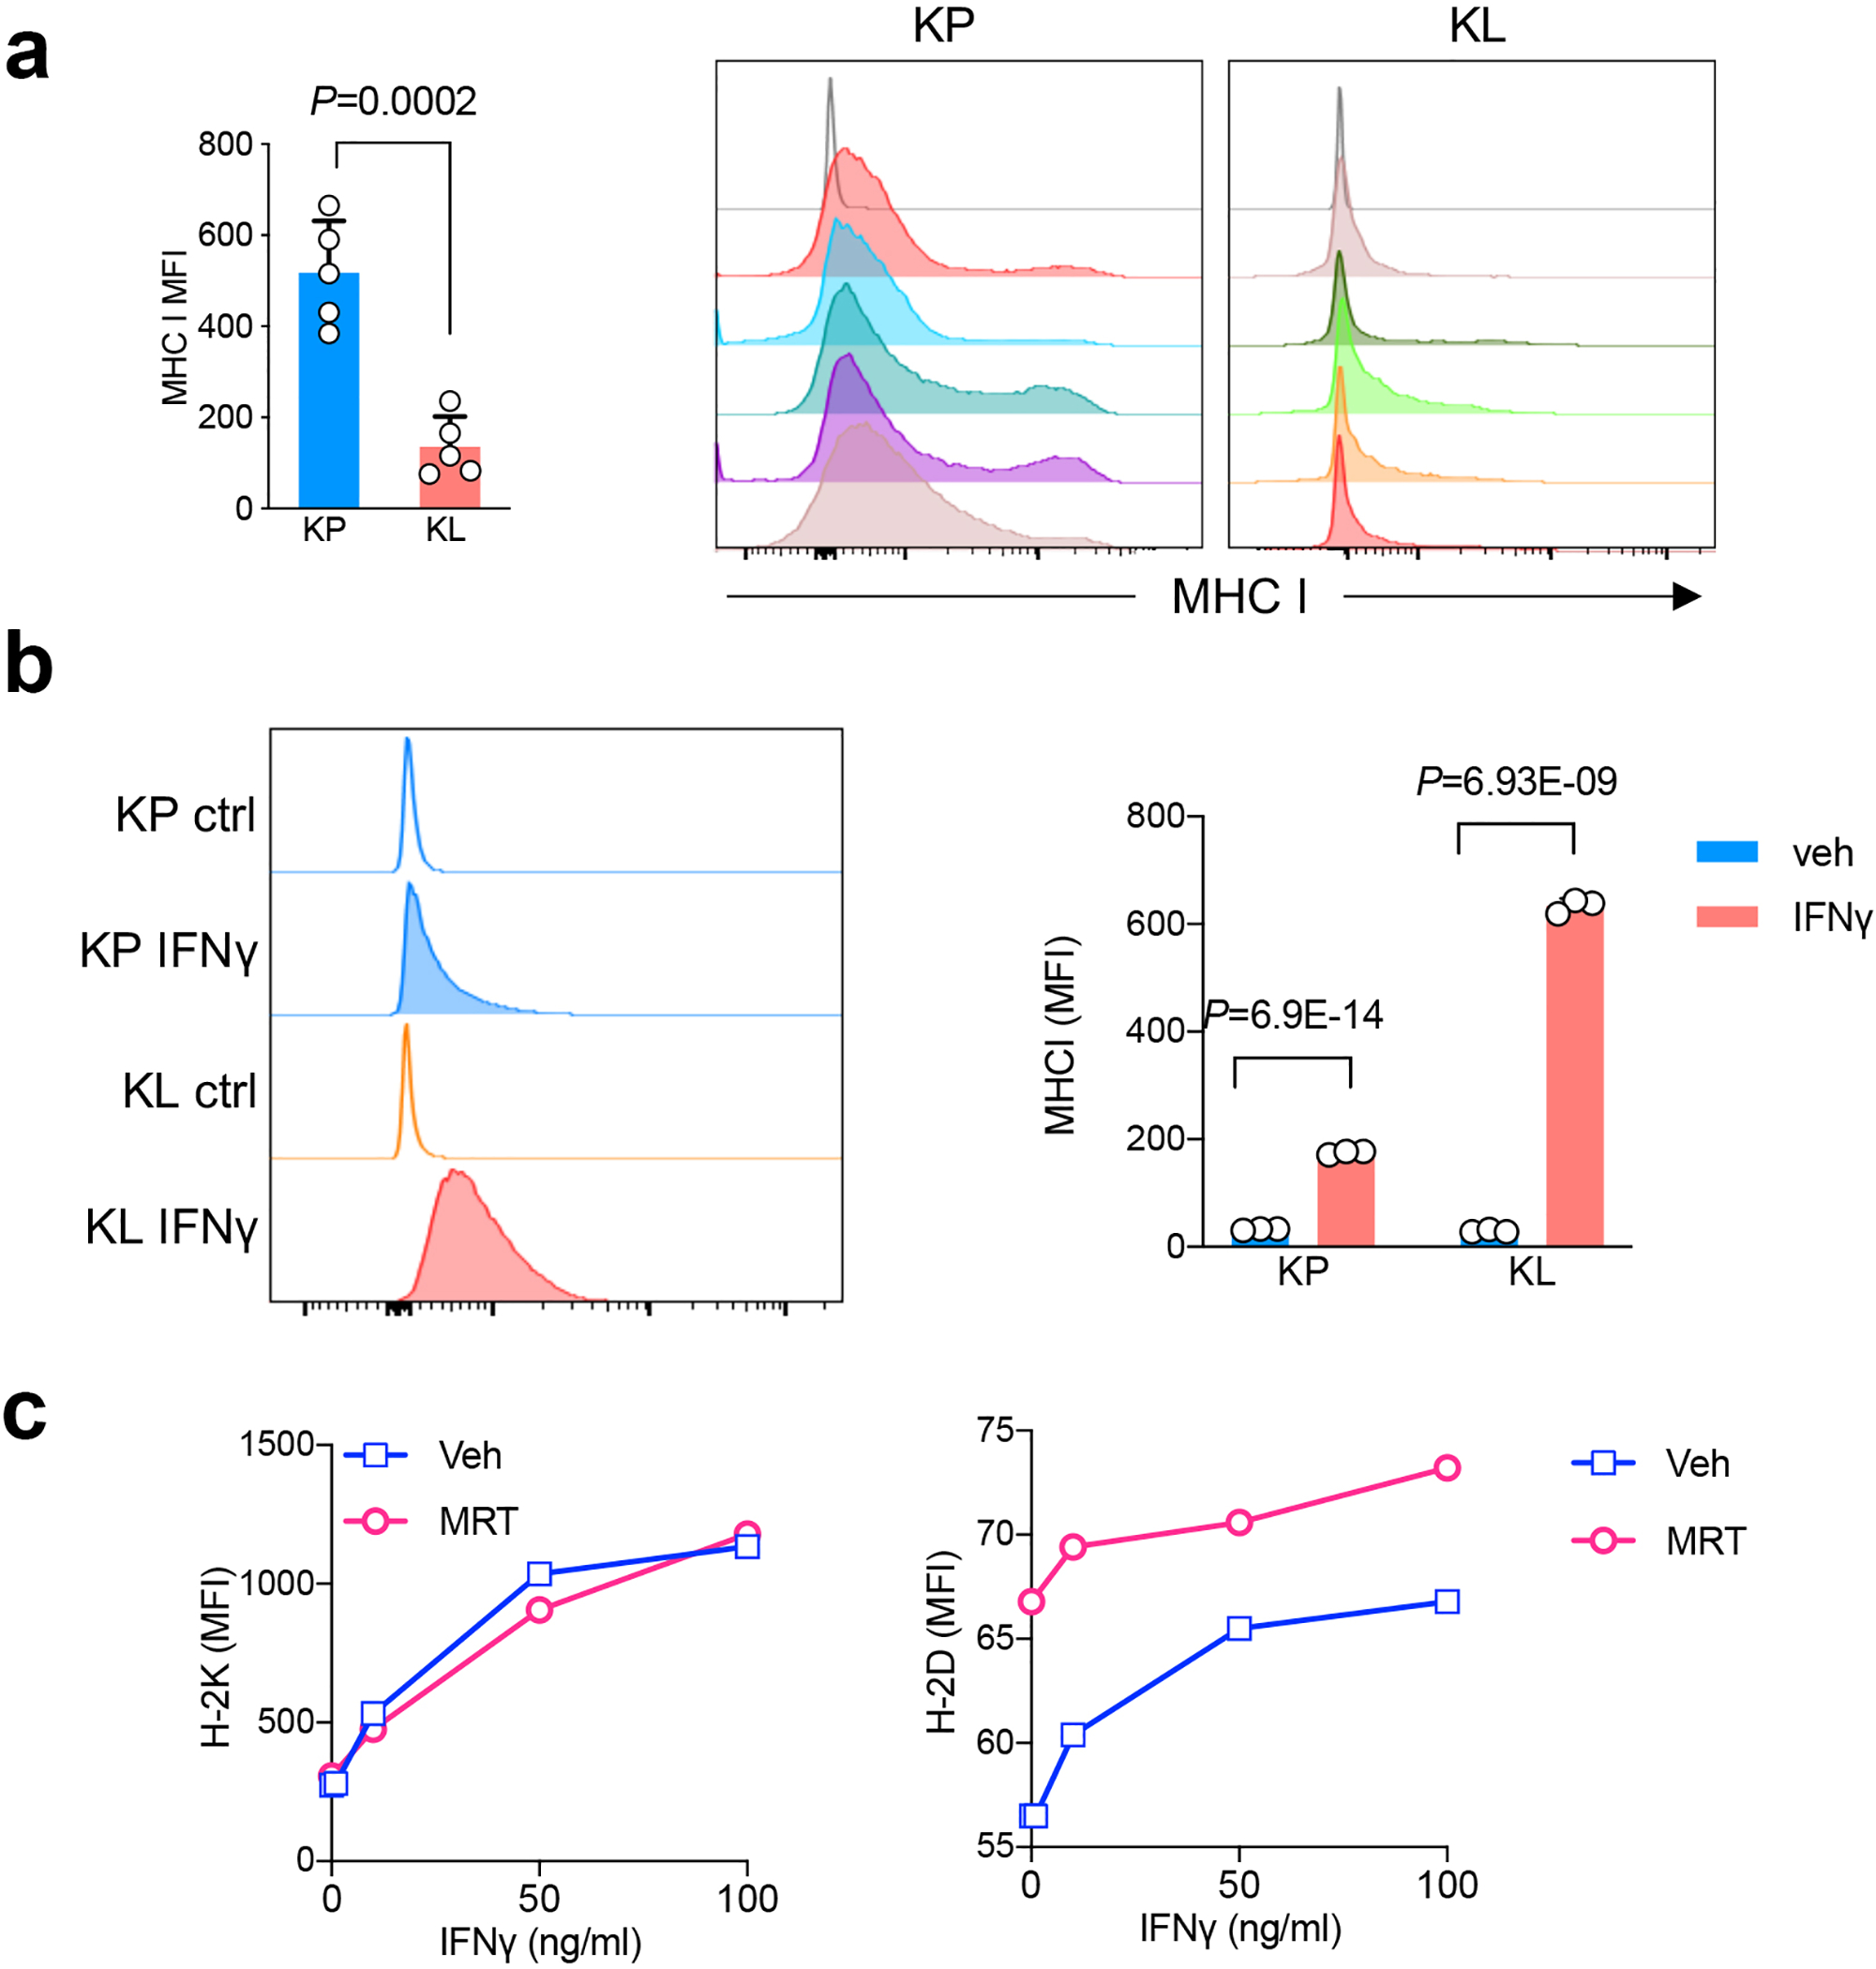
a. MHCI levels from KP or KL allograft tumors as quantified as median fluorescent intensity (MFI) (left). Right, representative histograms depict MHCI level from mice with KP and KL tumors. n=5 tumors each group. (mean±sd, two-sided t test, unpaired) b. MHC I levels from KP or KL tumor cell lines stimulated with IFNγ as shown MFI levels. Left panel, representative histograms. Right panel, quantification of MHC I expression levels in KP and KL after IFNγ (100ng/ml) stimulation for 18 hrs. n=3 cell cultures each group. Shown representative result of three independent experiments (mean±sd, multiple t test, FDR<0.05). c. MHC I subunit H-2K and H-2D levels change in response to ULK1 inhibitor MRT68921 in mouse KL line in vitro 48hrs after the treatment. Data representative of two independent experiments.
Extended Data Fig. 6|. Targeting autophagy pathway in LKB1 mutant NSCLC tumors.
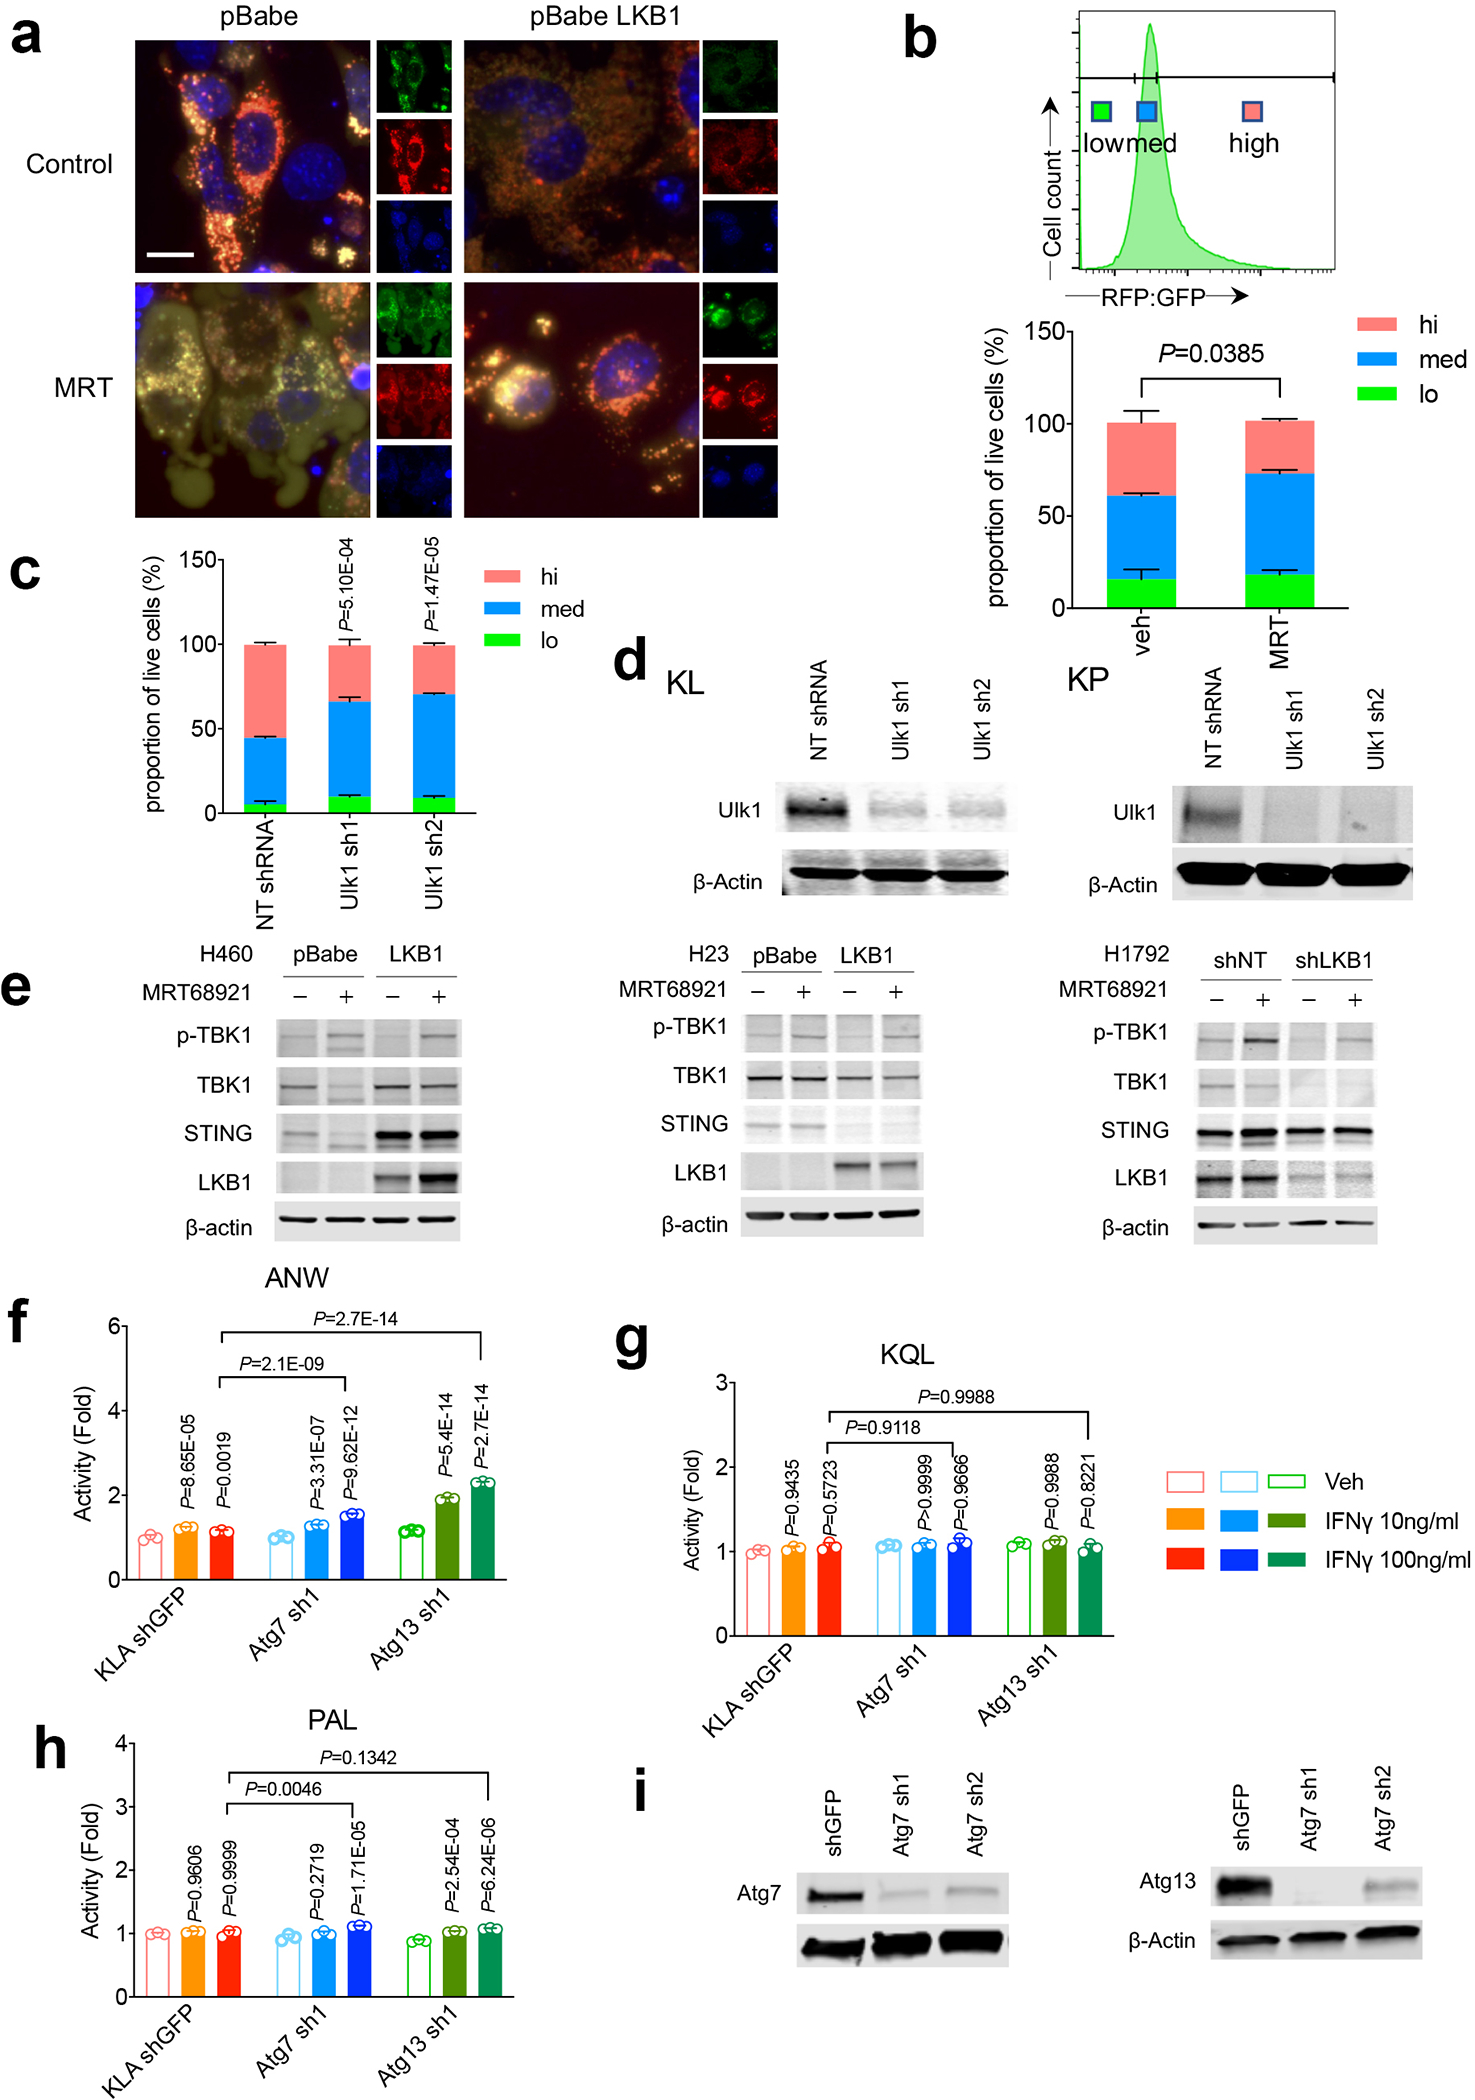
a. Representative immunofluorescent (IF) image of autophagy flux in KL and KL-LKB1 tumor cells in response to MRT using GFP-mCherry-LC3B reporter. Red, GFP-mCherry+ LC3 puncta; yellow, GFP+mCherry+ puncta. scale bar, 15 μm. Data representative of 2 independent experiments. b. Quantification of autophagic flux by GFP-RFP-LC3 reporter in KL tumors treated with MRT as left using flow cytometry analysis. Upper panel, gating strategy. Lower panel, quantification of autophagic flux shown as RFP:GFP ratios. n=3 cell cultures each group. Data shown represents one of three independent experiments (mean±sd, two-tailed t test for high group, unpaired). c. Quantification of autophagic flux ratio (RFP:GFP) in KL cells with GFP-RFP-LC3 reporter transduced with Ulk1 shRNA. n=3 cell cultures each group. Data shown one of two independent experiments. (mean±sd, two-tailed t test for high group, unpaired). Samples were compared with NT shRNA cells for high group. d. western blot showing ULK1 protein levels in KL (left) and KP (right) stable cell lines with Ulk1 shRNA. Data represents one of two independent experiments. e, Western blot of ULK inhibitor MRT68921 in human LKB1 isogenic lines for TBK1/STING pathway changes of H460 (left) and H23 (middle) and H1792 (right). Data represents one of two independent experiments. f, g, h. Immunoproteasome activity for KL stable cell lines with Atg7 or Atg13 for ANW (f), KQL (g) or PAL (h) substrate. n=3 independent experimental samples for each group. (data presented are shown as mean±sd, two-sided one-way ANOVA, Tukey test, statistics presented on top of each column is compared with vehicle group, and pairwise comparisons between groups after 100ng/ml IFNγ treatment shown on top of columns). Data shown one of two independent experiments. i. Western blot of KL stable cell lines generated with either Atg7 shRNA (left panel) or Atg13 shRNA (right panel). Shown one of two independent experiments. Blots in panels d, e and i are cropped and uncropped images can be found in Source Data
Extended Data Fig. 7|. Targeting autophagy in LKB1 mutant NSCLC tumors in vivo.
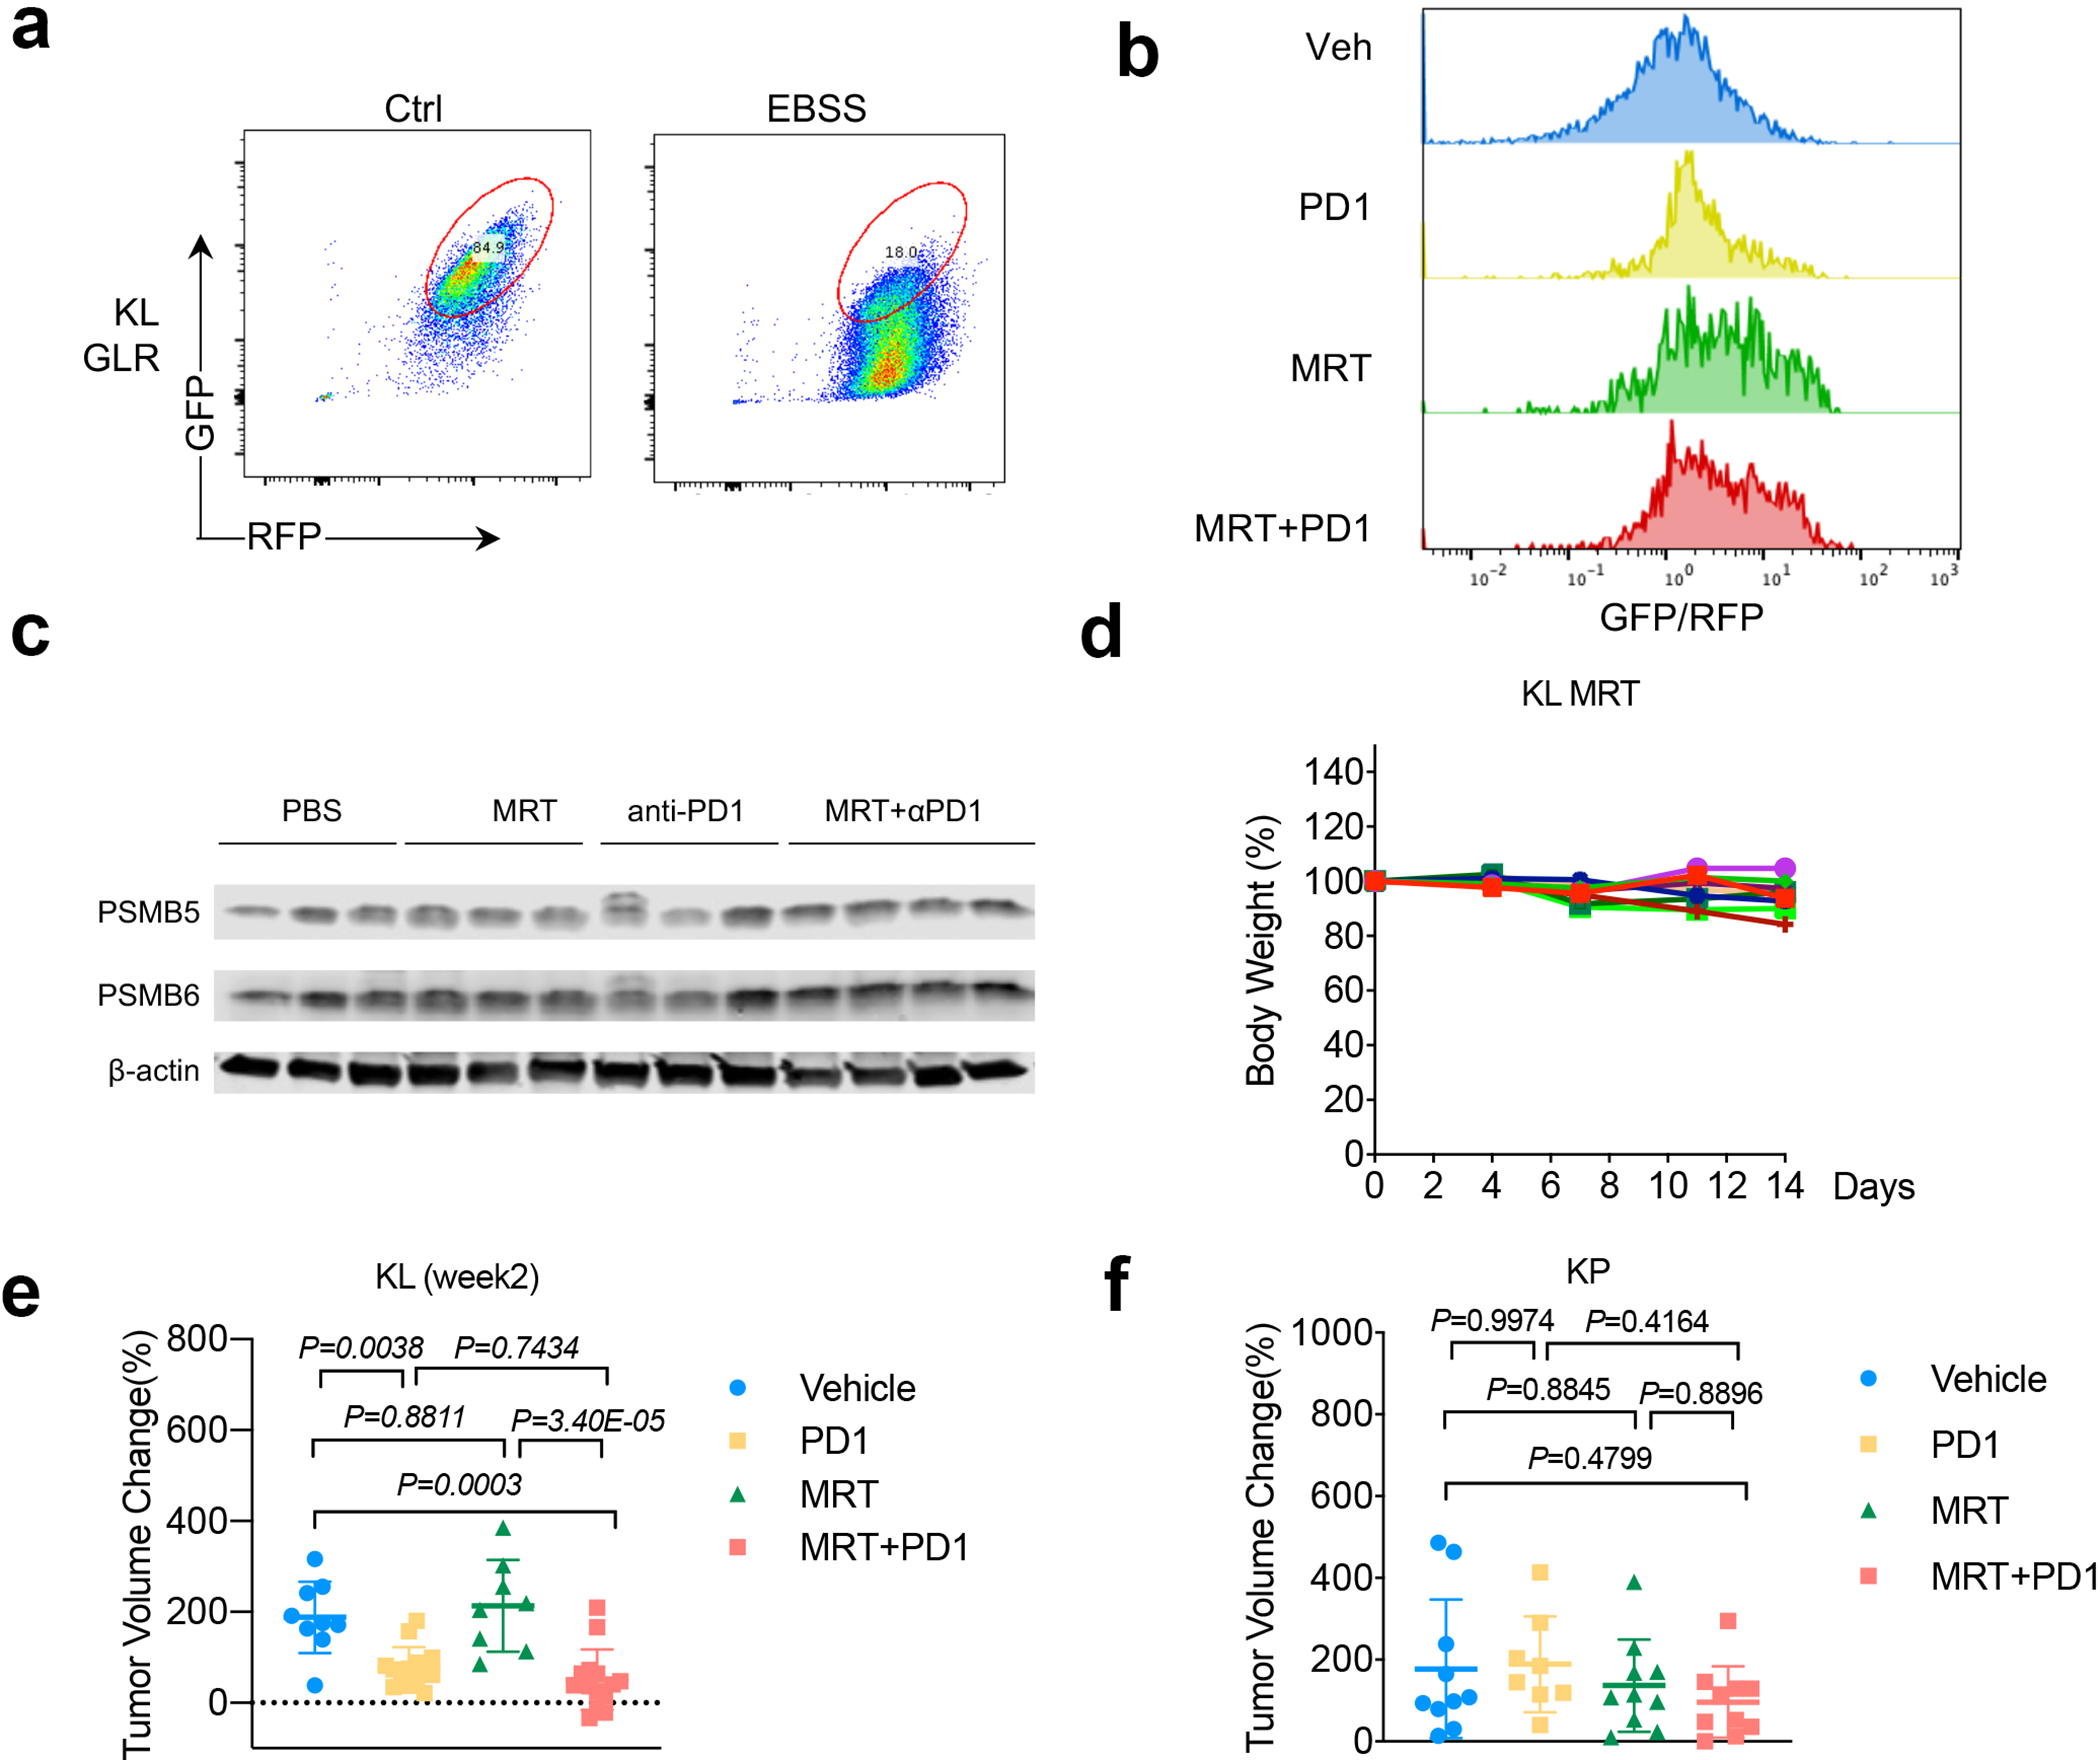
a. validation of KL cells transduced with autophagy flux reporter GFP-LC3-RFP (GLR). Generated KL GLR cells were starved in EBSS buffer for 24 hrs before FACS analysis for RFP/GFP signals. b. Representative FACS analysis of GFP/RFP ratio of KL tumors after indicated treatments. Data representative of 2 independent experiments. c. Western blot shows conventional proteasome subunits PSMB5 and PSMB6 expression levels from KL lung nodules after MRT+PD1 treatment. Each lane represents one individual mouse tumor nodule. d. Toxicity of MRT68921 shown as mouse body weight change percentage after the drug treatment. Each line represents one mouse. n=9. e. Tumor volume changes after 2-week treatment of KL GEMM tumors with MRT+PD1. Veh n=9, PD1 n=14, MRT n=8, MRT+PD1, n=14 tumors each group. (mean±sd, one-way ANOVA). f. Tumor volume change of KP allograft tumor 1 week after indicated treatment. Veh, MRT, MRT+PD1 n=10; PD1 n=8 tumors each group. (mean±sd, one-way ANOVA).
Extended Data Fig. 8|. Immune infiltrates analysis in KL tumors after ULK1 inhibitor treatment.
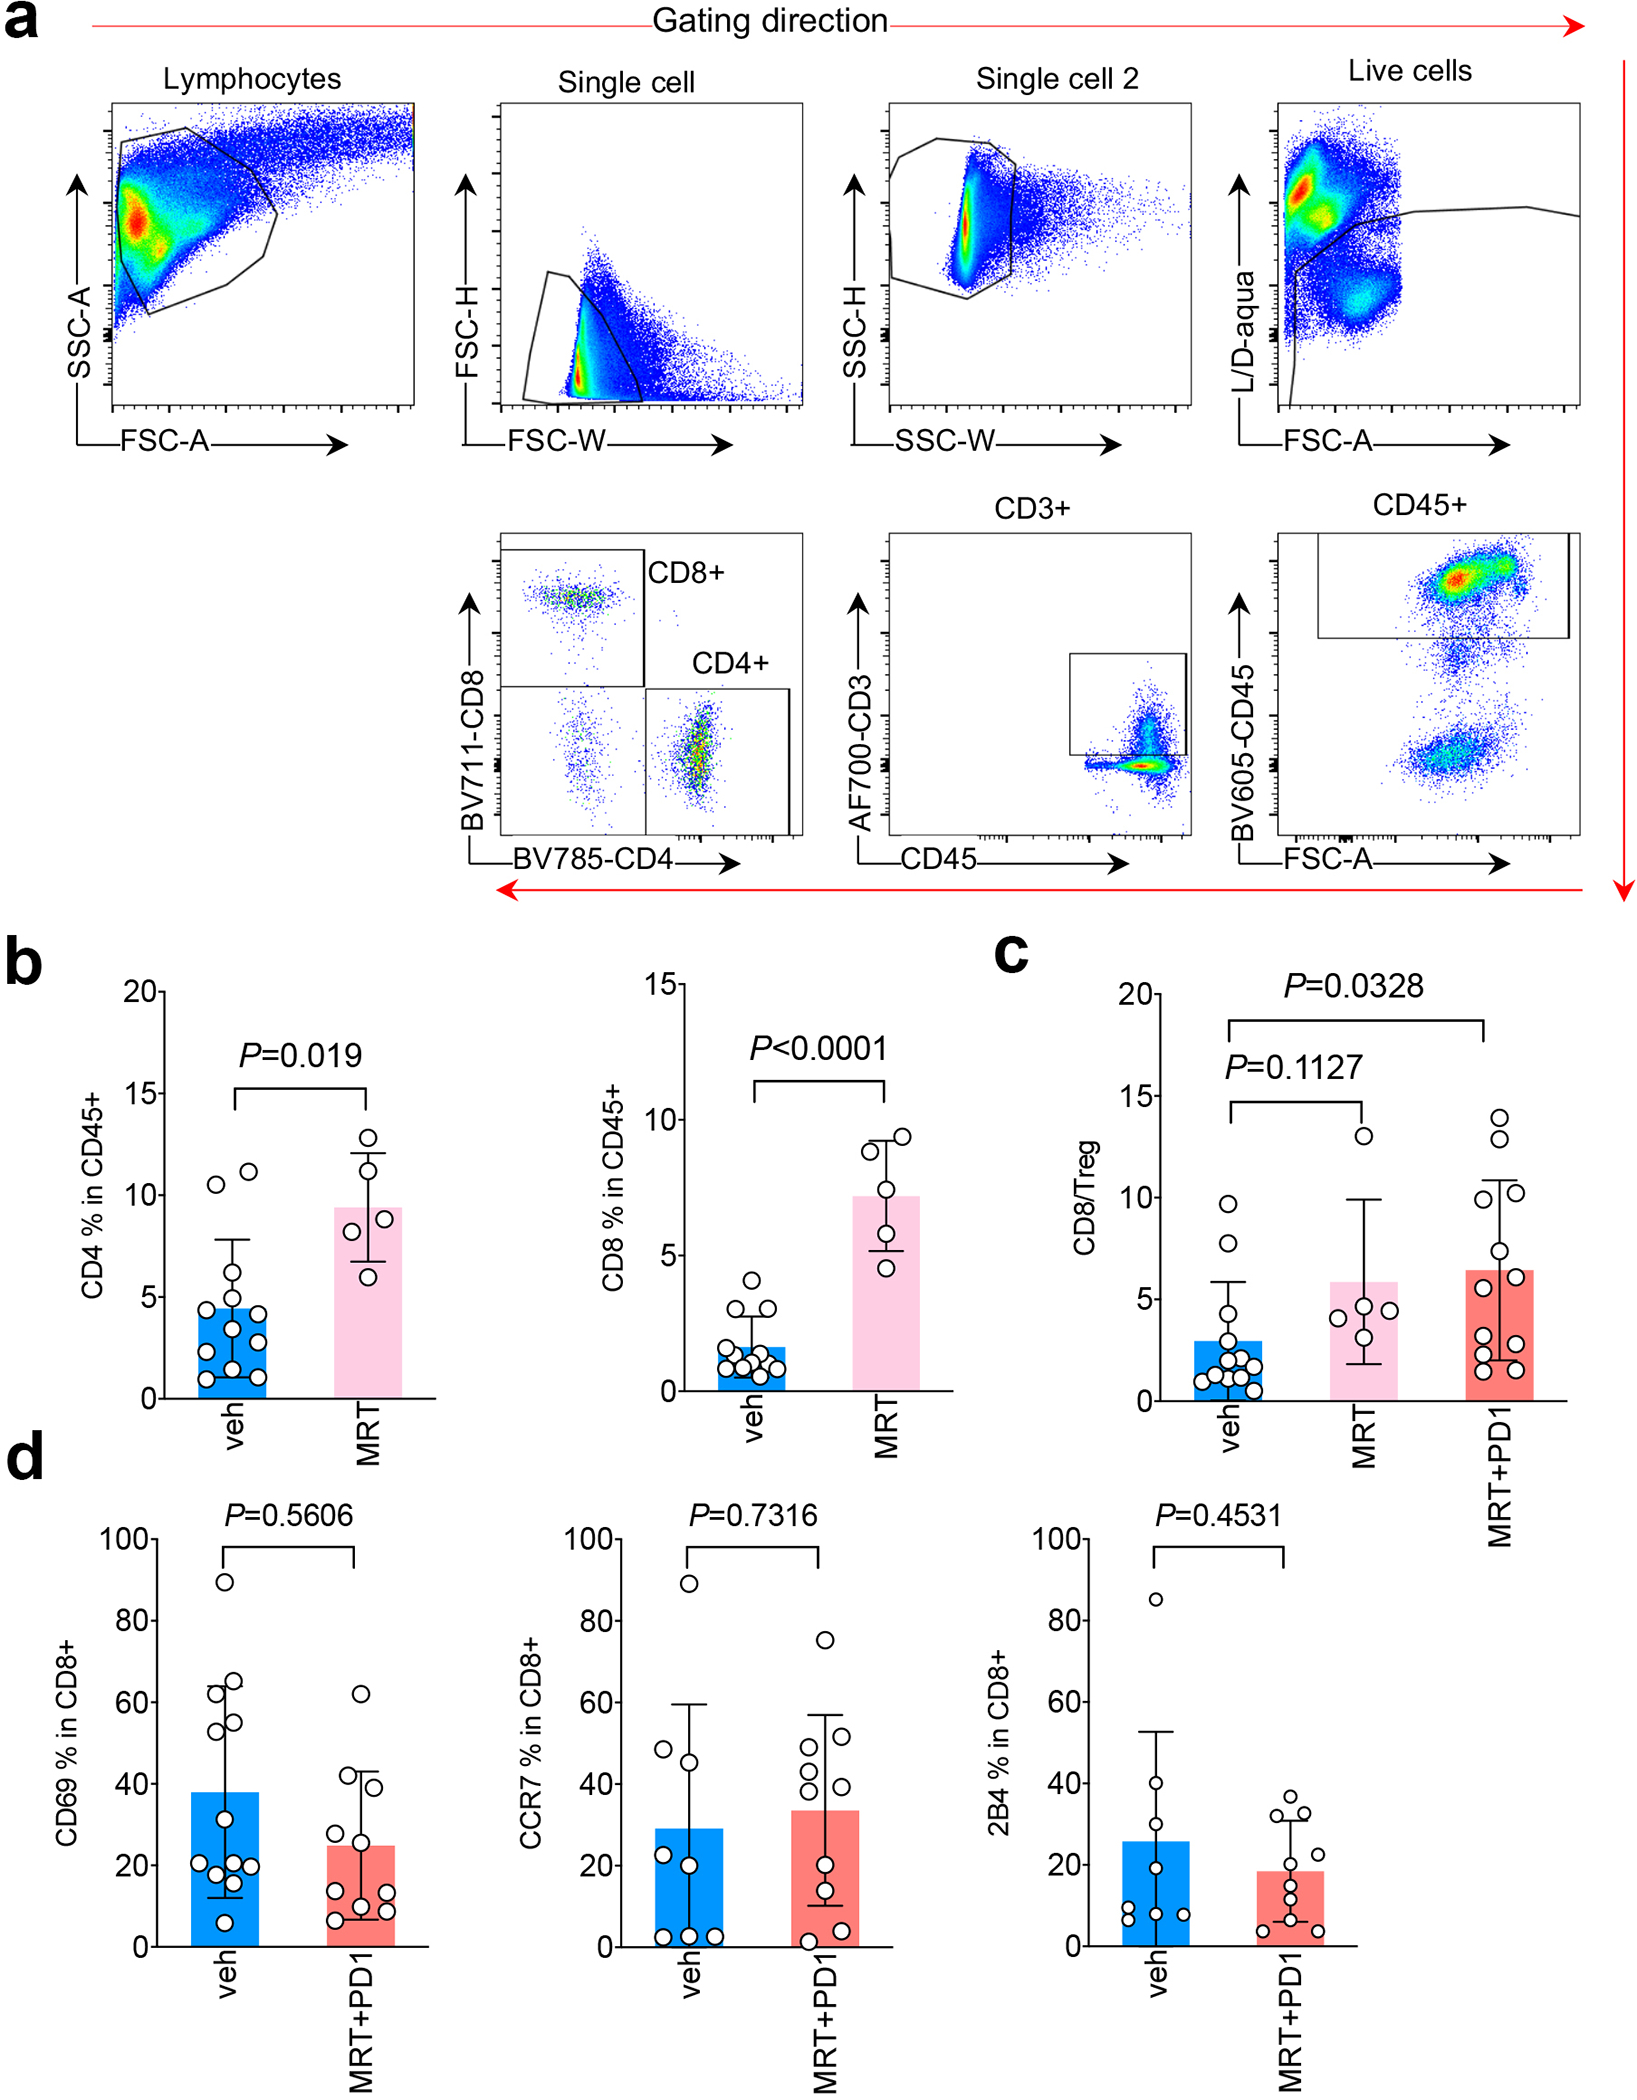
a. Gating strategy used for immune analysis. b. FACS analysis of CD4+ (left) and CD8+ (right) T lymphocytes among total tumor infiltrating CD45+ leukocytes in KL tumor after the treatment of ULK1 inhibitor MRT68921 (MRT). Veh n=12, MRT n=5 tumors each group. (mean±sd, unpaired t test, two tailed). c. CD8/Treg ratio of total tumor infiltrating leukocytes (TILs) after the indicated drugs treatment. veh n=12, MRT n=5, MRT+PD1 n=12 tumors each group. (mean±sd, unpaired t test, two tailed). d. CD69, CCR7 and 2B4 levels within CD8+ T cells after MRT68921 (MRT) and anti-PD1 treatment. Left panel, veh n=12, MRT+PD1 n=10. Middle and right panel, veh n=8, MRT+PD1 n=10 tumors each group. (mean±sd, unpaired t test, two tailed.)
Supplementary Material
Acknowledgments
This work was supported by R01CA219670 (N.B., K.K.W.), R01CA76584 (M.P.), SPORE CA058223 (C.M.P.) and a fellowship from the T32 CA009161 (Levy) grant to A.M. We thank NYU Langone Genome Technology Center for facilitating RNA sequencing and whole exome sequencing experiment. We thank NYU Langone Division of Comparative Medicine staff for their support of the animal studies. We thank NYU Langone Health DART Microscopy Lab Alice Liang, Chris Petzold and Kristen Dancel-Manning for their assistance with TEM work. This core lab is partially funded by NYU Cancer Center Support Grant NIH/NCI P30CA016087. M.P. is an Investigator with the Howard Hughes Medical Institute.
Competing interests
The authors declare competing interests: K.K.W. is a founder and equity holder of G1 Therapeutics. K.K.W. has sponsored Research Agreements with MedImmune, Takeda, TargImmune, Mirati, Merus, Alkermes and BMS. K.K.W. has consulting & sponsored research agreements with AstraZeneca, Janssen, Pfizer, Novartis, Merck, Ono, Array. C.M.P is an equity stock holder and consultant, and Board of Director Member, of BioClassifier LLC and GeneCentric Diagnostics. C.M.P is also listed an inventor on patent applications on the Breast PAM50 and Lung Cancer Subtyping assays. C.M.R. has consulted regarding cancer drug development with AbbVie, Amgen, Ascentage, Bicycle, Celgene, Daiichi Sankyo, Genentech/Roche, Ipsen, Loxo, and PharmaMar, and serves on the SAB of Bridge Medicines and Harpoon Therapeutics. M.Pagano is a co-founder of Coho Therapeutics; has financial interests in Coho Therapeutics, CullGen Inc., and Kymera Therapeutics; is on the SAB of CullGen Inc. and Kymera Therapeutics, and is a consultant for Coho Therapeutics, CullGen Inc., Kymera Therapeutics, and SEED Therapeutics. J.F.G. has served as a compensated consultant or received honoraria from Bristol-Myers Squibb, Genentech, Ariad/Takeda, Loxo/Lilly, Blueprint, Oncorus, Regeneron, EMD Serono, Gilead, AstraZeneca, Pfizer, Incyte, Novartis, Merck, Agios, Amgen, and Array; research support from Novartis, Genentech/Roche, and Ariad/Takeda; institutional research support from Bristol-Myers Squibb, Tesaro, Moderna, Blueprint, Jounce, Array Biopharma, Merck, Adaptimmune, Novartis, and Alexo; and has an immediate family member who is an employee of Ironwood Pharmaceuticals. G.J.F. has patents/pending royalties on the PD-1/PD-L1 pathway from Roche, Merck MSD, Bristol-Myers-Squibb, Merck KGA, Boehringer-Ingelheim, AstraZeneca, Dako, Leica, Mayo Clinic, and Novartis. G.J.F. has served on advisory boards for Roche, Bristol-Myers-Squibb, Xios, Origimed, Triursus, iTeos, NextPoint, IgM, Jubilant and GV20. G.J.F. has equity in Nextpoint, Triursus, Xios, iTeos, IgM, and GV20.
Footnotes
Data Availability
All data generated and supporting the findings of this study are available within the paper. The RNAseq data have been deposited in the Gene Expression Ominbus (GEO) accession number GSE137244 and GSE137396. The WESseq data have been deposited in NCBI Sequence Read Archive (SRA) accession number PRJNA564395 (https://www.ncbi.nlm.nih.gov/bioproject/PRJNA564395). TCGA data used is publicly available at GDC portal (https://portal.gdc.cancer.gov/). Source data are available for this study. All other data supporting the findings of this study are available from the corresponding author on reasonable request.
References
- 1.Skoulidis F et al. STK11/LKB1 Mutations and PD-1 Inhibitor Resistance in KRAS-Mutant Lung Adenocarcinoma. Cancer Discov 8, 822–835, doi: 10.1158/2159-8290.CD-18-0099 (2018). [DOI] [PMC free article] [PubMed] [Google Scholar]
- 2.Kadara H et al. Whole-exome sequencing and immune profiling of early-stage lung adenocarcinoma with fully annotated clinical follow-up. Ann Oncol 28, 75–82, doi: 10.1093/annonc/mdw436 (2017). [DOI] [PMC free article] [PubMed] [Google Scholar]
- 3.Rizvi H et al. Molecular Determinants of Response to Anti-Programmed Cell Death (PD)-1 and Anti-Programmed Death-Ligand 1 (PD-L1) Blockade in Patients With Non-Small-Cell Lung Cancer Profiled With Targeted Next-Generation Sequencing. J Clin Oncol 36, 633–641, doi: 10.1200/JCO.2017.75.3384 (2018). [DOI] [PMC free article] [PubMed] [Google Scholar]
- 4.Herter-Sprie GS et al. Synergy of radiotherapy and PD-1 blockade in Kras-mutant lung cancer. JCI Insight 1, e87415, doi: 10.1172/jci.insight.87415 (2016). [DOI] [PMC free article] [PubMed] [Google Scholar]
- 5.Xu C et al. Loss of Lkb1 and Pten leads to lung squamous cell carcinoma with elevated PD-L1 expression. Cancer Cell 25, 590–604, doi: 10.1016/j.ccr.2014.03.033 (2014). [DOI] [PMC free article] [PubMed] [Google Scholar]
- 6.Koyama S et al. STK11/LKB1 Deficiency Promotes Neutrophil Recruitment and Proinflammatory Cytokine Production to Suppress T-cell Activity in the Lung Tumor Microenvironment. Cancer Res 76, 999–1008, doi: 10.1158/0008-5472.CAN-15-1439 (2016). [DOI] [PMC free article] [PubMed] [Google Scholar]
- 7.Deng J et al. CDK4/6 Inhibition Augments Antitumor Immunity by Enhancing T-cell Activation. Cancer Discov 8, 216–233, doi: 10.1158/2159-8290.CD-17-0915 (2018). [DOI] [PMC free article] [PubMed] [Google Scholar]
- 8.Cancer Genome Atlas Research, N. Comprehensive molecular profiling of lung adenocarcinoma. Nature 511, 543–550, doi: 10.1038/nature13385 (2014). [DOI] [PMC free article] [PubMed] [Google Scholar]
- 9.Rizvi NA et al. Cancer immunology. Mutational landscape determines sensitivity to PD-1 blockade in non-small cell lung cancer. Science 348, 124–128, doi: 10.1126/science.aaa1348 (2015). [DOI] [PMC free article] [PubMed] [Google Scholar]
- 10.McGranahan N et al. Clonal neoantigens elicit T cell immunoreactivity and sensitivity to immune checkpoint blockade. Science 351, 1463–1469, doi: 10.1126/science.aaf1490 (2016). [DOI] [PMC free article] [PubMed] [Google Scholar]
- 11.Schumacher TN & Schreiber RD Neoantigens in cancer immunotherapy. Science 348, 69–74, doi: 10.1126/science.aaa4971 (2015). [DOI] [PubMed] [Google Scholar]
- 12.McFadden DG et al. Mutational landscape of EGFR-, MYC-, and Kras-driven genetically engineered mouse models of lung adenocarcinoma. Proc Natl Acad Sci U S A 113, E6409–E6417, doi: 10.1073/pnas.1613601113 (2016). [DOI] [PMC free article] [PubMed] [Google Scholar]
- 13.Cheng DT et al. Memorial Sloan Kettering-Integrated Mutation Profiling of Actionable Cancer Targets (MSK-IMPACT): A Hybridization Capture-Based Next-Generation Sequencing Clinical Assay for Solid Tumor Molecular Oncology. J Mol Diagn 17, 251–264, doi: 10.1016/j.jmoldx.2014.12.006 (2015). [DOI] [PMC free article] [PubMed] [Google Scholar]
- 14.Govindan R et al. Genomic landscape of non-small cell lung cancer in smokers and never-smokers. Cell 150, 1121–1134, doi: 10.1016/j.cell.2012.08.024 (2012). [DOI] [PMC free article] [PubMed] [Google Scholar]
- 15.Turajlic S et al. Insertion-and-deletion-derived tumour-specific neoantigens and the immunogenic phenotype: a pan-cancer analysis. Lancet Oncol 18, 1009–1021, doi: 10.1016/S1470-2045(17)30516-8 (2017). [DOI] [PubMed] [Google Scholar]
- 16.Mandal R et al. Genetic diversity of tumors with mismatch repair deficiency influences anti-PD-1 immunotherapy response. Science 364, 485–491, doi: 10.1126/science.aau0447 (2019). [DOI] [PMC free article] [PubMed] [Google Scholar]
- 17.Alexandrov LB et al. Signatures of mutational processes in human cancer. Nature 500, 415–421, doi: 10.1038/nature12477 (2013). [DOI] [PMC free article] [PubMed] [Google Scholar]
- 18.Davies H et al. HRDetect is a predictor of BRCA1 and BRCA2 deficiency based on mutational signatures. Nat Med 23, 517–525, doi: 10.1038/nm.4292 (2017). [DOI] [PMC free article] [PubMed] [Google Scholar]
- 19.Helleday T, Eshtad S & Nik-Zainal S Mechanisms underlying mutational signatures in human cancers. Nat Rev Genet 15, 585–598, doi: 10.1038/nrg3729 (2014). [DOI] [PMC free article] [PubMed] [Google Scholar]
- 20.Pierce AJ, Johnson RD, Thompson LH & Jasin M XRCC3 promotes homology-directed repair of DNA damage in mammalian cells. Genes Dev 13, 2633–2638, doi: 10.1101/gad.13.20.2633 (1999). [DOI] [PMC free article] [PubMed] [Google Scholar]
- 21.Bennardo N, Cheng A, Huang N & Stark JM Alternative-NHEJ is a mechanistically distinct pathway of mammalian chromosome break repair. PLoS Genet 4, e1000110, doi: 10.1371/journal.pgen.1000110 (2008). [DOI] [PMC free article] [PubMed] [Google Scholar]
- 22.Jasin M & Rothstein R Repair of strand breaks by homologous recombination. Cold Spring Harb Perspect Biol 5, a012740, doi: 10.1101/cshperspect.a012740 (2013). [DOI] [PMC free article] [PubMed] [Google Scholar]
- 23.Panier S & Durocher D Push back to respond better: regulatory inhibition of the DNA double-strand break response. Nat Rev Mol Cell Biol 14, 661–672, doi: 10.1038/nrm3659 (2013). [DOI] [PubMed] [Google Scholar]
- 24.Le DT et al. PD-1 Blockade in Tumors with Mismatch-Repair Deficiency. N Engl J Med 372, 2509–2520, doi: 10.1056/NEJMoa1500596 (2015). [DOI] [PMC free article] [PubMed] [Google Scholar]
- 25.Nolan E et al. Combined immune checkpoint blockade as a therapeutic strategy for BRCA1-mutated breast cancer. Sci Transl Med 9, doi: 10.1126/scitranslmed.aal4922 (2017). [DOI] [PMC free article] [PubMed] [Google Scholar]
- 26.Hisamatsu H et al. Newly identified pair of proteasomal subunits regulated reciprocally by interferon gamma. J Exp Med 183, 1807–1816, doi: 10.1084/jem.183.4.1807 (1996). [DOI] [PMC free article] [PubMed] [Google Scholar]
- 27.Boehm U, Klamp T, Groot M & Howard JC Cellular responses to interferon-gamma. Annu Rev Immunol 15, 749–795, doi: 10.1146/annurev.immunol.15.1.749 (1997). [DOI] [PubMed] [Google Scholar]
- 28.Seliger B et al. IFN-gamma-mediated coordinated transcriptional regulation of the human TAP-1 and LMP-2 genes in human renal cell carcinoma. Clin Cancer Res 3, 573–578 (1997). [PubMed] [Google Scholar]
- 29.Peaper DR, Wearsch PA & Cresswell P Tapasin and ERp57 form a stable disulfide-linked dimer within the MHC class I peptide-loading complex. EMBO J 24, 3613–3623, doi: 10.1038/sj.emboj.7600814 (2005). [DOI] [PMC free article] [PubMed] [Google Scholar]
- 30.Dikic I Proteasomal and Autophagic Degradation Systems. Annu Rev Biochem 86, 193–224, doi: 10.1146/annurev-biochem-061516-044908 (2017). [DOI] [PubMed] [Google Scholar]
- 31.Poillet-Perez L et al. Autophagy maintains tumour growth through circulating arginine. Nature 563, 569–573, doi: 10.1038/s41586-018-0697-7 (2018). [DOI] [PMC free article] [PubMed] [Google Scholar]
- 32.Yang A et al. Autophagy Sustains Pancreatic Cancer Growth through Both Cell-Autonomous and Nonautonomous Mechanisms. Cancer Discov 8, 276–287, doi: 10.1158/2159-8290.CD-17-0952 (2018). [DOI] [PMC free article] [PubMed] [Google Scholar]
- 33.Bhatt V et al. Autophagy modulates lipid metabolism to maintain metabolic flexibility for Lkb1-deficient Kras-driven lung tumorigenesis. Genes Dev 33, 150–165, doi: 10.1101/gad.320481.118 (2019). [DOI] [PMC free article] [PubMed] [Google Scholar]
- 34.Kim HS et al. Systematic identification of molecular subtype-selective vulnerabilities in non-small-cell lung cancer. Cell 155, 552–566, doi: 10.1016/j.cell.2013.09.041 (2013). [DOI] [PMC free article] [PubMed] [Google Scholar]
- 35.Skoulidis F et al. Co-occurring genomic alterations define major subsets of KRAS-mutant lung adenocarcinoma with distinct biology, immune profiles, and therapeutic vulnerabilities. Cancer Discov 5, 860–877, doi: 10.1158/2159-8290.CD-14-1236 (2015). [DOI] [PMC free article] [PubMed] [Google Scholar]
- 36.Osorio F, Lambrecht BN & Janssens S Antigen presentation unfolded: identifying convergence points between the UPR and antigen presentation pathways. Curr Opin Immunol 52, 100–107, doi: 10.1016/j.coi.2018.04.020 (2018). [DOI] [PubMed] [Google Scholar]
- 37.Shintani T & Klionsky DJ Autophagy in health and disease: a double-edged sword. Science 306, 990–995, doi: 10.1126/science.1099993 (2004). [DOI] [PMC free article] [PubMed] [Google Scholar]
- 38.Petherick KJ et al. Pharmacological inhibition of ULK1 kinase blocks mammalian target of rapamycin (mTOR)-dependent autophagy. J Biol Chem 290, 28726, doi: 10.1074/jbc.A114.627778 (2015). [DOI] [PMC free article] [PubMed] [Google Scholar]
- 39.Kimura S, Noda T & Yoshimori T Dissection of the autophagosome maturation process by a novel reporter protein, tandem fluorescent-tagged LC3. Autophagy 3, 452–460, doi: 10.4161/auto.4451 (2007). [DOI] [PubMed] [Google Scholar]
- 40.Kitajima S et al. Suppression of STING Associated with LKB1 Loss in KRAS-Driven Lung Cancer. Cancer Discov 9, 34–45, doi: 10.1158/2159-8290.CD-18-0689 (2019). [DOI] [PMC free article] [PubMed] [Google Scholar]
- 41.Mazzucchelli R & Durum SK Interleukin-7 receptor expression: intelligent design. Nat Rev Immunol 7, 144–154, doi: 10.1038/nri2023 (2007). [DOI] [PubMed] [Google Scholar]
- 42.Shackelford DB & Shaw RJ The LKB1-AMPK pathway: metabolism and growth control in tumour suppression. Nat Rev Cancer 9, 563–575, doi: 10.1038/nrc2676 (2009). [DOI] [PMC free article] [PubMed] [Google Scholar]
- 43.Bolger AM, Lohse M & Usadel B Trimmomatic: a flexible trimmer for Illumina sequence data. Bioinformatics 30, 2114–2120, doi: 10.1093/bioinformatics/btu170 (2014). [DOI] [PMC free article] [PubMed] [Google Scholar]
- 44.Li H & Durbin R Fast and accurate short read alignment with Burrows-Wheeler transform. Bioinformatics 25, 1754–1760, doi: 10.1093/bioinformatics/btp324 (2009). [DOI] [PMC free article] [PubMed] [Google Scholar]
- 45.Tarasov A, Vilella AJ, Cuppen E, Nijman IJ & Prins P Sambamba: fast processing of NGS alignment formats. Bioinformatics 31, 2032–2034, doi: 10.1093/bioinformatics/btv098 (2015). [DOI] [PMC free article] [PubMed] [Google Scholar]
- 46.McKenna A et al. The Genome Analysis Toolkit: a MapReduce framework for analyzing next-generation DNA sequencing data. Genome Res 20, 1297–1303, doi: 10.1101/gr.107524.110 (2010). [DOI] [PMC free article] [PubMed] [Google Scholar]
- 47.Dobin A et al. STAR: ultrafast universal RNA-seq aligner. Bioinformatics 29, 15–21, doi: 10.1093/bioinformatics/bts635 (2013). [DOI] [PMC free article] [PubMed] [Google Scholar]
- 48.Cibulskis K et al. Sensitive detection of somatic point mutations in impure and heterogeneous cancer samples. Nat Biotechnol 31, 213–219, doi: 10.1038/nbt.2514 (2013). [DOI] [PMC free article] [PubMed] [Google Scholar]
- 49.Kim S et al. Strelka2: fast and accurate calling of germline and somatic variants. Nat Methods 15, 591–594, doi: 10.1038/s41592-018-0051-x (2018). [DOI] [PubMed] [Google Scholar]
- 50.Wang K, Li M & Hakonarson H ANNOVAR: functional annotation of genetic variants from high-throughput sequencing data. Nucleic Acids Res 38, e164, doi: 10.1093/nar/gkq603 (2010). [DOI] [PMC free article] [PubMed] [Google Scholar]
- 51.Blokzijl F, Janssen R, van Boxtel R & Cuppen E MutationalPatterns: comprehensive genome-wide analysis of mutational processes. Genome Med 10, 33, doi: 10.1186/s13073-018-0539-0 (2018). [DOI] [PMC free article] [PubMed] [Google Scholar]
- 52.Cheng DT et al. Memorial Sloan Kettering-Integrated Mutation Profiling of Actionable Cancer Targets (MSK-IMPACT): A Hybridization Capture-Based Next-Generation Sequencing Clinical Assay for Solid Tumor Molecular Oncology. J Mol Diagn 17, 251–264, doi: 10.1016/j.jmoldx.2014.12.006 (2015). [DOI] [PMC free article] [PubMed] [Google Scholar]
- 53.Cancer Genome Atlas Research, N. Comprehensive molecular profiling of lung adenocarcinoma. Nature 511, 543–550, doi: 10.1038/nature13385 (2014). [DOI] [PMC free article] [PubMed] [Google Scholar]
- 54.Patro R, Duggal G, Love MI, Irizarry RA & Kingsford C Salmon provides fast and bias-aware quantification of transcript expression. Nat Methods 14, 417–419, doi: 10.1038/nmeth.4197 (2017). [DOI] [PMC free article] [PubMed] [Google Scholar]
- 55.Bullard JH, Purdom E, Hansen KD & Dudoit S Evaluation of statistical methods for normalization and differential expression in mRNA-Seq experiments. BMC Bioinformatics 11, 94, doi: 10.1186/1471-2105-11-94 (2010). [DOI] [PMC free article] [PubMed] [Google Scholar]
- 56.Subramanian A et al. Gene set enrichment analysis: a knowledge-based approach for interpreting genome-wide expression profiles. Proc Natl Acad Sci U S A 102, 15545–15550, doi: 10.1073/pnas.0506580102 (2005). [DOI] [PMC free article] [PubMed] [Google Scholar]
- 57.Reich M et al. GenePattern 2.0. Nat Genet 38, 500–501, doi: 10.1038/ng0506-500 (2006). [DOI] [PubMed] [Google Scholar]
- 58.Love MI, Huber W & Anders S Moderated estimation of fold change and dispersion for RNA-seq data with DESeq2. Genome Biol 15, 550, doi: 10.1186/s13059-014-0550-8 (2014). [DOI] [PMC free article] [PubMed] [Google Scholar]
- 59.Chen J, Bardes EE, Aronow BJ & Jegga AG ToppGene Suite for gene list enrichment analysis and candidate gene prioritization. Nucleic Acids Res 37, W305–311, doi: 10.1093/nar/gkp427 (2009). [DOI] [PMC free article] [PubMed] [Google Scholar]
- 60.Ji H et al. LKB1 modulates lung cancer differentiation and metastasis. Nature 448, 807–810, doi: 10.1038/nature06030 (2007). [DOI] [PubMed] [Google Scholar]
- 61.Yamamoto K et al. Autophagy promotes immune evasion of pancreatic cancer by degrading MHC-I. Nature 581, 100–105, doi: 10.1038/s41586-020-2229-5 (2020). [DOI] [PMC free article] [PubMed] [Google Scholar]
- 62.Stark JM, Pierce AJ, Oh J, Pastink A & Jasin M Genetic steps of mammalian homologous repair with distinct mutagenic consequences. Mol Cell Biol 24, 9305–9316, doi: 10.1128/MCB.24.21.9305-9316.2004 (2004). [DOI] [PMC free article] [PubMed] [Google Scholar]
Associated Data
This section collects any data citations, data availability statements, or supplementary materials included in this article.


