Abstract
Objective
To examine associations between neighborhood socioeconomic status (nSES) and 90-day poststroke outcomes.
Methods
The Brain Attack Surveillance in Corpus Christi Project is a population-based surveillance study in Nueces County, Texas. Patients with strokes were identified between 2010 and 2016 via active and passive surveillance and enrolled in the study. nSES index is a standardized composite of 2010 Census tract–level income, wealth, education, and employment (median −4.56, interquartile range −7.48 to −0.46). The 90-day outcomes were ascertained via interview: functional status measured by the average of 22 activities of daily living/instrumental activities of daily living (range 1–4), biopsychosocial health by the Stroke-Specific Quality of Life scale (range 0–5), and depressive symptoms by the 8-item Patient Health Questionnaire (range 0–24). Associations between nSES and outcomes were estimated using confounder-adjusted generalized estimating equations with an nSES × NIH Stroke Scale score interaction term.
Results
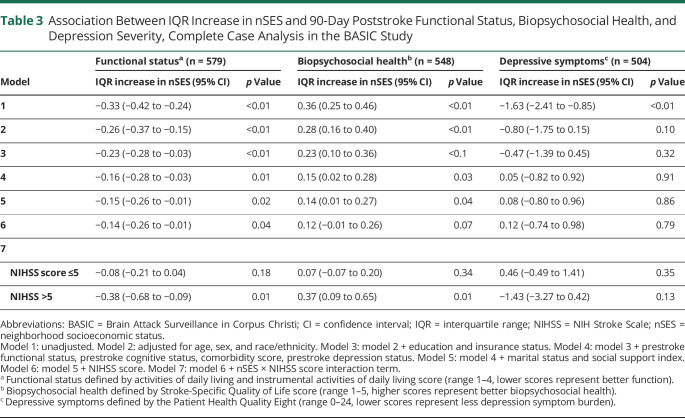
Seven hundred seventy-six survivors made up the analytical sample (52.96% male, 62.24% Mexican American, 52.96% ≥64 years old). Higher compared to lower nSES (mean difference comparing 75th to 25th percentile of nSES) was associated with better function (−0.27, 95% confidence interval [CI] −0.49 to −0.05), better biopsychosocial health (0.26, 95% CI 0.06–0.47), and fewer depressive symptoms (−1.77, 95% CI −3.306 to −0.48) among those with moderate to severe strokes. Among those with minor strokes, higher nSES was associated with better function (−0.13, 95% CI −0.24 to −0.02).
Conclusions
nSES may influence poststroke recovery. Studies should identify neighborhood characteristics that contribute to poststroke outcomes, particularly in moderate to severe stroke survivors.
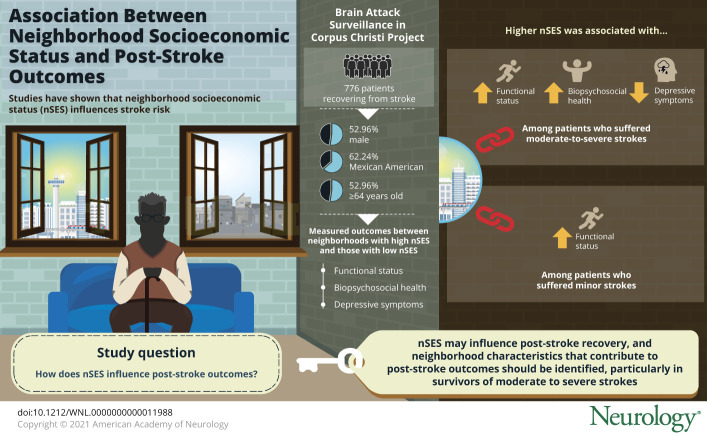
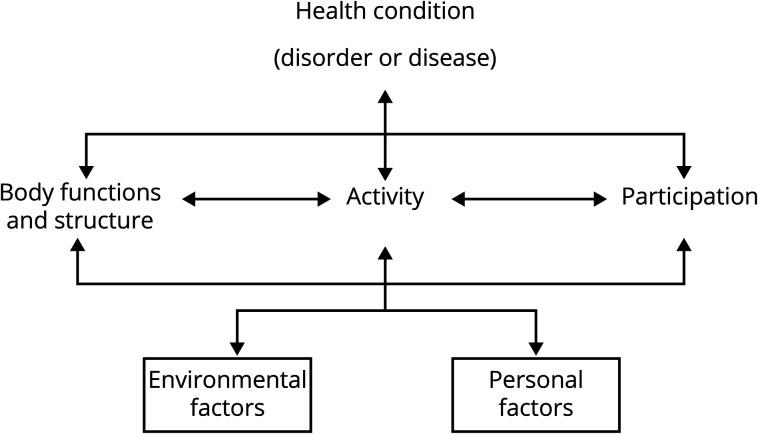
Stroke is a leading cause of long-term functional impairment in the United States.1 By 2050, the prevalence of stroke is expected to more than double as the US population ages.2 Consequently, the number of stroke survivors living with functional impairment will increase significantly.2 Given the public health importance and high prevalence of strokes, multiple medical, psychosocial, and physical predictors of poststroke disability and quality of life have been elucidated.3 As theorized by the World Health Organization's International Classification of Functioning, Disability, and Health (ICF) (figure 1), poststroke disability is a function of the interactions between individual impairment and the surrounding built and social environment.4 Among studies examining the effects of the neighborhood environment on disablement, a wide variety of neighborhood characteristics have been associated with self-reported disability independently of individual person-level characteristics. One key feature is neighborhood socioeconomic status (nSES).5
Figure 1. World Health Organization's International Classification of Functioning, Disability, and Health Theoretical Framework4.
Studies have shown that living in a lower-nSES neighborhood is associated with higher incidence of stroke6,7 and mortality after stroke.8 However, there is limited research examining neighborhood effects on stroke-related participation restrictions (i.e., disability) and nonmortality outcomes.9-11 The few existing studies have been limited by possible selection bias from differential attrition, have not accounted for prestroke health and functioning states, and have examined only 1 poststroke outcome. Furthermore, it is largely unknown how stroke severity might influence the relationship between nSES and poststroke outcomes. Ignoring the dynamic relationship between neighborhoods and individual functioning could mask true associations and lead to biased conclusions.
Initial stroke severity has been shown to be highly predictive of functional recovery after stroke independent of individual demographic factors.12 Therefore, we expect that among people for whom initial impairments after stroke are minimal, neighborhood associated barriers to recovery such as lower social cohesion and poorer built environments will affect recovery less. We expect that as severity of stroke increases and life space decreases,13 the trajectory of recovery may be more influenced by the neighborhood environment. In other words, as individuals' functioning declines and the space in which they inhabit constricts, barriers and facilitators within their proximate environments will have greater influence on functional recovery.
This study examines the overall association between nSES and multiple clinically relevant patient-reported stroke outcomes in a population-based cohort study with comprehensive adjustment for individual-level confounders and the differential effects of nSES on poststroke patient-reported outcomes depending on initial stroke severity. We hypothesize that higher nSES is associated with better 90-day mental health, functional status, and biopsychosocial health and that these associations are most pronounced in those with moderate to severe strokes compared to individuals with mild strokes.
Methods
Study Population
Participants were identified from the Brain Attack Surveillance in Corpus Christi (BASIC) Project, for which detailed methods have been previously described.14 Briefly, the BASIC Project is a population-based stroke surveillance study among individuals ≥45 years of age in a biethnic community in Nueces County, Texas. As of April 2010, there were an estimated 340,223 people in the county. Roughly 12% of the population were ≥65 years old; 50.9% were female; and 60.6% were Mexican American.15 Stroke cases were identified via both active and passive surveillance between 2010 and 2016, with details found elsewhere.16 This study was limited to participants with incident strokes (hemorrhagic and ischemic) to avoid confounding by prior stroke outcomes and treatments; who identified as non-Hispanic White or Mexican American (other racial-ethnic groups excluded due to small sample size); who were living in a noninstitutionalized setting before stroke; who agreed to participate in the interview portion of the BASIC project; and who survived through 90 days after the stroke.
Baseline interviews with a proxy—a close friend or relative—were completed if participants were unable to communicate or to answer cognitive orientation questions shortly after stroke.16,17 Prestroke depression status was not collected in these proxy baseline interviews. Therefore, participants with proxy baseline interviews were excluded from the analytic sample.17
Main Exposure
To capture socioeconomic status at the neighborhood level, nSES was calculated according to the participant's Census tract of residence at the time of their stroke. Participant addresses were abstracted from medical records and geocoded. The geocoded addresses were then linked to 2010 US Census tracts. A summary index of nSES constructed in previous research18 was calculated from 6 Census variables representing wealth/income, education, and occupation: (1) log of median household income; (2) log of median value of owner-occupied housing units; (3) proportion of households receiving interest, dividend, or net rental income; (4) proportion of adults ≥25 years of age with a high school diploma; (5) proportion of adults ≥25 years of age with a college degree; and (6) proportion of people employed in executive, managerial, or professional occupations.7,19 Each variable was standardized across every Census tract within the US to allow comparability across studies. The nSES index was created by summing variable z scores, where increasing values of the nSES index represents favorable neighborhood environments with greater wealth/income, education, and occupation. The measure is an established neighborhood marker of the amount of flexible resources available within a neighborhood, affecting outcomes through multiple mechanisms. Thus, a higher nSES measure represents protective contextual effects of the Census tract socioeconomic environment.19
90-Day Outcome Measures
Functional status was determined by averaging the score of a 22-item questionnaire designed to assess 7 activities of daily living (ADL) and 15 instrumental ADL (IADL). Respondents self-reported their level of difficulty with each ADL/IADL task using an ordered scale: 1 (no difficulty), 2 (some difficulty), 3 (a lot of difficulty), and 4 (can only do with help). Responses were then summed across all 22 items and divided by the number of items, resulting in a score range of 1 to 4.16 The variable was treated as continuous, with lower scores representing better functioning.
Self-reported biopsychosocial health was assessed with the 12-item Stroke-Specific Quality of Life (SS-QOL) scale.20 The 12-item questionnaire is a patient-centered, stroke-specific measure, which has been previously validated in the study population.20 Scores across the domains were averaged to yield a composite average, with higher scores representing better biopsychosocial health (range 1–5).
Respondents self-reported depressive symptoms using the Patient Health Questionnaire Eight (PHQ-8).17 This is equivalent to the PHQ-9 except with the response for item 9 on suicide or self-harm removed. Details on the scale can be found elsewhere.21 The score was treated as a continuous measure, with lower scores representing fewer depressive symptoms (range 0–24).
Covariates
Variables were obtained from baseline interviews completed at the time of stroke or abstracted from medical records. Variables from the baseline interview included race-ethnicity (non-Hispanic White or Mexican American), marital status (married/living together or single/widow/divorced), social support (7-item scale),22 educational attainment to capture individual socioeconomic status23 (less than completion of high school, completion of high school to some post–high school education, or completion of at least 4 years of college), prestroke functional status, prestroke cognitive status, and prestroke depressions status (no history of depression, history of depression or antidepressant use at time of stroke). Social support was captured via self-report. Participants were asked 7 questions focused on loneliness, finding help when sick, ability to seek advice, trust, support at home, and family support. Each item was scored from 1 (never/rarely) to 3 (always). The item scores were then summed, and 7 was subtracted from the summed score, yielding a final score of 0 to 14, with higher scores indicating more social support. Prestroke function was measured with the modified Rankin Scale. The resultant score was categorized as 0 to 1, 2 to 3, and ≥4 (only 38 individuals had scores of 4 or 5, and thus these categories were combined), with higher scores representing worse function. The Informant Questionnaire on Cognitive Decline in the Elderly was used to assess prestroke cognitive status, with scores averaged across the 16-item questionnaire, resulting in a range of scores from 1 to 5 (higher scores indicate worse cognition).
Variables from the medical record included age, sex, insurance status (yes or no), comorbidity score, and NIH Stroke Scale (NIHSS) score. Comorbidity score was created by summing the following individual risk factors and comorbid conditions: cancer, chronic obstructive pulmonary disease, dementia, heart failure, Parkinson disease, end-stage renal disease, amyotrophic lateral sclerosis, epilepsy, myocardial infarction or coronary artery disease, hyperlipidemia, diabetes, atrial fibrillation, current smoker, and current excessive alcohol use. NIHSS score was abstracted from the medical record or calculated with a validated method.24 Given the nonlinear association of the score with most outcomes, NIHSS score was categorized into 2 groups—mild strokes (NIHSS score ≤5) vs moderate to severe strokes (NIHSS score >5)—predictive of acute rehabilitation destination, a marker for rehabilitation potential.25,26
Analytical Strategy
For the 77 Census tracts with stroke cases in this study, medians and interquartile ranges were calculated for each of the neighborhood-level variables. Median and interquartile range of the nSES score among stroke cases were calculated by ethnicity, sex, and age group. The median and interquartile range of nSES, ADL/IADL score, PHQ-8 score, and SS-QOL score were graphed within each Census tract using packages implemented in R version 3.6.2 (R Project for Statistical Computing, Vienna, Austria) and run in RStudio version 1.2.5033. Differences were assessed with the χ2 and analysis of variance tests. The associations between nSES and 90-day ADL/IADL, PHQ-8, and SS-QOL scores were assessed with generalized estimating equations with the identity link function and exchangeable working correlation structure to account for the clustering of observations within neighborhoods and potential nonnormality of the PHQ-8 measures.27 The linearity of the nSES variable was confirmed for all 90-day outcome measures through the use of marginal residuals.
To account for missing data due to nonparticipation of baseline interview, baseline interview completed by a proxy, and incompletion of 90-day outcome interview, we used an inverse probability weighting approach in combination with chained multiple imputation.17 Inverse probability weighting was used to upweight participants in the final analytical sample who were similar to those excluded due to no participation of baseline interview, baseline interview being completed by a proxy, or incomplete 90-day outcome interview by nonproxy. Chained multiple imputation was used to impute the remaining missing data: 18 participants (2.23%) had missing values for insurance status; 1 patient had a missing value for marital status (0.12%); 1 patient had a missing value for education level (0.12%); 84 participants had missing values for prestroke depression (10.66%); 16 had missing values for modified Rankin Scale score (2.03%); 131 had missing values for prestroke cognitive status (16.62%); 3 had missing values for NIHSS score (0.38%); 4 had missing values for body mass index (0.51%); and 40 had missing values for social support (5.07%). Among the 304 individuals who were excluded from the analytical sample for having baseline proxy interviews, only 64 individuals had complete follow-up data, making a sensitivity analysis with their inclusion not beneficial in demonstrating any potential selection bias.
The association of nSES with each of the outcomes was sequentially assessed. In models 1 and 2, the unadjusted and demographic factor–adjusted (age, sex, and ethnicity) nSES effects were examined. The third model (model 3) additionally adjusted for individual socioeconomic status by including education and insurance status. The fourth model (model 4) additionally adjusted for individual-level prestroke medical-functional status by including prestroke cognition, prestroke depression status, prestroke functional status, and comorbidity score. The fifth (model 5) additionally adjusted for prestroke social support and marital status. The sixth model (model 6) additionally adjusted for NIHSS score given the potential for stroke severity to be on the pathway between nSES and stroke outcomes. In the seventh and last model (model 7), an nSES × NIHSS interaction was included included to explore whether the associations of nSES with the outcomes varied by stroke severity. A priori, a value of p = 0.15 was set to determine the presence of effect modification, consistent with recommendations in the literature.28
Due to potential heterogeneity of effect among those with moderate to severe strokes, a sensitivity analysis was conducted excluding those with severe strokes (NIHSS score  14). Statistical analyses were completed with SAS (SAS Institute, Inc, Cary, NC).
Standard Protocol Approvals, Registrations, and Patient Consents
The BASIC study was approved by the Institutional Review boards at the University of Michigan and the 2 local hospital systems. Written informed consent was obtained from all patients.
Data Availability
The data will not be made publicly available because of the restricted nature of the data.
Results
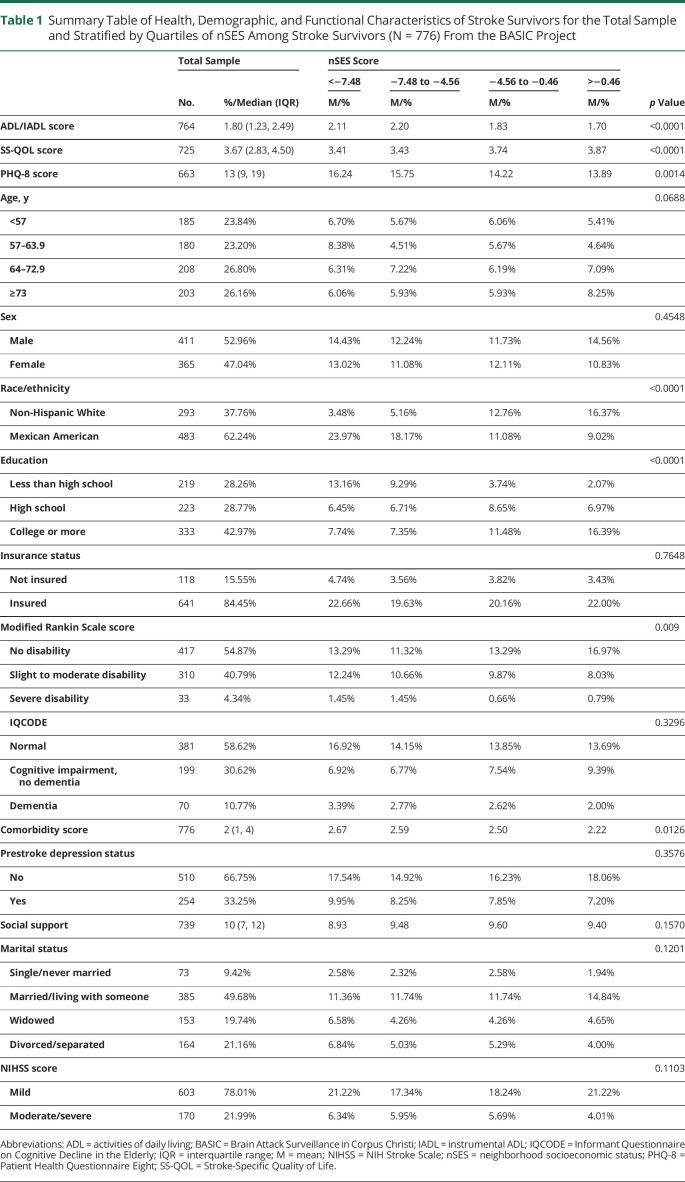
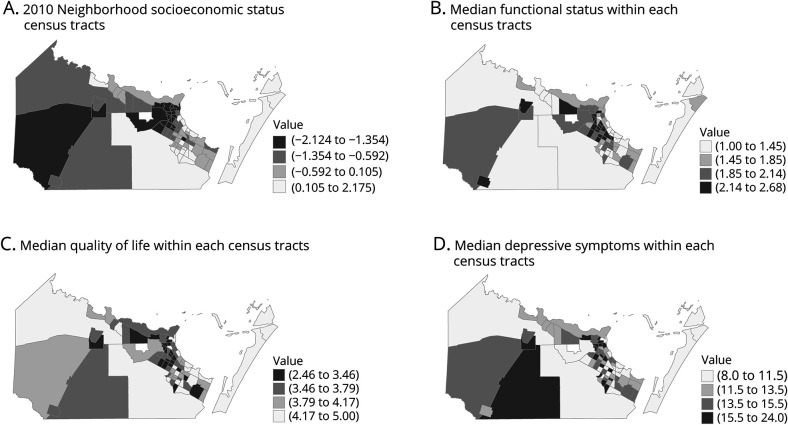
Figure 2 displays the development process of our analytic sample. Among the final analytic of 776 individuals, only 48 individuals were monolingual Spanish speakers. As shown in figure 2, a total of 1,962 participants within the BASIC cohort survived 90 days after stroke and identified as non-Hispanic White or Mexican American. Figure 2 depicts reasons for exclusion and derivation of our final analytical sample composed of 776 individuals living in 77 Census tracts. Among the 776 individuals, the median nSES was −4.56 with an interquartile range from −7.48 to −0.46. Descriptive statistics of the study sample are presented in table 1. Approximately half of participants were male, were married, had attended college or more, and reported no prestroke disability. A greater proportion of the study sample identified as Mexican American, had medical insurance, did not have prestroke depression, and had a mild stroke according to the NIHSS score. Those living in neighborhoods with worse nSES indexes were more likely to be Mexican American, to have less education, and to have a higher comorbidity score. To facilitate comparison of Census tracts, figure 3 shows the relative nSES by quartile for each Census tract within Nueces County, along with median outcome values by quartile. In all of the maps, lighter shading implies a better value: higher nSES, better poststroke functional status, better poststroke biopsychosocial health, and fewer depressive symptoms.
Figure 2. Study Flowchart Using the BASIC Study, United States, 2010 to 2016.
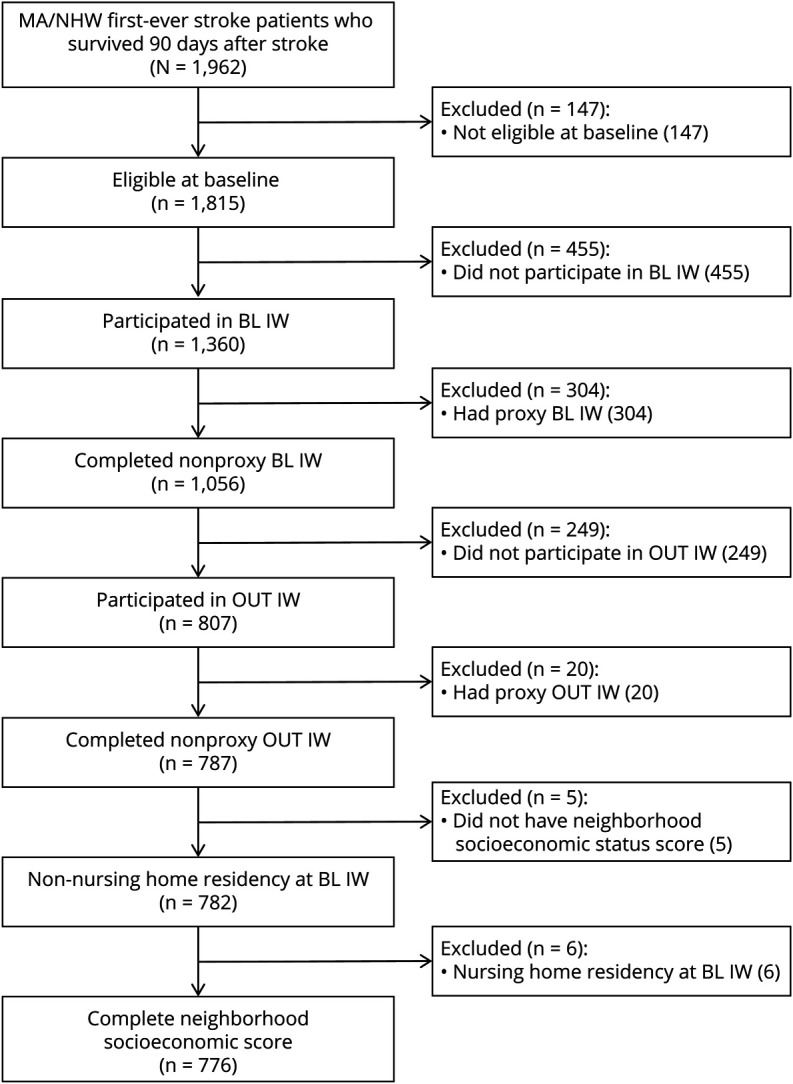
BASIC = Brain Attack Surveillance in Corpus Christi; BL IW = baseline interview; MA = Mexican Americans; NHW = non-Hispanic White individuals; and OUT IW = outcome interview.
Table 1.
Summary Table of Health, Demographic, and Functional Characteristics of Stroke Survivors for the Total Sample and Stratified by Quartiles of nSES Among Stroke Survivors (N = 776) From the BASIC Project
Figure 3. Maps of nSES and 90-Day Poststroke Outcomes Within 77 Census Tracts.
Maps of the 77 Census tracts were stroke cases reside in the Brain Attack Surveillance in Corpus Christi (BASIC) Project. (A) Relative neighborhood socioeconomic status (nSES) by quartile for each Census tract within the county of origin. (B–D) Median functional status, biopsychosocial health, and depressive symptoms by quartile. In all maps, lighter shading implies a better value: higher nSES, better poststroke functional status, better poststroke biopsychosocial health, and fewer depressive symptoms.
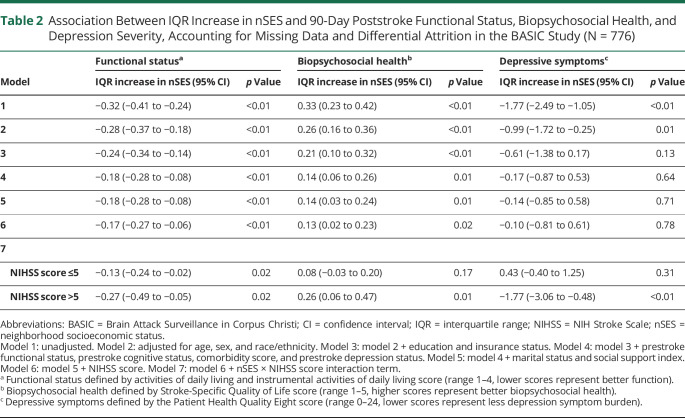
Table 2 presents the sequentially adjusted associations of nSES with ADL/IADL score (range 1–4), SS-QOL score (range 1–5), and PHQ-8 score (range 0–24). Associations are presented as an interquartile range difference in nSES to facilitate a comparison of high- and low-nSES neighborhoods. In the unadjusted model, a higher nSES (comparing 75th and 25th percentiles) was associated with a 0.32 better ADL/IADL score (95% confidence interval [CI] −0.41 to −0.24), 0.33 better (95% CI 0.23–0.42) SS-QOL score, and 1.77 lower (95% CI −2.49 to −1.05) PHQ-8 score. These associations persisted after adjustment for all individual-level covariates (models 2–5), with the association between nSES and PHQ-8 score greatly attenuated after adjustment for demographic and individual-level socioeconomic factors. In model 6, the effect estimates for an NIHSS score >5 compared to NIHSS score ≤5 was 0.31 (95% CI 0.17–0.44, p < 0.01), −0.36 (95% CI −0.51 to −0.21, p < 0.01), and 0.94 (95% CI −0.23 to 2.12, p = 0.12) for the association with ADL/IADL, SS-QOL, and PHQ-8 score, respectively.
Table 2.
Association Between IQR Increase in nSES and 90-Day Poststroke Functional Status, Biopsychosocial Health, and Depression Severity, Accounting for Missing Data and Differential Attrition in the BASIC Study (N = 776)
Figure 4 displays the combined effects of nSES and NIHSS score on ADL/IADL, SS-QoL, and PHQ-8 scores. Stroke severity significantly modified the association between nSES and PHQ-8 score (model 7, table 2) and SS-QOL score (model 7, table 2). Among those with moderate to severe strokes, nSES was significantly associated with fewer depressive symptoms (−1.77, 95% CI −3.06 to −0.48) and improved biopsychosocial health (0.26, 95% CI 0.06–0.47). There was no significant association between nSES and depressive symptoms or biopsychosocial health among those with mild strokes. Stroke severity also appears to modify the relationship between nSES and ADL/IADL score, with the strength of association between nSES and functional status being greater among those with moderate to severe strokes (−0.27, 95% CI −0.49 to −0.05) compared to those with mild strokes (−0.13, 95% CI −0.24 to −0.02), although the interaction did not reach statistical significance (p = 0.2429).
Figure 4. IQR Difference in nSES and 90-Day Poststroke Outcomes by Stroke Severity.
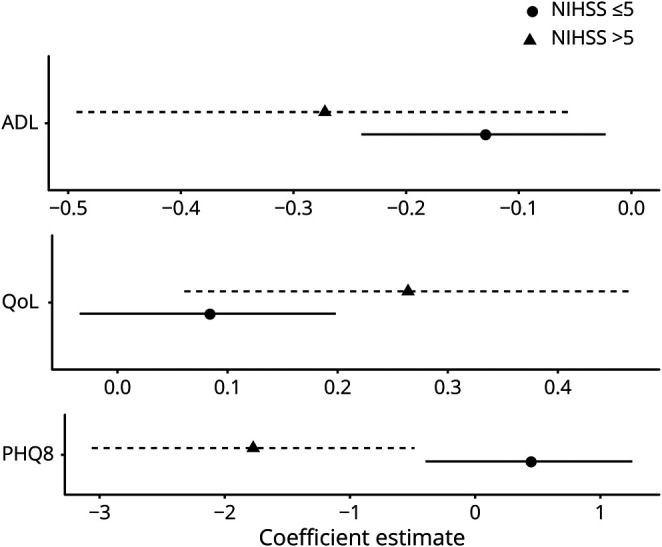
Association between interquartile range (IQR) difference in neighborhood socioeconomic status (nSES) and 90-day poststroke functional status, biopsychosocial health, and depressive symptoms by stroke severity. Effect estimates are adjusted for age, sex, race/ethnicity, education, insurance status, prestroke functional status, prestroke cognitive status, comorbidity score, prestroke depression status, marital status, and social support index. Estimates account for missing data and differential attrition in the Brain Attack Surveillance in Corpus Christi (BASIC) study (N = 766). ADL = activities of daily living; NIHSS = NIH Stroke Scale; PHQ8 = Patient Health Quality Eight; QoL = quality of life.
With respect to all outcomes, adjusting for stroke severity (model 6) did not significantly change the associations of nSES with the 3 outcomes. In our sensitivity analyses excluding those with severe strokes (NIHSS score ≥14), the effect estimates were largely unchanged in the final model, and statistical significance did not differ (results not shown). In our complete case analysis (table 3), there were significant interactions between nSES and NIHSS score with respect to poststroke functional status and biopsychosocial health but not with respect to depressive symptoms. The associations between nSES and ADL/IADL and SS-QOL scores were more pronounced among those with moderate to severe stroke in the complete case analyses, although the direction of effects was the same.
Table 3.
Association Between IQR Increase in nSES and 90-Day Poststroke Functional Status, Biopsychosocial Health, and Depression Severity, Complete Case Analysis in the BASIC Study
Discussion
This study examined the association of nSES with 90-day poststroke functional status, depressive symptoms, and biopsychosocial health in a population-based cohort study, as well as the role of stroke severity in modifying these associations. Residence in areas with higher nSES was associated with significantly better poststroke functional status and biopsychosocial health when all stroke survivors were analyzed as 1 group. Higher nSES was associated with significantly fewer poststroke depressive symptoms in those with moderate to severe strokes but not in those with mild strokes. The impact of nSES on biopsychosocial health and functional status was also more prominent among those with moderate to severe strokes. Our results suggest that those living in lower-nSES neighborhoods and with moderate to severe strokes were most susceptible to poor outcomes.
The present study adds to current understanding of how socioenvironmental factors influence stroke outcomes in 4 major ways: (1) estimating the association between nSES and multiple dimensions of poststroke health among survivors in a population-based study after adjusting for multiple individual-level confounders not accounted for in prior studies, (2) taking a causal approach to account for differential attrition to minimize selection bias, (3) testing the interaction between personal and environmental factors as theorized in the ICF,4 and (4) exploring whether stroke severity mediates associations between nSES and outcomes. This study empirically demonstrates the role of environmental factors (i.e., nSES) and personal factors (i.e., NIHSS score) on functioning as theorized by the ICF (figure 1). We observed that nSES affects a variety of outcomes among all stroke survivors, although most prominently in those with moderate to severe strokes. The identified role of nSES on poststroke 90-day outcomes has potential implications for policy and clinical practice. Both clinicians and policy makers should be cognizant that those who bear the dual burden of more severe strokes and residence in worse socioenvironmental conditions are at greater risk for poor outcomes. Integrating information on a patient's neighborhood context within the demographic information in the medical chart would assist with hospital discharge and disposition planning. Research into how nSES affects discharge location (e.g., home, skilled nursing facility, acute inpatient rehabilitation) would also be informative in identifying disparities in postacute care by nSES. Future studies should also aim to delineate what specific aspects of low-nSES neighborhoods contribute to worse poststroke outcomes to more effectively intervene.
This study empirically demonstrates an interaction between stroke severity (i.e., body functions and structure) and neighborhood economic characteristics (i.e., environmental factors), as theorized by the ICF (figure 1). We observed effect modification (also known as moderation) by stroke severity on the relationship between nSES and multiple 90-day poststroke outcomes, suggesting that stroke survivors with moderate to severe strokes may be more vulnerable to facilitators and barriers within the surrounding neighborhood environment. Those with mild stroke severity may be less affected by nSES because their “distance” to recovery is smaller, and functional recovery can occur independently of neighborhood surroundings.29 Individuals with moderate to severe strokes may have more constricted life spaces with less ability to leave their neighborhoods and proximate surroundings, resulting in limited access to spaces in the neighborhood and restriction of participation in community gatherings.13,30 Consequently, those with more severe strokes are likely more susceptible to poorer social and physical organization of their communities and hence are less engaged in prorecovery social and physical activity.5 This is supported by research finding that the presence of meaningful destinations within the community facilitated stroke survivors’ travel outdoors31 and that the presence of barriers in the built environment is a detriment to reintegration to the community after stroke.32
While nSES seemed to affect outcomes more prominently among those with moderate to severe strokes, the nSES and NIHSS score interaction was most salient with respect to poststroke depressive symptom burden. This is consistent with prior findings on associations between nSES and depression.33 It may be that stroke survivors with moderate to severe strokes in low-nSES communities are at risk for increased social isolation, a strong risk factor for depression—a difficult poststroke complication affecting about one-third of survivors, often leading to lack of independence.34 In addition to less social cohesion, other potential contributors to our finding include more noise pollution, fewer public spaces, and poorer features of the built environment.33
We found that the associations between nSES and 90-day poststroke outcomes were not largely affect by the inclusion of NIHSS score adjustment to the models, suggesting that stroke severity is not mediating the observed associations. While a formal causal-mediation analysis is needed to confirm these findings, our results suggest that the mechanism through which nSES is associated with poststroke outcomes is not via more severe stroke. In other words, nSES does not seem to lead to worse strokes, which subsequently leads to worse outcomes. This is supported by a growing body of literature suggesting that neighborhood context significantly influences poststroke outcomes beyond individual-level factors.11 Low-nSES environments have lower levels of perceived safety,35 fewer physical activity facilities,36,37 poorer walking environments,38 and lower social cohesion.39 These neighborhood factors are likely relevant in the recovery process after a sudden and dramatic change in life state that occurs after a stroke.
In addition to poorer built and social environmental factors, stroke survivors returning to low-nSES neighborhoods may be less likely to have access to posthospitalization care coordination and support services.40,41 This may explain previous findings of more frequent, complicated posthospitalization health care transitions among marginalized populations and our findings of worse nonmortality outcomes in low-nSES environments. Multiple studies suggest that improved access to support and navigational services in stroke survivors returning home leads to improved community reintegration and improved nonmortality outcomes.42,43 While trials have been completed to examine the effectiveness of poststroke care coordination at improving secondary poststroke risk factor management in marginalized populations, similar trials are needed to examine their role in patient-reported poststroke rehabilitation and quality of life outcomes, especially for those returning to low-nSES environments.44
While this study was not designed to explore the role of nSES in poststroke disparities between Mexican Americans and non-Hispanic White individuals, we did find that Mexican Americans were significantly more likely to reside in low-nSES neighborhoods. Future research studies should examine the extent to which low-nSES environments—a possible component of structural racism—contribute to known poststroke disparities between Mexican American and non-Hispanic White individuals.16
This study also has a number of important limitations. Results may not be generalizable to geographic areas with dissimilar climates45 or populations with a different composition of urbanicity.46 This study did not account for whether individuals moved between days 0 and 90 after stroke. However, residential mobility after 35 years of age and within Nueces County is low; it is unlikely that our effect estimates are biased due to moving in our sample.47,48 This study does not account for postacute care among study participants. However, we did account for stroke severity, a critical individual level predictor of poststroke outcomes. We were not able to distinguish between those who were institutionalized and those who were not at 90 days among the whole study sample. Among participants with information about 90-day residency, only 4.1% were institutionalized. We hypothesize that this would bias our results toward the null, especially among those with moderate to severe strokes, because those in nursing homes or skilled nursing facilities at 90 days are unlikely to be affected by their neighborhood surroundings. We used Census tracts as the geographic boundaries to measure nSES. It is possible that a more proximal definition of neighborhood may better capture the idealized exposure of neighborhood context and nSES within this population of stroke survivors. We used 2010 Census data to develop the nSES index. It may be that there were significant changes in neighborhoods between 2010 and 2016, which our nSES exposure did not capture. However, we hypothesize that this possible measurement error would not differ by either our exposure or outcomes and hence bias our results toward the null. There may be heterogeneity of effect among those with moderate to severe strokes. However, after sensitivity analyses excluding severe stroke cases (NIHSS score  14) were conducted, the observed relationships between nSES and 90-day poststroke outcomes were unchanged. Although our consideration of effect modification of the nSES and 90-day poststroke outcomes associations by stroke severity was justified by our a priori hypothesis, our results regarding the presence of effect modification should be interpreted with caution and require replication in other studies. The main effects of nSES were significantly associated with both biopsychosocial health and functional status (p < 0.05), and effect modification was significant (p < 0.05) with respect to poststroke depressive symptoms. As with all observational research, this study is limited by potential unmeasured confounders, specifically with respect to individual-level socioeconomic status. However, education level and insurance status are likely good surrogate markers of individual socioeconomic status.49 Education is often regarded as the best indicator of socioeconomic status because educational attainment is often fixed early in life and problems of reverse causation are less serious.23 In addition, the use of generalized estimating equations accounts for potential clustering effects. Nonetheless, it is possible that we are not fully controlling for individual socioeconomic status.
This study found that nSES was significantly associated with multiple 90-day poststroke outcomes after adjustment for person-level confounders, especially in those with moderate to severe strokes. Future research is needed to identify which factors of nSES are driving the observed associations between neighborhood environments and stroke outcomes and the role of nSES in poststroke disparities. Clinical and policy initiatives aimed at improving stroke survivors' health and quality of life, such as improved poststroke care coordination, should include and address those who have the dual burden of experiencing a more severe stroke and living in a socioeconomically deprived neighborhood.
Glossary
- ADL
activities of daily living
- BASIC
Brain Attack Surveillance in Corpus Christi
- CI
confidence interval
- IADL
instrumental ADL
- ICF
International Classification of Functioning, Disability, and Health
- NIHSS
NIH Stroke Scale
- nSES
neighborhood socioeconomic status
- PHQ-8
Patient Health Questionnaire Eight
- SS-QOL
Stroke-Specific Quality of Life
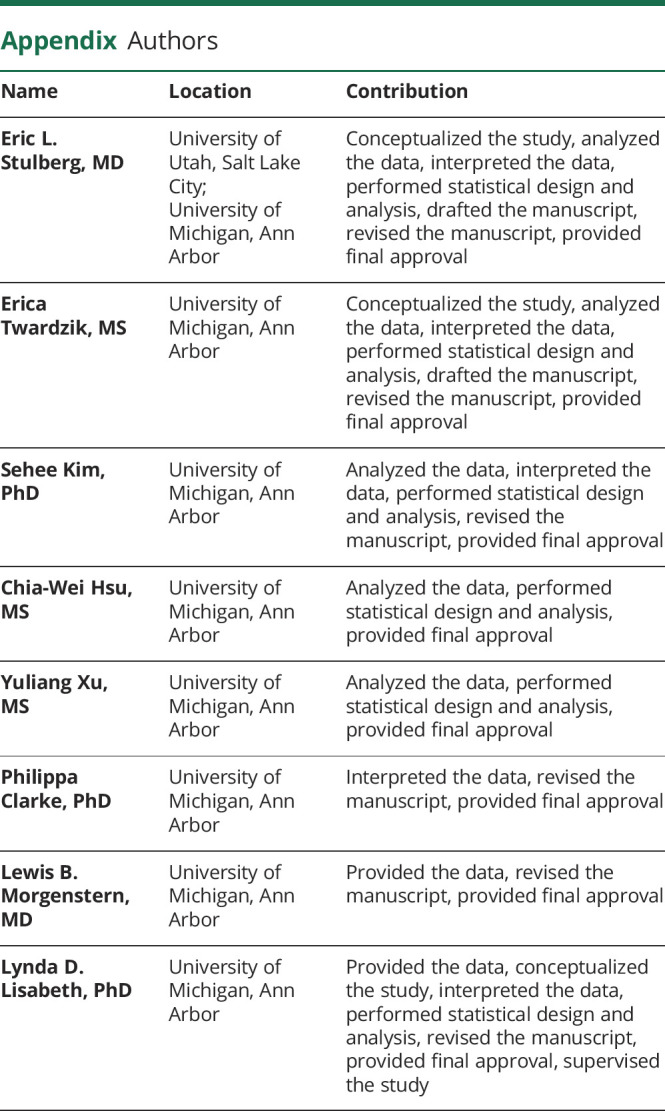
Appendix. Authors
Footnotes
Infographic: http://links.lww.com/WNL/B410
Study Funding
This research project is supported by investigator-initiated grants (R01 NS038916, Lynda Lisabeth and Lewis Morgenstern, MPIs; R01 NS070941, Devin Brown and Lynda Lisabeth, MPIs; and R01 HL098065, Devin Brown and Lynda Lisabeth, MPIs) funded by the National Institute of Neurologic Disorders and Stroke (NINDS) and National Heart, Lung, and Blood Institute (NHLBI), NIH, Department of Health and Human Service. The content is solely the responsibility of the authors and does not necessarily represent the official views of the NINDS/NHLBI. The research reported in this publication was supported (in part or in full) by the Utah Stimulating Access to Research in Residency Transition Scholars under award 1R38HL143605-01. Research reported in this publication was supported by the Eunice Kennedy Shriver National Institute of Child Health & Human Development of the NIH (F31HD098870, Erica Twardzik, PI). The content is solely the responsibility of the authors and does not necessarily represent the official views of the NIH.
Disclosure
Dr. Stulberg, Mrs. Twardzik, Dr. Kim, Mr. Hsu, Ms. Xu, Dr. Clarke, Dr. Morgenstern, and Dr. Lisabeth have no disclosures. Go to Neurology.org/N for full disclosures.
References
- 1.Mozaffarian D, Benjamin EJ, Go AS, et al. Heart disease and stroke statistics–2016 update: a report from the American Heart Association. Circulation. 2016;133(4):e38-360. [DOI] [PubMed] [Google Scholar]
- 2.Howard G, Goff DC. Population shifts and the future of stroke: forecasts of the future burden of stroke. Ann NY Acad Sci. 2012;1268:14-20. [DOI] [PMC free article] [PubMed] [Google Scholar]
- 3.White J, Magin P, Attia J, Sturm J, McElduff P, Carter G. Predictors of health-related quality of life in community-dwelling stroke survivors: a cohort study. Fam Pract. 2016;33(4):382-387. [DOI] [PubMed] [Google Scholar]
- 4.World Health Organization. International Classification of Functioning, Disability and Health 2001. Accessed April 12, 2021. https://cdn.who.int/media/docs/default-source/classification/icf/drafticfpracticalmanual2.pdf?sfvrsn=8a214b01_4. [Google Scholar]
- 5.Beard JR, Blaney S, Cerda M, et al. Neighborhood characteristics and disability in older adults. J Gerontol B Psychol Sci Soc Sci. 2009;64(2):252-257. [DOI] [PMC free article] [PubMed] [Google Scholar]
- 6.Lisabeth LD, Diez Roux AV, Escobar JD, Smith MA, Morgenstern LB. Neighborhood environment and risk of ischemic stroke: the Brain Attack Surveillance in Corpus Christi (BASIC) Project. Am J Epidemiol. 2007;165(3):279-287. [DOI] [PubMed] [Google Scholar]
- 7.Howard VJ, McClure LA, Kleindorfer DO, et al. Neighborhood socioeconomic index and stroke incidence in a national cohort of Blacks and Whites. Neurology. 2016;87(22):2340-2347. [DOI] [PMC free article] [PubMed] [Google Scholar]
- 8.Brown AFL L, Vassar SD, Merkin SS, et al. Neighborhood socioeconomic disadvantage and mortality after stroke. Neurology. 2013;80:520-527. [DOI] [PMC free article] [PubMed] [Google Scholar]
- 9.Rochette JD, Noreau Luc, Annie. Association between personal and environmental factors and the occurrence of handicap situations following a stroke. Disabil Rehabil. 2001;23(13):559-569. [DOI] [PubMed] [Google Scholar]
- 10.Egan M, Kubina L-A, Dubouloz C-J, Kessler D, Kristjansson E, Sawada M. Very low neighbourhood income limits participation post stroke: preliminary evidence from a cohort study. BMC Public Health. 2015;15(1):528. [DOI] [PMC free article] [PubMed] [Google Scholar]
- 11.Twardzik E, Clarke P, Elliott MR, Haley WE, Judd S, Colabianchi N. Neighborhood socioeconomic status and trajectories of physical health-related quality of life among stroke survivors. Stroke. 2019;50(11):3191-3197. [DOI] [PMC free article] [PubMed] [Google Scholar]
- 12.Adams HP Jr, Davis PH, Leira EC, et al. Baseline NIH stroke scale score strongly predicts outcome after stroke: a report of the Trial of Org 10172 in Acute Stroke Treatment (TOAST). Neurology. 1999;53(1):126-131. [DOI] [PubMed] [Google Scholar]
- 13.Nakao M, Izumi S, Yokoshima Y, Matsuba Y, Maeno Y. Prediction of life-space mobility in patients with stroke 2 months after discharge from rehabilitation: a retrospective cohort study. Disabil Rehabil. 2018:1-8. [DOI] [PubMed] [Google Scholar]
- 14.Morgenstern LB, Smith MA, Sanchez BN, et al. Persistent ischemic stroke disparities despite declining incidence in Mexican Americans. Ann Neurol. 2013;74(6):778-785. [DOI] [PMC free article] [PubMed] [Google Scholar]
- 15.Piriyawat P, Šmajsová M, Smith MA, et al. Comparison of active and passive surveillance for cerebrovascular disease: the Brain Attack Surveillance in Corpus Christi (BASIC) Project. Am J Epidemiol. 2002;156(11):1062-1069. [DOI] [PubMed] [Google Scholar]
- 16.Lisabeth LD, Sánchez BN, Baek J, et al. Neurological, functional, and cognitive stroke outcomes in Mexican Americans. Stroke. 2014;45(4):1096-1101. [DOI] [PMC free article] [PubMed] [Google Scholar]
- 17.Dong L, Sánchez BN, Skolarus LE, Morgenstern LB, Lisabeth LD. Ethnic differences in prevalence of post-stroke depression. Circ Cardiovasc Qual Outcomes. 2018;11(2):e004222. [DOI] [PMC free article] [PubMed] [Google Scholar]
- 18.Roux AVD, Merkin SS, Arnett D, et al. Neighborhood of residence and incidence of coronary heart disease. N Engl J Med. 2001;345(2):99-106. [DOI] [PubMed] [Google Scholar]
- 19.Diez Roux A, Kiefe CI, Jacobs DR, et al. Area characteristics and individual-level socioeconomic position indicators in three population-based epidemiologic studies. Ann Epidemiol. 2001;11:395-405. [DOI] [PubMed] [Google Scholar]
- 20.Post MW, Boosman H, Van Zandvoort MM, Passier PE, Rinkel GJ, Visser-Meily JM. Development and validation of a short version of the Stroke Specific Quality of Life Scale. J Neurol Neurosurg Psychiatry. 2011;82(3):283-286. [DOI] [PubMed] [Google Scholar]
- 21.Kroenke K, Strine TW, Spitzer RL, Williams JB, Berry JT, Mokdad AH. The PHQ-8 as a measure of current depression in the general population. J Affective Disord. 2009;114(1-3):163-173. [DOI] [PubMed] [Google Scholar]
- 22.Sharrief AZ, Sanchez BN, Lisabeth LD, et al. The impact of pre-stroke depressive symptoms, fatalism, and social support on disability after stroke. J Stroke Cerebrovasc Dis. 2017;26(11):2686-2691. [DOI] [PMC free article] [PubMed] [Google Scholar]
- 23.Winkleby MA, Jatulis DE, Frank E, Fortmann SP. Socioeconomic status and health: how education, income, and occupation contribute to risk factors for cardiovascular disease. Am J Public Health. 1992;82(6):816-820. [DOI] [PMC free article] [PubMed] [Google Scholar]
- 24.Williams LS, Yilmaz EY, Lopez-Yunez AM. Retrospective assessment of initial stroke severity with the NIH Stroke Scale. Stroke. 2000;31(4):858-862. [DOI] [PubMed] [Google Scholar]
- 25.Marsh EB, Lawrence E, Gottesman RF, Llinas RH. The NIH Stroke Scale has limited utility in accurate daily monitoring of neurologic status. Neurohospitalist. 2016;6(3):97-101. [DOI] [PMC free article] [PubMed] [Google Scholar]
- 26.Schlegel D, Kolb SJ, Luciano JM, et al. Utility of the NIH Stroke Scale as a predictor of hospital disposition. Stroke. 2003;34(1):134-137. [DOI] [PubMed] [Google Scholar]
- 27.Wing JJ, Sanchez BN, Adar SD, et al. Synergism of short-term air pollution exposures and neighborhood disadvantage on initial stroke severity. Stroke. 2017;48(11):3126-3129. [DOI] [PMC free article] [PubMed] [Google Scholar]
- 28.Thiese MS, Ronna B, Ott U. P value interpretations and considerations. J Thorac Dis. 2016;8(9):e928-e931. [DOI] [PMC free article] [PubMed] [Google Scholar]
- 29.Bonita R, Beaglehole R. Recovery of motor function after stroke. Stroke. 1988;19(12):1497-1500. [DOI] [PubMed] [Google Scholar]
- 30.Chau JP, Thompson DR, Twinn S, Chang AM, Woo J. Determinants of participation restriction among community dwelling stroke survivors: a path analysis. BMC Neurol. 2009;9(1):49. [DOI] [PMC free article] [PubMed] [Google Scholar]
- 31.Barnsley L, McCluskey A, Middleton S. What people say about travelling outdoors after their stroke: a qualitative study. Aust Occup Ther J. 2012;59(1):71-78. [DOI] [PubMed] [Google Scholar]
- 32.Hammel J, Jones R, Gossett A, Morgan E. Examining barriers and supports to community living and participation after a stroke from a participatory action research approach. Top Stroke Rehabil. 2006;13(3):43-58. [DOI] [PubMed] [Google Scholar]
- 33.Galea S, Ahern J, Nandi A, Tracy M, Beard J, Vlahov D. Urban neighborhood poverty and the incidence of depression in a population-based cohort study. Ann Epidemiol. 2007;17(3):171-179. [DOI] [PMC free article] [PubMed] [Google Scholar]
- 34.Schmid AA, Kroenke K, Hendrie H, Bakas T, Sutherland J, Williams L. Poststroke depression and treatment effects on functional outcomes. Neurology. 2011;76(11):1000-1005. [DOI] [PMC free article] [PubMed] [Google Scholar]
- 35.Sallis JF, Slymen DJ, Conway TL, et al. Income disparities in perceived neighborhood built and social environment attributes. Health Place. 2011;17(6):1274-1283. [DOI] [PubMed] [Google Scholar]
- 36.Moore LV, Roux AVD, Evenson KR, McGinn AP, Brines SJ. Availability of recreational resources in minority and low socioeconomic status areas. Am J Prev Med. 2008;34(1):16-22. [DOI] [PMC free article] [PubMed] [Google Scholar]
- 37.Powell LM, Slater S, Chaloupka FJ, Harper D. Availability of physical activity–related facilities and neighborhood demographic and socioeconomic characteristics: a national study. Am J Public Health. 2006;96(9):1676-1680. [DOI] [PMC free article] [PubMed] [Google Scholar]
- 38.Kaiser P, Auchincloss AH, Moore K, et al. Associations of neighborhood socioeconomic and racial/ethnic characteristics with changes in survey-based neighborhood quality, 2000-2011. Health Place. 2016;42:30-36. [DOI] [PMC free article] [PubMed] [Google Scholar]
- 39.Friedman D, Parikh NS, Giunta N, Fahs MC, Gallo WT. The influence of neighborhood factors on the quality of life of older adults attending New York City senior centers: results from the Health Indicators Project. Qual Life Res. 2012;21(1):123-131. [DOI] [PubMed] [Google Scholar]
- 40.Broderick JP, Abir M. Transitions of care for stroke patients: opportunities to improve outcomes. Circ Cardiovasc Qual Outcomes. 2015;8(6 suppl 3):S190–S2. [DOI] [PubMed] [Google Scholar]
- 41.Skolarus LE, Burke JF. Towards an understanding of racial differences in post-stroke disability. Curr Epidemiol Rep. 2015;2(3):191-196. [DOI] [PMC free article] [PubMed] [Google Scholar]
- 42.Egan M, Anderson S, McTaggart J. Community navigation for stroke survivors and their care partners: description and evaluation. Top Stroke Rehabil. 2010;17(3):183-190. [DOI] [PubMed] [Google Scholar]
- 43.Kitzman P, Hudson K, Sylvia V, Feltner F, Lovins J. Care coordination for community transitions for individuals post-stroke returning to low-resource rural communities. J Community Health. 2017;42(3):565-572. [DOI] [PMC free article] [PubMed] [Google Scholar]
- 44.Towfighi A, Cheng EM, Ayala-Rivera M, et al. Randomized controlled trial of a coordinated care intervention to improve risk factor control after stroke or transient ischemic attack in the safety net: Secondary Stroke Prevention by Uniting Community and Chronic Care Model Teams Early to End Disparities (SUCCEED). BMC Neurol. 2017;17(1):1-20. [DOI] [PMC free article] [PubMed] [Google Scholar]
- 45.Chu SY, Cox M, Fonarow GC, et al. Temperature and precipitation associate with ischemic stroke outcomes in the United States. J Am Heart Assoc. 2018;7(22):e010020. [DOI] [PMC free article] [PubMed] [Google Scholar]
- 46.Bellinger J, Chen Z, Glover S, Jones K, Bennett K, Probst J. Post-discharge Rehabilitation Care Delivery for Rural Medicare Beneficiaries with Stroke. 2015. Accessed April 12, 2021. https://www.ruralhealthresearch.org/mirror/6/605/%2813-2%29Post_Stroke_Discharge.pdf. [Google Scholar]
- 47.South SJ, Crowder KD. Residential mobility between cities and suburbs: race, suburbanization, and back-to-the-city moves. Demography. 1997;34(4):525-538. [PubMed] [Google Scholar]
- 48.US Census Bureau. Geographic mobility by selected characteristics in the United States: Nueces County, Texas. In: 2013-2017 American Community Survey 5-Year Estimates. Accessed April 12, 2021. https://www.census.gov/topics/population/migration/data/tables.html.
- 49.Mathur C, Erickson DJ, Stigler MH, Forster JL, Finnegan JR Jr. Individual and neighborhood socioeconomic status effects on adolescent smoking: a multilevel cohort-sequential latent growth analysis. Am J Public Health. 2013;103(3):543-548. [DOI] [PMC free article] [PubMed] [Google Scholar]
Associated Data
This section collects any data citations, data availability statements, or supplementary materials included in this article.
Data Availability Statement
The data will not be made publicly available because of the restricted nature of the data.


