Abstract
Objective
To test the hypothesis that neighborhood-level disadvantage is associated with longitudinal measures of neurodegeneration and cognitive decline in an unimpaired cohort.
Methods
Longitudinal MRI and cognitive testing data were collected from 601 cognitively unimpaired participants in the Wisconsin Registry for Alzheimer's Prevention Study and the Wisconsin Alzheimer's Disease Research Center clinical cohort. Area Deprivation Index was geospatially determined based on participant residence geocode and ranked relative to state of residence. Linear regression models were fitted to test associations between neighborhood-level disadvantage and longitudinal change in cortical thickness and cognitive test performance. Mediation tests were used to assess whether neurodegeneration and cognitive decline were associated with neighborhood-level disadvantage along the same theoretical causal path.
Results
In our middle- to older-aged study population (mean baseline age 59 years), living in the 20% most disadvantaged neighborhoods (n = 19) relative to state of residence was associated with cortical thinning in Alzheimer signature regions (p = 0.002) and decline in the Preclinical Alzheimer's Disease Cognitive Composite (p = 0.04), particularly the Trail-Making Test, part B (p < 0.001), but not Rey Auditory Verbal Learning Test (p = 0.77) or Story Memory Delayed Recall (p = 0.49) subtests. Associations were attenuated but remained significant after controlling for racial and demographic differences between neighborhood-level disadvantage groups. Cortical thinning partially mediated the association between neighborhood-level disadvantage and cognitive decline.
Conclusions
In this longitudinal study of cognitively unimpaired adults, living in the most highly disadvantaged neighborhoods was associated with accelerated degeneration in Alzheimer signature regions and cognitive decline. This study provides further evidence for neighborhood-level disadvantage as a risk factor for preclinical neurodegeneration and cognitive decline in certain populations. Limitations of the present study, including a small number of participants from highly disadvantaged neighborhoods and a circumscribed geographic setting, should be explored in larger and more diverse study cohorts.
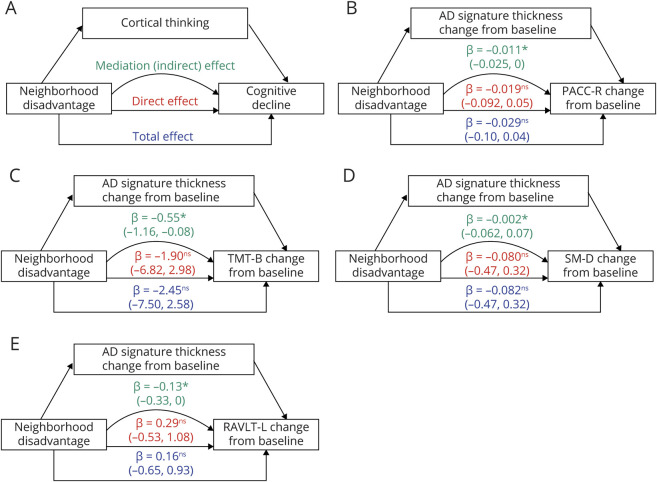
Dementia is a major cause of morbidity, mortality, and health care–related expense worldwide. The major causes of dementia have a pernicious onset and lack effective disease-modifying treatments, underscoring the importance of identifying modifiable risk factors in delaying disease onset and progression. Social determinants of health (SDOH) are social, cultural, economic, and physical conditions in which humans live, work, and age.1,2 Health authorities such as the US Department of Health and Human Services and the WHO have recognized the importance of individual-level as well as contextual-level SDOH as fundamental drivers of health and disease.1,2 Compelling evidence exists for SDOH as risk factors for the neurodegeneration and cognitive decline underlying Alzheimer disease and related dementia (ADRD).3,‐,5 Previous work has demonstrated cross-sectional associations between living in highly disadvantaged neighborhoods and lower global brain and hippocampal volumes among middle-aged and older adults without dementia.6,7 In addition, studies have shown unique associations between neighborhood-level disadvantage and cognitive testing performance after controlling for individual-level sociodemographic factors,8,‐,11 such as education, occupation, income, and marital status, although findings in this field have been mixed.8,‐,10,12,‐,16 Open questions remain as to whether structural brain changes can be observed over time in individuals with high neighborhood-level disadvantage and whether those brain changes are related to co-occurring cognitive decline. In the present study, longitudinal structural neuroimaging, cognitive testing data, and a geospatially determined marker of area disadvantage were leveraged to test 3 primary hypotheses (illustrated in figure 3A): that in cognitively unimpaired adults, exposure to high levels of neighborhood disadvantage would be associated with (1) decline in cortical thickness in Alzheimer disease (AD) signature regions during middle to older age; (2) concomitant longitudinal cognitive decline in learning, memory, and executive function; and that (3) changes in cortical thickness would mediate negative cognitive trajectories.
Figure 3. Mediation Testing of the Association Between Neighborhood-Level Disadvantage and Per-Year Change in Cognitive Performance via Per-Year Change in Cortical Thickness.
(A) A hypothetical model for mediation of the effect of neighborhood-level disadvantage on cognitive decline via thinning in Alzheimer disease (AD) signature cortical regions. Separate mediation models were tested for the Preclinical Alzheimer's Cognitive Composite–Revised (PACC-R) (B) and for component subtests Trail-Making Test, part B (TMT-B) (C), Story Memory Delayed Recall (SM-D) (D), and Rey Auditory Verbal Learning Test, total trials 1–5 (RAVLT-L) (E). For each mediation model, parameter estimates for total (blue), direct (red), and indirect (green) are displayed. 95% Confidence intervals were constructed using nonparametric percentile bootstrapping (10,000 iterations). The loss of cortical thickness in AD signature regions significantly mediated the effect of neighborhood-level disadvantage on the declining performance on PACC-R, subtests TMT-B and RAVLT-L, but not subtest SM-D. Significance testing of mediation model parameters: ns p > 0.1, #p < 0.1; *p < 0.05; **p < 0.01.
Methods
Study Participants
Participants were enrolled in 1 of 2 large, longitudinal studies of AD: the Wisconsin Registry for Alzheimer's Prevention (WRAP) study17 or the Wisconsin Alzheimer's Disease Research Center (WADRC) clinical cohort. Participants in both the WRAP and WADRC studies were recruited from the community or referred from memory clinics. Recruitment procedures did not differ based on neighborhood factors, although the WRAP study has employed asset-based community development to increase participation within Black communities.18 The overall study cohort is enriched for AD risk based on family history. Participant cognitive status at study entry and follow-up was determined by a comprehensive neuropsychological battery in accordance with the National Institute on Aging–Alzheimer's Association workgroup diagnostic criteria.19 Demographic characteristics including age, sex, race, and years of education and risk factor data including smoking status, hypertension, and diabetes were obtained by self-report. Participant data for the present study was collected between December 21, 2009, and January 16, 2019. Only participants with complete study data were included in the present analyses.
Standard Protocol Approvals, Registrations, and Patient Consents
The University of Wisconsin Institutional Review Board approved all study procedures involving human subjects and all participants provided written informed consent.
Inclusion/Exclusion Criteria
Inclusion criteria for the parent studies included fluent English speaking; adequate visual and auditory acuity to complete study tasks; and absence of major psychiatric, neurologic, or medical illness expected to interfere with study participation. Participants enrolled in a WRAP or WADRC neuroimaging substudy were considered for the present analyses (n = 1,239). The WRAP and WADRC neuroimaging cohorts had the same inclusion criteria, MRI scanning equipment acquisition settings, and data collection period. We excluded participants who had a consensus diagnosis of “cognitively impaired” (n = 221), were missing key demographic data (n = 44), had fewer than 2 MRI scans passing the QC process (n = 346), had a major structural brain abnormality (n = 10), or had fewer than 2 cognitive testing timepoints (n = 17). A total of 601 participants were included in all main analyses. Compared with those excluded, participants included in the final analyses had fewer identifying as Black or African American (4.4% vs 14.5%), more with parental history of dementia (69.0% vs 57.8%), higher mean years of education (16.6 vs 16.0), and fewer with the highest quintile of neighborhood-level disadvantage (3.1% vs 6.9%), but showed no difference in gender identification or APOE ε4 allele status.
Neighborhood-Level Disadvantage
The Area Deprivation Index (ADI) was used as a measure of neighborhood-level disadvantage. The ADI is constructed using 17 area-level indicators of poverty, employment, educational attainment, and physical conditions from the 2015 American Community Survey (ACS)20 and is a validated and widely used measure of neighborhood-level disadvantage.20,‐,22 We determined ADI scores for individual census block group areas (comprising an average of ∼1,500 individuals) and ranked into relative quintiles based on statewide distributions. Most recent reported residential address was used to geocode each participant to his or her census block-group and its assigned ADI. The average time between determination of neighborhood ADI on December 31, 2015, and participant address at the most recent study visit was 1.05 years, ranging from 5.1 years prior to ACS data release to 3.1 years after release. At the time of ADI determination, approximately 85% of participants lived in Wisconsin. Complete methods for construction of ADI20,22 and for determination of ADI in the WRAP and WADRC cohorts have been previously described.6
MRI Acquisition
High-resolution T1-weighted MRIs were acquired on 1 of 2 identical 3.0T GE MR750 Scanners (Waukesha, WI) using an 8-channel (Excite; GE Healthcare) or 32-channel (Nova Medical) headcoil and a spoiled gradient echo scanning sequence with scanning measures as follows: repetition time 6.68–8.16 ms, echo time 2.94–3.18 ms, inversion time 400–450 ms, flip angle 11–12°, slice thickness 1 × 1 × 1mm.
MRI Processing
An experienced neuroradiologist read all MRIs and scans with major structural abnormalities were excluded. We visually inspected images with minor abnormalities and excluded them if determined to affect processing, registration, or segmentation. We used Computational Anatomy Toolbox surface tools (CAT, version 12.6) for SPM12 (neuro.uni-jena.de/cat/), which estimates a projection-based cortical thickness based on local tissue segmentation,23 providing similar cortical thickness estimates to other automated methods such as Freesurfer in both patients with AD and healthy controls.24 We parcellated the cortical surface based on the Desikan atlas25 using CAT region of interest (ROI) tools. All cortical reconstructions and surface estimates were visualized for accuracy. We harmonized cortical thickness measurements to remove MRI equipment-related variance using the ComBat26 method. For each ROI, a per-year cortical thickness change rate was calculated as follows:
 |
As a final quality check for major intraindividual variation outside of a biologically feasible range, we visually compared cortical reconstructions from individuals with a change rate greater than 1 SD above or 2 SD below the sample mean in any target ROI. If reconstruction defects in target regions were identified at one timepoint, an alternative structural MRI scan was chosen from the same scanning session, or from the next nearest scanning session (n = 55), and finally, if no alternative structural scans existed, the participant was excluded from analysis (n = 27). Participants requiring the use of an alternate scan had a shorter average length of time between baseline and follow-up scans compared with those not requiring an alternate scan (3.25 vs 4.59 years).
Cognitive Testing
Participants completed comprehensive cognitive batteries at 2-year intervals. Cognitive tests in the present analyses included the Rey Auditory Verbal Learning Test learning trials 1–5 score (RAVLT-L), the Trail-Making Test, part B (TMT-B) time to completion (multiplied by −1 so that a higher value indicates better performance), and a Story Memory Delayed Recall (SM-D) score consisting of a cross-walked score between the Wechsler Memory Scale–Revised Logical Memory delayed recall and Craft Story delayed recall.27 A revised version of the Preclinical Alzheimer's Cognitive Composite (PACC-R), including RAVLT-L, TMT-B, and SM-D, was calculated.28 The PACC29 and its several revised versions28,30 may be more sensitive to very early AD-related cognitive changes and demonstrate less intraindividual variation in performance than individual cognitive tests. The 3 component tests were Z scaled, averaged, and rescaled around the mean and SD of the scores of cognitively unimpaired individuals within the WRAP and WADRC cohorts at baseline, creating an outcome with an average of approximately 0 and SD of approximately 1.28,31 Only study visits in which participants completed all PACC-R tests were included in analyses.
Measures
To indicate neighborhood-level disadvantage, we determined the ADI quintile of each study participant's residential Census block group (“neighborhood”) relative to their state of residence. For all main analyses, participants living in neighborhoods with the highest relative ADI quintile (20% most disadvantaged neighborhoods relative to state of residence, or “20% most disadvantaged neighborhoods”) were compared with those living in neighborhoods with the 4 lowest relative ADI quintiles (80% least disadvantaged neighborhoods relative to state of residence or “80% least disadvantaged neighborhoods”). We chose this dichotomous quintile split a priori based on previous studies finding the strongest deleterious health effects of neighborhood-level contextual factors at the highest levels of disadvantage.6,20,32 For cortical thickness analyses, an AD signature meta-ROI (including inferior parietal, inferior temporal, middle temporal, entorhinal, fusiform, and precuneus subregions)33 was constructed from the Desikan atlas,25 which may have better diagnostic separability across the AD spectrum33 and higher correlation with Braak neurofibrillary tangle staging34 than volume-based measures. The per-year change rate of thickness in AD signature meta-ROI and its subregions were used as longitudinal measures of neurodegeneration. To account for improvement in cognitive performance due to repeated test administration, we calculated a continuous “practice effect” variable indicating the cumulative number of completions of a given test. Since some tests were added later to the test protocol, we averaged the practice effect variable from each test contributing to the PACC-R to obtain an average practice effect score for models with PACC-R as the outcome. In cognitive testing models, we included a quadratic age2 term to account for accelerating age-related cognitive decline, consistent with previous studies.35 Sex was entered as a binary variable (female or male). Racial and ethnic identification were entered as categorical variables corresponding to US Census categories. Age, years of education, and all outcome variables were entered as continuous variables.
Statistical Analyses
Statistical analyses were performed using R (version 3.5.2, R Foundation for Statistical Computing). Fixed-effects ordinary least squares (OLS) regression models were fitted to test associations between neighborhood-level disadvantage and the following outcomes: baseline cortical thickness, baseline cognitive performance, and cortical thickness per-year change rates. Per-year change rates between baseline and follow-up, rather than a linear mixed effects (LME)–based approach, were used for cortical thickness models since the number of longitudinal MRI scans was limited to 2 for many participants. To assess whether longitudinal change in cognitive performance (cognitive trajectories) varied by neighborhood-level disadvantage group, we fit LME models to test maximum likelihood estimates using the lme4 package in R,36 similar to previous studies of group differences in cognitive trajectories.35 For each participant, all available cognitive testing time points (mean 4.4 visits) were entered into LME models. LME models included random intercept and slope term for each participant and the age variable was centered by the sample mean to account for differences in participant baseline age. In LME models, the significance of the age * neighborhood disadvantage interaction terms was assessed by likelihood ratio tests comparing the primary model and a model omitting interaction terms. Finally, to test whether changes in cortical thickness statistically mediated the association between neighborhood-level disadvantage and cognitive decline, we employed a counterfactual mediation framework.37 Briefly, we obtained parameter estimates from fixed-effects OLS regressions of mediation and outcome models and estimated indirect (mediation) effects using the product of coefficients method.37 We then constructed 95% confidence intervals (CIs) using nonparametric percentile bootstrapping (10,000 iterations) from the distributions of mediation and outcome model parameters using the mediation package in R.38 In order to simplify the variable individual-level dimensionality between study participants (i.e., number of MRI and cognitive testing visits), we used a per-year change score between baseline and most recent visit for both cortical thickness and cognitive testing variables in mediation models. All models included sex, age at visit, years of educational attainment, and practice effect (cognitive models only) as covariates. All statistical significance tests were 2-sided and a critical α of 0.05 was used, unless otherwise noted. For all final models presented here, regression diagnostics did not reveal influential points, significant outliers, or model residuals with significant deviation from normality.
Sensitivity Analyses
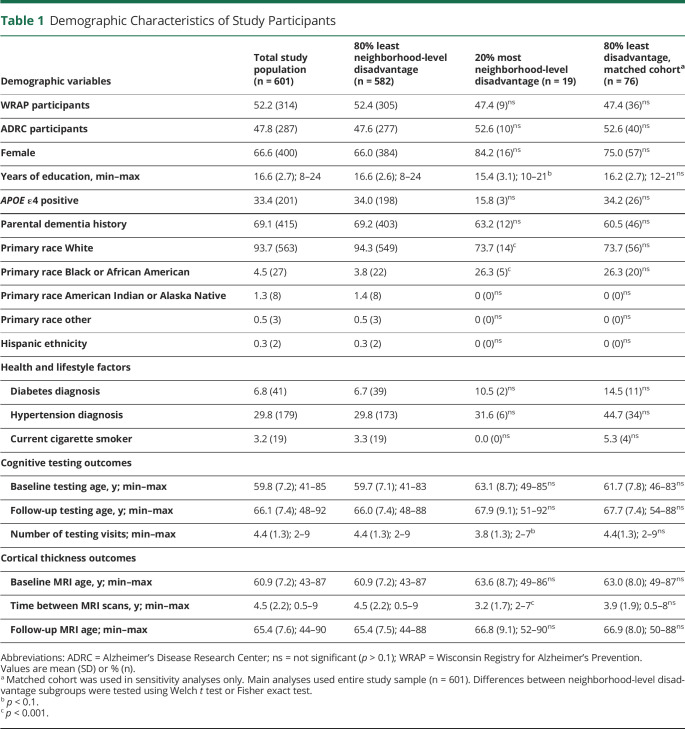
In sensitivity analyses, we tested the association between a wider range of neighborhood-level disadvantage and the outcomes of interest by comparing participants from each disadvantage quintile to the most advantaged quintile. In addition, to account for any hidden risk factors related to the differences in racial demographics between neighborhood-level disadvantage groups (table 1), sensitivity analyses were conducted using propensity score matched samples. Participants living in the 80% least disadvantaged neighborhoods were matched 4-to-1 to participants living in the 20% most disadvantaged neighborhoods using propensity scores based on race, baseline age, sex, and years of education and a nearest-neighbor algorithm (MatchIt package in R39). The matching ratio was empirically determined to minimize group differences in racial identification. Finally, adding parental dementia history or APOE ε4 status to cortical thickness and cognitive models did not improve model fit or alter the results appreciably and therefore were not included in the final models presented here.
Table 1.
Demographic Characteristics of Study Participants
Data Availability
Data not shown in this article can be anonymized and made available to qualified investigators upon request.
Results
Participant Demographics
Demographic characteristics of the study participants overall and by level of neighborhood disadvantage are detailed in table 1. The study sample was enriched for parental dementia history (69.1%), was majority female (66.6%), and had a high level of reported years of education (mean [SD] 16.6 [2.7]). Of the total study sample (n = 601), 582 participants (96.8%) lived in the 80% least disadvantaged neighborhoods relative to their state of residence, whereas 19 (3.2%) lived in the 20% most disadvantaged neighborhoods. Compared with the 20% most neighborhood-level disadvantage group, the 80% least disadvantage group had significantly fewer Black and more White participants and a significantly longer time between baseline and follow-up MRI scans, likely due to participants having undergone one additional study-related MRI scan. There were no significant differences in other demographic characteristics, cigarette smoking status, hypertension, or diabetes diagnosis across levels of neighborhood-level disadvantage.
Neighborhood-Level Disadvantage and Change in Cortical Thickness
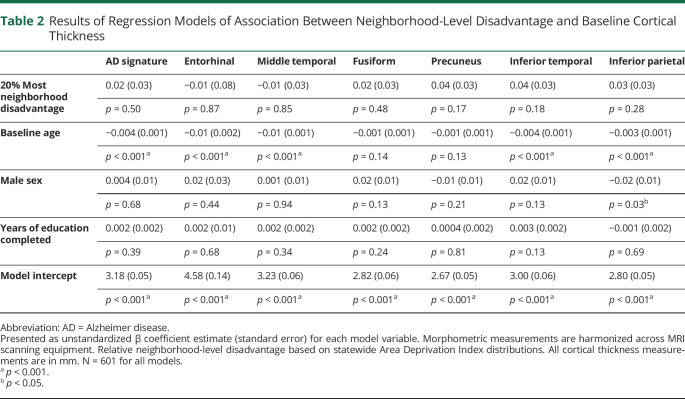
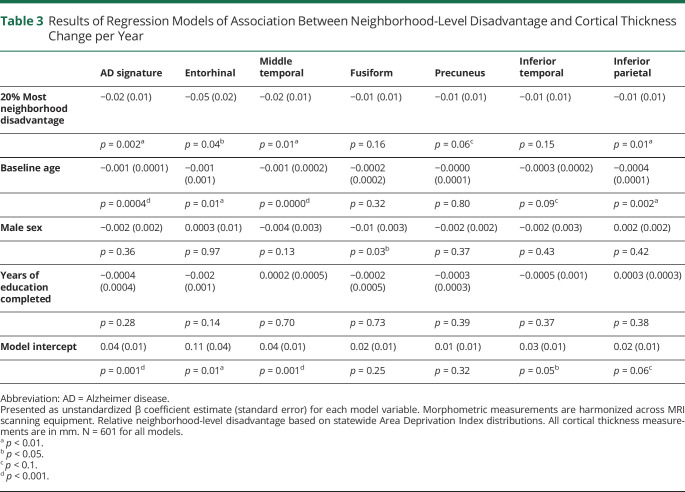
Baseline cortical thickness was not significantly different between the 20% most and 80% least disadvantaged groups (table 2). However, there were significant associations between neighborhood-level disadvantage and the change in cortical thickness between baseline and follow-up (figure 1). Fixed-effects linear regression models (table 3) demonstrated a significant association between neighborhood-level disadvantage and yearly loss of cortical thickness in the AD signature meta-ROI, including middle temporal, entorhinal, and inferior parietal subregions after controlling for baseline age, sex, and years of education. Neighborhood-level disadvantage was not associated with significant change in cortical thickness in the remaining subregions (fusiform, precuneus, and inferior temporal). To assess associations with cortical thickness at lower levels of neighborhood-level disadvantage, each quintile was also separately tested against the first (most advantaged) quintile. In these longitudinal models, compared with the most advantaged quintile, the 5th (most disadvantaged) quintile (β [SE]) was associated with a significant loss of cortical thickness in the AD signature meta-ROI (−0.02 [0.01], p = 0.004), including the entorhinal (−0.05 [0.02], p = 0.04), middle temporal (−0.02 [0.01], p = 0.03), and inferior parietal (−0.01 [0.01], p = 0.01) subregions. For baseline cortical thickness, compared with those in the most advantaged quintile, living in the 3rd quintile (β [SE]), but not other quintiles, was associated with significantly lower thickness in the AD signature meta-ROI (−0.04 [0.01], p = 0.002) including the entorhinal (−0.08 [0.04], p = 0.05), middle temporal (−0.05 [0.01], p = 0.001), fusiform (−0.05 [0.02], p < 0.001), and inferior temporal (−0.05 [0.02], p = 0.003).
Table 2.
Results of Regression Models of Association Between Neighborhood-Level Disadvantage and Baseline Cortical Thickness
Figure 1. Association Between Neighborhood-Level Disadvantage and Per-Year Change in Cortical Thickness in Alzheimer Disease (AD) Signature Regions.
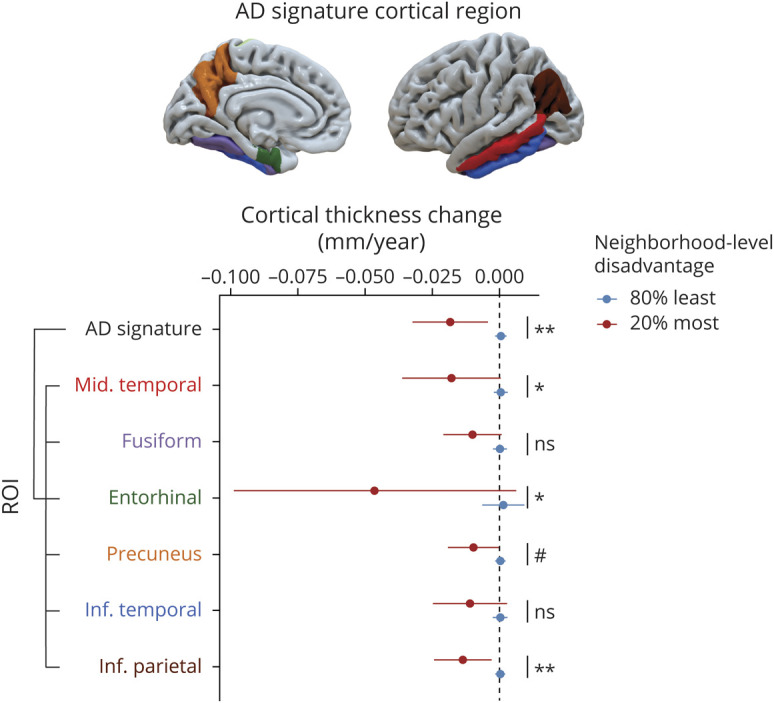
Plot depicts per-year change in cortical thickness in AD signature meta–regions of interest (ROIs) and individual component ROIs (middle temporal, fusiform, entorhinal, precuneus, inferior temporal, and inferior parietal). Colors of ROIs on cortical surface displayed above plot correspond to ROI label colors on plot. Estimated annual change in ROI thickness and 95% confidence intervals are displayed for participants with the 20% most relative neighborhood-level disadvantage (red lines) and those with the 80% least disadvantage (blue lines), adjusted for baseline age, sex, and years of education. Participants living in the most relatively disadvantaged neighborhoods exhibited significant cortical thinning in AD signature meta-ROI and middle temporal, entorhinal, and inferior parietal subregions compared with those living in the least disadvantaged neighborhoods. Unadjusted p values from regression model neighborhood-level disadvantage terms are displayed for each ROI: ns p > 0.1, #p < 0.1, *p < 0.05, **p < 0.01.
Table 3.
Results of Regression Models of Association Between Neighborhood-Level Disadvantage and Cortical Thickness Change per Year
Neighborhood-Level Disadvantage and Longitudinal Cognitive Trajectories
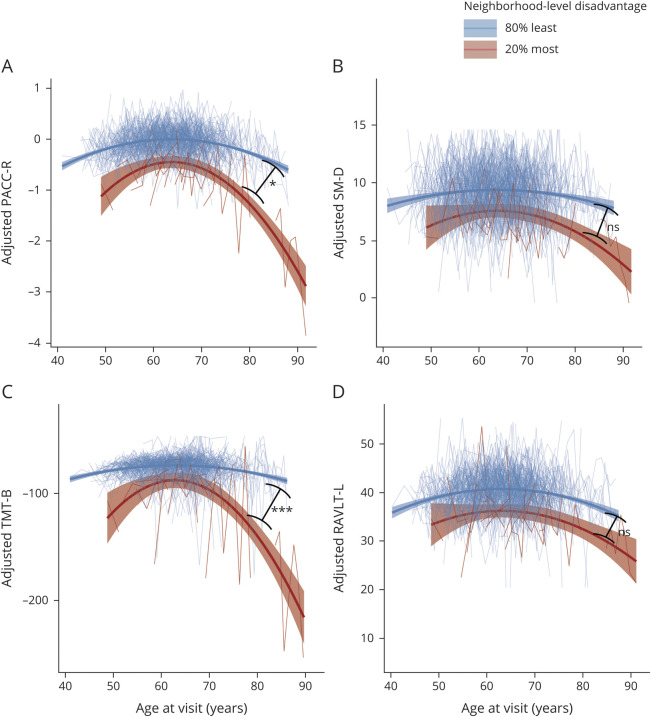
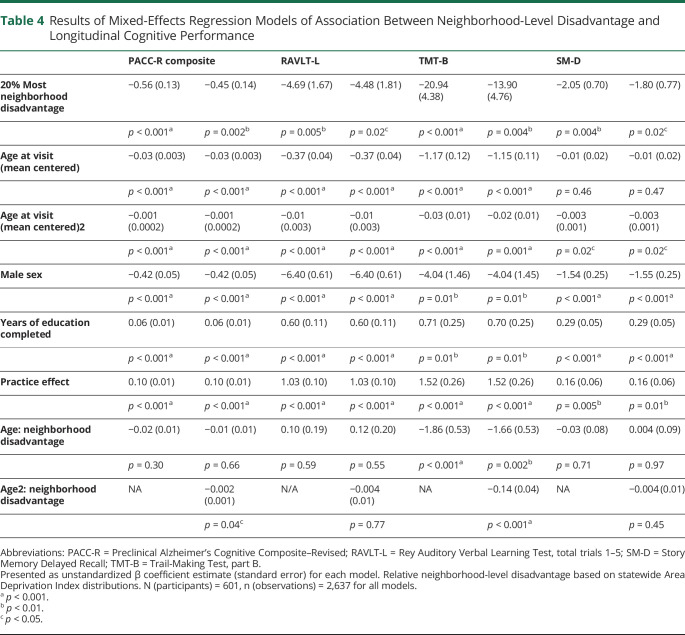
High neighborhood-level disadvantage was also associated with a significant decline in cognitive test performance over time (figure 2). Likelihood ratio tests indicated that the age2 * neighborhood-level disadvantage term accounted for a significant amount of variation in the PACC-R (χ2 = 4.43, df = 1, p = 0.035) and the TMT-B subtest (χ2 = 13.95, df = 1, p < 0.001), while the age * neighborhood-level disadvantage term accounted for a significant amount of variation in the TMT-B subtest only (χ2 = 11.934, df = 1, p < 0.001). When tested jointly, the age * neighborhood-level disadvantage and age2 * neighborhood-level disadvantage terms similarly accounted for a significant amount of the variation in TMT-B (χ2 = 25.883, df = 2, p < 0.001) and a consistent but nonsignificant amount of variation in PACC-R (χ2 = 5.52, df = 2, p = 0.063). The age * neighborhood-level disadvantage and age2 * neighborhood-level disadvantage terms did not account for significant variation in RAVLT-L or SM-D. The full results of cognitive testing regression models can be found in table 4. We also compared the intraindividual variance in cognitive testing performance and found that participants from the 20% most disadvantaged neighborhoods had significantly higher SD (mean 20.4) in intraindividual TMT-B performance across testing sessions compared with participants from the 80% least disadvantaged neighborhoods (mean 10.1) (Welch 2-sample t test, t = −2.4, df = 18.2, p = 0.027), but not SM-D or RAVLT-L performance.
Figure 2. Association Between Neighborhood-Level Disadvantage and Longitudinal Cognitive Trajectories.
Plots depict performance on Preclinical Alzheimer's Cognitive Composite–Revised (PACC-R) composite (A) and component subtests (B–D) on the y-axis and age on the x-axis. Higher scores equate to better performance on cognitive test (Trail-Making Test, part B [TMT-B] scores are multiplied by −1 for graphical consistency). Cognitive test scores are adjusted for sex, years of education, practice effects, and individual-level intercepts and slopes. Small lines (spaghetti plot) depict individual trajectories; large lines depict estimated quadratic slopes for participants with the 80% least neighborhood-level disadvantage (blue lines, n = 582) and 20% most disadvantage (red lines, n = 19). Participants from the most highly disadvantaged neighborhoods exhibited significantly steeper decline in PACC-R and TMT-B than participants from less disadvantaged neighborhoods, but showed no difference in decline of Story Memory Delayed Recall (SM-D) or Rey Auditory Verbal Learning Test, total trials 1–5 (RAVLT-L). Unadjusted p values for age2:neighborhood disadvantage interaction terms are displayed on plots for each cognitive test: ns p > 0.05, *p < 0.05, ***p < 0.001.
Table 4.
Results of Mixed-Effects Regression Models of Association Between Neighborhood-Level Disadvantage and Longitudinal Cognitive Performance
Associations between neighborhood-level disadvantage and baseline cross-sectional cognitive test performance were also assessed. Living in the 20% most disadvantaged neighborhoods (β [SE]) was associated with significantly lower baseline performance on PACC-R (−0.67 [0.13], p < 0.001), including all component subtests of TMT-B (−25.44 [5.15], p = 0.001), RAVLT-L (−5.92 [1.76], p = 0.001), and SM-D (−2.11 [0.81], p = 0.01). Testing each neighborhood-level disadvantage quintile against the 1st (most advantaged) quintile demonstrated significant baseline differences in the 5th quintile group for the PACC-R (−0.72 [0.13], p < 0.001) and TMT-B subtests (−27.14 [5.24], p < 0.001), RAVLT-L (−6.20 [1.79], p < 0.001), and SM-D (−2.4 [0.82], p = 0.004) and differences in the 4th quintile for the PACC-R (−0.25 [0.09], p = 0.004) and SM-D subtest (−1.54 [0.52], p = 0.004), but no significant baseline differences for other quintiles.
Neighborhood-Level Disadvantage, Change in Cortical Thickness, and Cognitive Trajectory Mediation Analysis
To test a theoretical causal pathway between neighborhood-level disadvantage and accelerated cognitive decline via thinning in AD signature regions (figure 3A), mediation testing was performed. For mediation models, both cortical thickness and cognitive tests performance were indicated by per-year change scores between baseline and most recent study visit. In mediation models, neighborhood-level disadvantage had a significant indirect effect via per-year change in AD signature cortical thickness on the per-year change in PACC-R and component subtest TMT-B and RAVLT-L, but not SM-D. Complete parameter estimates from mediation models are illustrated (figure 3, B–E).
Sensitivity Analyses
To account for hidden confounding factors related to racial and demographic differences between participants from the 20% most vs 80% least neighborhood-level disadvantage groups (table 1), a propensity score matched dataset was constructed. There were no significant demographic differences between disadvantage groups in the matched sample for any variable assessed (table 1). Repeating the main analyses in the matched sample, neighborhood-level disadvantage was still associated with significant cortical thinning in the AD signature region and same subregions as the primary analysis, with the exception of the inferior parietal region, which was no longer statistically significant. When the longitudinal cognitive analyses were repeated using the propensity score–matched sample, age2 * neighborhood-level disadvantage still accounted for significant variation (β [SE]) in TMT-B (−0.14 [0.05], p = 0.01) and PACC-R (−0.002 [0.001], p = 0.05), and age * neighborhood-level disadvantage accounted for significant variation in TMT-B (−1.62 [0.75], p = 0.04); however, the p values were significantly reduced in both cases. The difference in intraindividual variation in TMT-B between the 20% most and 80% least disadvantaged neighborhood groups was also attenuated in the matched sample (Welch 2-sample t test t = −1.38, df = 20.3, p = 0.09). Similarly, when the mediation analyses were rerun using the matched sample, neighborhood-level disadvantage had a nonsignificant indirect effect (β [95% CI]) for decline in PACC-R (−0.024 [−0.064 to 0], p = 0.094) and a significant and slightly larger indirect effect for decline in TMT-B performance (−1.67 [−3.82 to −0.08], p = 0.031) via change in cortical thickness in the AD signature meta-ROI.
To determine whether mediation results were sensitive to the timing of structural and cognitive data collection, we reran mediation analyses limiting the baseline MRI scan and baseline cognitive testing to within 1 year of each other. The results were similar, with neighborhood-level disadvantage having a consistent, but nonsignificant indirect effect (β [95% CI]) for decline in PACC-R (−0.011 [−0.028 to 0], p = 0.056) and RAVLT-L (−0.141 [−0.365 to 0], p = 0.056), and a significant indirect effect for decline in TMT-B (−0.50 [−1.08 to −0.08], p = 0.011).
Discussion
Using longitudinal neuroimaging data derived from 2 large AD cohort studies, we observed an association between high neighborhood-level disadvantage and accelerated decline in cortical thickness in AD signature regions. This association remained significant in propensity score–matched samples controlling for racial and demographic differences between participants with varying neighborhood-level disadvantage. Previous studies, including one from the WRAP and WADRC cohorts (see Hunt et al.6), have demonstrated cross-sectional associations between neighborhood-level disadvantage and measures of hippocampal and total cortical volume.6,7 Interestingly, we did not observe significant baseline differences in cortical thickness between participants with different levels of neighborhood disadvantage, with the exception of those from the 3rd disadvantage quintile, which may be explained by the younger average age, or relatively fewer cardiovascular risk factors of the study cohort. The present longitudinal findings provide even stronger evidence that high neighborhood-level disadvantage is associated with a degenerative process. The temporal nature of the association between neighborhood-level disadvantage and brain structure is important to establish, as a number of previous studies have demonstrated associations between socioeconomic contextual factors and brain structure during development.40,41 Since childhood socioeconomic context predicts adult socioeconomic context, the association between neighborhood-level disadvantage and altered brain structure in middle and older age may reflect both developmental and degenerative processes. Incorporating life-course data in future research on neighborhood-level disadvantage and brain structure will help clarify this point.
High neighborhood-level disadvantage was also associated with significantly lower baseline scores on PACC-R and all of its component subtests, and with significant longitudinal decline on the PACC-R, which was driven primarily by decline in the TMT-B subtest (table 4). TMT-B assesses executive function and processing speed, which have previously been shown to decline in the earliest stages of both biomarker-designated AD35,42 and cerebral small vessel disease.43 Worsening performance in these cognitive domains may be indicative of a generally declining cognitive trajectory via either of the 2 major pathways towards dementia (AD or vascular). Furthermore, significant nonlinear effects (age2 * neighborhood-level disadvantage) suggested that neighborhood-level disadvantage was associated with an acceleration of cognitive decline during the aging process.
As with the structural outcomes, propensity score–matched analyses suggested that the association between neighborhood-level disadvantage and cognitive decline was not being solely driven by demographic differences, although the strength of the associations was reduced when demographic characteristics were more similar between disadvantage groups. Likewise, we observed significantly higher intraindividual variability in TMT-B in the 20% most disadvantage group, which was attenuated in the demographic-, age-, and education-matched subsample but could reflect other unmeasured cognitive, behavioral, or health-related differences between the 2 groups. It is also worth noting that while our findings are consistent with the interpretation that neighborhood-level disadvantage is associated with a process of cognitive decline, we cannot rule out the possibility that differences in longitudinal cognitive performance also reflect situational, behavioral, or stress-related factors linked to living in more highly disadvantaged areas.
A growing and dynamic literature on the association between neighborhood socioeconomic context, cognitive function, and cognitive decline has yielded intriguing results.8,‐,10,12,‐,16,44,‐,46 Various studies have demonstrated cross-sectional9,12,45,46 or longitudinal8,10,44 associations between neighborhood context and cognitive function or decline independent of individual-level socioeconomic factors. Still others have demonstrated cross-sectional but not longitudinal associations9,14,15 or associations that vary by individual-level wealth16 or race.9 The cognitive findings in the present study are most concordant with previous studies that more closely share methodology, particularly in using neighborhood-level disadvantage as a categorical variable designating the highest risk groups8,‐,10,12 rather than a continuous variable.13,‐,15 The more robust associations of categorical indicators of neighborhood-level disadvantage with cognitive decline are consistent with studies of other health outcomes20,32,47 in which negative effects are only observed at the highest levels of disadvantage.
Cortical thinning partially mediated the association between neighborhood-level disadvantage and cognitive decline (figure 3), where greater atrophy was associated with greater cognitive decline. This provides evidence that the previously described associations between neighborhood-level disadvantage and brain structure6,7 or cognition8,9,12,46 may occur along the same mechanistic pathway. While it makes intuitive sense that these structural and cognitive correlates would share a common causal pathway, a limited number of studies have formally tested these mediating relationships for other dementia risk factors like educational attainment and cardiovascular risk,48,49 and none to our knowledge has done so for neighborhood-level disadvantage. The results of the present mediation analyses support a plausible theoretical pathway by which high neighborhood-level disadvantage is associated with accelerated cognitive decline via degeneration in AD-related cortical areas, although another interpretation is that living in highly advantaged neighborhoods is associated with increased cognitive resilience to neurodegenerative processes (a.k.a. cognitive reserve). Teasing apart the relative importance of having “excess” advantage vs lacking advantage has implications for translating findings into clinical practice and policy. Relatedly, the association between high neighborhood-level disadvantage and lower baseline cognitive performance, but not cortical thickness, suggests that other factors (neurobiological, cognitive processes, education quality, health behaviors, or others) might mediate the association between neighborhood-level disadvantage and memory and executive function in earlier life.
Neighborhoods are complex entities encompassing environmental exposures, economic and educational opportunities, social interactions, and access to health care. Our findings controlling for education are consistent with previous evidence of neighborhood-level disadvantage as an SDOH that is at least partially distinct from individual-level factors,8,10,11 though studies integrating complementary social, economic, environmental, lifestyle, and cognitive measures are needed to confirm (or refute) this interpretation. Some possible pathways connecting neighborhood-level disadvantage, neurodegeneration, and cognitive decline include exposure to air pollution,50 access to healthy food51 or recreational opportunities,52 or stressful life events.53 Another interesting possibility that warrants attention is whether historical and institutional practices, such as exclusionary zoning policy for certain racial groups (i.e., redlining), lent unique characteristics (infrastructure, health care resources, food options) to the neighborhoods to which these groups were confined.
Several limitations should be considered in the interpretation of this study. Study participants were predominantly non-Hispanic, White, and highly educated residents of the midwestern United States. A small proportion (3.2% of the total sample) of participants in the longitudinal cohort lived in the 20% most disadvantaged neighborhoods, a notable limitation that should be considered in the interpretation of the findings, for example through the introduction of selection bias. The high neighborhood-level disadvantage group was also highly educated (mean years 15.4), indicating that our study population likely represents a more relatively advantaged subset of the general population. Finally, the treatment of sex as a binary variable in the present study may not capture the disproportionate burden of social disadvantage faced by individuals with nonbinary gender identities, an important topic for future research. Together, the noted limitations underscore that replicability in diverse geographic and demographic settings is critical to establish any caveats and to test generalizability of the findings and the importance of carefully considered recruitment and retention practices within underrepresented communities for longitudinal studies of ADRD.54 This is particularly pertinent given that previous studies have found variable relationships between neighborhood-level disadvantage, cognition, and cognitive decline in middle to older age.8,‐,16
In interpreting the present findings, the temporal ordering of exposure to neighborhood-level disadvantage and initiation of neurodegeneration and cognitive decline should also be considered. While efforts are currently underway to construct residential histories and identify the effect of duration and timing of exposure to neighborhood-level disadvantage, the present analyses measured neighborhood-level disadvantage at a single timepoint, based on participants' most recent residential address. The longitudinal analyses described here offer stronger evidence for a directional association between neighborhood-level disadvantage, neurodegeneration, and cognitive decline, though causal inference is still limited by the observational study design and the possibility that changes in participant brain structure or cognition preceded residence at their current documented address. Policy changes focused on improving community infrastructure may provide “natural experiments” to test causal pathways between neighborhood-level disadvantage, neurodegeneration, and cognitive decline in middle to older cohorts more directly.
The present study used a geographically specified measure of area socioeconomic context along with longitudinal neuroimaging and cognitive testing data to assess whether high neighborhood-level disadvantage is associated with cognitive decline and neurodegeneration in an established, unimpaired cohort. In our study cohort of middle- to older-aged cognitively unimpaired adults, neighborhood-level disadvantage was longitudinally associated with cortical thinning and cognitive decline after controlling for sex, educational attainment, and racial identification. Accelerated decline in TMT-B, a test of executive function and processing speed, was particularly prominent, and was statistically mediated by cortical thinning in AD signature regions. Previous studies of neighborhood disadvantage and brain structure7,16 or cognitive function8,‐,10,12,‐,16 in middle-aged and elderly adults have been strengthened by diverse study populations,8,13,‐,16,46 exploration of relevant biological mediators,6,7 and nuanced analysis of the complex interplay among race, individual-level socioeconomic status, and neighborhood-level socioeconomic context.8,15,16
In building on this literature, the current study expands on previous studies of neighborhood-level disadvantage, brain structure, and cognitive function in several meaningful ways: it (1) provides preliminary evidence for an association between neighborhood-level disadvantage and longitudinal neurodegeneration (cortical thinning); (2) links structural and functional decline in the same study cohort; (3) improves on the geographic specificity of the exposure variable by measuring neighborhood disadvantage at the Census block group, rather than Census tract, level; and (4) uses an extensively validated multidimensional construct of disadvantage (ADI) rather than relying on single construct measures. Future research on neighborhood-level disadvantage, neurodegeneration, and dementia may benefit from a multidisciplinary approach incorporating fields such as neuroimaging, neuropsychology, health geography, epidemiology, biostatistics, neurobiology, and social equity. The geographical tools used in the present study have been applied to determine the relative ADI decile of every Census block group across the United States and Puerto Rico and are publicly available through the Neighborhood Atlas,22 helping enable this type of interdisciplinary science.
This study emphasizes the importance of understanding SDOH as fundamental contributing factors in the etiology of ADRD. The longitudinal structural degeneration and cognitive decline observed in individuals from the most disadvantaged neighborhoods suggests that increased clinical vigilance for early signs of dementia may be particularly important in this vulnerable population. Further elucidation of the social and biological pathways linking neighborhood-level disadvantage, neurodegeneration, and cognitive decline may aid clinicians, researchers, and policymakers in identifying effective avenues for prevention and intervention in ADRD.
Acknowledgment
The authors thank the study staff and researchers at the WRAP and WADRC for assistance with recruitment, data collection, and data processing; and the WRAP and WADRC study participants.
Glossary
- ACS
American Community Survey
- AD
Alzheimer disease
- ADI
Area Deprivation Index
- ADRD
Alzheimer disease and related dementia
- CAT
Computational Anatomy Toolbox
- CI
confidence interval
- LME
linear mixed effects
- OLS
ordinary least squares
- PACC-R
Preclinical Alzheimer's Cognitive Composite–Revised
- RAVLT-L
Rey Auditory Verbal Learning Test, total trials 1–5
- ROI
region of interest
- SDOH
social determinants of health
- SM-D
Story Memory Delayed Recall
- TMT-B
Trail-Making Test, part B
- WADRC
Wisconsin Alzheimer's Disease Research Center
- WRAP
Wisconsin Registry for Alzheimer's Prevention
Appendix. Authors

Study Funding
This project was supported by National Institutes on Aging Awards (F31 AG062116 [PI Hunt], RF1 AG057784 [PI Kind, MPI Bendlin], R01 AG037639 [PI Bendlin], R56 AG037639 [PI Bendlin], R01 AG027161 [PI Johnson], R01 AG021155 [PI Johnson], P50 AG033514 [PI Asthana], R01 AG054059 [PI Gleason]); National Institute on Minority Health and Health Disparities Award (R01 MD010243 [PI Kind]); and the UW Institute for Clinical and Translational Research grant (1UL 1RR025011).
Disclosure
The authors report no relevant disclosures. Go to Neurology.org/N for full disclosures.
References
- 1.US Department of Health and Human Services. Healthy People 2020: An Opportunity to Address Societal Determinants of Health in the United States. 2010. Available at: healthypeople.gov/2010/hp2020/advisory/SocietalDeterminantsHealth.htm. [Google Scholar]
- 2.World Health Organization. A conceptual framework for action on the social determinants of health: debates, policy & practice, case studies. 2010. Accessed August 9, 2018. Available at: apps.who.int/iris/bitstream/10665/44489/1/9789241500852_eng.pdf.
- 3.Turrell G, Lynch JW, Kaplan GA, Everson SA, Helkala E-L. Socioeconomic position across the lifecourse and cognitive function in late middle age. J Gerontol Soc Sci 2002;57B:S43–S51. [DOI] [PubMed] [Google Scholar]
- 4.Sattler C, Toro P, Schönknecht P, Schröder J. Cognitive activity, education and socioeconomic status as preventive factors for mild cognitive impairment and Alzheimer's disease. Psychiatry Res 2012;196:90–95. [DOI] [PubMed] [Google Scholar]
- 5.Powell WR, Buckingham WR, Larson JL, et al. Association of neighborhood-level disadvantage with Alzheimer disease neuropathology. JAMA Netw Open 2020;3:e207559. [DOI] [PMC free article] [PubMed] [Google Scholar]
- 6.Hunt JFV, Buckingham W, Kim AJ, et al. Association of neighborhood-level disadvantage with cerebral and hippocampal volume. JAMA Neurol 2020;77:451–460. [DOI] [PMC free article] [PubMed] [Google Scholar]
- 7.Gianaros PJ, Kuan DC-H, Marsland AL, et al. Community socioeconomic disadvantage in midlife relates to cortical morphology via neuroendocrine and cardiometabolic pathways. Cereb Cortex 2017;27:460–473. [DOI] [PMC free article] [PubMed] [Google Scholar]
- 8.Sheffield KM, Peek MK. Neighborhood context and cognitive decline in older Mexican Americans: results from the hispanic established populations for epidemiologic studies of the elderly. Am J Epidemiol 2009;169:1092–1101. [DOI] [PMC free article] [PubMed] [Google Scholar]
- 9.Rosso AL, Flatt JD, Carlson MC, et al. Neighborhood socioeconomic status and cognitive function in late life. Am J Epidemiol 2016;183:1088–1097. [DOI] [PMC free article] [PubMed] [Google Scholar]
- 10.Kuchibhatla M, Hunter JC, Plassman BL, et al. The association between neighborhood socioeconomic status, cardiovascular and cerebrovascular risk factors, and cognitive decline in the Health and Retirement Study (HRS). Aging Ment Health 2020;24:1479–1486. [DOI] [PMC free article] [PubMed] [Google Scholar]
- 11.Zuelsdorff M, Larson JL, Hunt JFV, et al. The Area Deprivation Index: a novel tool for harmonizable risk assessment in Alzheimer's disease research. Alzheimers Dement 2020;6:e12039. [DOI] [PMC free article] [PubMed] [Google Scholar]
- 12.Lang IA, Llewellyn DJ, Langa KM, Wallace RB, Huppert FA, Melzer D. Neighborhood deprivation, individual socioeconomic status, and cognitive function in older people: analyses from the English Longitudinal Study of Ageing. J Am Geriatr Soc 2008;56:191–198. [DOI] [PMC free article] [PubMed] [Google Scholar]
- 13.Meyer OL, Sisco SM, Harvey D, et al. Neighborhood predictors of cognitive training outcomes and trajectories in ACTIVE. Res Aging 2017;39:443–467. [DOI] [PMC free article] [PubMed] [Google Scholar]
- 14.Meyer OL, Mungas D, King J, et al. Neighborhood socioeconomic status and cognitive trajectories in a diverse longitudinal cohort. Clin Gerontol 2018;41:82–93. [DOI] [PMC free article] [PubMed] [Google Scholar]
- 15.Zeki Al Hazzouri A, Haan MN, Osypuk T, Abdou C, Hinton L, Aiello AE. Neighborhood socioeconomic context and cognitive decline among older Mexican Americans: results from the Sacramento Area Latino study on Aging. Am J Epidemiol 2011;174:423–431. [DOI] [PMC free article] [PubMed] [Google Scholar]
- 16.Aneshensel CS, Ko MJ, Chodosh J, Wight RG. The urban neighborhood and cognitive functioning in late middle age. J Health Soc Behav 2011;52:163–179. [DOI] [PMC free article] [PubMed] [Google Scholar]
- 17.Johnson SC, Koscik RL, Jonaitis EM, et al. The Wisconsin Registry for Alzheimer's Prevention: a review of findings and current directions. Alzheimers Dement 2018;10:130–142. [DOI] [PMC free article] [PubMed] [Google Scholar]
- 18.Green-Harris G, Coley SL, Koscik RL, et al. Addressing disparities in Alzheimer's disease and African-American participation in research: an asset-based community development approach. Front Aging Neurosci 2019;11:125. [DOI] [PMC free article] [PubMed] [Google Scholar]
- 19.Albert MS, DeKosky ST, Dickson D, et al. The diagnosis of mild cognitive impairment due to Alzheimer's disease: recommendations from the National Institute on Aging–Alzheimer’s Association workgroups on diagnostic guidelines for Alzheimer's disease. Alzheimers Dement 2011;7:270–279. [DOI] [PMC free article] [PubMed] [Google Scholar]
- 20.Kind AJH, Jencks S, Brock J, et al. Neighborhood socioeconomic disadvantage and 30-day rehospitalization: a retrospective cohort study. Ann Intern Med 2014;161:765. [DOI] [PMC free article] [PubMed] [Google Scholar]
- 21.Singh GK. Area deprivation and widening inequalities in US mortality, 1969-1998. Am J Public Health 2003;93:1137–1143. [DOI] [PMC free article] [PubMed] [Google Scholar]
- 22.Kind AJ, Buckingham WR. Making neighborhood-disadvantage metrics accessible: The Neighborhood Atlas. N Engl J Med 2018;378:3. [DOI] [PMC free article] [PubMed] [Google Scholar]
- 23.Dahnke R, Yotter RA, Gaser C. Cortical thickness and central surface estimation. Neuroimage 2013;65:336–348. [DOI] [PubMed] [Google Scholar]
- 24.Seiger R, Ganger S, Kranz GS, Hahn A, Lanzenberger R. Cortical thickness estimations of FreeSurfer and the CAT12 Toolbox in patients with Alzheimer's disease and healthy controls: cortical thickness of FreeSurfer and CAT12. J Neuroimaging 2018;28:515–523. [DOI] [PMC free article] [PubMed] [Google Scholar]
- 25.Desikan RS, Ségonne F, Fischl B, et al. An automated labeling system for subdividing the human cerebral cortex on MRI scans into gyral based regions of interest. Neuroimage 2006;31:968–980. [DOI] [PubMed] [Google Scholar]
- 26.Fortin J-P, Cullen N, Sheline YI, et al. Harmonization of cortical thickness measurements across scanners and sites. Neuroimage 2018;167:104–120. [DOI] [PMC free article] [PubMed] [Google Scholar]
- 27.Monsell SE, Dodge HH, Zhou X-H, et al. Results from the NACC uniform data set neuropsychological battery crosswalk study. Alzheimer Dis Assoc Disord 2016;30:134–139. [DOI] [PMC free article] [PubMed] [Google Scholar]
- 28.Jonaitis EM, Koscik RL, Clark LR, et al. Measuring longitudinal cognition: individual tests versus composites. Alzheimers Dement 2019;11:74–84. [DOI] [PMC free article] [PubMed] [Google Scholar]
- 29.Donohue MC, Sperling RA, Salmon DP, et al. The preclinical Alzheimer cognitive composite: measuring amyloid-related decline. JAMA Neurol 2014;71:961. [DOI] [PMC free article] [PubMed] [Google Scholar]
- 30.Merluzzi AP, Vogt NM, Norton D, et al. Differential effects of neurodegeneration biomarkers on subclinical cognitive decline. Alzheimers Dement 2019;5:129–138. [DOI] [PMC free article] [PubMed] [Google Scholar]
- 31.Jonaitis E, Clark LR, Betthauser TJ, et al. Conditional standards: identifying cutoffs for predicting ad surrogates using traditional and machine learning methods. Alzheimers Dement 2019;15:P798. [Google Scholar]
- 32.Brown AF, Liang L-J, Vassar SD, et al. Neighborhood disadvantage and ischemic stroke: the Cardiovascular Health Study (CHS). Stroke 2011;42:3363–3368. [DOI] [PMC free article] [PubMed] [Google Scholar]
- 33.Schwarz CG, Gunter JL, Wiste HJ, et al. A large-scale comparison of cortical thickness and volume methods for measuring Alzheimer's disease severity. Neuroimage Clin 2016;11:802–812. [DOI] [PMC free article] [PubMed] [Google Scholar]
- 34.Braak H, Braak E. Neuropathological stageing of Alzheimer-related changes. Acta Neuropathol 1991;82:239–259. [DOI] [PubMed] [Google Scholar]
- 35.Clark LR, Berman SE, Norton D, et al. Age-accelerated cognitive decline in asymptomatic adults with CSF β-amyloid. Neurology 2018;90:e1306–e1315. [DOI] [PMC free article] [PubMed] [Google Scholar]
- 36.Bates D, Mächler M, Bolker B, Walker S. Fitting linear mixed-effects models using lme4. J Stat Softw 2015;67. Accessed February 21, 2020. Available at: jstatsoft.org/v67/i01/. [Google Scholar]
- 37.Imai K, Keele L, Tingley D. A general approach to causal mediation analysis. Psychol Methods 2010;15:309–334. [DOI] [PubMed] [Google Scholar]
- 38.Tingley D, Yamamoto T, Hirose K, Keele L, Imai K. mediation : R package for causal mediation analysis. J Stat Softw 2014;59. Accessed February 25, 2019. Available at: jstatsoft.org/v59/i05/. [Google Scholar]
- 39.Ho DE, Imai K, King G, Stuart EA. Matching as nonparametric preprocessing for reducing model dependence in parametric causal inference. Polit Anal 2007;15:199–236. [Google Scholar]
- 40.Noble KG, Houston SM, Brito NH, et al. Family income, parental education and brain structure in children and adolescents. Nat Neurosci 2015;18:773–778. [DOI] [PMC free article] [PubMed] [Google Scholar]
- 41.Staff RT, Murray AD, Ahearn TS, Mustafa N, Fox HC, Whalley LJ. Childhood socioeconomic status and adult brain size: childhood socioeconomic status influences adult hippocampal size. Ann Neurol 2012;71:653–660. [DOI] [PubMed] [Google Scholar]
- 42.Harrington MG, Chiang J, Pogoda JM, et al. Executive function changes before memory in preclinical Alzheimer's pathology: a prospective, cross-sectional, case control study. PLoS One 2013;8:e79378. [DOI] [PMC free article] [PubMed] [Google Scholar]
- 43.Kim HJ, Yang JJ, Kwon H, et al. Relative impact of amyloid-β, lacunes, and downstream imaging markers on cognitive trajectories. Brain 2016;139:2516–2527. [DOI] [PubMed] [Google Scholar]
- 44.Clarke PJ, Weuve J, Barnes L, Evans DA, Mendes de Leon CF. Cognitive decline and the neighborhood environment. Ann Epidemiol 2015;25:849–854. [DOI] [PMC free article] [PubMed] [Google Scholar]
- 45.Wight RG, Aneshensel CS, Miller-Martinez D, et al. Urban neighborhood context, educational attainment, and cognitive function among older adults. Am J Epidemiol 2006;163:1071–1078. [DOI] [PubMed] [Google Scholar]
- 46.Clarke PJ, Ailshire JA, House JS, et al. Cognitive function in the community setting: the neighbourhood as a source of ‘cognitive reserve’? J Epidemiol Community Health 2012;66:730–736. [DOI] [PMC free article] [PubMed] [Google Scholar]
- 47.Brown AF, Liang L-J, Vassar SD, et al. Neighborhood socioeconomic disadvantage and mortality after stroke. Neurology 2013;80:520–527. [DOI] [PMC free article] [PubMed] [Google Scholar]
- 48.Vemuri P, Lesnick TG, Knopman DS, et al. Amyloid, vascular, and resilience pathways associated with cognitive aging. Ann Neurol 2019;86:866–877. [DOI] [PMC free article] [PubMed] [Google Scholar]
- 49.Mortby ME, Burns R, Janke AL, Sachdev PS, Anstey KJ, Cherbuin N. Relating education, brain structure, and cognition: the role of cardiovascular disease risk factors. Biomed Res Int 2014;2014:1–13. [DOI] [PMC free article] [PubMed] [Google Scholar]
- 50.Younan D, Petkus AJ, Widaman KF, et al. Particulate matter and episodic memory decline mediated by early neuroanatomic biomarkers of Alzheimer's disease. Brain 2020;143:289–302. [DOI] [PMC free article] [PubMed] [Google Scholar]
- 51.Hilmers A, Hilmers DC, Dave J. Neighborhood disparities in access to healthy foods and their effects on environmental justice. Am J Public Health 2012;102:1644–1654. [DOI] [PMC free article] [PubMed] [Google Scholar]
- 52.Hughey SM, Walsemann KM, Child S, Powers A, Reed JA, Kaczynski AT. Using an environmental justice approach to examine the relationships between park availability and quality indicators, neighborhood disadvantage, and racial/ethnic composition. Landscape Urban Plann 2016;148:159–169. [Google Scholar]
- 53.Zuelsdorff M, Okonkwo OC, Norton D, et al. Stressful life events and racial Disparities in cognition among middle-aged and older adults. J Alzheimers Dis 2020;73:671–682. [DOI] [PMC free article] [PubMed] [Google Scholar]
- 54.Gilmore-Bykovskyi AL, Jin Y, Gleason C, et al. Recruitment and retention of underrepresented populations in Alzheimer's disease research: a systematic review. Alzheimers Dement 2019;5:751–770. [DOI] [PMC free article] [PubMed] [Google Scholar]
Associated Data
This section collects any data citations, data availability statements, or supplementary materials included in this article.
Data Availability Statement
Data not shown in this article can be anonymized and made available to qualified investigators upon request.


