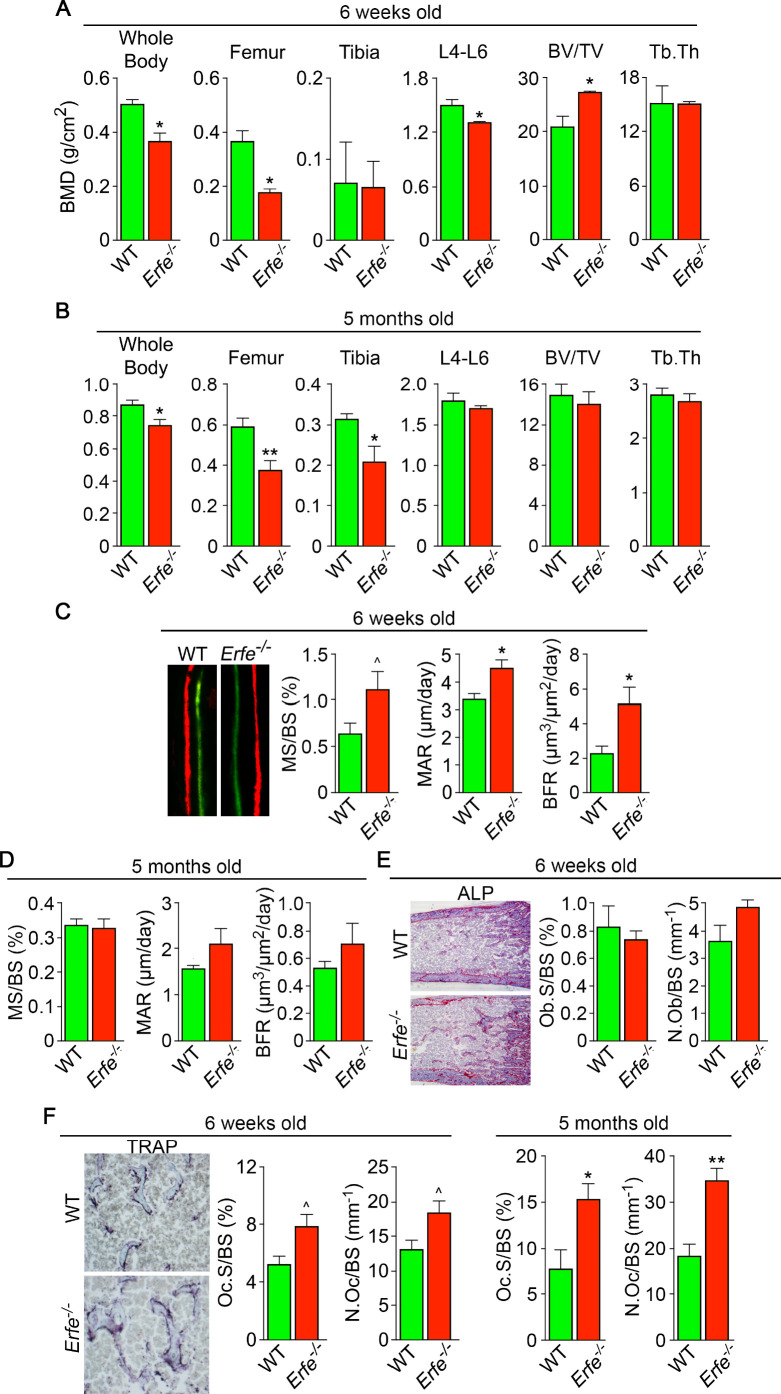
Figure 1. ERFE loss results in high turnover osteoporosis.
Bone mineral density (BMD) measured in whole body, femur, tibia, and lumbar spine (L4–L6) along with bone volume (BV/TV) and trabecular thickness (Tb.Th) in growing (6-week-old) (A) and mature (5-month-old) (B) Erfe-/- and wild-type (WT) littermates. Dynamic histomorphometry following two i.p. injections of calcein (green) and xylenol orange (red) given at days 8 and 2, respectively. Representative dual labels from the epiphysis are shown, together with measured and derived parameters, namely mineralizing surface (MS) as a function of bone surface (BS), mineral apposition rate (MAR) and bone formation rate (BFR) in 6-week-old (C) and 5-month-old (D) mice. (E) Alkaline phosphatase staining (magenta) in sections of femura demonstrates no differences in osteoblast surface (Ob.S) and number (N.Ob) as a function of BS in 6-week-old Erfe-/- and WT mice. (F) TRAP staining at the epiphysis showing both osteoclast surface (Oc.S) and number (N.Oc) as a function of BS. Statistics: Mean ± SEM; unpaired two-tailed Student’s t-test; *p<0.05, **p<0.01, ^0.05 < p < 0.1, N = 3–6 mice per group.


