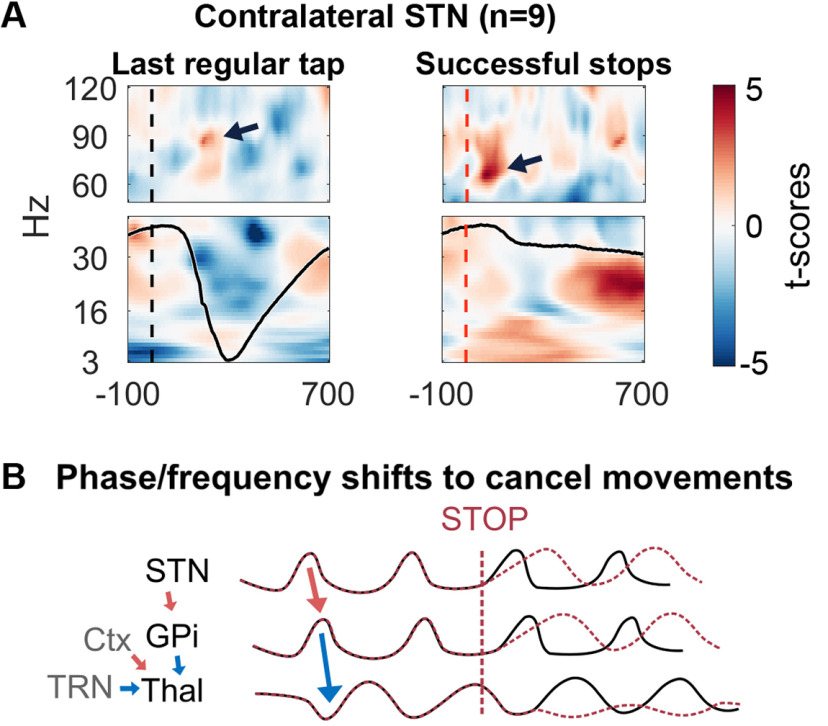
Figure 5.
Stop-related activity. A, STN power recorded during finger tapping (left) and successful stopping (right). The γ increase observed during the last regular tapping movement (= the final tap before the stop signal) peaked at around 90 Hz (shown by the arrow), while the γ increase during successful stopping peaked between 60–70 Hz. Peaks at 90 and 65 Hz correspond to γ cycles lasting 11 and 15 ms, respectively (including excitation and inhibition). A lower peak frequency could thus indicate slightly prolonged STN spiking within each cycle. The black curve in the lower panels denotes the finger movement (Left: The finger was first elevated, then it moved down to touch the table at around 300 ms and moved up again. Right: After the auditory stop signal, the downward movement stopped quickly, just after the γ increase.) A is adapted from Fischer et al. (2017). B, Proposed mechanism: increased drive to the STN after the stop signal may result in prolonged excitation and longer γ cycles (red dashed lines) compared with movement-related activity (black lines, also see Fig. 4B). The shifted rhythm is passed on to the GPi. GPi inhibition, cortical excitation and TRN inhibition converge in the thalamus, where they may cancel each other out.

