

Abstract
Background
Inflammatory bowel diseases (IBDs) are associated with substantial health care needs. We estimated the national burden and patterns of financial toxicity and its association with unplanned health care utilization in adults with IBD in the United States.
Methods
Using the National Health Interview survey (2015), we identified individuals with self-reported IBD and assessed national estimates of financial toxicity across domains of financial hardship due to medical bills, cost-related medication nonadherence (CRN) and adoption of cost-reducing strategies, personal and health-related financial distress (worry about expenses), and health care affordability. We also evaluated the association of financial toxicity with emergency department (ED) utilization.
Results
Of the estimated 3.1 million adults with IBD in the United States, 23% reported financial hardships due to medical bills, 16% of patients reported CRN, and 31% reported cost-reducing behaviors. Approximately 62% of patients reported personal and/or health-related financial distress, and 10% of patients deemed health care unaffordable. Prevalence of financial toxicity was substantial even in participants with higher education, with private insurance, and belonging to middle/high-income families, highlighting underinsurance. Inflammatory bowel disease was associated with 1.6 to 2.6 times higher odds of financial toxicity across domains compared with patients without IBD. Presence of any marker of financial toxicity was associated with higher ED utilization.
Conclusions
One in 4 adults with IBD experiences financial hardship due to medical bills, and 1 in 6 adults reports cost-related medication nonadherence. These financial determinates of health—especially underinsurance—have important implications in the context of value-based care.
Keywords: burden, value-based care, Crohn’s disease, distress, affordability
Inflammatory bowel diseases (IBDs) are chronic autoimmune diseases with a relapsing and remitting course. Based on estimates from the National Health Interview Survey (NHIS) 2015, they affect approximately 3.1 million adults in the United States.1 Inflammatory bowel disease is one of the top 5 most expensive gastrointestinal conditions, with annual costs exceeding $10 billion.2–4 In the United States, approximately 40% of health care spending in patients with IBD is attributed to inpatient care, 18% to emergency department (ED) visits, and 12% to pharmacotherapy.5 Given the chronic nature of the disease, unpredictable course with high frequency of unplanned health care utilization, and increasing use of expensive targeted immunosuppressive medications, assessing the financial health of patients with IBD is pivotal for health care policy and shared decision-making. Though recent studies have identified some key factors associated with high resource utilization and potential barriers to high-value care, few have assessed the burden of financial toxicity in patients with IBD and how it associates with patient behavior and health care utilization.6–9
The concept of “financial toxicity” was originally used to describe the financial hardships experienced by patients with cancer related to cost implications of their treatment. It includes 2 aspects: (1) objective financial burden, such as nonadherence to medications due to high costs, and (2) subjective financial distress, such as treatment-related behaviors based on costs.10, 11 Financial toxicity has been shown to have negative effects on health care spending and patients’ quality of life and health outcomes.10–15 Though the burden of financial toxicity has been well described in cancer patients and more recently in cardiovascular diseases, few studies have assessed this phenomenon in patients with IBD. These “financial determinants of health” have important implications on long-term outcomes in patients with IBD, determining optimal management of patients within their socioeconomic context to minimize disease-related complications and maximize health-related quality of life and productivity. In a 2017 survey study of 3608 patients with IBD through the Crohn’s and Colitis Foundation database, Rubin and colleagues observed that 66% of respondents reported health care–related financial worry, and over one fourth of patients had foregone therapy as a result.16 In a smaller survey-based study of 48 patients with Crohn’s disease (CD), Voit and colleagues found a similar pattern, with a majority of patients experiencing at least mild financial distress.17 Although these studies provide some insight into the financial challenges experienced by patients with IBD, these findings may not be generalizable due to study design and do not comprehensively assess the spectrum of financial toxicity and its impact on health care utilization.
Hence, to ascertain US national estimates of financial toxicity in patients with IBD, we performed a survey analysis of noninstitutionalized adults in the US using a publicly available survey in NHIS 2015, to estimate the prevalence of financial toxicity in patients with IBD and assessed it’s impact on ED utilization.
METHODS
Data Source
We used data from the NHIS, which is an annual household survey compiled by the National Center for Health Statistics/Center for Disease Control & Prevention. This cross-sectional survey utilizes a complex and multistage sampling strategy and includes 87,500 individuals from nearly 35,000 households to provide estimates on noninstitutionalized US population.18 Data are organized and collected through questionnaires and include demographic, self-reported health and socioeconomic information for individual families and access to health care from at least 1 randomly selected adult member per househould.18 Because the survey data is publicly available and contains deidentified data, our study was exempt from the institutional review board committee.
Study Population
Patients were identified with IBD based on a question included in the Sample Adult Core component of the survey. We selected those who responded affirmatively to the question, “Have you ever been told by a doctor or other health professional that you had Crohn’s disease or ulcerative colitis?” We only included adults (age 18 or older) in our sample. Information on sociodemographic characteristics (eg, age, gender, race/ethnicity, highest level of education obtained, marital status, current employment status, health insurance coverage, poverty status [calculated using NHIS imputed income files], and region of residence) was collected from the NHIS Household Module and Family Core components of the survey.
Study Outcomes
We assessed financial toxicity across the following domains: (1) Financial hardships due to medical bills, (2) financial distress with regards to the level of worry related to personal and/or financial matters, (3) cost-related medication nonadherence (CRN), and (4) health care affordability.13–15
Financial hardship due to medical bills
Patients were deemed to have financial hardships from medical bills if within the last 12 months they reported experiencing problems paying medical bills and/or difficulty with paying off medical bills over time. Patients who had difficulty paying medical bills were additionally asked if they had any medical bills they were unable to pay at all. Based on these questions, financial hardships due to medical bills were graded into 3 mutually exclusive categories: (1) no financial hardship from medical bills, (2) financial hardship from medical bills but able to pay, and (3) financial hardships and unable to pay bills at all.
Financial distress
The definition of financial distress was based on 6 questions regarding the level of worry (4-point Likert scale, ranging from “not worried at all” to “very worried”) based on concerns about personal and health care–associated financial matters: (1) ability to pay medical costs of illness/accident, (2) ability to pay medical costs of usual health care, (3) inability to afford prescription medicine in the past 12 months and personal financial distress, (4) maintaining standard of living, (5) inability to pay rent/mortgage/housing costs, and (6) inability to pay monthly bills.
Cost-related medication nonadherence
Patients were identified as having CRN if they responded affirmatively to any of the following questions: (1) skipping medication doses, (2) taking less medicine, or (3) delaying filling a prescription. To assess whether patients adopted cost-reducing strategies for prescription medications, we identified these patients based on an affirmative response to the following questions: (1) “During the past 12 months, have you asked your doctor for lower cost medication to save money?” (2) “During the past 12 months, have you bought prescription drugs from another country to save money?” and (3) “During the past 12 months, have you used alternative therapies to save money?”
Health care affordability
Patients who could not afford health care were identified based on (1) inability to afford to see a specialist or (2) inability to afford follow-up care within the past 12 months.
In addition, we evaluated the coprevalence of financial hardship due to medical bills, financial distress, CRN, and health care affordability with the prevalence of financial toxicity based on highest education obtained, income level, insurance status, and race/ethnicity. Finally, we evaluated the association between presence and degree of financial toxicity and emergency department (ED) visits within the past 12 months as a secondary outcome.
Covariates
The following demographic information was collected from the NHIS: age, gender, race/ethnicity (white, black, Hispanic, and others), geographical region, marital status, educational attainment stratified by receipt of college education, insurance status (private, public, uninsured), employment status, size of the family, family income calculated as a percentage of the federal poverty limit from the Census Bureau (high-income [≥400% federal poverty limit], middle-income [200% to 400%], and low-income [<200%]), body mass index (BMI), smoking status, and self-reported major medical conditions (coronary artery disease, diabetes mellitus, and chronic obstructive pulmonary disease).
Statistical Analysis
We accounted for the complex, multistage, probability, sampling design of the NHIS by adjusting for clustering, stratification, and weighting for all variables and used survey-specific descriptive statistics to provide weighted national estimates and accompanying 95% confidence intervals (CIs) for individuals with IBD who reported 1 or more domains of financial toxicity. For categorical variables, we used Rao-Scott x2 test to assess for differences; and to compare continuous variables, we used survey-specific linear regression. Unadjusted and adjusted multivariable logistic regression models were utilized to assess association between financial toxicity domains (eg, financial hardships, financial distress, CRN, and health care affordability) and ED visits. The results were reported as odds ratio (OR) and accompanying 95% CI. We performed all survey-based analyses using Stata, version 14 (StataCorp, College Station, Texas), and used P < 0.05 to define statistical significance.
RESULTS
Within the NHIS survey, 454 patients self-reported IBD, which represents a weighted estimate of 3.1 million adults with IBD nationally (1.3% of US adults). Demographic information on this cohort has been described previously.1
Financial Hardship Due to Medical Bills
On survey analysis, 23% (95% CI, 18–29) of US adults with IBD reported financial hardships due to medical bills, of whom over half (12%) were unable to pay medical bills at all. Compared with patients without financial hardship, patients with financial hardship due to medical bills were younger, single, less educated, and reported a lower income; over half the patients with financial hardships had private insurance (Table 1). Patients with financial hardship due to medical bills had a higher prevalence of financial distress, CRN and inability to afford health care (Figure 1A), and a significantly higher burden of financial toxicity measures compared with those who had no financial hardships (Figure 1B). After we adjusted for comorbid medical conditions, age, gender, race, education, income, and insurance status, patients with IBD had 1.8 times higher odds of financial hardship due to medical bills (OR, 1.78; 95% CI, 1.27–2.49) compared with patients without IBD (Supplementary Table 1). There was a significantly higher burden of ED visits in patients who reported a higher degree of financial hardship due to medical bills (financial hardship and unable to pay medical bills vs financial hardship but able to pay medical bills vs no financial hardship: 52% vs 32% vs 27%, respectively; P = 0.049).
TABLE 1.
Characteristics of Adults With IBD With Varying Degrees of Financial Hardship Due to Medical Bills
| Variable | No Financial Hardship From Medical Bills, Weighted % | Financial Hardship From Medical Bills But Able to Pay, Weighted % | Unable to Pay Bills at All, Weighted % | P |
|---|---|---|---|---|
| Sample, n | 362 | 45 | 47 | |
| Weighted sample, n (weighted %) | 2,366,413 (77%) | 352,878 (11%) | 367,697 (12%) | |
| Average Age, y | 54.2 (51.9–56.5) | 47.9 (39.1–56.8) | 43.4 (37.4–49.5) | <0.01 |
| Average BMI | 28.3 (26.9–29.6) | 32.4 (23.4–41.5) | 35.1 (27.7–42.6) | 0.048 |
| Female | 1,291,351 (55%) | 204,493 (58%) | 276,361 (75%) | 0.16 |
| Married | 1,366,840 (58%) | 126,577 (36%) | 106,926 (29%) | <0.01 |
| Less than high school education | 125,486 (5%) | 24,435 (7%) | 71,596 (19%) | <0.01 |
| Ever worked in past 12 months | 1,452,268 (62%) | 145,103 (41%) | 145,976 (40%) | 0.04 |
| Family size | ||||
| 1 | 597,993 (25%) | 53,038 (15%) | 75,010 (20%) | 0.06 |
| 2 | 984,191 (42%) | 106,040 (30%) | 92,366 (25%) | |
| ≥3 | 784,229 (33%) | 193,765 (55%) | 200,321 (54%) | |
| Family Income | ||||
| Poor/low-income | 587,211 (26%) | 130,688 (40%) | 267,160 (74%) | <0.01 |
| Middle/high-income | 1,673,032 (74%) | 197,345 (60%) | 94,502 (26%) | |
| Race/ethnicity | ||||
| Non-Hispanic white | 1,815,608 (78%) | 302,045 (86%) | 253,478 (73%) | 0.55 |
| Black | 133,346 (5%) | 22,001 (6%) | 32,719 (9%) | |
| Asian | 112,993 (5%) | 8,370 (2%) | 3,771 (1%) | |
| Hispanic | 277,453 (12%) | 20,694 (6%) | 59,223 (17%) | |
| Insurance status | ||||
| No insurance | 47,328 (2%) | 10,622 (3%) | 78,099 (21%) | <0.01 |
| Private | 785,649 (33%) | 155,266 (44%) | 186,165 (51%) | |
| Non-private | 1,533,436 (65%) | 186,990 (53%) | 103,433 (28%) | |
| Region | ||||
| Northeast | 444,176 (19%) | 121,637 (34%) | 31,365 (8%) | <0.01 |
| Midwest | 500,970 (21%) | 108,969 (31%) | 72,179 (20%) | |
| South | 908,703 (38%) | 45,380 (13%) | 228,781 (62%) | |
| West | 512,802 (22%) | 76,892 (22%) | 35,372 (10%) | |
| Smoking status | ||||
| Never smoker | 1,292,687 (55%) | 162,072 (46%) | 196,466 (53%) | 0.77 |
| Current smoker | 343,045 (15%) | 85,026 (24%) | 65,084 (17%) | |
| Former smoker | 730,094 (30%) | 106,000 (30%) | 106,401 (29%) | |
| Comorbidities | ||||
| Coronary heart disease | 211,557 (9%) | 8,998 (3%) | 18,054 (5%) | 0.22 |
| Diabetes mellitus | 324,199 (14%) | 37,546 (11%) | 52,103 (14%) | 0.89 |
| Chronic obstructive pulmonary disease | 157,366 (7%) | 39,452 (11%) | 54,493 (15%) | 0.17 |
| Hypertension | 892,784 (88%) | 66,080 (69%) | 140,222 (75%) | 0.36 |
| Hypercholesterolemia | 643,916 (75%) | 105,717 (81%) | 95,779 (79%) | 0.87 |
| Depression/anxiety/emotional problem causes difficulty with activity | 162,344 (12%) | 29,454 (12%) | 32,430 (10%) | 0.95 |
| Outcomes | ||||
| Emergency room visit | 637,651 (27%) | 105,097 (32%) | 186,107 (52%) | 0.0497 |
FIGURE 1.

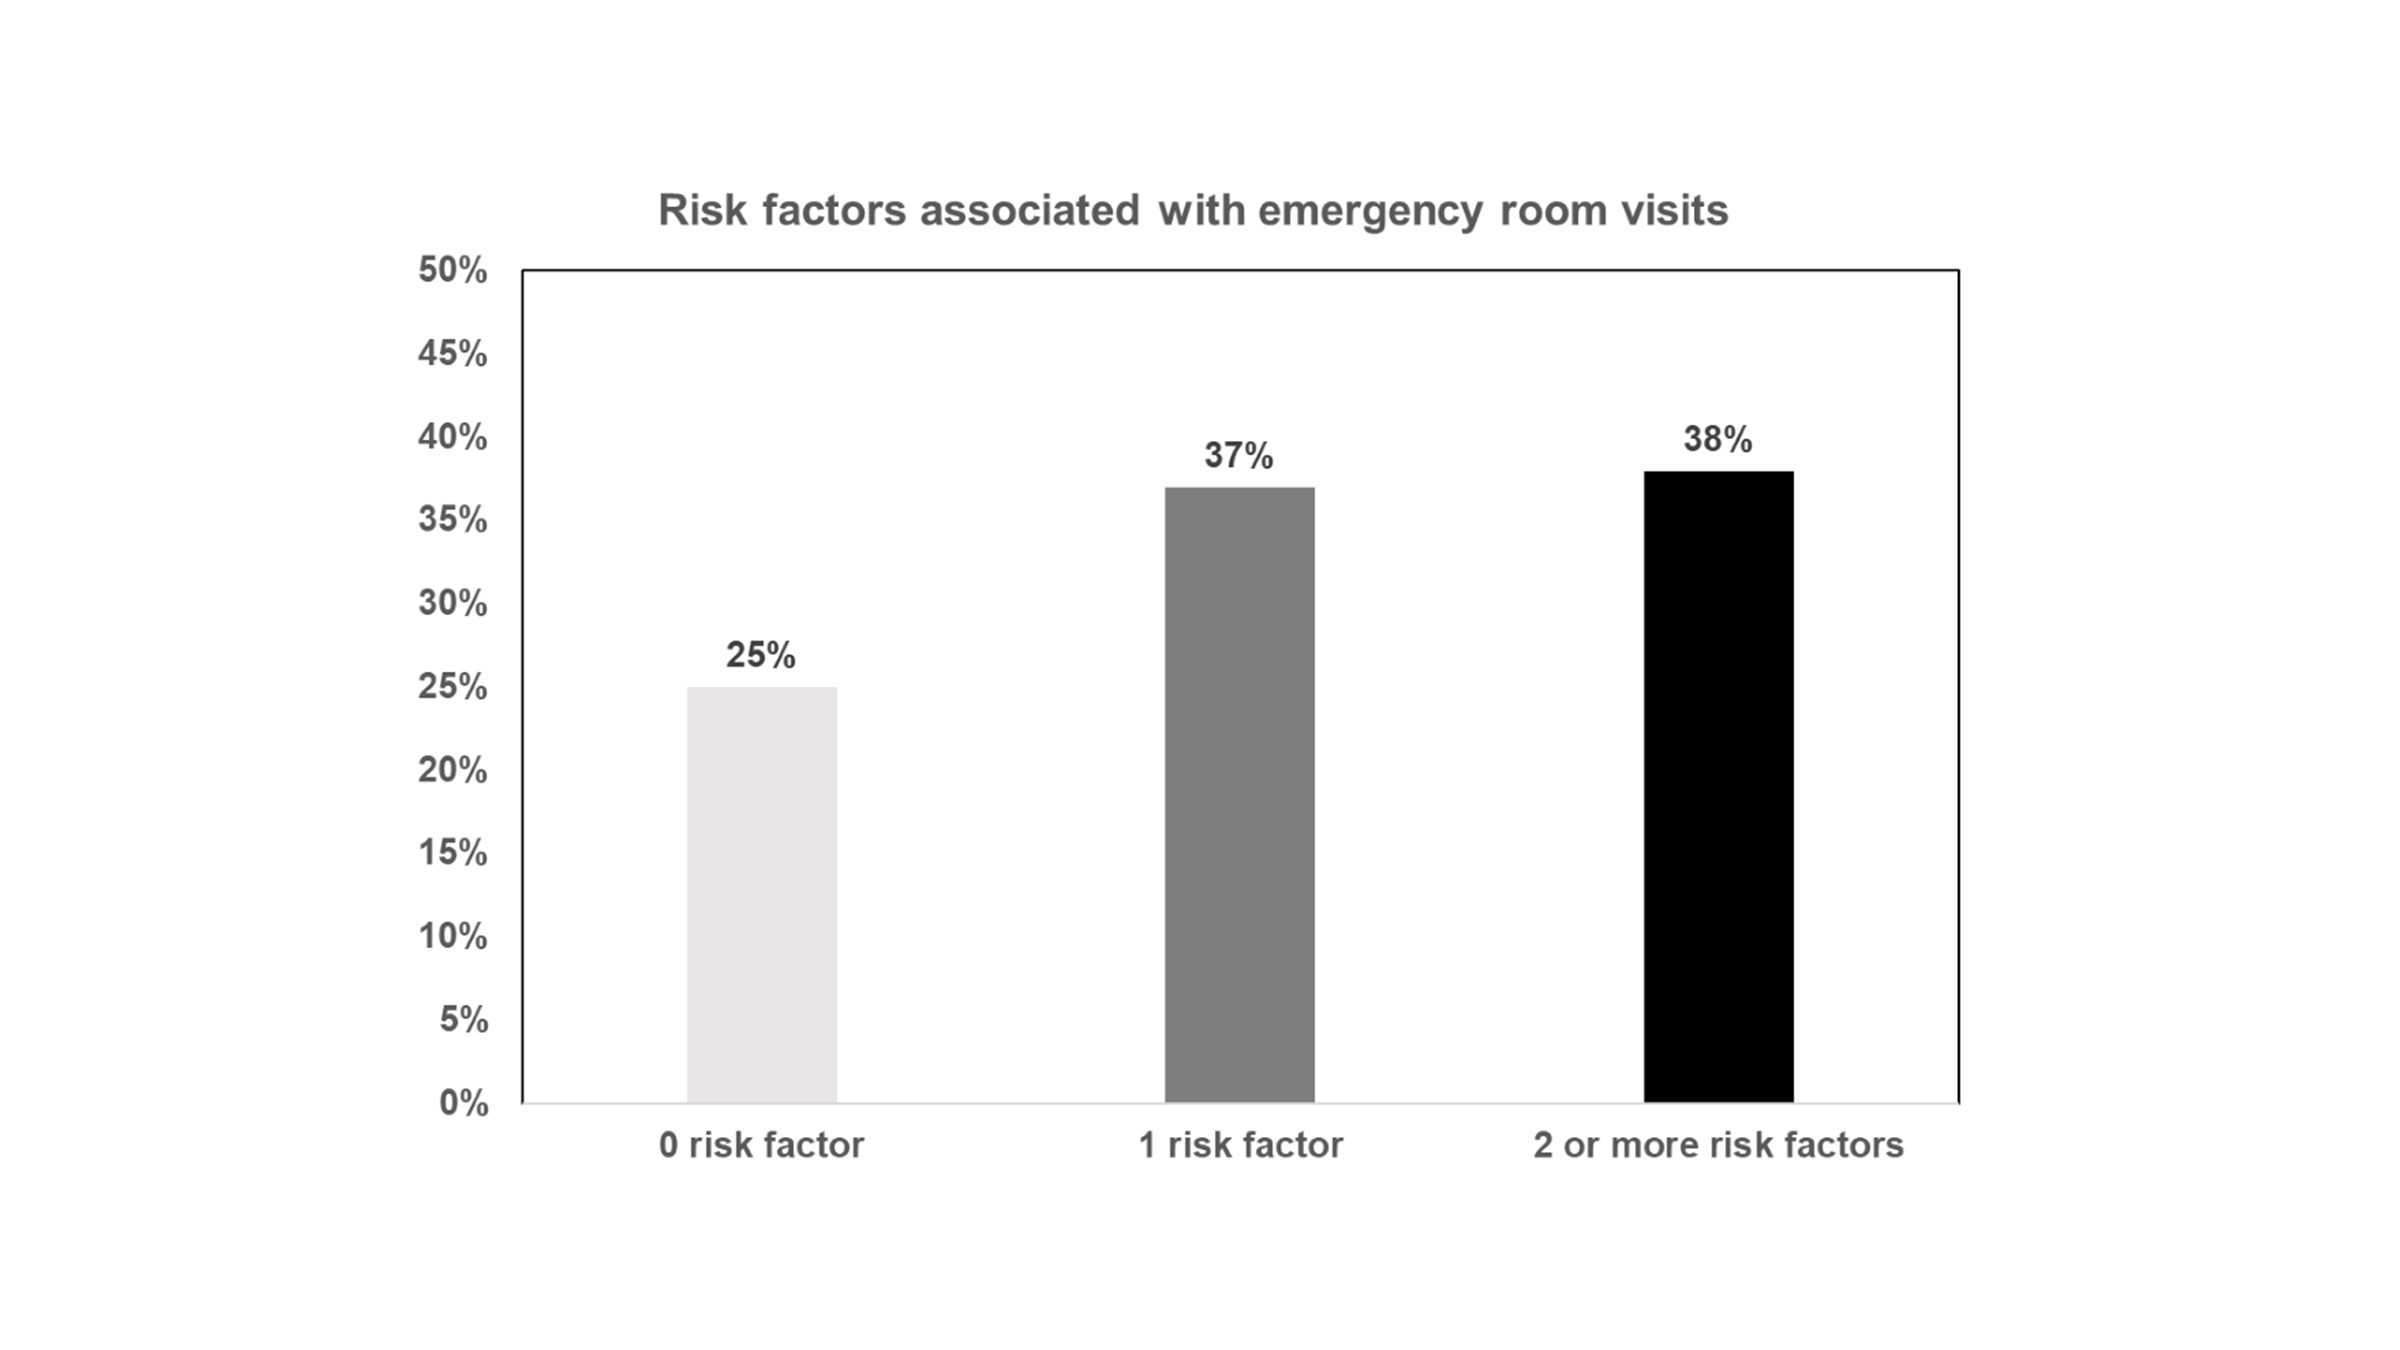
(A) Prevalence of high financial distress, cost-related medication nonadherence, and health care affordability by financial hardship status among adults with IBD from the National Health Interview Survey 2015. (B) Distribution of number of financial burden domains/risk factors (high financial distress, cost-related medication nonadherence, unable to afford health care), by financial hardship status.
Financial Distress
Approximately 62% (95% CI, 57–68) of adult patients with IBD in the US reported personal and/or financial distress. Overall, 9% of patients reported only personal financial distress, 11% reported only health care–related financial distress, and 42% reported both (Supplementary Figure 2). Compared with patients without financial distress, patients with financial distress were less educated and belonged to poor/low-income families (Supplementary Table 2). Patients with financial distress had a higher prevalence of financial hardships due to medical bills, CRN, and inability to afford health care (Figure 2A) and a significantly higher burden of financial toxicity measures compared with those who had no financial distress (Figure 2B). Patients with IBD had 1.6 times higher odds of financial hardship due to medical bills (OR, 1.56; 95% CI, 1.21–2.02) compared with patients without IBD (Supplementary Table 3). We did not observe a significant association with higher burden of ED visits in patients who reported the presence of personal and/or health-related financial distress.
FIGURE 2.

(A) Prevalence of financial hardship, cost-related medication nonadherence, and health care affordability by financial distress status among adults with IBD from the National Health Interview Survey 2015. (B) Distribution of number of financial burden domains/risk factors (financial hardship, cost-related medication nonadherence, unable to afford health care), by financial distress status, among adults with IBD.
Cost-related Medication Nonadherence and Cost-reducing Behaviors
Approximately 17% (95% CI, 11–21) of adult patients with IBD in the US reported CRN (Supplementary Figure 3). Cost-related medication nonadherence was associated with maladaptive treatment-related coping strategies, with patients reporting significantly higher rates of cost-reducing behaviors, being more likely to ask doctors for lower-cost medications (71% vs 20%, P < 0.01), and more likely to use alternative therapies to save money (27% vs 5%, P < 0.01; Figure 3A). Compared with patients without CRN, patients with CRN were less educated and belonged to low-income families (Table 2). Patients with CRN had a higher prevalence of financial hardships due to medical bills, financial distress, and inability to afford health care (Figure 3B) and a significantly higher burden of financial toxicity measures compared with those who had no CRN (Figure 3C). Patients with IBD had 2.6 times higher odds of financial hardship due to medical bills (OR, 2.61; 95% CI, 1.77–3.87) compared with patients without IBD (Supplementary Table 4). Presence of CRN was not associated with a significantly higher burden of ED.
FIGURE 3.

(A) Cost-reducing behaviors in patients with vs without cost-related medication nonadherence. (B) Prevalence of financial hardship, financial distress, and health care affordability by cost-related medication nonadherence status among adults with IBD from the National Health Interview Survey 2015. (C) Distribution of number of financial burden domains/risk factors (financial hardship, financial distress, unable to afford health care), by cost-related medication nonadherence status.
TABLE 2.
Characteristics of Adults With IBD With and Without Cost-Related Medication Nonadherence
| Variable | No Cost-related Nonadherence, Weighted % | Cost-related Nonadherence, Weighted % | P |
|---|---|---|---|
| Sample, n | 382 | 72 | |
| Weighted sample, n (weighted %) | 504,773 (84%) | 2,582,524 (16%) | |
| Average Age, y | 53.3 (51.0–55.5) | 46.8 (40.4–53.2) | 0.07 |
| Average BMI | 29.5 (27.7–31.3) | 30.0 (25.5–34.5) | 0.83 |
| Female | 1,419,097 (55%) | 294,907 (70%) | 0.10 |
| Married | 1,401,794 (54%) | 198,578 (39%) | 0.12 |
| Less than high school education | 141,866 (6%) | 79,463 (16%) | 0.02 |
| Ever worked in past 12 months | 1,547,190 (60%) | 196,357 (39%) | 0.02 |
| Family size | |||
| 1 | 610,250 (24%) | 115,845 (23%) | 0.57 |
| 2 | 1,019,839 (39%) | 162,840 (32%) | |
| ≥3 | 952,435 (37%) | 226,088 (45%) | |
| Income | |||
| Poor/low-income | 700,361 (28%) | 284,661 (61%) | <0.01 |
| Middle/high-income | 1,782,307 (72%) | 182,609 (39%) | |
| Race/ethnicity | |||
| Non-Hispanic white | 1,967,875 (77%) | 403,165 (80%) | 0.36 |
| Black | 144,009 (6%) | 44,116 (9%) | |
| Asian | 125,215 (5%) | 0% | |
| Hispanic | 302,750 (12%) | 54,605 (11%) | |
| Insurance status | |||
| No insurance | 75,926 (3%) | 60,219 (12%) | <0.01 |
| Private | 854,041 (33%) | 273,335 (54%) | |
| Non-private | 1,652,815 (64%) | 171,219 (34%) | |
| Region | |||
| Northeast | 490,680 (19%) | 106,457 (21%) | 0.38 |
| Midwest | 570,738 (22%) | 111,252 (22%) | |
| South | 950,627 (37%) | 232,448 (46%) | |
| West | 570,480 (22%) | 54,616 (11%) | |
| Smoking status | |||
| Never smoker | 1,406,610 (54%) | 242,231 (48%) | 0.30 |
| Current smoker | 370,242 (14%) | 122,730 (24%) | |
| Former smoker | 805,031 (31%) | 137,365 (27%) | |
| Comorbidities | |||
| Coronary heart disease | 196,788 (8%) | 41,745 (8%) | 0.88 |
| Diabetes mellitus | 332,887 (13%) | 81,016 (16%) | 0.52 |
| Chronic obstructive pulmonary disease | 205,052 (8%) | 46,288 (9%) | 0.74 |
| Hypertension | 910,097 (87%) | 188,839 (75%) | 0.26 |
| Hypercholesterolemia | 747,418 (78%) | 98,002 (63%) | 0.24 |
| Depression/anxiety/emotional problem causes difficulty with activity | 170,525 (12%) | 53,693 (13%) | 0.76 |
| Outcomes | |||
| Emergency room visit | 728,564 (29%) | 200,238 (40%) | 0.18 |
Health Care Affordability
Approximately 10% (95% CI, 6–13) of adult patients with IBD in the United States reported not being able to afford health care (Supplementary Figure 4). Similar to other financial risk factors, patients unable to afford health care were less educated, belonged to low-income families, and were less likely to have insurance (Supplementary Table 5). Patients unable to afford health care had a higher prevalence of financial hardships due to medical bills, financial distress, and CRN (Supplementary Figure 5A) and a significantly higher burden of financial toxicity measures compared with those who were able to afford health care (Supplementary Figure 5B). Patients with IBD had 1.7 times higher odds of financial hardship due to medical bills (OR, 1.73; 95% CI, 1.15–2.60) compared with patients without IBD (Supplementary Table 6). Patients unable to afford to see a specialist or follow-up care had higher rates of ED visits compared with patients who were able to afford health care (50% vs 28%, P = 0.02).
Education, Family Income, Insurance Status, and Prevalence of Financial Toxicity
On stratified analyses, less educated individuals in poor or low-income families and without insurance had higher prevalence of all aspects of financial toxicity. However, prevalence of financial toxicity was also high in individuals who achieved at least high school education, belonged to middle- or high-income families and had insurance (private or nonprivate; Table 3). Approximately 15%, 54%, and 9% of individuals from middle/high-income families experienced financial hardship due to medical bills, reported financial distress, and reported CRN, respectively. Similarly, 31%, 75%, and 24% of patients with private insurance experienced financial hardship due to medical bills, reported financial distress, and reported CRN, respectively. There were no significant differences in the prevalence of financial toxicity based on race/ethnicity.
TABLE 3.
Prevalence of Financial Toxicity by Level of Education, Family Income, and Insurance Status
| FINANCIAL HARDSHIPS FROM MEDICAL BILLS | FINANCIAL DISTRESS | COST-RELATED NONADHERENCE | HEALTH CARE AFFORDABILITY | ||||||||||
|---|---|---|---|---|---|---|---|---|---|---|---|---|---|
| No Financial Hardship From Medical Bills, Weighted % | Financial Hardship From Medical Bills But Able to Pay, Weighted % | Unable to Pay Bills at All, Weighted % | P | No Financial Distress, Weighted % | Financial Distress, Weighted % | P | No Cost- related Nonadherence, Weighted % | Cost-related Nonadherence, Weighted % | P-value | Affordable Health Care, Weighted % | Lack of Affordable Health Care, Weighted % | P | |
| Education Level | |||||||||||||
| No high school education | 125,460 (57%) | 24,423 (11%) | 71,543 (32%) | <0.01 | 40,942 (18%) | 180,484 (82%) | 0.02 | 141,934 (64%) | 79,492 (36%) | 0.02 | 141,710 (64%) | 79,643 (36%) | <0.01 |
| High school education or higher | 2,237,611 (78%) | 328,614 (11%) | 296,268 (11%) | 1,119,235 (39%) | 1,743,258 (61%) | 2,437,413 (85%) | 425,080 (15%) | 2,613,173 (92%) | 218,614 (8%) | ||||
| Income Level | |||||||||||||
| Poor/low- income | 587,149 (60%) | 130,707 (13%) | 267,128 (27%) | <0.01 | 206,650 (21%) | 778,335 (79%) | <0.01 | 700,324 (71%) | 284,660 (29%) | <0.01 | 754,937 (77%) | 220,938 (23%) | <0.01 |
| Middle/high- income | 1,673,158 (85%) | 197,478 (10%) | 94,514 (5%) | 904,861 (46%) | 1,060,093 (54%) | 1,782,410 (91%) | 182,544 (9%) | 1,890,816 (97%) | 52,469 (3%) | ||||
| Insurance status | |||||||||||||
| No insurance | 47,380 (35%) | 10,620 (8%) | 78,150 (57%) | <0.01 | 9,408 (7%) | 126,742 (93%) | <0.01 | 75,931 (56%) | 60,219 (44%) | <0.01 | 74,672 (55%) | 61,343 (45%) | <0.01 |
| Private | 785,639 (70%) | 155,324 (14%) | 186,209 (17%) | 284,273 (25%) | 842,899 (75%) | 853,833 (76%) | 273,339 (24%) | 930,797 (83%) | 187,278 (17%) | ||||
| Nonprivate | 1,533,416 (84%) | 187,140 (10%) | 103,419 (6%) | 869,854 (48%) | 954,121 (52%) | 1,652,886 (91%) | 171,089 (9%) | 1,752,385 (97%) | 49,739 (3%) |
Financial Toxicity and Emergency Department Visits
Patients with any aspect of financial toxicity (defined as either having financial hardships due to medical bills, personal and/or health care–related financial distress, CRN, or inability to afford health care) had higher rates of ED visits compared with patients without any financial risk factors (Supplementary Figure 6). After we adjusted for multiple demographic variables, the presence of financial toxicity domains were not independently associated with increased risk of ED visits (Supplementary Table 7).
DISCUSSION
In this study, we made important observations in a nationally representative sample of US adults with IBD regarding financial determinants of health. First, we observed high prevalence of financial toxicity in patients with IBD. Approximately 1 in 4 patients reported financial hardship due to medical bills, 1 in 6 reported CRN, and two thirds of patients reported personal and/or health-related financial distress. These domains were frequently overlapping, with patients reporting trouble across multiple domains simultaneously. Though we were unable to determine whether these financial determinants are directly attributable to IBD, we observed that IBD was independently associated with higher prevalence of financial toxicity after adjusting for major comorbidities; moreover, these financial determinants, regardless of primary source, impact patients’ ability to prioritize health and should be accounted for during IBD management. Second, we observed that although this burden of financial toxicity was high in less educated patients with low family income and without insurance, it was also substantial in individuals who achieved at least high school education, belonged to middle or high-income familie,s and had insurance (private or nonprivate)—groups that we may not recognize as being at risk for financial toxicity. Interestingly, the burden of financial toxicity was not significantly impacted by race/ethnicity in contrast to prior observations on health disparities in IBD. Finally, we observed that the presence and magnitude of financial toxicity was associated with higher rate of unplanned health care utilization, including ED visits. Financial toxicity was also associated with higher rates of maladaptive treatment-related coping strategies, such as requesting doctors for lower-cost medications and using alternative therapies. Our findings have significant implications for policies on public health and population health management. On an individual level, these financial determinants of health are not easily modifiable and require significant involvement from the public health sector and societal interventions focused on increasing health care access at affordable rates and avoid “underinsurance.” 19, 20 Population health management strategies for IBD should also incorporate universal screening for financial toxicity as part of a multicomponent process to identify high-risk patients and deliver effective and high-value, patient-centered care to manage clinical and financial risks.8 With the global financial crises brought on by the coronavirus disease 2019 pandemic, we can anticipate considerably higher rates of financial toxicity in our patients with IBD and should be cognizant of the same during shared decision-making.
Our study highlights the fact that the current insurance coverage structure is insufficient in protecting patients from the risk of financial burden from expected medical bills. Many patients with IBD who reported having difficulty paying bills and paying them over time had insurance coverage, including >50% with private insurance. This suggests the concept of underinsurance, or inadequate protection, against substantial financial impact of out-of-pocket health expenses. The risk of financial hardships induced by medical care will be exacerbated, especially among low-income IBD patients and their families because many families in the United States report having limited financial resources/savings to cover unexpected expenses and current trends of payers diverting a greater proportion of cost-sharing to patients.
Our study also highlights coexistence of financial toxicity across multiple domains and potential tradeoffs associated with financial hardship due to medical bills. Over 40% of patients with financial hardship had at least 2 other financial risk factors of CRN, financial distress, and inability to afford health care. Over 30% of patients with financial hardship who were able to pay medical bills, and over 50% ofpatients who were unable to pay medical bills reported medication nonadherence and maladaptive coping strategy. Seven in 10 patients reported inability to afford health care, having difficulty establishing care with a specialist, and being able to afford follow-up care. Although this has previously been described among low-income families and older minorities, our findings suggests that the presence of financial hardship from medical bills is a key determinant of cost-related medication nonadherence among patients with IBD, regardless of income level and insurance status. Future studies and interventions (such as public health policies) addressing cost-related barriers are needed to improve medication adherence.
Although our findings provide key insights into the national estimates of financial toxicity in patients with IBD, they do have limitations. First, identification of patients with IBD are based on self-reported diagnoses without validation. However, it forms the basis for Centers for Disease Control official estimates of the burden of IBD in the United States. Second, the NHIS does not collect information on IBD disease activity nor IBD-related medications, so we are unable to assess the effect of these factors on financial toxicity and vice versa. Third, because the NHIS is a cross-sectional survey, we are unable to establish causality between the financial toxicity risk factors and certain outcomes such as ED visits; however, our findings are similar to a previous survey-based study by Rubin and colleagues that has shown an association between financial hardships and ED visits.16 Finally, within the sampling frame of NHIS, the representative population was older. The burden of financial toxicity in younger patients with IBD, particularly those who rely on their parents’ insurance until they are 26 and those in early transition to independence and financial responsibility, needs to be better studied.
In conclusion, we observed high prevalence of financial toxicity across domains of financial hardship due to medical bills, personal and/or health care financial distress, cost-related medication nonadherence, and health care affordability in patients with IBD. This was substantial even in patients belonging to middle- to high-income families, those with private insurance, and those with higher education. Given the impact of these risk factors on maladaptive coping, treatment-related decision-making, and unplanned health care utilization, our study highlights the importance of screening for financial toxicity risk factors as standard of care in all patients with IBD.
Supplementary Material
Supported by: NN is supported by NIH/NIDDK (T32DK007202) and NLM (T15LM011271). WS is partially supported by NIDDK-funded San Diego Digestive Diseases Research Center (P30 DK120515). SS is supported by NIH/NIDDK (K23DK117058), ACG Junior Faculty Development Award and the Crohn’s and Colitis Foundation Career Development Award (#404614).
Author Contribution: NHN, RK, and SS contributed to the study concept and design. NHN and RK contributed to the acquisition of data. NHN and SS contributed to the analysis and interpretation of data and drafting of the manuscript. RK, PSD, BSB, LOM, and WJS contributed to the critical revision of the manuscript for important intellectual content . NHN, RK, PSD, BSB, LOM, WJS, and SS approved the final manuscript.
Conflicts of Interest: PSD has received research support from Takeda, Pfizer, Abbvie, Janssen, Polymedco, ALPCO, Buhlmann, and Prometheus and consulting fees from Takeda, Pfizer, Abbvie, and Janssen. BSB has received a research grant from Prometheus Biosciences and consulting fees from Prometheus Laboratories and Pfizer. SS has received research grants from AbbVie and Janssen. WJS has received research grants from Atlantic Health care Limited, Amgen, Genentech, Gilead Sciences, Abbvie, Janssen, Takeda, Lilly, Celgene/Receptos, Pfizer, and Prometheus Laboratories (now Prometheus Biosciences); consulting fees from Abbvie, Allergan, Amgen, Arena Pharmaceuticals, Avexegen Therapeutics, BeiGene, Boehringer Ingelheim, Celgene, Celltrion, Conatus, Cosmo, Escalier Biosciences, Ferring, Forbion, Genentech, Gilead Sciences, Gossamer Bio, Incyte, Janssen, Kyowa Kirin Pharmaceutical Research, Landos Biopharma, Lilly, Oppilan Pharma, Otsuka, Pfizer, Progenity, Prometheus Biosciences (merger of Precision IBD and Prometheus Laboratories), Reistone, Ritter Pharmaceuticals, Robarts Clinical Trials (owned by Health Academic Research Trust, HART), Series Therapeutics, Shire, Sienna Biopharmaceuticals, Sigmoid Biotechnologies, Sterna Biologicals, Sublimity Therapeutics, Takeda, Theravance Biopharma, Tigenix, Tillotts Pharma, UCB Pharma, Ventyx Biosciences, Vimalan Biosciences, Vivelix Pharmaceuticals; and stock or stock options from BeiGene, Escalier Biosciences, Gossamer Bio, Oppilan Pharma, Prometheus Biosciences (merger of Precision IBD and Prometheus Laboratories), Progenity, Ritter Pharmaceuticals, Ventyx Biosciences, Vimalan Biosciences. Spouse: consultant for and stock options in Opthotech; consultant for and stock in Progenity; employee of and stock options in Oppilan Pharma; employee of and stock options in Escalier Biosciences; employee of and stock options in Prometheus Biosciences (merger of Precision IBD and Prometheus Laboratories; employee of and stock options in Ventyx Biosciences; employee of and stock options in Vimalan Biosciences.
REFERENCES
- 1. Dahlhamer JM, Zammitti EP, Ward BW, et al. . Prevalence of inflammatory bowel disease among adults aged ≥18 Years—United States, 2015. 2016;65: 1166–1169. [DOI] [PubMed] [Google Scholar]
- 2. Mehta F. Report: economic implications of inflammatory bowel disease and its management. Am J Manag Care. 2016;22:s51–s60. [PubMed] [Google Scholar]
- 3. Peery AF, Crockett SD, Murphy CC, et al. . Burden and cost of gastrointestinal, liver, and pancreatic diseases in the United States: update 2018. Gastroenterology. 2019;156:254–272.e11. [DOI] [PMC free article] [PubMed] [Google Scholar]
- 4. Park KT, Ehrlich OG, Allen JI, et al. . The cost of inflammatory bowel disease: an initiative from the crohn’s & colitis foundation. Inflamm Bowel Dis. 2020;26:1–10. [DOI] [PMC free article] [PubMed] [Google Scholar]
- 5. Dieleman JL, Cao J, Chapin A, et al. . US health care spending by payer and health condition, 1996-2016. Jama. 2020;323:863–884. [DOI] [PMC free article] [PubMed] [Google Scholar]
- 6. Nguyen NH, Koola J, Dulai PS, et al. . Rate of risk factors for and interventions to reduce hospital readmission in patients with inflammatory bowel diseases. Clin Gastroenterol Hepatol. 2020;18:1939–1948. [DOI] [PMC free article] [PubMed] [Google Scholar]
- 7. Ahmed Z, Sarvepalli S, Garber A, et al. . Value-based health care in inflammatory bowel disease. Inflamm Bowel Dis. 2019;25:958–968. [DOI] [PubMed] [Google Scholar]
- 8. Dulai PS, Singh S, Ohno-Machado L, et al. . Population health management for inflammatory bowel disease. Gastroenterology. 2018;154:37–45. [DOI] [PubMed] [Google Scholar]
- 9. Nguyen NH, Khera R, Ohno-Machado L, et al. . Annual burden and costs of hospitalization for high-need, high-cost patients with chronic gastrointestinal and liver diseases. Clin Gastroenterol Hepatol. 2018;16:1284–1292.e30. [DOI] [PMC free article] [PubMed] [Google Scholar]
- 10. Zafar SY, Abernethy AP. Financial toxicity, Part I: a new name for a growing problem. Oncology (Williston Park). 2013;27:80–1, 149. [PMC free article] [PubMed] [Google Scholar]
- 11. Zafar SY, Peppercorn JM, Schrag D, et al. . The financial toxicity of cancer treatment: a pilot study assessing out-of-pocket expenses and the insured cancer patient’s experience. Oncologist. 2013;18:381–390. [DOI] [PMC free article] [PubMed] [Google Scholar]
- 12. Lentz R, Benson AB 3rd, Kircher S. Financial toxicity in cancer care: prevalence, causes, consequences, and reduction strategies. J Surg Oncol. 2019;120:85–92. [DOI] [PubMed] [Google Scholar]
- 13. Caraballo C, Valero-Elizondo J, Khera R, et al. . Burden and consequences of financial hardship from medical bills among nonelderly adults with diabetes mellitus in the United States. Circ Cardiovasc Qual Outcomes. 2020;13:e006139. [DOI] [PubMed] [Google Scholar]
- 14. Khera R, Valero-Elizondo J, Das SR, et al. . Cost-related medication nonadherence in adults with atherosclerotic cardiovascular disease in the United States, 2013 to 2017. Circulation. 2019;140:2067–2075. [DOI] [PubMed] [Google Scholar]
- 15. Valero-Elizondo J, Khera R, Saxena A, et al. . Financial hardship from medical bills among nonelderly U.S. adults with atherosclerotic cardiovascular disease. J Am Coll Cardiol. 2019;73:727–732. [DOI] [PubMed] [Google Scholar]
- 16. Rubin DT, Feld LD, Goeppinger SR, et al. . The Crohn’s and colitis foundation of america survey of inflammatory bowel disease patient health care access. Inflamm Bowel Dis. 2017;23:224–232. [DOI] [PubMed] [Google Scholar]
- 17. Voit A, Cross RK, Bellavance E, et al. . Financial toxicity in Crohn’s disease. J Clin Gastroenterol. 2019;53:e438–e443. [DOI] [PubMed] [Google Scholar]
- 18. Parsons VL, Moriarity C, Jonas K, et al. . Design and estimation for the national health interview survey, 2006–2015. Vital Health Stat 2014:2:1–53. [PubMed] [Google Scholar]
- 19. Chino F, Peppercorn JM, Rushing C, et al. . Out-of-pocket costs, financial distress, and underinsurance in cancer care. JAMA Oncol. 2017;3:1582–1584. [DOI] [PMC free article] [PubMed] [Google Scholar]
- 20. Lavarreda SA, Brown ER, Bolduc CD. Underinsurance in the United States: an interaction of costs to consumers, benefit design, and access to care. Annu Rev Public Health. 2011;32:471–482. [DOI] [PubMed] [Google Scholar]
Associated Data
This section collects any data citations, data availability statements, or supplementary materials included in this article.