

Abstract
The weak association between disability levels and “peripheral” (i.e., knee) findings suggests that central nervous system alterations may contribute to the pathophysiology of knee osteoarthritis (KOA). Here, we evaluated brain metabolite alterations in KOA patients, before and after total knee arthroplasty (TKA), using 1H-magnetic resonance spectroscopy (MRS). Thirty-four pre-surgical KOA patients and 13 healthy controls were scanned using a PRESS sequence (TE=30ms, TR=1.7s, voxel size=15x15x15mm). Additionally, 13 patients were re-scanned 4.1±1.6 (mean±SD) weeks post-TKA. When using Creatine (Cr)-normalized levels, pre-surgical KOA patients demonstrated lower N-acetylaspartate (NAA) (p<0.001), and higher myoinositol (mIns) (p<0.001), and lower Choline (Cho) (p<0.05) compared to healthy controls. The mIns levels were positively correlated with pain severity scores (r=0.37, p<0.05). These effects reached statistical significance also using water-referenced concentrations, except for the Cho group differences (p≥0.067). Post-TKA, patients demonstrated an increase in NAA (p<0.01), which returned to the levels of healthy controls (p>0.05), irrespective of metric. Additionally, patients demonstrated post-surgical increases in Cr-normalized (p<0.001), but not water-referenced mIns, which were proportional to the NAA/Cr increases (r=0.61, p<0.05). Because mIns is commonly regarded as a glial marker, our results are suggestive of a possible dual role for neuroinflammation in KOA pain and post-TKA recovery. Moreover, the apparent post-surgical normalization of NAA a putative marker of neuronal integrity might implicate mitochondrial dysfunction, rather than neurodegenerative processes, as a plausible pathophysiological mechanism in KOA. More broadly, our results add to a growing body of literature suggesting that some pain-related brain alterations can be reversed after peripheral surgical treatment.
1. INTRODUCTION
As in other chronic pain conditions, knee osteoarthritis (KOA) studies have consistently found tenuous relationships between physical pathology (e.g., the Kellgren Lawrence grade) and subjective pain, which are at best modestly correlated [12,35]. Among individuals experiencing knee pain, only approximately 15% have radiographic changes compatible with stage 2-4 osteoarthritis [36]. Even when studies report a statistically significant association between radiographic findings and pain severity, they note only modest relationships, with broad individual differences in reported pain and function among individuals with any particular stage of KOA (e.g.,[27]). The tenuous relationship between peripheral pathology and pain/disability is further illustrated by the fact that approximately 20% of patients continue to experience significant pain and functional limitations months or years after a successful TKA, i.e., after the pathology in the joint has presumably been resolved [15,92]. Altogether, the weak association between disability levels and “peripheral” findings suggests that central nervous system (CNS) alterations may contribute to the pathophysiology of KOA pain. However, our knowledge of the CNS mechanisms underlying KOA pain remains limited.
Recently, several studies from our group and others have we demonstrated the presence of increased levels of the 18kDa translocator protein (TSPO) in the brains of patients with chronic low back pain [49], fibromyalgia [4] and migraine [6], as well as in the spinal cord and neuroforamina of patients with lumbar radiculopathy [3]. Because TSPO is a marker of glial activation [1,11,22,23,26,41,52,74,85,86] these studies are in line with those reporting elevated levels of brain metabolites linked to neuroinflammation using Magnetic Resonance Spectroscopy (MRS) [43,61,91] or elevated levels of pro-inflammatory cytokines in cerebrospinal fluid [10,44,46], and suggest that neuroinflammation might be a pervasive phenomenon that can be observed across multiple, etiologically heterogeneous human pain disorders. Because glial cells (microglia and astrocytes, mainly) play a key role in the establishment and maintenance of persistent pain [20,42,84,88], we hypothesized that neuroinflammation, and specifically in the thalamus, is implicated in KOA pain. We focused on the thalamus because this region was characterized by significant neuroinflammation in our first TSPO back pain study [49], an observation that was later replicated in an independent cohort [82]. In this study, we evaluated thalamic alterations in KOA patients, and their response to TKA, using MRS, a noninvasive method to assess the brain chemical and cellular processes through the quantification of several metabolites [66]. Because we were interested in evaluating neuroinflammation, we focused on myo-inositol (mIns), a metabolite which is thought to be a glial marker as it is more abundant in glial cells rather than other cell types [18,31,39]. Moreover, we have evaluated choline (Cho), a cell membrane metabolism and cellular turnover marker that is also often linked to neuroinflammatory processes [43,50]. Finally, because in (hip) osteoarthritis patients the thalamus demonstrated reduced grey matter volume, which was reversed after arthroplasty, alongside with a decrease in pain and increase in function [34], we also evaluated N-acetylaspartate (NAA), which is commonly interpreted as an in vivo marker for neuronal integrity [89].
2. MATERIALS & METHODS
2.1. Study design
The study was conducted at the Athinoula A. Martinos Center for Biomedical Imaging at Massachusetts General Hospital. The study was approved by the Partners institutional review board (IRB) and the radioactive drug research committee (RDRC) at Massachusetts General Hospital (MGH), Boston, MA. All participants provided written informed consent for study participation according to the Declaration of Helsinki.
2.2. Study Participants:
Thirty-four KOA patients scheduled to receive a TKA were recruited and enrolled in the study, after providing informed consent. All patients were scanned prior to the surgery. Additionally, a subset (n=13) were also scanned within six weeks post-TKA. All patients were recruited from outpatient clinics in the Boston area, via advertisements posted on various social media platforms, or through the Partners Clinical Trials website. See Table 1 for demographic characteristics. While we had initially planned to also enroll 25 healthy participants demographically well-matched to the patient cohort, data acquisition was prematurely interrupted in early March 2020 due to the COVID-19 pandemic. As a result, our healthy control cohort consisted of a smaller group (n=13) which, despite being matched in terms of sex, happened to be significantly younger. In order to address this limitation, all comparisons between patients and controls were performed both 1) including all available datasets (controlling for age statistically) and 2) by including only a subset of KOA patients (n=11) and controls (n=11) who were age- and sex- matched (See 3.1 Demographic and clinical variables and Table 1).
Table 1:
Subject characteristics
| Controls | KOA patients | ||
|---|---|---|---|
| pre-TKA | post-TKAϮ | ||
| All Subjects | |||
| N | 13 | 34 | 13 |
| Sex (male: female) | 7:6 | 16:18 | 7:6 |
| Age (years: mean±SD) | 49.4±17.0 | 66.1±8.2* | 67.1±7.9 |
| TKA site (Left:Right) | - | 16:18 (scheduled) | 6:7 (performed) |
| WOMAC Pain (0-20) | - | 9.4±3.9 | 8.5±3.5 |
| WOMAC Stiffness (0-8) | - | 3.8±1.7 | 3.9±1.5 |
| WOMAC Physical disability (0-68) | - | 25.0±12.4 | 23.2±10.3 |
| Scan, weeks from surgery | - | 1.8±1.5 | 4.1±1.6 |
| Matching sub-groups | |||
| N | 11 | 11 | |
| Sex (male: female) | 6:5 | 6:5 | |
| Age (years: mean±SD) | 53.4±15 | 59.2±9.2 | |
| Scheduled TKA (Left/Right) | 5/6 | ||
post-surgical assessment was on average 1 month after surgery.
KOA vs controls, p<0.0001
2.3. Inclusion criteria
Patients between the ages of 40 and 85 were deemed eligible if they had been diagnosed with KOA, were scheduled to undergo primary unilateral TKA, and had facility with the English language. In this study, we excluded patients or healthy volunteers with current infection or cognitive impairment, current or past histories of major neurological disorders, major cancers, significant head traumas, or severe psychiatric illness, as well as those who routinely used steroids or unstable doses of anti-inflammatory medications. Patients incompatible with the scanning procedures, such as those with contraindications to fMRI and PET scanning, were also excluded. Additionally, the presence of any pain, systemic inflammatory, or autoimmune disorders was an exclusion criterion for healthy controls. Because participants were simultaneously scanned with the PET radioligand [11C]PBR28, which binds to the 18kDa translocator protein (TSPO) [4,5,49], formerly known as the peripheral benzodiazepine receptor, we also excluded for the use of benzodiazepines whose affinity for TSPO was either known to be high, or unknown [59]. However, the PET results are beyond the scope of this investigation, which focuses solely on MRS, and will not be discussed further here.
2.4. Outcomes Assessment: Pain and Function.
On the day of the pre- and post-surgical scans, pain and physical function were assessed by multidimensional self-administered Western Ontario McMaster Osteoarthritis index (WOMAC) questionnaire [13], which assesses pain (score: 0–20), stiffness (0–8) and disability (0–68).
2.5. Brain imaging data acquisition and processing
Brain imaging was performed with a 3T Siemens Biograph mMR integrated PET/MRI scanner equipped with a 12-channel head coil. In all participants, a high-resolution multi-echo MPRAGE (T1-weighted structural MRI) volume was also acquired (TR/TE1/TE2/TE3/TE4 = 2530/1.69/3.55/5.41/7.27 ms, flip angle = 7°, voxel size = 1 mm isotropic), for the purpose of anatomical localization, MRS voxel placement and the correction for partial volume effects of cerebrospinal fluid (CSF). In a subset of participants (n=41) a second, lower-resolution multi-echo MPRAGE (TR/TE1/TE2/TE3/TE4 = 2530/1.34/3.04/4.74/6.44 ms, flip angle = 7°, voxel size = 2.1x2.1x1.5 mm) was acquired just before the MRS scan to account for any motion that may have occurred between high-resolution MPRAGE and MRS data acquisition, thus increasing precision in MRS voxel placement.
1H-MRS protocol: Single voxel MRS was acquired using a conventional PRESS sequence (TE=30ms, TR=1.7s, bandwidth=1.2 kHz, and 128 averages, 1024 sample points). A 15x15x15mm voxel was placed in the left thalamus, as this was the region showing the largest effect size in our previous PET study of neuroinflammation in cLBP [49]. Of note, we elected to collect spectra from the left thalamus in every subject, irrespective of which knee was scheduled to be replaced (and likely to be the most affected by KOA), because 1) only rarely symptomatic KOA is unilateral [17] and, even in those rare cases, both knees are usually affected (due to changes in load bearing, postural changes, etc., which can lead to greater wear-and-tear and eventually to osteoarthritis in the initially unaffected knee), 2) consistently imaging the same side allowed us to evaluate whether any neurometabolite changes potentially observed might be more pronounced in the thalamus contralateral to the knee to be replaced or the ipsilateral one; 3) in both our prior study of cLBP [49], and a subsequent replication study in an independent cohort [82], the left thalamus appeared to demonstrate a slightly stronger neuroinflammatory signal, with no clear link to pathology lateralization.
MRS data was analyzed using jMRUI v6.0 [80]. Spectra were phase-corrected. Hankel Lanczos Singular Values Decomposition (HLSVD) filter was applied to remove the residual water signal. Signal-to-noise ratios (SNR) were determined by jMRUI QUEST in time-domain (maximum of FID/standard deviation of FID tail) and full-width-half maximum (FWHW) of unsuppressed water signals were measured using jMRUI-AMARES algorithm. Metabolites were quantified with the QUEST algorithm (combined with ‘Subtract’ for background modelling) in jMRUI. QUEST metabolite basis set was quantum-mechanically simulated at 3T using a press protocol (TE=30ms, 1024 data points, SW=1200Hz) in NMR Scope-B. Spectral signals of 9 metabolites (total Cr, total NAA, mIns, total Cho, glutamate, glutamine, taurine, lactate, scyllo-inositol) were simulated and a 2 Hz hard apodization was applied.
Water-referenced metabolite concentrations were reported relative to the water-un suppressed spectra and concentrations were corrected for partial volume effects as follows. MRS voxel was first registered to the T1-anatomical space and segmented (gray matter, white matter and CSF) using Gannet toolkit v3.1 [37] and SPM12 [63]. The segmented tissue fractions were corrected for metabolite concentrations quantified using jMRUI-QUEST to account for CSF content according to the literature [30,56]. T1 and T2 values for grey matter, white matter, and CSF used in this study were 1331, 832, and 3817 ms and 110, 79, and 503 ms, respectively. Metabolite relaxation times used for calculating the final corrected metabolite concentrations were taken from previous studies [83,87]. In addition to the water-referenced concentrations, metabolite levels were also expressed relative to creatine.
The correct placement for each voxel was visually confirmed for each participant. Additionally, in order to further evaluate the consistency of thalamic coverage across participants, we created a probabilistic map of voxel placement in standard space (Figure 1). To this end, we used FSL FNIRT [40] to calculate a nonlinear transformation between each subject’s MPRAGE volume and the MNI152 template, and then applied the resulting transformation to the MRS voxel. In addition, MRS masks in MNI space were used to calculate the voxel centroid for each participant using Python scripts (https://github.com/nwd2918/MRS-voxel-plot).
Fig 1: Voxel placement and representative spectrum.

(A) Voxel overlap density map for all participants. Individual MRS voxels are converted to MNI space and then combined to show the overlap between participants. (B) Voxel centroids of all participants showing how tightly clustered MRS voxels are around a target anatomical location. (C) Representative MRS spectrum from left thalamus.
2.6. Statistical analyses
Statistical analysis was performed using STATISTICA v12.0. Neurometabolite levels and clinical variables (WOMAC pain, WOMAC stiffness, WOMAC physical function) were compared across groups. As previously mentioned, because age was significantly different across groups, these group comparisons were performed using a two-fold strategy. First, we compared all patients and controls adjusting for age using an analysis of covariance (ANCOVA). Next, in a sensitivity analysis, we compared age- and sex-matched subjects (see Table 1) using an unpaired t-test. In addition, because the MRS voxel was placed on the left thalamus irrespective of the knee that was scheduled to be replaced, and, in order to test for the presence of lateralized effects related to the TKA site, we used an unpaired t-test to compare the neurometabolite and clinical variables between patients scheduled to receive right TKA (i.e., contralateral to the imaged thalamus) vs those scheduled to receive left TKA.
In addition to the group comparisons, we performed paired t-test analyses to compare neurometabolite levels and clinical variables in all patients scanned before and after TKA (n=13). The effect size for the group comparisons and the pre- vs post-TKA comparisons were computed using Cohen’s d. Pearson's correlation coefficient (Pearson's r) was calculated to assess relationship between various study variables (neurometabolite concentrations, clinical and demographic parameters) adjusting for age. Note that the WOMAC scores were unavailable for one patient, and therefore the correlations with these clinical variables were performed with 33, instead of 34, patients. The association between changes in (unadjusted) pre- and post-TKA levels of mIns and NAA were also evaluated using Pearson's correlation coefficient.
Sex differences were compared using Chi-square test. Continuous data were expressed as the mean ± SD and categorical data were expressed as percentage. An alpha value = 0.05 was considered the threshold for statistical significance.
3. RESULTS
3.1. Demographics and clinical variables
The KOA patient cohort (n=34) and the smaller (n=13) healthy control cohort were matched in terms of sex (p=0.93) but, as previously mentioned, not with age (p<0.0001). In order to evaluate whether this age difference might have an impact on our group comparisons, subgroups of KOA patients (n=11) and controls (n=11) who were age- and sex- matched (p’s=0.31 and 1, respectively) were identified for follow-up analyses (See Table 1).
On average patients demonstrated moderate pain, stiffness and slight physical disability scores, as assessed using the WOMAC scale (Table 1). About 62% patients had bilateral OA diagnosis. 14 out of 34 had prior surgery for opposite knee. 3 out of 34 had scheduled TKA for the opposite knee.
At baseline, we observed a negative significant correlation between patient age and KOA severity of KOA assessed by WOMAC scores (pain, r=−0.42, p<0.05; stiffness, r=−0.42, p<0.05; physical disability, r=−0.47, p<0.01), indicating that patients scheduled to receive a TKA at a younger age were more likely to have more severe disease (Supplementary Figure S1).
Thirteen patients were followed up after TKA (4.1±1.6 weeks post-surgery). One of the 13 subjects who returned for the peri-surgical scan experienced complications in the hospital following their TKA surgery. This subject experienced vasovagal syncope with a brief loss of consciousness, elevated blood pressure and hypokalemia which resulted in a prolonged hospitalization after surgery. None of these 13 subjects experienced apparent infection or other complications in the time between their TKA and the peri-surgical scan. In their post-TKA assessment, neither of the WOMAC scores were significantly changed compared to pre-TKA levels (pain: p=0.91; physical disability: p=0.67; stiffness: p=0.58), indicating that patients continued experiencing pain and disability for several weeks after their TKA (in this case, likely due to the surgery itself).
3.2. MRS quality parameters
No significant differences in spectral quality or amount of CSF in the voxel were apparent between groups, or between pre- and post-TKA timepoints (p>0.5). The heat map in Figure 1A shows the percentage of overlap across all MRS voxel masks at each voxel in the MNI standard space. The overlap between the pre- and post-operative voxel placement for each subject was 86% ± 7% (SD). mIns, NAA, Cr and Cho were well within the standard Cramér-Rao lower bound (<20%) for controls, and at both time points (pre- and post-TKA) for the patients (Table 2). However, about 30% of the Glx (glu+gln) measurements had standard Cramér-Rao lower bound >20%. Therefore, all Glx data were excluded from the analyses, and will not be reported further in this manuscript. Cr levels were not statistically different across groups, both when including all subjects, correcting for age, or when including only subsets of matching participants (p≥0.46), as well as between pre- and post-TKA time points in patients (p=0.11), supporting the appropriateness of using Cr as a normalizing factor.
Table 2:
1H-MRS data quality characteristics.
| KOA Patients (N=34) | Controls (N=13) | p-value | |
|---|---|---|---|
| All subjects | |||
| SNR | 12.1±1.7 | 12.2±2.5 | 0.8675 |
| FWHMH2O(Hz) | 7.7±0.8 | 7.9±1.1 | 0.7592 |
| CRLB% [Cr] | 4.9±1.1 | 5.6±1.6 | 0.1677 |
| CRLB% [NAA] | 5.3±1.0 | 6.8±2.0 | 0.2415 |
| CRLB% [mIns] | 12.3±4.5 | 9.1±4.5 | 0.1951 |
| %CSF | 3.1±2.1 | 5.1±2.2 | 0.3231 |
| Matching subgroups | KOA Patients (N=11) | Controls (N=11) | |
| SNR | 11.8±1.3 | 12.0±1.1 | 0.8834 |
| FWHMH2O(Hz) | 7.8±0.3 | 7.7±1.2 | 0.9124 |
| CRLB% [Cr] | 5.1±1.4 | 5.5±1.3 | 0.8423 |
| CRLB% [NAA] | 5.6±1.6 | 6.4±1.2 | 0.7987 |
| CRLB% [mIns] | 11.2±1.7 | 9.3±2.2 | 0.3458 |
| %CSF | 4.4±1.0 | 4.1±2.5 | 0.7456 |
| Pre-post TKA group | Pre-TKA (N=13) | Post-TKA (N=13) | |
| SNR | 11.3±2.0 | 10.8±1.4 | 0.7845 |
| FWHMH2O(Hz) | 7.3±0.4 | 7.1±0.7 | 0.8412 |
| CRLB% [Cr] | 5.3±1.2 | 5.6±1.4 | 0.8654 |
| CRLB% [NAA] | 5.5±1.1 | 5.1±1.6 | 0.7232 |
| CRLB% [mIns] | 10.5±2.1 | 11.3±1.1 | 0.6545 |
| %CSF | 4.1±1.1 | 4.3±2.1 | 0.7544 |
SNR=signal-to-noise ratio; FWHM=full width half maximum; CRLB=Cramer-Rao Lower Bound
3.3. KOA-related alterations in neurometabolite levels
First, neurometabolite levels from the left thalamus of all KOA patients (n=34) and all healthy controls (n=13) were compared, adjusting for age (Figure 2). This comparison showed elevated mIns (Cr ratio: p<0.001, Cohen’s d=1.36; water-referenced: p<0.0001, Cohen’s d=2.29) and lower NAA (Cr ratio: p<0.001, Cohen’s d=1.34; water-referenced: p<0.01, Cohen’s d=0.86) in KOA patients compared to healthy controls. In addition, lower Cho/Cr (p<0.05, Cohen’s d=0.95) was observed in KOA patients, however this was not confirmed with water-referenced Cho (p=0.11) (Supplementary Table S1). Comparable group differences were observed in the analyses including only a subset of demographically well-matched KOA patients (n=11) and controls (n=11). These analyses confirmed higher mIns levels (Cr ratio: p<0.001, Cohen’s d=1.50; water-referenced: p<0.0001, Cohen’s d = 2.73), lower NAA (Cr ratio: p<0.01, Cohen’s d=0.59; water-referenced: p=0.07, Cohen’s d=0.86) and, when using Cr-normalized (p<0.05, Cohen’s d=1.21) but not water-referenced concentrations (p=0.07), also lower Cho levels, in patients compared to controls (Supplementary Figure S2; Supplementary Table S2).
Fig 2: Neurometabolic levels in the left thalamus of KOA and healthy controls.
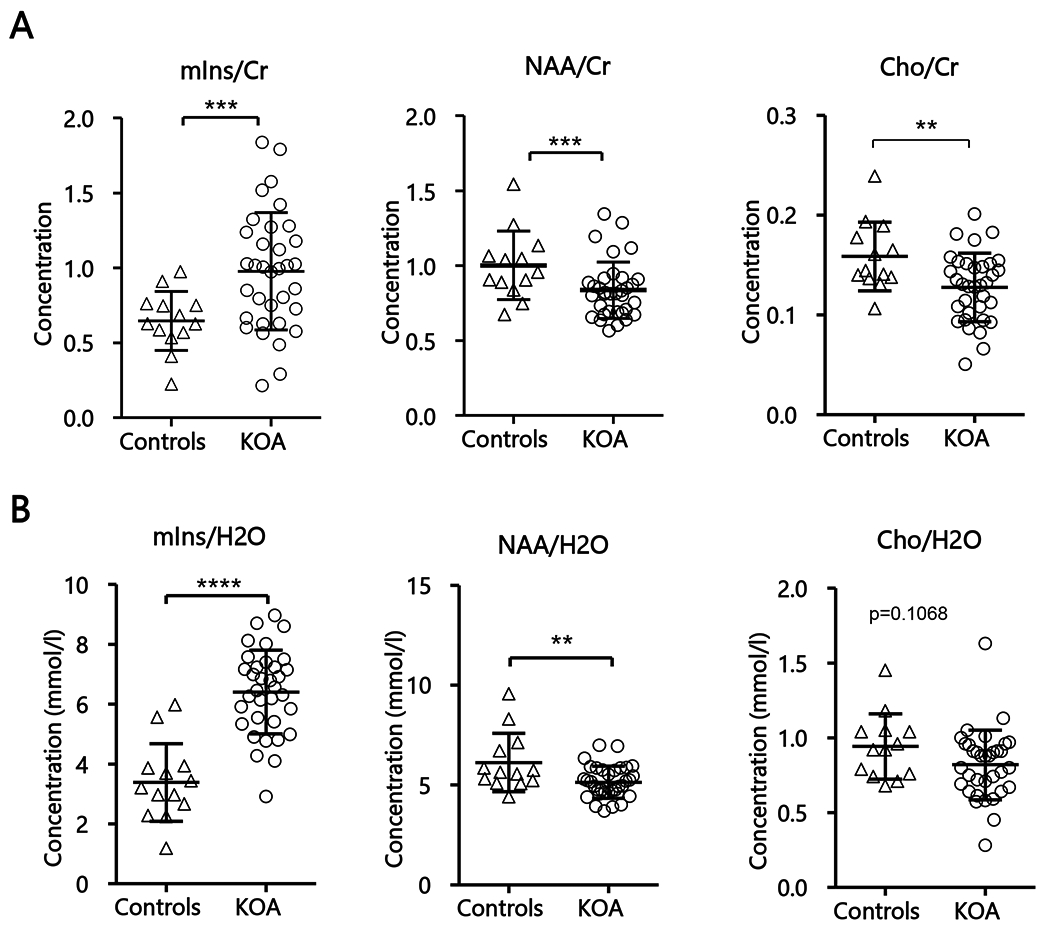
(A) Mean neurometabolic ratios of all KOA (n=34) and healthy controls (n=13), corrected for age. (B) Mean water-referenced neurometabolic concentrations of all KOA (n=34) and healthy controls (n=13). Statistical significances between the two groups and mean concentrations within each group are shown. Concentration values are given as mean ± SD; ***p<0.001, ****p<0.0001. Abbreviation: NAA, N-acetylaspartate; mIns, myo-inositol; cr, creatine;
In order to investigate whether the neurometabolite changes observed in KOA patients might be more pronounced contralaterally to the knee to be replaced (typically the most affected knee), we compared thalamic metabolite levels between patients who were scheduled to undergo left TKA (n=16) vs those scheduled to undergo a right TKA (n=18). No significant differences were found between the groups for either creatine ratios (mIns/Cr, p=0.62; NAA/Cr, p=0.24; Cho/Cr, p=0.35) or water-referenced values (mIns, p=0.52, NAA, p=0.76; Cho, p=0.37).
Across patients (n=33), pre-TKA age-adjusted mIns/Cr showed significant positive correlation with the WOMAC pain scores (r=0.37, p<0.05; Figure 3A). The correlations with stiffness and physical disability were also positive, but did not reach statistical significance (r’s ≤ 0.3; p’s ≥0.1). When using water-referenced concentrations, mIns revealed significant positive correlations with all WOMAC scores (pain, r=0.52, p<0.01; stiffness, r=0.39, p<0.05; physical disability, r=0.48, p<0.01) scores (Figure 3B-D). No other correlations between metabolites (NAA or Cho, whether water-referenced or creatine-referenced) and WOMAC scores (pain, stiffness or disability) were statistically significant (r≤0.3; p≥0.09). When evaluating the relationship across pre-surgical metabolite levels in patients, the only statistically significant association detected was a negative correlation between water-referenced mIns and Cho (r=−0.46, p<0.01). In order to further evaluate whether age had a meaningful impact on our results we have also correlated metabolite levels and age. No significant correlations were observed between the levels of any metabolite (whether water-referenced or creatine-referenced) and age, for either patients or controls (p’s between 0.08-0.95).
Fig 3: Correlations of neurometabolites and WOMAC pain scores.
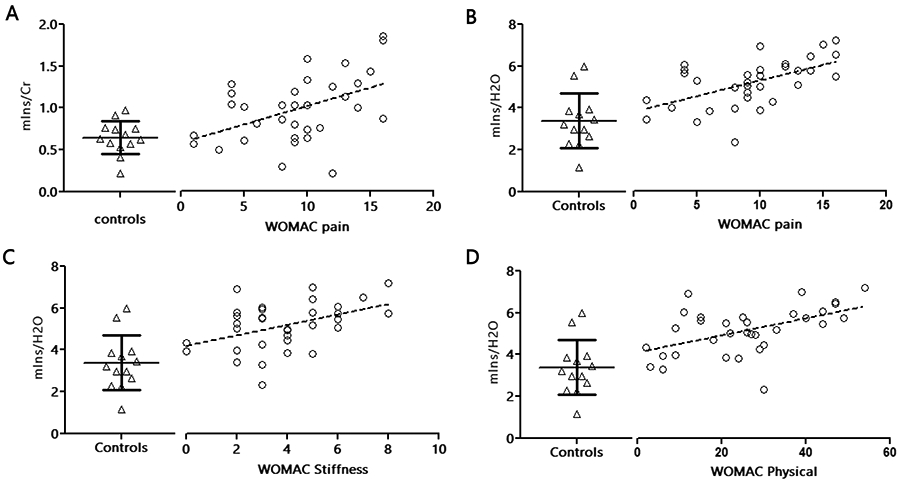
Correlation between neurometabolite concentrations and the KOA disease severity measured with the WOMAC scale, in KOA patients (n=33). (A) Correlation of thalamic mIns/Cr and WOMAC pain scale after adjusting for age (r=0.37, p=0.038). Water-referenced concentrations of thalamic mIns with (B) pain (r=0.52, p=0.002), (C) stiffness (r=0.39, p=0.026) and (D) physical (r=0.48, p=0.005) after adjusting for age. The resulting slope in linear fit is represented by the dashed-black line. See Figure 1 caption for abbreviations.
3.6. Postsurgical alterations in neurometabolite levels
Our within-subject assessment of TKA-related changes in neurometabolite levels (n=13) revealed significant increases in NAA, both when using Cr-normalized (p=0.01, Cohen’s d=1.53) and water-referenced NAA (p<0.01, Cohen’s d=1.44), in post-TKA scans compared to pre-TKA scans (Figure 4A-B). The post-surgical NAA levels (whether water-referenced, or Cr-normalized), unlike those measured pre-surgically, were not statistically different from those in healthy controls (whether compared to all controls, correcting for age, or to the subset of age-matching controls). Additionally, patients demonstrated a statistically significant post-TKA increase in mIns/Cr (p<0.05, Cohen’s d=0.82), although this was not confirmed with the water-referenced mIns levels (p=0.20), Interestingly, the amount of change between pre and post TKA timepoints for mIns/Cr and NAA/Cr ratio was positively correlated and significant (r=0.61, p<0.05) (Supplementary Figure S3). However, this was not confirmed by the pre- post-changes of the water-referenced concentrations (p=0.90). Finally, the assessment of the association of pre-post changes in WOMAC scores with changes in pre-post water-referenced metabolite levels or ratios revealed no significant correlations (p≥0.17).
Fig 4: Pre vs post-surgical thalamic neurometabolic levels of KOA patients.
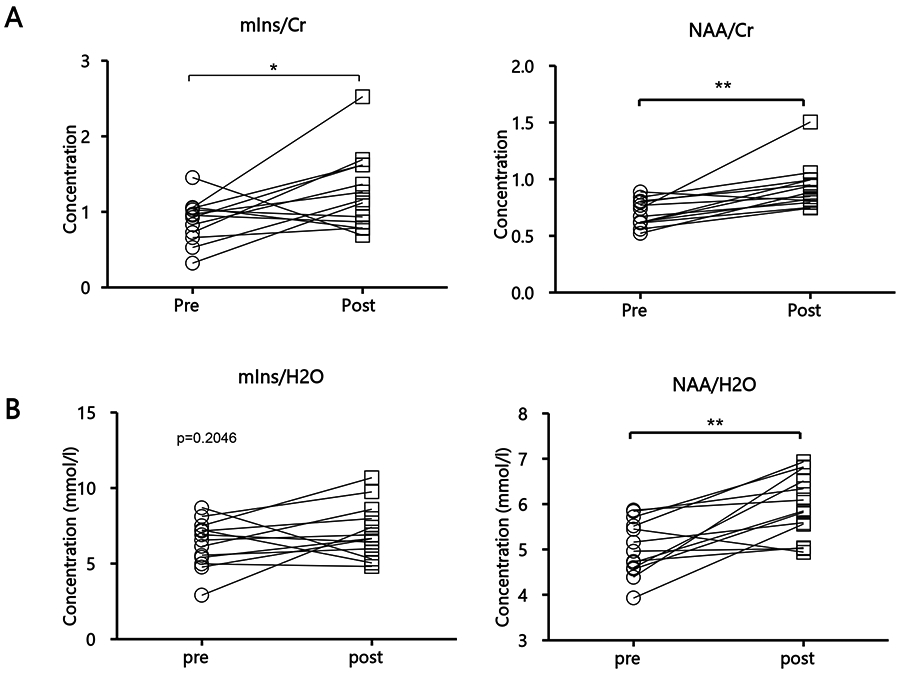
Pre and post TKA (A) ratios of mIns/Cr (p=0.0297) and NAA/Cr (p=0.01) of KOA patients (n=13) and (B) water-referenced mIns (p=0.2046) and NAA (p=0.0018). Statistical significances between the two groups and mean concentrations within each group are shown. Concentration values are given as mean ± SD; *p< 0.05, **p<0.01. Slope in linear fit is represented by the solid black line. TKA, total knee arthroplasty; see Figure 1 caption for other abbreviations.
4. DISCUSSION
In this study, we non-invasively assessed thalamic neurometabolic alterations in KOA patients, and their response to TKA, using 1H-magnetic resonance spectroscopy. In pre-surgical KOA patients, we found the levels of mIns, a putative marker of neuroinflammation, to be significantly increased, while the levels of NAA, a neurometabolite traditionally interpreted as a marker of neuronal integrity, were reduced compared to healthy controls. Furthermore, age-adjusted pre-surgical mIns levels showed positive correlations with WOMAC pain scores (using both water-referenced and Cr-referenced concentrations), and stiffness and disability (using water-referenced concentrations only).
Because myo-inositol is found primarily in glial cells [21], the heightened levels of this neurometabolite in patients might reflect neuroinflammation / glial activation. In fact, our group has previously showed that mIns/Cr levels were abnormally elevated in the motor cortex of patients with amyotrophic lateral sclerosis (a condition known to be characterized by glial activation). Further, the mIns/Cr levels were positively correlated with the levels of the 18 kDa translocator protein (TSPO) [68], another putative imaging marker of glial activation [19,47,48,76]. Using [11C]PBR28 PET imaging, our group showed elevations in TSPO levels, in the brains of patients with chronic lower back patients (cLBP) [49] fibromyalgia [4], migraine [6] veterans suffering from Gulf War Illness [7], as well as in the spinal cord of patients with lumbar radiculopathy [3]. Collectively, these TSPO studies suggest that neuroinflammation may be a general feature of chronic pain, potentially observable across etiologically heterogeneous pain disorders, thus lending support to the interpretation that the mIns elevations observed in KOA patients may indeed reflect glial activation. After TKA, the patients’ levels of mIns/Cr were found to be elevated further, suggesting a possible inflammatory response to surgery. Interestingly, post-surgical increases in patients’ mIns/Cr were accompanied by a proportional increase in NAA/Cr levels (which, pre-surgically were lower than in the controls). This observation raises the intriguing possibility that surgery-induced neuroinflammation might have a beneficial role in promoting the restoration of neuronal metabolism and/or viability, possibly supporting a dual role of neuroinflammation: adaptive in the acute/subacute context, such as in response to surgery, but pathogenic and maladaptive when dysregulated or in the chronic context [62]. However, when water-referenced concentrations were used, the post-surgical increases in patients’ mIns levels were neither statistically significant, nor significantly correlated with changes in NAA levels. As such, the significance and reliability of surgery-related changes in mIns remains to be further evaluated. Since NAA is usually considered a neuronal marker, the observed lower pre-surgical levels of this metabolite in patients would in principle be compatible with a potential reduction in neuronal integrity or viability, perhaps resulting from mechanisms analogous to the pain-induced apoptosis that has been reported in spinal cord neurons in animal models of neuropathic pain [55,58,90]. These neurodegenerative processes might be caused by toxic inflammatory mediators released by activated glia [24,67] or, alternatively, might represent the trigger for a neuroinflammatory response (e.g., due to the accumulation of cellular debris) [32,45,53,64]. After the surgery, on the other hand, NAA levels returned to levels comparable to those observed in healthy, pain-free controls, an observation that arguably would render less likely the possibility that pre-surgical reductions in NAA might be due to irreversible neurodegenerative processes. For instance, because some studies showed that NAA is produced in neuronal and oligodendrocytic mitochondria [9,51,57], the decrease in NAA observed before surgery, and its subsequent reversal after surgery, may be reflective of changes in mitochondrial function [25], perhaps caused by reactive oxygen species (ROS) and nitrogen species (RNS) produced by activation of glial cells [24,54,71,75]. Indeed, mitotoxicity has been described in animal pain models [14].
Mitochondrial dysfunction may also explain the observed lower Cho/Cr in KOA patients (an observation which, however, was not replicated when using water-referenced Cho concentration). Cho is a cell membrane metabolism and cellular turnover marker that is also often linked to neuroinflammatory processes [50]. The MRS detected choline signal is shown to originate from the water-soluble choline pool, which is one of the precursors of myelin phospholipids synthesis [2]. Because the regulatory processes of membrane homeostasis are sensitive to impairments in energy production [81], Cho reductions may be affected by deficits in mitochondrial function. In fact, studies have documented significant reductions in both Cho/Cr (as well as NAA/Cr) in patients with mitochondrial diseases [16]. We therefore believe that the Cho/Cr reduction, particularly when viewed in light of the NAA results, might implicate mitochondrial dysfunction, rather than changes in neuroinflammatory processes. However, biological interpretation of MRS detected changes in metabolites will need to be aided by additional work, since they are involved in multiple cellular functions.
Our observation of increased NAA levels after surgery is in line with results from previous studies suggesting that a variety of pain-related brain anatomical and functional alterations may be reversed by successful treatment. For instance, in patients with hip osteoarthritis, total joint replacement led to the reversal of at least some of the cortical and subcortical morphological measures found to be altered prior to treatment, to levels measured in healthy controls [34,72,73]. Similarly, in chronic low back patients, successful surgical treatment was found to reverse both anatomical and functional alterations in dorsolateral prefrontal cortex [77]. Altogether, a growing number of studies suggests that at least some of the micro- or macrostructural alterations that have been reported in chronic pain might not reflect irreversible neurodegeneration.
In this study both water-referenced concentration and relative metabolite levels are reported as complementary results. While these two quantification methods yielded similar results for the most part (i.e., lower NAA and higher mIns in pre-surgical KOA patients, correlations between mIns and clinical pain, post-surgical NAA increase in patients, back to the levels of the healthy controls), some differences were noted (e.g., post-surgical elevation in mIns and Cho results). Since both creatine- and water-referenced concentrations are, in fact, ratios (the latter being computed using the unsuppressed water signal as a normalizing factor), random physiological variations inherent in either Cr or water signal may contribute to explaining discrepancies across methods.
To the best of our knowledge, this is the first MRS study to investigate the thalamic metabolic profile in knee osteoarthritic patients. In future studies, it would be interesting to assess whether similar neurometabolic alterations can be observed in other brain regions in the same patient population. Potential targets could be the anterior middle cingulate cortex (where others have reported increases in mIns/Glx ratio [28], and an association between γ-aminobutyric acid (GABA) levels and ongoing clinical pain intensity, in KOA patients [70]), prefrontal-limbic regions (which were found to be engaged during the processing of ongoing osteoarthritis pain [60]), as well as the insula (a region demonstrating multiple neurometabolic alterations in various chronic pain disorders; eg., fibromyalgia [38]).
Similar to our findings, previous studies have also demonstrated elevations in thalamic mIns, and reductions in NAA concentrations in other chronic pain conditions [8,29,33,61,78,79]. Thus, alterations in NAA and mIns might be a pervasive phenomenon observed across chronic pain patients of different etiologies.
There are several limitations in our study. First, the healthy control cohort, despite being matched in terms of sex, happened to be significantly younger due to a disruption in the data collection due to the COVID-19 pandemic. However, our group differences in NAA and mIns were statistically significant both when including all available datasets (controlling for age statistically), as well as when including only a subset of well age-matched KOA patients and healthy controls. Additionally, age was not statistically associated with neurometabolic levels in either group (irrespective of the quantification method). Thus, we do not believe that the age imbalance in the full cohorts represents a factor significantly confounding the interpretability of our results. Secondly, the post-surgical cohort consisted of a relatively small sample of patients and the lack of longitudinal data in healthy controls limits our ability to interpret the significance of the post-surgical changes observed in the patients. It is also important to stress that, as mentioned before, the specific cellular source of each the MRS-visible metabolites cannot be determined with certainty. For instance, while mIns is commonly referred to as a “glial marker”, it’s worth noting that this metabolite is involved in a variety of cell functions, including cell signaling and water regulation [65]. As such, whether mIns elevations reflect neuroinflammatory processes remains to be further evaluated (e.g., using other purported markers of glial activation, or in post-mortem evaluations). Finally, during the post-surgical scan most patients were still taking over-the counter analgesics / non-steroidal anti-inflammatory drugs and/or opioids, for the management of their surgical pain. Because the patients were for the most part not taking the same medications during their pre-surgical scan, whether medications had an impact on the thalamic neurometabolic changes observed post-surgically remains to be evaluated.
In conclusion, our results support a role for glial activation in KOA pain, and possibly post-surgical pain. These observations are in line with a growing body of literature implicating neuroinflammation in pain states and provide the rationale for exploring neuroimmune activation as a potential therapeutic target for pain. Further, by showing that KOA-related reduction in NAA can be normalized after surgery, our results add to a growing literature suggesting that some of the pain-related brain alterations can be reversed after treatment. Finally, when taken together, our results are suggestive of a possible role for brain mitochondrial dysfunction in KOA., although additional work is needed to further evaluate this interpretation.
Supplementary Material
Supplementary Figure S1: Correlations of age and WOMAC scores
Correlation between age and (A) pain (r=−0.42, p=0.015) (B) stiffness (r=−0.42, p=0.015) and (C) physical disability (r=−0.47, p=0.005), as measured with WOMAC score, in KOA patients (n=33). The resulting slope in linear fit is represented by the dashed-black line.
Supplementary Figure S2: Neurometabolic levels in the left thalamus of KOA and healthy controls
(A) Neurometabolic ratios and (B) Water-referenced concentrations of age-gender matched (n=11) KOA and healthy controls. Statistical significances between the two groups and mean concentrations within each group are shown. Concentration values are given as mean ± SD; ***p<0.001, ****p<0.0001. Abbreviation: NAA, N-acetylaspartate; mIns, myo-inositol; cr, creatine;
Supplementary Figure S3:
Correlation between pre and post changes in mIns and NAA (r=0.61, p=0.026).
ACKNOWLEDGEMENTS
The study was supported by the following funding source: 1R01NS094306-01A1 (to M.L.L.). The authors thank Grae Arabasz, Regan Butterfield, Shirley Hsu and the Radiopharmacy of the A. Martinos Center for assistance with experimental procedures. We would like to thank Dr. Christopher Melnic and Emily Schwartz for help with patient recruitment. We also thank Drs. Richard Harris, Roland Kreis and Jamie Near for their helpful comments. All authors declare no conflicts of interest.
REFERENCES
- [1].Abourbeh G, Thézé B, Maroy R, Dubois A, Brulon V, Fontyn Y, Dollé F, Tavitian B, Boisgard R. Imaging microglial/macrophage activation in spinal cords of experimental autoimmune encephalomyelitis rats by positron emission tomography using the mitochondrial 18 kDa translocator protein radioligand [18F]DPA-714. J Neurosci 2012. [DOI] [PMC free article] [PubMed] [Google Scholar]
- [2].Agris PF, Campbell ID. Proton nuclear magnetic resonance of intact friend leukemia cells: Phosphorylcholine increase during differentiation. Science (80− ) 1982. [DOI] [PubMed] [Google Scholar]
- [3].Albrecht DS, Ahmed SU, Kettner NW, Borra RJH, Cohen-Adad J, Deng H, Houle TT, Opalacz A, Roth SA, Melo MFV, Chen L, Mao J, Hooker JM, Loggia ML, Zhang Y. Neuroinflammation of the spinal cord and nerve roots in chronic radicular pain patients. Pain 2018. [DOI] [PMC free article] [PubMed] [Google Scholar]
- [4].Albrecht DS, Forsberg A, Sandström A, Bergan C, Kadetoff D, Protsenko E, Lampa J, Lee YC, Höglund CO, Catana C, Cervenka S, Akeju O, Lekander M, Cohen G, Halldin C, Taylor N, Kim M, Hooker JM, Edwards RR, Napadow V, Kosek E, Loggia ML. Brain glial activation in fibromyalgia – A multi-site positron emission tomography investigation. Brain Behav Immun 2019. [DOI] [PMC free article] [PubMed] [Google Scholar]
- [5].Albrecht DS, Kim M, Akeju O, Torrado-Carvajal A, Edwards RR, Zhang Y, Bergan C, Protsenko E, Kucyi A, Wasan AD, Hooker JM, Napadow V, Loggia ML. The neuroinflammatory component of negative affect in patients with chronic pain. Mol Psychiatry 2019. [DOI] [PMC free article] [PubMed] [Google Scholar]
- [6].Albrecht DS, Mainero C, Ichijo E, Ward N, Granziera C, Zürcher NR, Akeju O, Bonnier G, Price J, Hooker JM, Napadow V, Loggia ML, Hadjikhani N. Imaging of neuroinflammation in migraine with aura: A [11C]PBR28 PET/MRI study. Neurology 2019. [DOI] [PMC free article] [PubMed] [Google Scholar]
- [7].Alshelh Z, Albrecht DS, Bergan C, Akeju O, Clauw DJ, Conboy L, Edwards RR, Kim M, Lee YC, Protsenko E, Napadow V, Sullivan K, Loggia ML. In-vivo imaging of neuroinflammation in veterans with Gulf War illness. Brain Behav Immun 2020. [DOI] [PMC free article] [PubMed] [Google Scholar]
- [8].Apkarian AV, Bushnell MC, Treede RD, Zubieta JK. Human brain mechanisms of pain perception and regulation in health and disease. Eur J Pain 2005. [DOI] [PubMed] [Google Scholar]
- [9].Arun P, Madhavarao CN, Moffett JR, Namboodiri MAA. Regulation of N-acetylaspartate and N-acetylaspartylglutamate biosynthesis by protein kinase activators. J Neurochem 2006. [DOI] [PubMed] [Google Scholar]
- [10].Bäckryd E, Tanum L, Lind AL, Larsson A, Gordh T. Evidence of both systemic inflammation and neuroinflammation in fibromyalgia patients, as assessed by a multiplex protein panel applied to the cerebrospinal fluid and to plasma. J Pain Res 2017. [DOI] [PMC free article] [PubMed] [Google Scholar]
- [11].Banati RB, Newcombe J, Gunn RN, Cagnin A, Turkheimer F, Heppner F, Price G, Wegner F, Giovannoni G, Miller DH, Perkin GD, Smith T, Hewson AK, Bydder G, Kreutzberg GW, Jones T, Cuzner ML, Myers R. The peripheral benzodiazepine binding site in the brain in multiple sclerosis. Quantitative in vivo imaging of microglia as a measure of disease activity. Brain 2000. [DOI] [PubMed] [Google Scholar]
- [12].Bedson J, Croft PR. The discordance between clinical and radiographic knee osteoarthritis: A systematic search and summary of the literature. BMC Musculoskelet Disord 2008. [DOI] [PMC free article] [PubMed] [Google Scholar]
- [13].Bellamy N, Buchanan WW, Goldsmith CH, Campbell J, Stitt LW. Validation study of WOMAC: A health status instrument for measuring clinically important patient relevant outcomes to antirheumatic drug therapy in patients with osteoarthritis of the hip or knee. J Rheumatol 1988. [PubMed] [Google Scholar]
- [14].Bennett GJ, Doyle T, Salvemini D. Mitotoxicity in distal symmetrical sensory peripheral neuropathies. Nat Rev Neurol 2014. [DOI] [PMC free article] [PubMed] [Google Scholar]
- [15].Beswick AD, Wylde V, Gooberman-Hill R, Blom A, Dieppe P. What proportion of patients report long-term pain after total hip or knee replacement for osteoarthritis? A systematic review of Prospective studies in unselected patients. BMJ Open 2012. [DOI] [PMC free article] [PubMed] [Google Scholar]
- [16].Bianchi MC, Tosetti M, Battini R, Manca ML, Mancuso M, Cioni G, Canapicchi R, Siciliano G. Proton MR Spectroscopy of Mitochondrial Diseases: Analysis of Brain Metabolic Abnormalities and Their Possible Diagnostic Relevance. Am J Neuroradiol 2003. [PMC free article] [PubMed] [Google Scholar]
- [17].Bihlet AR, Byrjalsen I, Bay-Jensen AC, Andersen JR, Christiansen C, Riis BJ, Karsdal MA. Associations between biomarkers of bone and cartilage turnover, gender, pain categories and radiographic severity in knee osteoarthritis. Arthritis Res Ther 2019. [DOI] [PMC free article] [PubMed] [Google Scholar]
- [18].Brand A, Richter-Landsberg C, Leibfritz D. Multinuclear NMR studies on the energy metabolism of glial and neuronal cells. Developmental Neuroscience.1993. [DOI] [PubMed] [Google Scholar]
- [19].Cagnin A, Kassiou M, Meikle SR, Banati RB. Positron Emission Tomography Imaging of Neuroinflammation. Neurotherapeutics 2007. [DOI] [PMC free article] [PubMed] [Google Scholar]
- [20].Calvo M, Dawes JM, Bennett DLH. The role of the immune system in the generation of neuropathic pain. Lancet Neurol 2012. [DOI] [PubMed] [Google Scholar]
- [21].Chang L, Munsaka SM, Kraft-Terry S, Ernst T. Magnetic resonance spectroscopy to assess neuroinflammation and neuropathic pain. J Neuroimmune Pharmacol 2013. [DOI] [PMC free article] [PubMed] [Google Scholar]
- [22].Chen MK, Baidoo K, Verina T, Guilarte TR. Peripheral benzodiazepine receptor imaging in CNS demyelination: Functional implications of anatomical and cellular localization. Brain 2004. [DOI] [PubMed] [Google Scholar]
- [23].Chen MK, Guilarte TR. Imaging the peripheral benzodiazepine receptor response in central nervous system demyelination and remyelination. Toxicol Sci 2006. [DOI] [PubMed] [Google Scholar]
- [24].Chen WW, Zhang X, Huang WJ. Role of neuroinflammation in neurodegenerative diseases (Review). Mol Med Rep 2016. [DOI] [PMC free article] [PubMed] [Google Scholar]
- [25].Clark JB. N-Acetyl Aspartate: A Marker for Neuronal Loss or Mitochondrial Dysfunction. Dev Neurosci 1998. [DOI] [PubMed] [Google Scholar]
- [26].Cosenza-Nashat M, Zhao ML, Suh HS, Morgan J, Natividad R, Morgello S, Lee SC. Expression of the translocator protein of 18 kDa by microglia, macrophages and astrocytes based on immunohistochemical localization in abnormal human brain. Neuropathol Appl Neurobiol 2009. [DOI] [PMC free article] [PubMed] [Google Scholar]
- [27].Duncan R, Peat G, Thomas E, Hay E, McCall I, Croft P. Symptoms and radiographic osteoarthritis: Not as discordant as they are made out to be? Ann Rheum Dis 2007. [DOI] [PMC free article] [PubMed] [Google Scholar]
- [28].El-Najjar AR, Abdelwhab SM, elsammak ahmad A. Potential role of brain biomarkers in primary knee osteoarthritis patients using magnetic resonance spectroscopy. Egypt Rheumatol 2020. [Google Scholar]
- [29].Fukui S, Matsuno M, Inubushi T, Nosaka S. N-Acetylaspartate concentrations in the thalami of neuropathic pain patients and healthy comparison subjects measured with 1H-MRS. Magn Reson Imaging 2006. [DOI] [PubMed] [Google Scholar]
- [30].Gasparovic C, Song T, Devier D, Bockholt HJ, Caprihan A, Mullins PG, Posse S, Jung RE, Morrison LA. Use of tissue water as a concentration reference for proton spectroscopic imaging. Magn Reson Med 2006. [DOI] [PubMed] [Google Scholar]
- [31].Glanville NT, Byers DM, Cook HW, Spence MW, Palmer FBSC. Differences in the metabolism of inositol and phosphoinositides by cultured cells of neuronal and glial origin. Biochim Biophys Acta (BBA)/Lipids Lipid Metab 1989. [DOI] [PubMed] [Google Scholar]
- [32].Glass CK, Saijo K, Winner B, Marchetto MC, Gage FH. Mechanisms Underlying Inflammation in Neurodegeneration. Cell 2010. [DOI] [PMC free article] [PubMed] [Google Scholar]
- [33].Grachev ID, Fredrickson BE, Apkarian AV. Abnormal brain chemistry in chronic back pain: An in vivo proton magnetic resonance spectroscopy study. Pain 2000. [DOI] [PubMed] [Google Scholar]
- [34].Gwilym SE, Filippini N, Douaud G, Carr AJ, Tracey I. Thalamic atrophy associated with painful osteoarthritis of the hip is reversible after arthroplasty: A longitudinal voxel-based morphometric study. Arthritis Rheum 2010. [DOI] [PubMed] [Google Scholar]
- [35].Gwilym SE, Pollard TCB, Carr AJ. Understanding pain in osteoarthritis. J Bone Jt Surg - Ser B 2008. [DOI] [PubMed] [Google Scholar]
- [36].Hannan MT, Felson DT, Pincus T. Analysis of the discordance between radiographic changes and knee pain in osteoarthritis of the knee. J Rheumatol 2000. [PubMed] [Google Scholar]
- [37].Harris AD, Puts NAJ, Edden RAE. Tissue correction for GABA-edited MRS: Considerations of voxel composition, tissue segmentation, and tissue relaxations. J Magn Reson Imaging 2015. [DOI] [PMC free article] [PubMed] [Google Scholar]
- [38].Harris RE, Sundgren PC, Craig AD, Kirshenbaum E, Sen A, Napadow V, Clauw DJ. Elevated insular glutamate in fibromyalgia is associated with experimental pain. Arthritis Rheum 2009. [DOI] [PMC free article] [PubMed] [Google Scholar]
- [39].Hattingen E, Raab P, Franz K, Zanella FE, Lanfermann H, Pilatus U. Myo-inositol: A marker of reactive astrogliosis in glial tumors? NMR Biomed 2008. [DOI] [PubMed] [Google Scholar]
- [40].Jenkinson M, Beckmann CF, Behrens TEJ, Woolrich MW, Smith SM. FSL - Review. Neuroimage 2012. [DOI] [PubMed] [Google Scholar]
- [41].Ji B, Maeda J, Sawada M, Ono M, Okauchi T, Inaji M, Zhang MR, Suzuki K, Ando K, Staufenbiel M, Trojanowski JQ, Lee VMY, Higuchi M, Suhara T. Imaging of peripheral benzodiazepine receptor expression as biomarkers of detrimental versus beneficial glial responses in mouse models of Alzheimer’s and other CNS pathologies. J Neurosci 2008. [DOI] [PMC free article] [PubMed] [Google Scholar]
- [42].Ji RR, Berta T, Nedergaard M. Glia and pain: Is chronic pain a gliopathy? Pain.2013. [DOI] [PMC free article] [PubMed] [Google Scholar]
- [43].Jung C, Ichesco E, Ratai EM, Gonzalez RG, Burdo T, Loggia ML, Harris RE, Napadow V. Magnetic resonance imaging of neuroinflammation in chronic pain: a role for astrogliosis? Pain 2020. [DOI] [PMC free article] [PubMed] [Google Scholar]
- [44].Kadetoff D, Lampa J, Westman M, Andersson M, Kosek E. Evidence of central inflammation in fibromyalgia - Increased cerebrospinal fluid interleukin-8 levels. J Neuroimmunol 2012. [DOI] [PubMed] [Google Scholar]
- [45].Komine O, Yamanaka K. Neuroinflammation in motor neuron disease. Nagoya J Med Sci 2015. [PMC free article] [PubMed] [Google Scholar]
- [46].Kosek E, Altawil R, Kadetoff D, Finn A, Westman M, Le Maître E, Andersson M, Jensen-Urstad M, Lampa J. Evidence of different mediators of central inflammation in dysfunctional and inflammatory pain - Interleukin-8 in fibromyalgia and interleukin-1 β in rheumatoid arthritis. J Neuroimmunol 2015. [DOI] [PMC free article] [PubMed] [Google Scholar]
- [47].Lacor P, Benavides J, Ferzaz B. Enhanced expression of the peripheral benzodiazepine receptor (PBR) and its endogenous ligand octadecaneuropeptide (ODN) in the regenerating adult rat sciatic nerve. Neurosci Lett 1996. [DOI] [PubMed] [Google Scholar]
- [48].Lavisse S, Guillermier M, Hérard AS, Petit F, Delahaye M, Van Camp NV, Ben Haim L, Lebon V, Remy P, Dollé F, Delzescaux T, Bonvento G, Hantraye P, Escartin C. Reactive astrocytes overexpress TSPO and are detected by TSPO positron emission tomography imaging. J Neurosci 2012. [DOI] [PMC free article] [PubMed] [Google Scholar]
- [49].Loggia ML, Chonde DB, Akeju O, Arabasz G, Catana C, Edwards RR, Hill E, Hsu S, Izquierdo-Garcia D, Ji RR, Riley M, Wasan AD, Zurcher NR, Albrecht DS, Vangel MG, Rosen BR, Napadow V, Hooker JM. Evidence for brain glial activation in chronic pain patients. Brain 2015. [DOI] [PMC free article] [PubMed] [Google Scholar]
- [50].Mader I, Rauer S, Gall P, Klose U. 1H MR spectroscopy of inflammation, infection and ischemia of the brain. Eur J Radiol 2008. [DOI] [PubMed] [Google Scholar]
- [51].Madhavarao CN, Chinopoulos C, Chandrasekaran K, Namboodiri MAA. Characterization of the N-acetylaspartate biosynthetic enzyme from rat brain. J Neurochem 2003. [DOI] [PubMed] [Google Scholar]
- [52].Martín A, Boisgard R, Thézé B, Van Camp N, Kuhnast B, Damont A, Kassiou M, Dollé F, Tavitian B. Evaluation of the PBR/TSPO radioligand 18 FDPA-714 in a rat model of focal cerebral ischemia. J Cereb Blood Flow Metab 2010. [DOI] [PMC free article] [PubMed] [Google Scholar]
- [53].McCauley ME, Baloh RH. Inflammation in ALS/FTD pathogenesis. Acta Neuropathol 2019. [DOI] [PMC free article] [PubMed] [Google Scholar]
- [54].Missiroli S, Genovese I, Perrone M, Vezzani B, Vitto VAM, Giorgi C. The Role of Mitochondria in Inflammation: From Cancer to Neurodegenerative Disorders. J Clin Med 2020. [DOI] [PMC free article] [PubMed] [Google Scholar]
- [55].Moore KA, Kohno T, Karchewski LA, Scholz J, Baba H, Woolf CJ. Partial peripheral nerve injury promotes a selective loss of GABAergic inhibition in the superficial dorsal horn of the spinal cord. J Neurosci 2002. [DOI] [PMC free article] [PubMed] [Google Scholar]
- [56].Near J, Harris AD, Juchem C, Kreis R, Marjańska M, Öz G, Slotboom J, Wilson M, Gasparovic C. Preprocessing, analysis and quantification in single-voxel magnetic resonance spectroscopy: experts’ consensus recommendations. NMR Biomed 2020. [DOI] [PMC free article] [PubMed] [Google Scholar]
- [57].Nordengen K, Heuser C, Rinholm JE, Matalon R, Gundersen V. Localisation of N-acetylaspartate in oligodendrocytes/myelin. Brain Struct Funct 2015. [DOI] [PubMed] [Google Scholar]
- [58].De Novellis V, Siniscalco D, Galderisi U, Fuccio C, Nolano M, Santoro L, Cascino A, Roth KA, Rossi F, Maione S. Blockade of glutamate mGlu5 receptors in a rat model of neuropathic pain prevents early over-expression of pro-apoptotic genes and morphological changes in dorsal horn lamina II. Neuropharmacology 2004. [DOI] [PubMed] [Google Scholar]
- [59].Owen DR, Yeo AJ, Gunn RN, Song K, Wadsworth G, Lewis A, Rhodes C, Pulford DJ, Bennacef I, Parker CA, Stjean PL, Cardon LR, Mooser VE, Matthews PM, Rabiner EA, Rubio JP. An 18-kDa Translocator Protein (TSPO) polymorphism explains differences in binding affinity of the PET radioligand PBR28. J Cereb Blood Flow Metab 2012. [DOI] [PMC free article] [PubMed] [Google Scholar]
- [60].Parks EL, Geha PY, Baliki MN, Katz J, Schnitzer TJ, Apkarian AV. Brain activity for chronic knee osteoarthritis: Dissociating evoked pain from spontaneous pain. Eur J Pain 2011. [DOI] [PMC free article] [PubMed] [Google Scholar]
- [61].Pattany PM, Yezierski RP, Widerström-Noga EG, Bowen BC, Martinez-Arizala A, Garcia BR, Quencer RM. Proton magnetic resonance spectroscopy of the thalamus in patients with chronic neuropathic pain after spinal cord injury. Am J Neuroradiol 2002. [PMC free article] [PubMed] [Google Scholar]
- [62].Pekny M, Pekna M. Astrocyte reactivity and reactive astrogliosis: Costs and benefits. Physiol Rev 2014. [DOI] [PubMed] [Google Scholar]
- [63].Penny W, Friston K, Ashburner J, Kiebel S, Nichols T. Statistical Parametric Mapping: The Analysis of Functional Brain Images. 2007. p. [Google Scholar]
- [64].Philips T, Robberecht W. Neuroinflammation in amyotrophic lateral sclerosis: Role of glial activation in motor neuron disease. Lancet Neurol 2011. [DOI] [PubMed] [Google Scholar]
- [65].Quarantelli M MRI/MRS in neuroinflammation: methodology and applications. Clin Transl Imaging 2015. [DOI] [PMC free article] [PubMed] [Google Scholar]
- [66].Rae CD. A guide to the metabolic pathways and function of metabolites observed in human brain 1H magnetic resonance spectra. Neurochem Res 2014. [DOI] [PubMed] [Google Scholar]
- [67].Ransohoff RM. How neuroinflammation contributes to neurodegeneration. Science (80− ) 2016. [DOI] [PubMed] [Google Scholar]
- [68].Ratai EM, Alshikho MJ, Zürcher NR, Loggia ML, Cebulla CL, Cernasov P, Reynolds B, Fish J, Seth R, Babu S, Paganoni S, Hooker JM, Atassi N. Integrated imaging of [11C]-PBR28 PET, MR diffusion and magnetic resonance spectroscopy 1H-MRS in amyotrophic lateral sclerosis. NeuroImage Clin 2018. [DOI] [PMC free article] [PubMed] [Google Scholar]
- [69].Ratiney H, Coenradie Y, Cavassila S, Van Ormondt D, Graveron-Demilly D. Time-domain quantitation of 1H short echo-time signals: Background accommodation. Magn Reson Mater Physics, Biol Med 2004. [DOI] [PubMed] [Google Scholar]
- [70].Reckziegel D, Raschke F, Cottam WJ, Auer DP. Cingulate GABA levels inversely correlate with the intensity of ongoing chronic knee osteoarthritis pain. Mol Pain 2016. [DOI] [PMC free article] [PubMed] [Google Scholar]
- [71].Rizzo G, Tonon C, Testa C, Manners D, Vetrugno R, Pizza F, Marconi S, Malucelli E, Provini F, Plazzi G, Montagna P, Lodi R. Abnormal medial thalamic metabolism in patients with idiopathic restless legs syndrome. Brain 2012. [DOI] [PubMed] [Google Scholar]
- [72].Rodriguez-Raecke R, Niemeier A, Ihle K, Ruether W, May A. Brain gray matter decrease in chronic pain is the consequence and not the cause of pain. J Neurosci 2009. [DOI] [PMC free article] [PubMed] [Google Scholar]
- [73].Rodriguez-Raecke R, Niemeier A, Ihle K, Ruether W, May A. Structural Brain Changes in Chronic Pain Reflect Probably Neither Damage Nor Atrophy. PLoS One 2013. [DOI] [PMC free article] [PubMed] [Google Scholar]
- [74].Rojas S, Martín A, Arranz MJ, Pareto D, Purroy J, Verdaguer E, Llop J, Gómez V, Gispert JD, Millán O, Chamorro Á, Planas AM. Imaging brain inflammation with [11C]PK11195 by PET and induction of the peripheral-type benzodiazepine receptor after transient focal ischemia in rats. J Cereb Blood Flow Metab 2007. [DOI] [PubMed] [Google Scholar]
- [75].Rose J, Brian C, Woods J, Pappa A, Panayiotidis MI, Powers R, Franco R. Mitochondrial dysfunction in glial cells: Implications for neuronal homeostasis and survival. Toxicology 2017. [DOI] [PMC free article] [PubMed] [Google Scholar]
- [76].Rupprecht R, Papadopoulos V, Rammes G, Baghai TC, Fan J, Akula N, Groyer G, Adams D, Schumacher M. Translocator protein (18 kDa) (TSPO) as a therapeutic target for neurological and psychiatric disorders. Nat Rev Drug Discov 2010. [DOI] [PubMed] [Google Scholar]
- [77].Seminowicz DA, Wideman TH, Naso L, Hatami-Khoroushahi Z, Fallatah S, Ware MA, Jarzem P, Bushnell MC, Shir Y, Ouellet JA, Stone LS. Effective treatment of chronic low back pain in humans reverses abnormal brain anatomy and function. J Neurosci 2011. [DOI] [PMC free article] [PubMed] [Google Scholar]
- [78].Shigemura T, Kishida S, Eguchi Y, Ohtori S, Nakamura J, Kojima M, Masuda Y, Takahashi K. Proton magnetic resonance spectroscopy of the thalamus in patients with osteoarthritis of the hip. Bone Joint Res 2012. [DOI] [PMC free article] [PubMed] [Google Scholar]
- [79].Sorensen L, Siddall PJ, Trenell MI, Yue DK. Differences in metabolites in pain- processing brain regions in patients with diabetes and painful neuropathy. Diabetes Care 2008. [DOI] [PubMed] [Google Scholar]
- [80].Stefan D, Cesare F Di, Andrasescu A, Popa E, Lazariev A, Vescovo E, Strbak O, Williams S, Starcuk Z, Cabanas M, Van Ormondt D, Graveron-Demilly D. Quantitation of magnetic resonance spectroscopy signals: The jMRUI software package. Meas Sci Technol 2009. [Google Scholar]
- [81].De Stefano N, Matthews PM, Ford B, Genge A, Karpati G, Arnold DL. Short-term dichloroacetate treatment improves indices of cerebral metabolism in patients with mitochondrial disorders. Neurology 1995. [DOI] [PubMed] [Google Scholar]
- [82].Torrado-Carvajal A Tosch N Albrecht DH Chang K Akeju O Kim M Edwards RR Zhang Y Hooker JM Duggento A Kalpathy-Cramer J Napadow V Loggia M Thalamic neuroinflammation as a reproducible and discriminating signature for chronic low back pain. Pain 2020. [DOI] [PMC free article] [PubMed] [Google Scholar]
- [83].Träber F, Block W, Lamerichs R, Gieseke J, Schild HH. 1H Metabolite Relaxation Times at 3.0 Tesla: Measurements of T1 and T2 Values in Normal Brain and Determination of Regional Differences in Transverse Relaxation. J Magn Reson Imaging 2004. [DOI] [PubMed] [Google Scholar]
- [84].Tsuda M, Shigemoto-Mogami Y, Koizumi S, Mizokoshi A, Kohsaka S, Salter MW, Inoue K. P2X4 receptors induced in spinal microglia gate tactile allodynia after nerve injury. Nature 2003. [DOI] [PubMed] [Google Scholar]
- [85].Venneti S, Wang G, Wiley CA. Activated macrophages in HIV encephalitis and a macaque model show increased [3H](R)-PK11195 binding in a PI3-kinase-dependent manner. Neurosci Lett 2007. [DOI] [PMC free article] [PubMed] [Google Scholar]
- [86].Vowinckel E, Reutens D, Becher B, Verge G, Evans A, Owens T, Antel JP. PK11195 binding to the peripheral benzodiazepine receptor as a marker of microgila activation in multiple sclerosis and experimental autoimmune encephalomyelitis. J Neurosci Res 1997. [DOI] [PubMed] [Google Scholar]
- [87].Wansapura JP, Holland SK, Dunn RS, Ball WS. NMR relaxation times in the human brain at 3.0 Tesla. J Magn Reson Imaging 1999. [DOI] [PubMed] [Google Scholar]
- [88].Watkins LR, Hutchinson MR, Ledeboer A, Wieseler-Frank J, Milligan ED, Maier SF. Glia as the “bad guys”: Implications for improving clinical pain control and the clinical utility of opioids. Brain Behav Immun 2007. [DOI] [PMC free article] [PubMed] [Google Scholar]
- [89].Weerasekera A, Peeters R, Sima D, Dresselaers T, Sunaert S, De Vocht J, Claeys K, Van Huffel S, Van Damme P, Himmelreich U. Motor cortex metabolite alterations in amyotrophic lateral sclerosis assessed in vivo using edited and non-edited magnetic resonance spectroscopy. Brain Res 2019. [DOI] [PubMed] [Google Scholar]
- [90].Whiteside GT, Munglani R. Cell death in the superficial dorsal horn in a model of neuropathic pain. J Neurosci Res 2001. [DOI] [PubMed] [Google Scholar]
- [91].Widerström-Noga E, Pattany PM, Cruz-Almeida Y, Felix ER, Perez S, Cardenas DD, Martinez-Arizala A. Metabolite concentrations in the anterior cingulate cortex predict high neuropathic pain impact after spinal cord injury. Pain 2013. [DOI] [PMC free article] [PubMed] [Google Scholar]
- [92].Wylde V, Dieppe P, Hewlett S, Learmonth ID. Total knee replacement: Is it really an effective procedure for all? Knee 2007. [DOI] [PubMed] [Google Scholar]
Associated Data
This section collects any data citations, data availability statements, or supplementary materials included in this article.
Supplementary Materials
Supplementary Figure S1: Correlations of age and WOMAC scores
Correlation between age and (A) pain (r=−0.42, p=0.015) (B) stiffness (r=−0.42, p=0.015) and (C) physical disability (r=−0.47, p=0.005), as measured with WOMAC score, in KOA patients (n=33). The resulting slope in linear fit is represented by the dashed-black line.
Supplementary Figure S2: Neurometabolic levels in the left thalamus of KOA and healthy controls
(A) Neurometabolic ratios and (B) Water-referenced concentrations of age-gender matched (n=11) KOA and healthy controls. Statistical significances between the two groups and mean concentrations within each group are shown. Concentration values are given as mean ± SD; ***p<0.001, ****p<0.0001. Abbreviation: NAA, N-acetylaspartate; mIns, myo-inositol; cr, creatine;
Supplementary Figure S3:
Correlation between pre and post changes in mIns and NAA (r=0.61, p=0.026).